1. Introduction
Target localization assumes a pivotal role across diverse domains, including but not limited to elderly care, intrusion detection, and smart home applications. Conventional methodologies for target localization predominantly entail contact-based wearable sensor approaches [
1] or computer vision-based techniques [
2]. However, wearable sensors pose considerable limitations in their utility and are often infeasible in certain scenarios, such as intrusion detection. Moreover, their operation is often intricate, leading to suboptimal user experiences. Conversely, computer vision-based methods address the issue of device-wearing requirements but bring forth challenges pertaining to personal privacy, line-of-sight obstructions, and substantial construction costs. In response to these challenges, researchers have introduced an alternative paradigm grounded in radio frequency (RF) signals, offering long-range, non-contact target localization that is notably more convenient and comfortable.
The utilization of RF signals as a means of target localization has emerged as a focal point of contemporary research due to its cost-effectiveness and the absence of device-wearing prerequisites. The fundamental principle involves a transmitter emitting RF signals toward a moving target, which then reflects the signals. These reflected signals are subsequently received, analyzed, and processed by a receiver equipped with various signal processing algorithms, thereby facilitating the extraction of information regarding the moving target. In recent scholarly endeavors, diverse RF signal types, such as WiFi [
3,
4], frequency-modulated continuous waves (FMCWs) [
5], and RFID [
6], have been explored. However, these signal types still face challenges such as a limited sensing range and suboptimal penetration.
In recent years, LoRa (Long-Range) signals have attracted widespread attention due to their long propagation distance and strong penetration. Originally designed to facilitate remote communication between IoT (Internet of Things) devices, LoRa offers a communication range several orders of magnitude greater than that of WiFi. The linchpin behind this remarkable long-range transmission capability is chirp spread spectrum (CSS) modulation and its consequential high coding gain. Current research endeavors about LoRa have primarily been conducted to leverage its telecommunications capabilities for IoT applications, with comparatively fewer investigations into wireless sensing utilizing LoRa signals. Moreover, researchers have predominantly focused on establishing quantitative mathematical relationships between phase changes in LoRa signals and the total distance traversed by a target in a fixed direction, the utilization of phase magnitude changes in the signal ratio for estimating target distances from transceiver pairs, and the application of beamforming techniques to extend sensing ranges. However, there remains a dearth of research dedicated to indoor and outdoor target localization.
To address the issue of device-free localization and tracking, two main categories of methods can be identified: fingerprint-based and model-based methods. Fingerprint-based methods [
7,
8] involve recording network information and signal strength at different locations as fingerprint data. The current fingerprint information of the target is then compared with a database to determine the device’s location. However, this method requires extensive prior calibration and training, which is time-consuming and context dependent. Furthermore, a large amount of fingerprint data and neural network training are needed during the application. Updating the fingerprint database to accommodate changes in the application environment also takes a significant amount of time. Additionally, the performance of fingerprint-based methods deteriorates when the target is in motion [
9]. The Doppler shift caused by target movement introduces instability in the feature-position relationship, making it challenging to achieve accurate localization. Some existing methods attempt to address the Doppler shift by deploying high-density networks [
10,
11] to transmit customized signals. However, these approaches limit the scalability of real-life deployment. On the other hand, model-based approaches establish a model that captures the relationship between the target’s position or motion trajectory and the wireless measurements received by the receiver. This model is then used to estimate the target’s position and trajectory. WiFi localization systems could achieve decimeter-level localization accuracy [
12,
13] which take the model based approach: estimating the location of mobile devices by computing the angle-of-arrival (AoA), time-of-flight (ToF) and Doppler frequency shift (DFS) of the received signal. The WideSee system [
14], utilizing a pair of transceiver antennas, achieved target localization within a 6 m × 8 m designated area using LoRa signals with a median positioning error of 0.52 m. Nonetheless, ongoing research in this domain consists of various challenges. (1) In the context of LoRa-based device-free tracking models, the phase change in the received signal ratio is frequently employed to calculate the target’s motion distance. However, this method does not provide precise target positioning, the accuracy of which depends on the position of the target relative to the transceiver. (2) Device-free tracking models for other signal types (e.g., WiFi) typically rely on channel state information (CSI) phase data, which are not available in the case of LoRa signals.
In this paper, these challenges were addressed, and the following key contributions were developed:
- (1)
The algorithm accurately estimates the target’s position by analyzing phase change data from LoRa signals and incorporating signal amplitude characteristics. Emphasizing the extraction of direction-related details from signal amplitudes and utilizing dynamic path change information enhances localization precision within a specified area. Through quantitative analysis of phase changes and target motion, this approach effectively demonstrates the utility of LoRa signals for precise and efficient target localization in wireless sensing applications.
- (2)
In this work, the target localization method is modeled by utilizing signal information, without any prior measurements within the detection area. By integrating the multiple signal classification (MUSIC) algorithm with phase change information from LoRa signals, the localization accuracy is determined with an average error of 48.5 cm in an outdoor space measuring 6 m × 12 m.
The subsequent sections of this paper are organized as follows: in
Section 2, prior works related to LoRa-based wireless sensing and signal amplitude-based tracking for device-free target localization are examined; in
Section 3, LoRa-related knowledge is expounded and the data acquisition module utilized in our experiments is detailed; in
Section 4, an in-depth exposition of the LoRa signal amplitude-based localization method employed in this study is provided; in
Section 5, the experimental validation of the proposed algorithm’s accuracy and robustness is systematically presented; and, finally, in
Section 6, we engage in discussions regarding the limitations of our methodology and propose future research directions.
2. Related Work
LoRa-based communication and sensing. Current research in the domain of LoRa predominantly revolves around harnessing its remote communication capabilities for IoT applications. For instance, Lin et al. [
15] utilized LoRa links to transmit human activity data monitored by sensors. Petäjäjärvi et al. [
16] employed LoRaMote, affixed to an individual’s arm with a sensor-equipped band (including temperature and pressure sensors), for monitoring the health of human subjects. Nordin et al. [
17] investigated a rural hydrological control system in Lake Chini, Malaysia, emphasizing the reliability of the central sensor in LoRa and 2G networks and uncovering performance constraints in low-data sensor networks, especially in rural areas. Philip et al. [
18] employed LoRa for data collection from industrial sensors on a shop floor. It is essential to note that in these endeavors, LoRa’s remote communication capabilities were primarily leveraged. Thus, its potential in wireless sensing applications was overlooked.
Kim et al. [
19] analyzed the feasibility of LoRa for indoor localization and confirmed its superior stability compared to WiFi and Bluetooth low energy (BLE) localization, relying on received signal strength indicator (RSSI) measurements. However, despite the effectiveness of RSSI measurements in localization, they inherently provide coarse-grained information and are inadequate for sensing fine-grained human activities. Nandakumar et al. [
20] developed a multi-band backscatter system for localization using sub-centimeter-sized devices. In contrast, our research’s overarching goal is to explore LoRa’s passive sensing capability by harnessing LoRa hardware for wireless sensing, negating the necessity for dedicated sensors.
LoRa-based contactless sensing. Zhang et al. [
21] extended respiratory sensing up to 25 m using a signal ratio scheme, addressing symbol frequency offset (SFO) and carrier frequency offset (CFO) effects for long-range through-wall human sensing. They explored the intricate relationship between target movement, direction, and phase changes, utilizing phase magnitude in the signal ratio to infer target movement distance and direction. Xie et al. [
22] introduced Sen-fence, a LoRa-based contactless sensing system with a 50 m breath sensing range. Sen-fence employs a virtual fence concept to control the sensing area, mitigating interference concerns. Zhang et al. [
23] proposed a receiver-side LoRa beamforming method for remote multi-target sensing, achieving up to five targets simultaneously with high accuracy. Xie et al. [
24] demonstrated the feasibility of LoRa signal-based sensing beyond 100 m, employing fine signal processing and time-domain beamforming to amplify signal variations. Chen et al. [
14] introduced the WideSee system, deploying LoRa devices on UAVs for wide-area wireless sensing within buildings. WideSee capitalizes on LoRa signal characteristics, enhancing wall penetration and sensing range. The system uses a drone-borne transceiver to improve sensing coverage, achieving a median positioning error of 52 cm in indoor, device-free tracking conditions. However, WideSee’s tracking method based on LoRa signal amplitude faces challenges in high positioning error and computational complexity, potentially limiting its real-time capabilities in practical scenarios.
Other wireless sensing techniques. Various wireless technologies are extensively utilized in target positioning applications, encompassing millimeter-wave radar [
25], Doppler radar [
26], ultra-wideband (UWB) radar [
27,
28], FMCW radar [
29,
30,
31], conventional WiFi [
8,
32,
33,
34], radio-frequency identification (RFID) [
35], and Zigbee [
36]. WiFi-based device-free localization and tracking is the most popular one and has many applications in indoor and outdoor scenes. However, challenges arise in the application of signals like WiFi for contactless target localization and tracking. These challenges encompass densely deployed sensing devices, limited sensing ranges, and considerations related to high power. CrossTrack [
4] employs two to four sets of receiving antennas along with a single transmitting antenna to achieve precise tracking, yielding median errors of 0.61 m (2 Rxs), 0.41 m (3 Rxs), and 0.38 m (4 Rxs). WiDFS [
11] has introduced a WiFi tracking system utilizing three receiving antennas capable of real-time tracking of moving individuals with sub-meter location accuracy. The system achieves real-time tracking, demonstrating a median position error of 72.32 cm, even in environments characterized by multipath-rich conditions.
In summary, device-free target positioning tracking, grounded in signal analysis, relies on the principle that wireless signals, upon reflecting from a target, undergo changes indicative of the target’s movement. Subsequent analysis of these signal variations yields crucial positional information about the target. Notably, LoRa exhibits distinctive capabilities, including extended propagation distances and wall-penetration abilities not found in other signals. Consequently, LoRa finds unique applicability in real-world emergency scenarios, such as disaster relief [
37] and intrusion detection and localization [
38]. It is essential to underscore that the field of LoRa-based device-free localization and tracking remains relatively unexplored, marked by challenges pertaining to accuracy and practicality. Therefore, research dedicated to the wireless sensing aspects of LoRa signals carries significant practical value and holds strategic importance. To tackle these challenges, this article focuses on enhancing the accuracy and practicality of device-free tracking using LoRa while addressing the issue of densely placed sensing devices. Our aim is to achieve precise positioning within a broader sensing range of 6 m × 12 m.
Table 1 illustrates the distinction between our algorithm and other state-of-the-art algorithms. The initial category encompasses algorithms reliant on WiFi signals, namely Algorithm [
3], CrossTrack [
4], Witraj [
9], Indotrack [
10], WiDFS [
11], DeFi [
12] and WiDar2.0 [
39]. These algorithms are designed for indoor and outdoor positioning within sensing areas spanning dimensions from 2 m × 4 m to 7 m × 7 m. The number of receivers deployed varies between one and four, resulting in localization errors ranging from 0.26 m to 0.75 m.
WiTrack2 [
5] leverages FMCW technology, demonstrating remarkable precision in a 5 m × 7 m area with a solitary receiver and an impressively low error of 0.17 m.
Conclusively, WideSee [
14] opts for LoRa technology within a 6 m × 8 m area, showcasing an error of 0.52 m using a lone receiver. It can be observed that our algorithm achieves decimeter-level positioning accuracy within a large perceptual range, comparable to state-of-the-art techniques. Importantly, our algorithm requires only a single receiving antenna and accomplishes target localization on one side of the target area.
4. Positioning Algorithms Based on LoRa Signal Amplitudes
4.1. Algorithm Overview
Figure 3 provides an overview of the LoRa signal-based localization algorithm, which comprises the following key modules:
Preprocessing of Extracted Target Motion Signals: In this initial module, the extracted motion signals undergo preprocessing to eliminate the effects of static multipath and direct signals. This is achieved by removing the time-averaged values from the signals, thereby enhancing the sensitivity to dynamic variations.
Signal Ratio Generation and Dynamic Path Change Estimation: The IQ signals received by the antennas are utilized to create signal ratios through a process of dividing the signals from two antennas. These signal ratios are instrumental in estimating the dynamic path changes resulting from target motion. The phase difference of the signal ratio is calculated to determine the extent of dynamic path change, both before and after the target’s motion.
MUSIC Algorithm for Angle Estimation: The MUSIC algorithm is employed to calculate the angles associated with the LoRa signal during target motion. This involves computing the covariance matrix of the signal, followed by the decomposition of its eigenvectors to extract the noise subspace. The spatial spectrum of the noise subspace is then analyzed to determine the angles corresponding to the target’s motion before and after.
Localization Based on the Angle and Dynamic Path Change: This module focuses on deriving potential target localization based on the angle information and the calculated dynamic path change. Within the maximum feasible distance covered by the moving target, the algorithm determines the best-matching endpoints by considering dynamic vector changes at each initial position.
Fast Fourier Transform (FFT) and Frequency Analysis: The amplitude of the extracted target motion signal is subjected to a fast Fourier transform, followed by peak amplitude detection. The resulting frequencies are correlated with the angle and velocity of the moving target. These computed results are subsequently employed to refine and corroborate the best estimates for target localization.
In essence, the algorithm integrates these modules to achieve accurate and reliable target localization based on LoRa signal characteristics and motion-induced changes.
4.2. Data Preprocessing
Subtracting the mean signal value is an efficient technique that involves mitigating DC offset or static clutter effects. This is achieved by calculating the average signal value and subtracting it from the original signal. Since the target’s velocity can be reasonably assumed to remain constant over short time intervals, its movement exhibits periodicity within these brief periods. Consequently, the data also manifest periodic characteristics during these intervals. In contrast, multipath reflections originating from static objects and the surrounding environment exhibit minimal or irregular motion. DC signals inherently lack phase information, and the data distribution within their corresponding distance units lacks periodicity.
In this research, we adopt the average cancellation method to eliminate the impact of static vectors and DC offsets by subtracting the average value at each antenna, essentially at each row within the matrix. This calculation is expressed by Equation (4) as follows:
where
represents the data in the pth row and qth column of the matrix, with 1 ≤ q ≤ M, and mean(p) denotes the mean value of the data in the pth row of the matrix. It is noteworthy that static vectors can be considered invariant over the short time span relevant to our localization process.
However, to render the demeaned signal ratio data more conducive for phase extraction and to reveal the circular patterns, additional smoothing is essential. In our study, we applied the Savitzky–Golay filter for this purpose. The Savitzky–Golay smoothing technique leverages a linear least squares method to fit a continuous subset of data points using a low-order polynomial function. This smoothing operation enhances the clarity of the extracted phases and facilitates subsequent analysis.
4.3. Phase Extraction
In our study, we employed the tangent vector method, as outlined in reference [
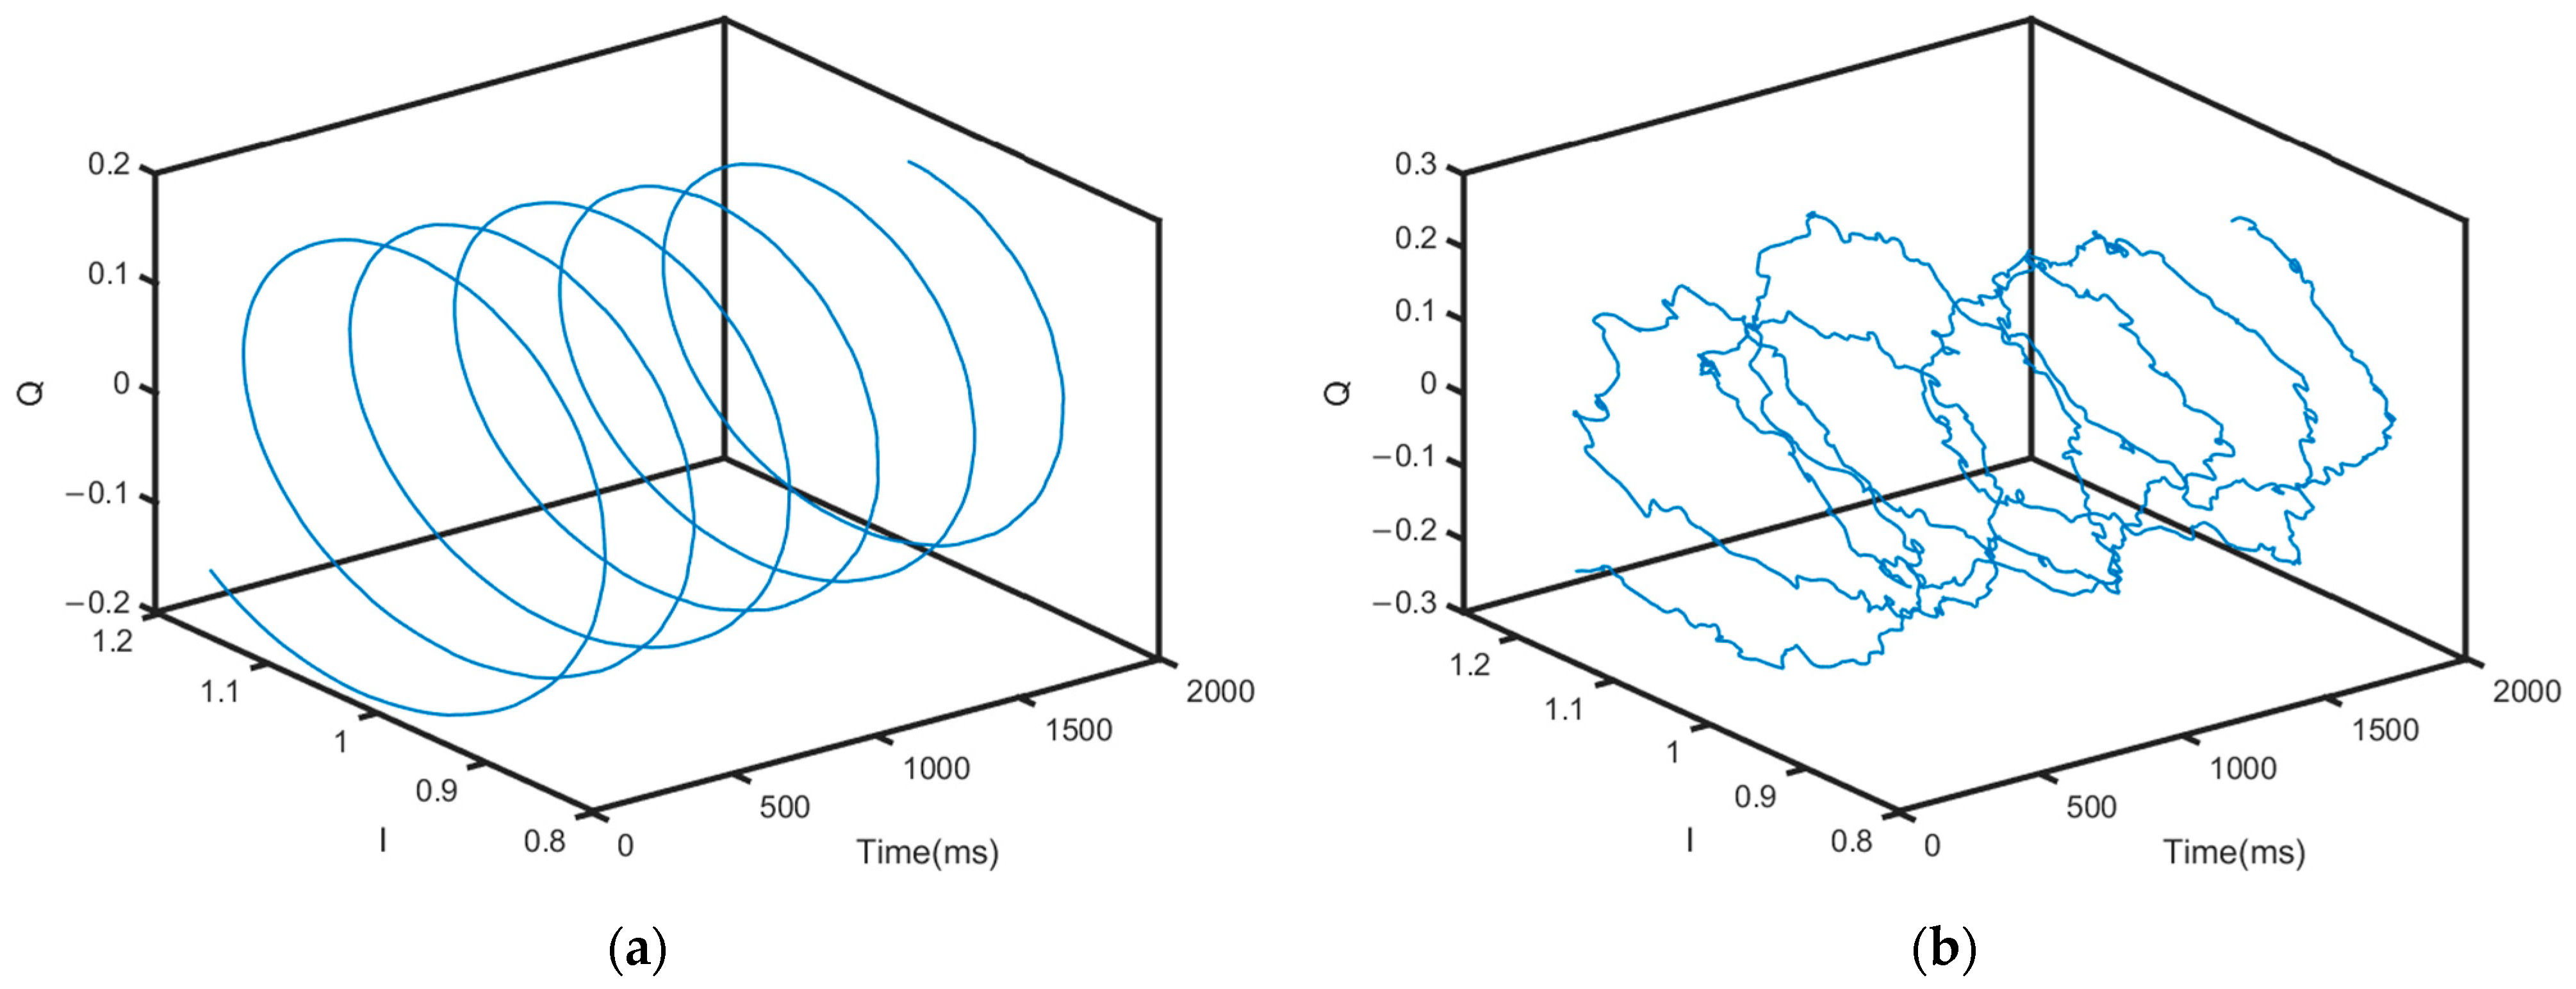
21], to calculate the variation in the signal phase induced by human walking. During practical experimentation, the signal ratio changes because different parts of the human body reflect signals as it moves. Moreover, the mobile body obstructs the static path of the signal reflection from stationary objects. As a result, the observed trajectory of the signal ratio changes does not conform to a concentric circle; instead, it exhibits a non-concentric circular pattern.
Figure 4 illustrates the comparison between the theoretical and experimental trajectories of the signal ratio changes. The center of this trajectory is notably distant from the origin and deviates from the theoretical model, consequently leading to higher measurement errors.
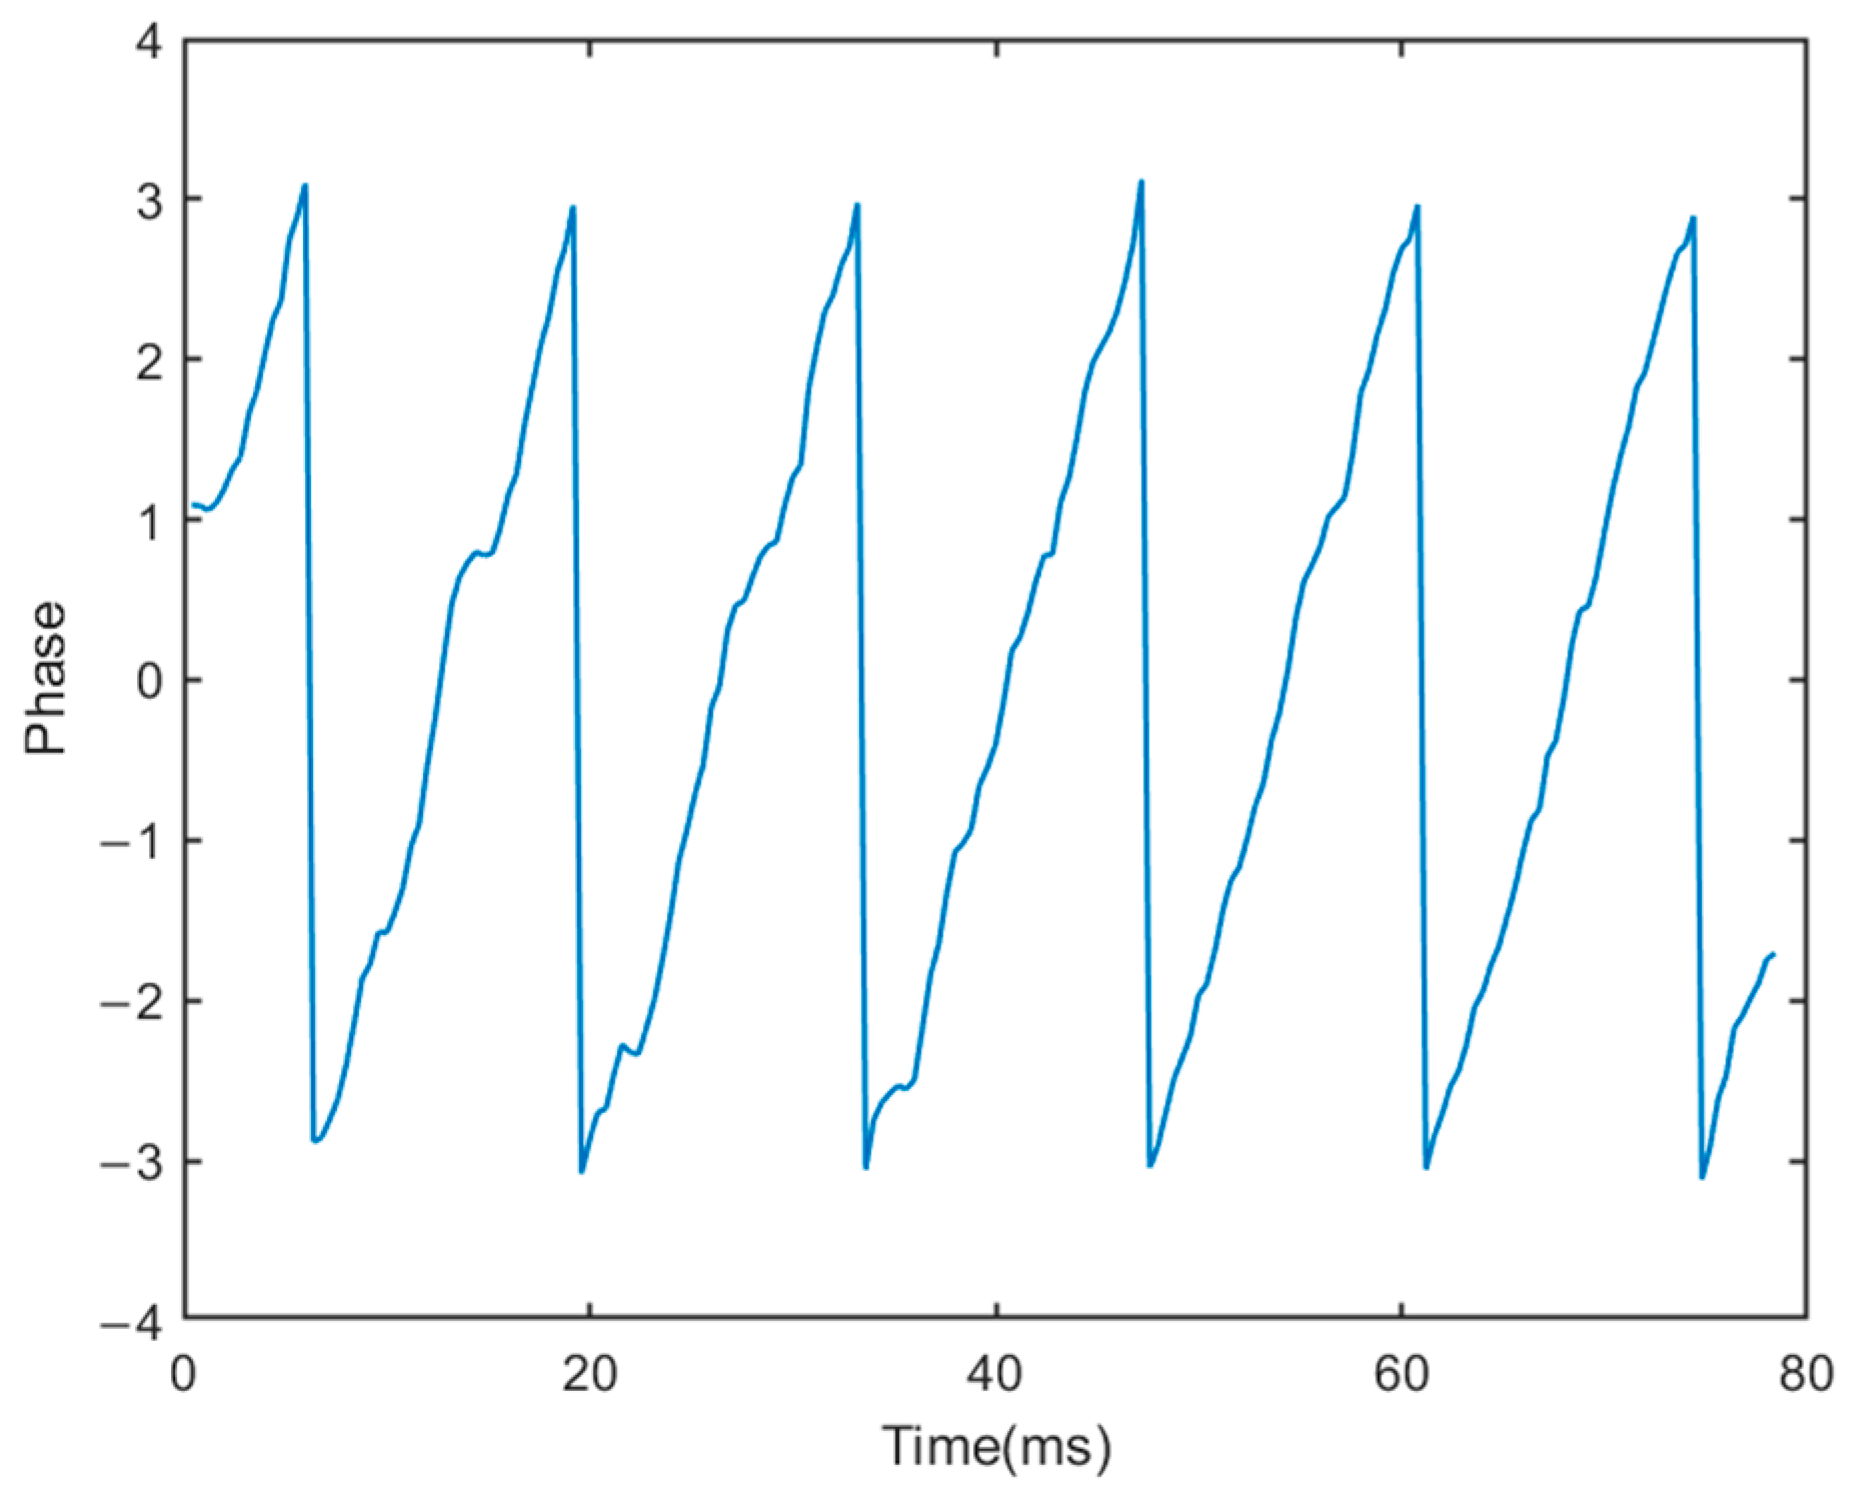
To address this challenge, we dissected the trajectories of the signal ratio changes into two distinct arcs—one corresponding to the head and the other to the tail—as well as several complete circles. Subsequently, we conducted a calibration process to rectify the phase changes along each circle by subtracting the center of the respective circle. This calibration procedure serves to align the experimental data more closely with the theoretical model, thus minimizing the disparity between them. Subsequently, we proceeded to compute the phase difference between two tangent vectors that are separated by a defined distance. This calculation allows us to derive the associated phase change corresponding to the dynamic components, as depicted in
Figure 5.
4.4. MUSIC Algorithm
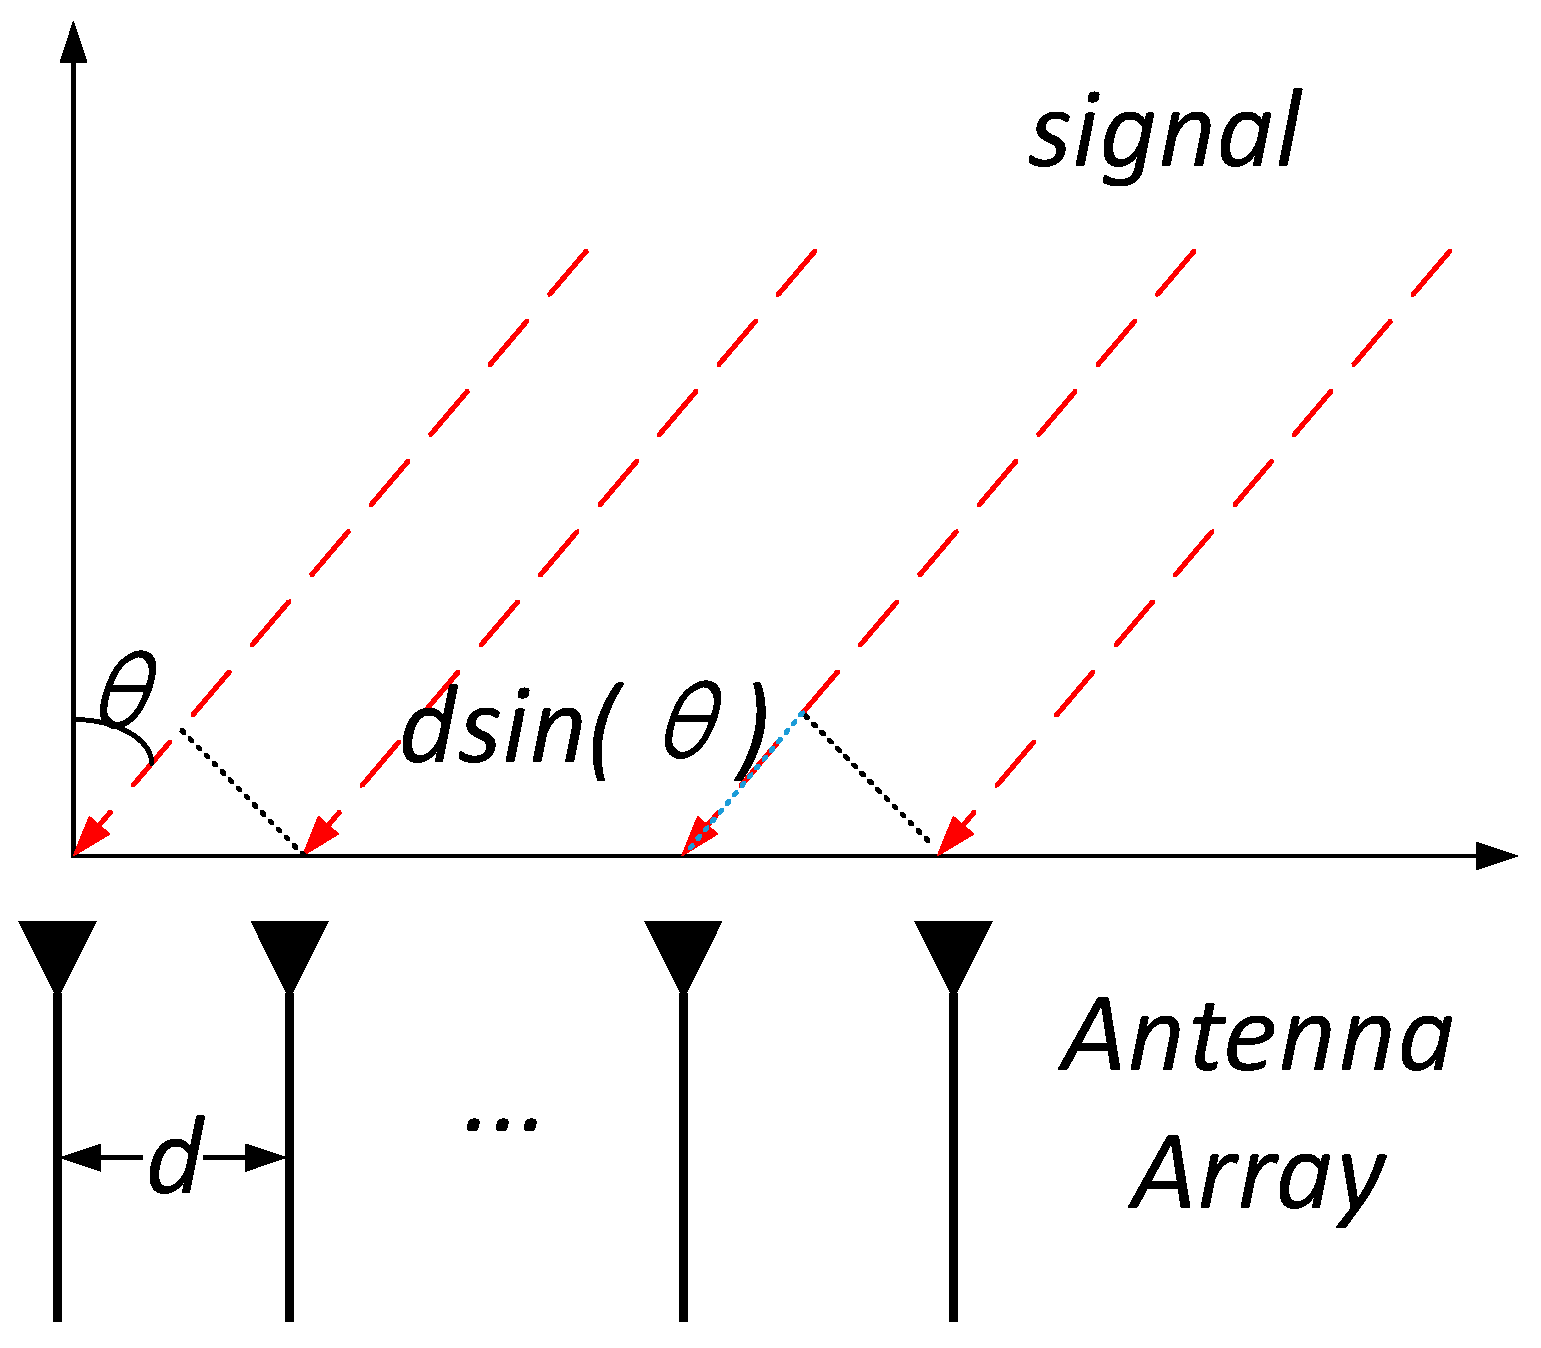
In the context of a single-incidence array, we consider a linear receiving array comprising M antennas positioned at the receiver. The incident signal arrives at the antenna array with an angle-of-arrival denoted as
, as illustrated in
Figure 6. The separation between the antennas, denoted as d, is set to half the wavelength of the incoming signal. It is important to note that the signal has distinct propagation path lengths at different antennas due to its arrival angle. Since the propagation path is significantly longer than the antenna spacing (k >> d), the path difference between neighbouring antennas can be expressed as k.
Consequently, a phase difference of k is introduced at adjacent antennas, where f represents the signal frequency and c denotes the speed of light. We can formulate the introduced phase difference as a function of the AoA:
The phase difference at the antenna array is expressed as:
where
(
) is referred to as the steering vector. If the signal received by the first antenna is s(t), then the signal vector received by the antenna array is:
where
N(t) is the noise vector. In the case of only one incident signal, the target angle-of-arrival can be easily obtained by measuring the phase difference between the antennas.
When n incident signals arrive at the antenna array, the signal received by each antenna is a superposition of all the incident signals. According to Equation (7), the received signal vector is expressed as
where
θi is the AoA of the i-th incident signal and
Si is the i-th incident signal at the first antenna. We can determine the matrix of the received signal data
X(t) in the time domain.
The fundamental concept of the MUSIC algorithm involves the eigenstructure analysis of an M × M correlation matrix
Rx derived from the received signals at M antennas. From Equation (8), we express
Rx as:
where H represents the conjugate transpose. Subsequently, we performed eigenvalue decomposition on the spatial covariance matrix
Rx. This decomposition yields eigenvalues and eigenvectors. The eigenvectors can be categorized into two distinct subspaces: the signal subspace and the noise subspace. To facilitate further analysis, we arranged the eigenvectors in descending order based on their corresponding eigenvalues. The signal subspace is then composed of the first n eigenvectors, where n corresponds to the number of targets for which we intend to predict the AoA. The remaining eigenvectors constitute the noise subspace
EN.
Since the signal and noise subspaces are orthogonal, we can denote the spatial spectral function as follows:
In this context, the target’s arrival angle corresponds to the peak value within the computed spatial spectrum.
Our approach in this paper addresses the localization problem under the assumption that the target undergoes smooth motion over a short distance with a consistent velocity during a brief time interval. Specifically, we executed multiple successive estimations of the target’s position employing a sliding window of size w. Each estimation process necessitates the collection of samples within a time window of size τ. In our algorithm, we empirically configured w and τ to be 0.5 s and 1 s, respectively. Additionally, we employed the MUSIC algorithm to extract the angle-of-arrival information both before and after the target’s motion in this algorithm.
4.5. Preliminary Screening Locations
The determination of the target movement range involves the consideration of both the front and rear arrival angles, as well as the walking speed. The extension line of the arrival angle before and after the target’s movement enables the identification of all conceivable starting and ending points. Through a systematic comparison with dynamic path variations, the optimal concluding point among all conceivable starting points can be ascertained, thus yielding the preliminary positioning outcome, as illustrated in
Figure 7. The process involves several key steps:
Determination of the Possible Target Positions: Initially, we extended a line from the potential target positions both before and after the target’s movement along the angle-of-arrival at the receiving array. This action delineates the region encompassing the feasible target positions.
Calculation of the Post-Motion Positions: Starting from the pre-motion position of the target and taking into account the human walking speed, we computed all possible post-motion positions within this defined region. Additionally, we calculated the corresponding dynamic path change from the initial position to describe the trajectory shift of the target before and after its motion.
Comparative Analysis: To identify the most likely endpoint among all the starting point, we compared the actual dynamic path change with the dynamic path change calculated for each possible starting point. The closest point to the actual path change is determined as the endpoint for that particular starting point. This iterative process is repeated for all initial points.
In summary, determining the target movement range involves taking into account both front and rear arrival angles, as well as the walking speed. Extending arrival angles before and after the target’s movement facilitates the identification of conceivable start and end points. A systematic comparison with dynamic path variations leads to the determination of the optimal concluding point among all conceivable starting points, resulting in the preliminary positioning outcome. The computational complexity of the preliminary screening locations algorithm is O(N2).
4.6. Matching Optimal Positioning Based on the Magnitude Information
The target information derived from extracting the direction-related information in the signal amplitude matches the optimal positioning.
The specific steps are as follows. The autocorrelation of the extracted amplitude of the target motion signal is subjected to a fast Fourier transform followed by peak amplitude detection. At the m-th receiving antenna (S(m)), signals are received from a total of K different sources. Then, the signal received from the k-th source at moment t can be expressed as follows:
where α
t,k is the amplitude of the signal and µ
k is the phase of the signal at the initial moment (i.e., t = 0). Then, the signal received by the m-th receiving antenna at moment t is a superposition of k signals, which can be expressed as follows:
We denoted R(τ) as the autocorrelation of the amplitude of the received signal at delay τ. Then, R(τ) can be expressed as follows:
where C
A is a constant term and R(τ) consists of K(K − 1)/2 harmonics. The frequency of each harmonic is related to the cosine of the AoA of the two sources (i.e.,
k,
j, k = 1, 2..., K, j = 1, 2..., K).
The frequency, denoted as , can be determined by conducting a fast Fourier transform on the autocorrelation of the amplitude signal, followed by the detection of peak amplitudes. This computed frequency is inherently linked to both the angle and velocity of the moving target.
During a brief period of target motion, it can be assumed that there is no change in the direction of the target’s motion. To account for this, the algorithm constructs velocity vectors for the target both before and after its motion, considering all possible initial points. Subsequently, the algorithm calculates the angle between each velocity vector and the transceiver’s position. The calculated angles are then compared with the derived frequency value. The goal is to identify the velocity vectors that align most closely with the observed frequency. This process leads to the determination of the most compatible estimated target positioning, ultimately yielding the final result for target localization.
5. Evaluation
To assess the robustness and accuracy of the algorithm, we conducted a series of experiments designed to evaluate its performance under various conditions. These experiments encompassed a range of factors, including different target motion speeds, varying LoS distances, diverse human targets, both indoor and outdoor environments, and different motion directions. By subjecting the algorithm to these varied scenarios, we aimed to thoroughly evaluate its performance and validate its accuracy across a spectrum of real-world conditions. In the ensuing experiments, we employ a target movement distance of 1 m to validate the proposed algorithm. In more pragmatic application scenarios, the segmentation of walking segments may be employed as a strategy to address target movement positioning over longer distances.
5.1. Comparison with the State-of-the-Art Method
In this section, we present a comparative analysis of our algorithm with three existing WiFi and LoRa-based location tracking systems: the WideSee system [
14], the WiDar2 system [
39], and the WiTraj system [
9]. To conduct a thorough comparison, we conducted experiments involving a straight line walk of 1 m at various locations on an outdoor 6 m × 12 m open platform. The tracking error was calculated using cylindrical error analysis, with a person being considered a cylinder with a radius of 0.25 m. The minimum distance between the estimated position and the surface of the cylinder was utilized as the tracking error for that position. We compared the algorithmic errors of the above three location tracking systems with the errors from our proposed algorithm, and subsequently compared the tracking accuracy of the three systems.
In the WiTraj system, the algorithm leverages spatial and temporal constraints to derive probabilistic estimates of the starting position and trajectory. Since subsequent human positions and velocities can be determined based on current positions and velocities, the confidence value for the entire trajectory at the starting position is computed by comparing the sum of confidence values for all positions along the trajectory to obtain the final initial localization. The time complexity of the WiTraj method can be considered as O(N), where N represents the duration of the CSI data being processed.
On the other hand, the WiDar2 system constructs a unified model that considers angle-of-arrival, time-of-flight, and Doppler shifts collectively, complemented by the development of an efficient algorithm for their joint estimation. WiDar2 introduces a sophisticated pipeline to transform erroneous raw parameters into precise locations. This pipeline initially identifies parameters corresponding to reflections of interest, subsequently refining range estimates, and ultimately producing accurate target locations. The time complexity of path matching can be O(P × N), where P is the number of potential paths to consider and N is the number of CSI measurements.
In contrast, the WideSee system constructs four sets of nonlinear equations that vary continuously over a short period of time. This is achieved by establishing the relationship between the motion speed and the angle between the target and the transceiver. The system then employs particle swarms and a global search to obtain globally optimal solutions for target localization. The computational complexity of the search algorithm is O(N × M), where N is the dimension of the particle swarm and M is the number of iterations.
The experimental comparison results are summarized in
Table 2, illustrating that our algorithm excels in short-range mobile measurement localization on an open platform of 6 m × 12 m, demonstrating an average error of 48.5 cm.
5.2. Impact of Different Environments
To assess the robustness of our algorithm across various environmental conditions, we conducted evaluations in two real-world settings: an outdoor open platform and an indoor corridor. The indoor setting consisted of a 3 m × 6 m section of a corridor, while the outdoor scenario featured a 3 m × 6 m open platform. We conducted a total of 120 experiments at varying distances within two distinct experimental environments. In the indoor environment, the presence of walls, ceilings, and columns introduced more complex multipath effects compared to the multipath effects of the outdoor environment, which were relatively minimal. We systematically assessed how these different environmental conditions affected the accuracy of our algorithm.
Figure 8 displays the cumulative distribution function (CDF) of target localization errors in these distinct environments. Notably, our algorithm exhibited superior tracking accuracy in outdoor environments due to its simpler multipath reflections. In the outdoor setting, the median error was 0.45 m, with an average error of 0.46 m. In contrast, the indoor environment resulted in a median localization error of 0.51 m, with an average error of 0.53 m.
5.3. Impact of the Walking Speed
We conducted an assessment to investigate the impact of various target speeds on the algorithm’s performance. Within the measurement area, 36 markers were strategically positioned, with each marker serving as the ground truth for the experimental scene. The test procedure involved the tester walking a 1 m distance to each marker at various speeds, recording data five times at each location. Participants were instructed to walk at three distinct speeds: slow (below 1 m/s), which corresponds to a leisurely stroll; normal (1–1.5 m/s), roughly equivalent to a typical outdoor walking speed; and fast (1.5–3 m/s), near a brisk walking pace. These participants were tasked with walking a 1 m distance at different positions on a 6 m × 12 m open platform at these different speeds.
Figure 9 illustrates the results obtained at varying walking speeds. Remarkably, the algorithm consistently achieved high localization accuracy across the different walking speeds. This demonstrates the algorithm’s robustness and its ability to accurately localize targets regardless of their speed.
5.4. Impact of the Transmitter–Receiver Distance
To assess the impact of the transceiver spacing on the algorithm’s accuracy, we conducted experiments in which we systematically varied the spacing between transceivers in 1 m increments, ranging from 1 to 6 m. The 6 m spacing corresponds to the length of the experimental scene. Data were collected for each spacing configuration, and a comprehensive analysis was performed.
Figure 10 illustrates the relationship between the accuracy of the algorithm and the distance between transceivers. The results clearly demonstrate that the distance between transceivers does indeed affect the accuracy of the algorithm. Visual representations of the data illustrate that the accuracy of the algorithm gradually improves as the transceiver spacing increases. The algorithm achieves its highest accuracy when the transceiver spacing is set to 6 m across the experimental site.
This phenomenon can be attributed to the fact that when the transceiver spacing is small, the change in the angle-of-arrival caused by the target’s movement over a long distance becomes minimal, leading to a reduction in algorithm accuracy. Conversely, with a larger transceiver spacing, the change in the angle-of-arrival resulting from the target’s movement over longer distances becomes more significant, allowing the algorithm to estimate the target’s position with greater precision.
In summary, the experiment highlights the significant impact of the transceiver spacing on the accuracy of the algorithm. It also underscores the importance of selecting an appropriate transceiver spacing, which can notably enhance the algorithm’s accuracy and its applicability in real-world localization scenarios.
5.5. Impact of Human Diversity
To assess the algorithm’s performance across diverse individuals, we conducted experiments involving five volunteers, comprising one female and four male students. The objective of this experiment was to evaluate how different individuals might affect the accuracy of the algorithm. Each participant performed the same experiment using an identical setup.
During the experiment, participants were instructed to walk a distance of 1 m along the mid-plumb line of the transceiver, positioned at distances ranging from 2 m to 12 m, thus simulating various walking trajectories for different individuals.
Upon concluding the experiment, we processed and analyzed the collected data. The analysis yielded error distribution graphs for each of the five individuals walking 1 m from different starting points, as depicted in
Figure 11.
The outcomes of this experiment not only validate the algorithm’s reliability in practical applications but also furnish essential reference data for potential algorithm enhancements. The experimental evaluation explicitly underscores the algorithm’s robustness in diverse scenarios, encompassing various test targets, postures, and arm swings. The findings indicate minimal influence from varying heights and weights on the efficacy of the proposed algorithm. Notably, the algorithm exhibits pronounced resilience even in the presence of disparate characteristics, such as variations in gait postures and arm swings. Across diverse locations and individuals, the algorithm consistently maintains errors within a reasonable range. This compelling evidence attests to the algorithm’s robustness and its ability to sustain high accuracy despite significant human diversity.
5.6. Impact of the Target Moving Direction
We conducted an evaluation to examine the lateral and vertical movements of the target in relation to the transceiver within the sensing range. The objective was to understand how different motion directions might impact the algorithm’s accuracy.
Figure 12 provides an illustration of the signal ratio variations when moving the same distance both laterally and vertically in relation to the transceiver. Notably, when the target moves longitudinally relative to the transceiver, the dynamic path change is more significant. Conversely, when the target moves laterally relative to the transceiver, the dynamic path change is relatively smaller. The signal ratio exhibits a more predictable pattern when the target moves longitudinally. In such cases, the target’s chest or back faces the transceiver, leading to a more pronounced torso reflection compared to other body parts (e.g., arms and legs). This aligns more closely with the assumption of a single dynamic reflection.
Conversely, during lateral movement relative to the transceiver, the participant’s arms and legs move alternately toward the transceiver, resulting in a torso reflection surface that can be intermittently blocked by the arms and shoulders. This intermittent blocking complicates the multipath superposition, making the signal ratio changes less regular.
To further investigate the distribution of errors associated with these different movement directions, we collected data pertaining to both lateral and longitudinal walking trajectories relative to the transceiver at various positions. The test procedure involved the tester walking a 1 m distance to each marker in different walking directions, recording data five times at each location.
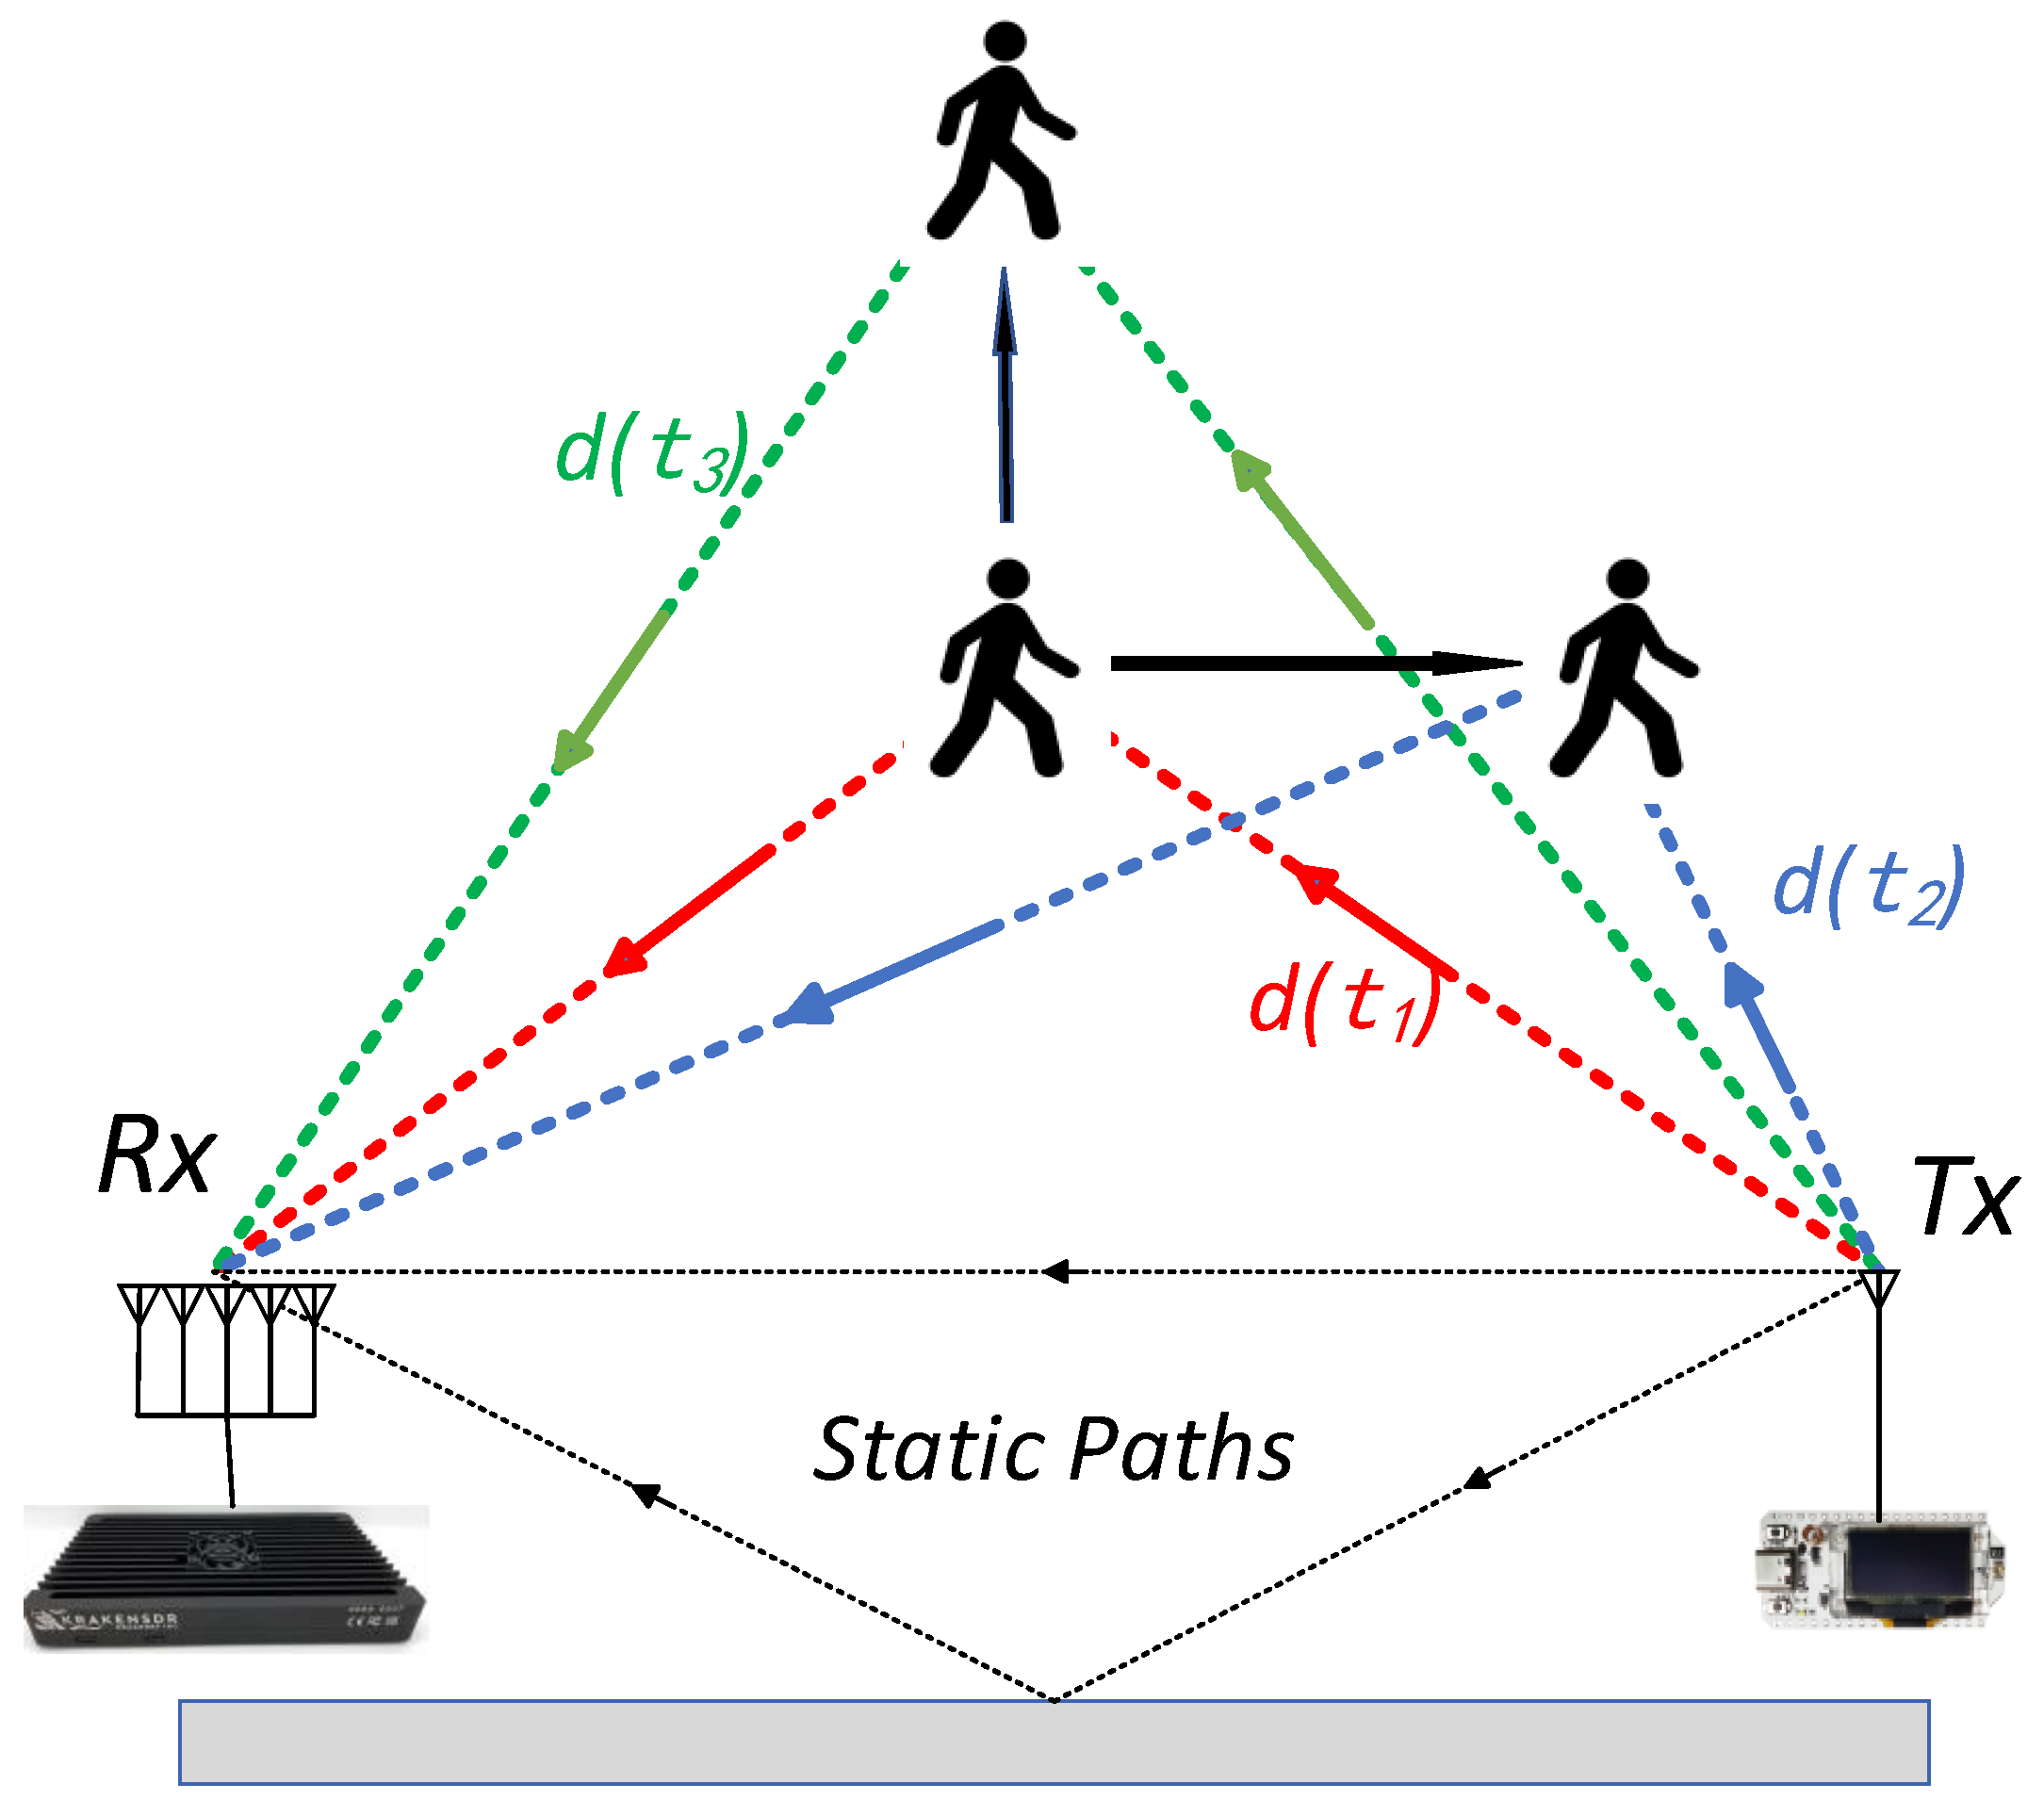
In
Figure 13, the values d(t
1), d(t
2), and d(t
3) represent the reflected path lengths at the initial and final positions of the moving target. When the target moves longitudinally with respect to the transceiver, the phase difference of the signal ratio is:
By examining the schematic diagram, we can observe that when the target moves longitudinally in relation to the transceiver, the dynamic path variation in the signal ratio is substantial, while the change in the signal arrival angle before and after the human movement is relatively small.
Conversely, when the target moves horizontally relative to the transceiver, the dynamic path variation in the signal ratio is minimal, but the variation in the signal arrival angle before and after human movement is significant. These differing signal characteristics arising from different directions of human motion have an impact on the algorithm’s accuracy when dealing with targets moving in different directions.
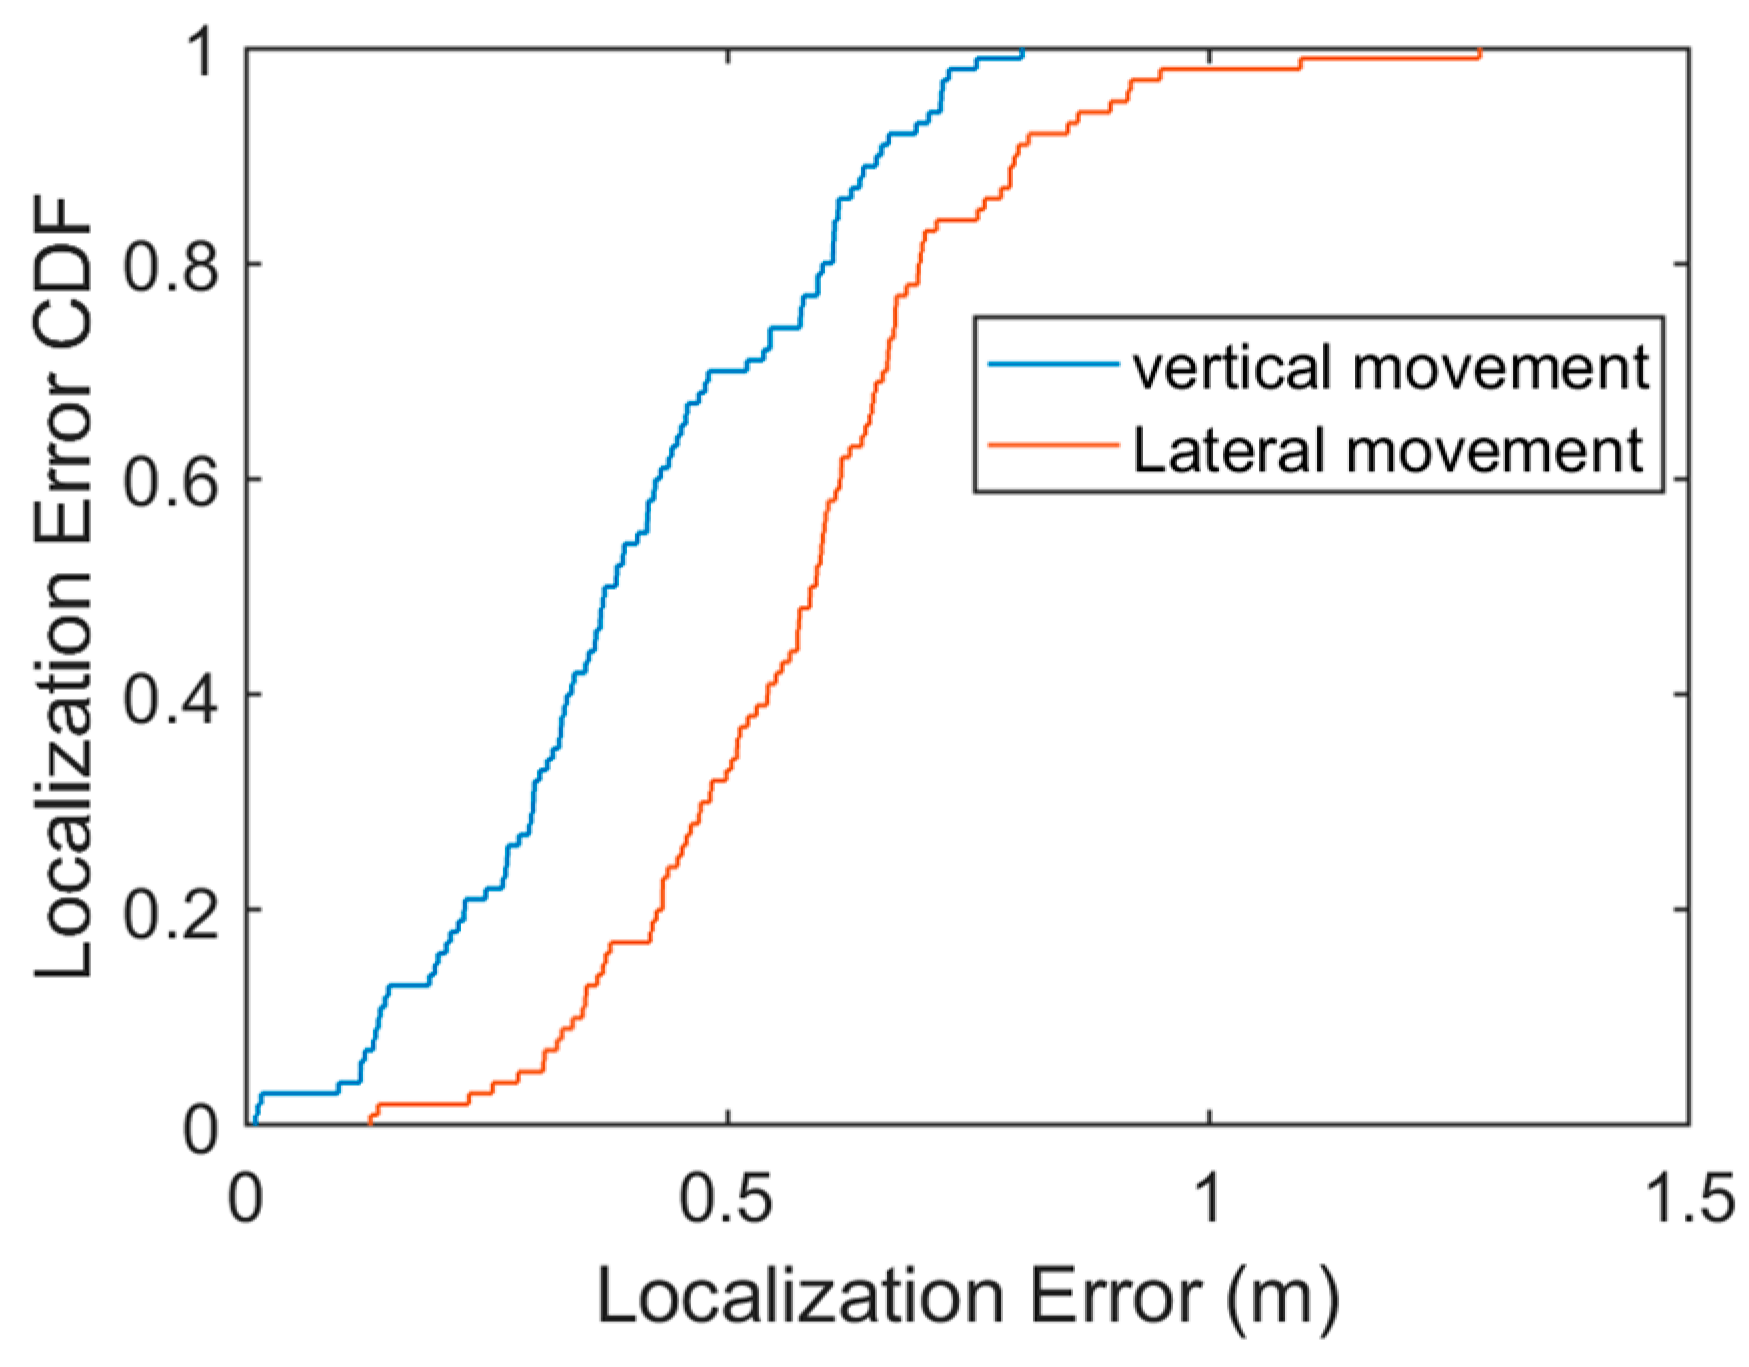
Figure 14 presents a cumulative distribution function plot of errors for both vertical and horizontal movements covering a distance of 1 m. It can be observed that when the target moves longitudinally relative to the transceiver, the algorithm’s performance is slightly better compared to cases where the target moves horizontally. This further highlights that the algorithm’s accuracy is influenced by the direction of the motion exhibited by the target.
6. Discussion
In this paper, we focused on the field of non-contact localization and tracking technology, specifically presenting a target localization algorithm based on the amplitude of LoRa signals. The algorithm utilizes the mean abatement method to effectively eliminate the interference caused by multipath effects and static object clutter present in the environment. The primary objective is to accurately estimate the position information of the target by leveraging the angle-of-arrival information extracted through the MUSIC algorithm, the dynamic path changes information derived from the signal ratio phase difference, and the target motion-related information obtained from the LoRa echo signal amplitude. The proposed algorithm demonstrates a positioning accuracy with an average error of 48.5 cm within a 6 m × 12 m outdoor space. The effectiveness of the algorithm is thoroughly validated through theoretical analysis and comparative experiments, showcasing its excellent performance in target localization.
In future research, there are exciting opportunities to extend the sensing range of LoRa, particularly by investigating its applicability in outdoor environments with sparser node deployments. Leveraging LoRa signals for sensing with strategically positioned nodes can significantly expand the potential of LoRa technology for various applications. Additionally, adapting the proposed localization algorithm for multiplayer scenarios is an intriguing avenue involving the strategic placement of receiving antennas to explore localization in scenarios involving multiple targets.
Furthermore, the algorithm introduced in this study can be a foundational component of a broader tracking system, particularly for monitoring and tracking targets in a 2D plane. Its adaptability and potential for real-world applications position it as a valuable tool in the evolving landscape of wireless sensing and tracking technologies.


