
Study on the Influence of Connection Structure between Batteries on Battery Pack Performance


Abstract
1. Introduction
2. Modeling and Verification
2.1. Battery and Experimental Equipment Parameters
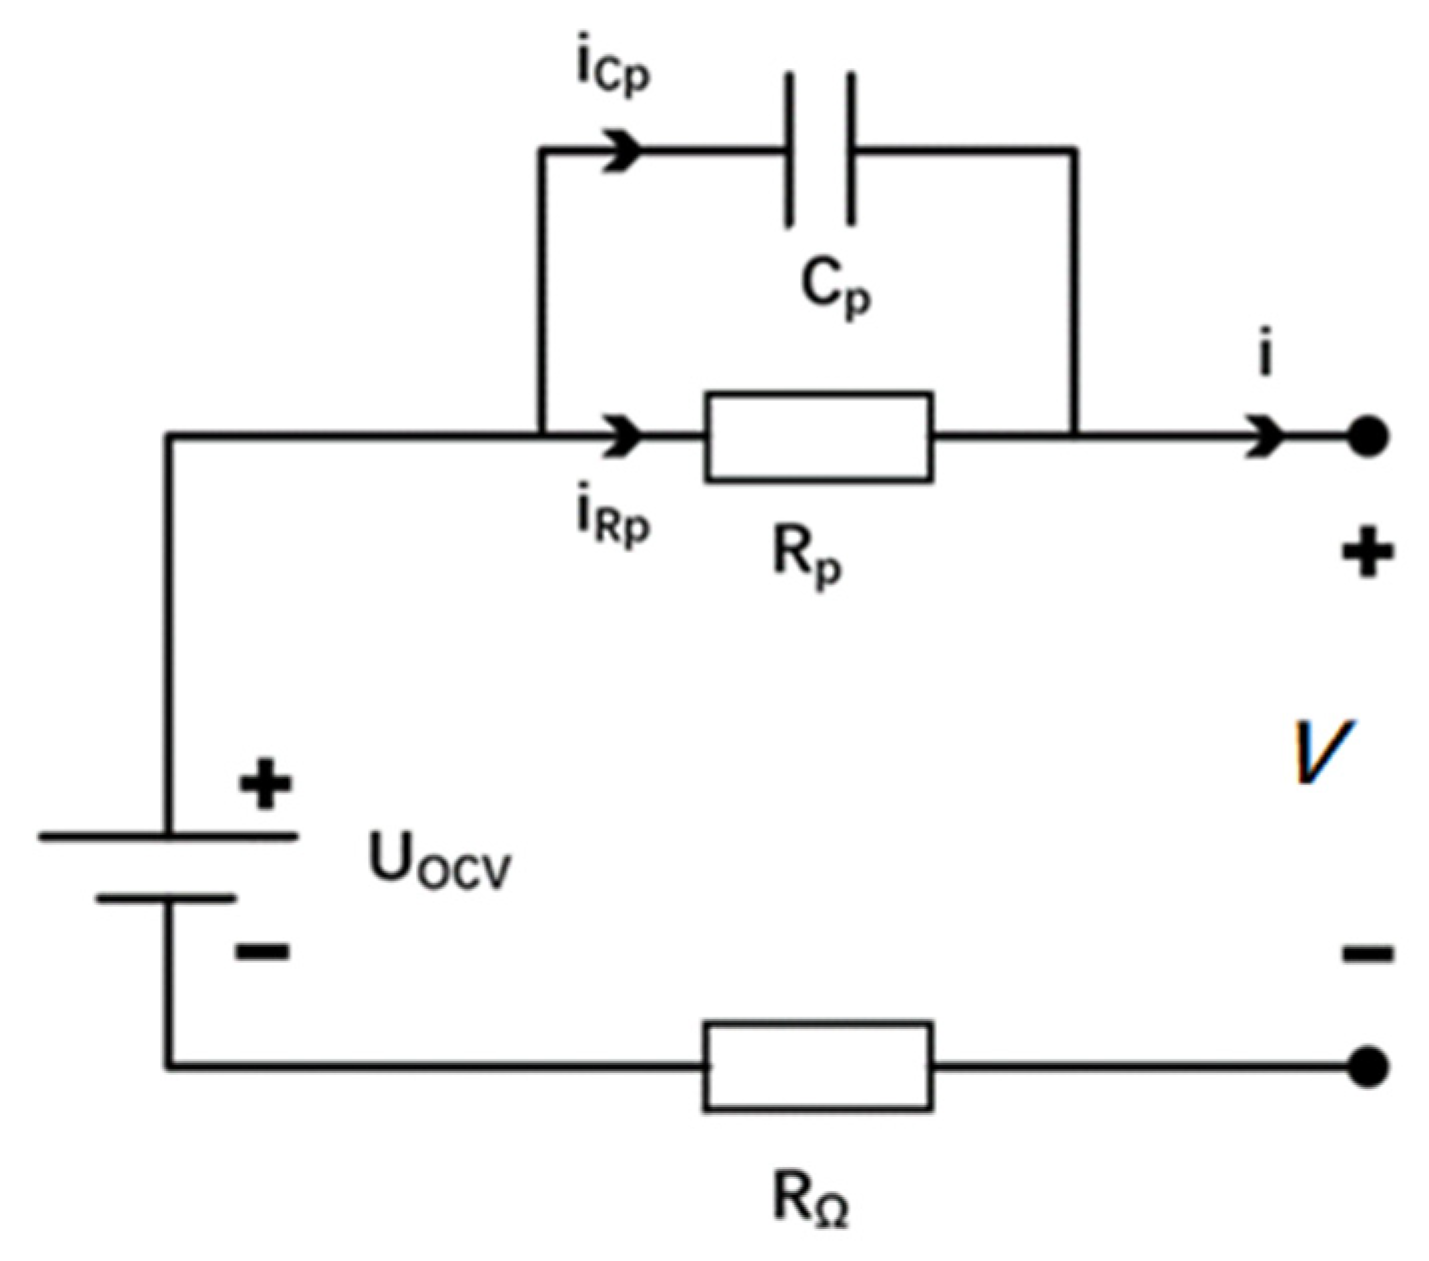
2.2. Battery Equivalent Circuit Model
- (1)
- To try to combine with the battery’s chemical reaction mechanism and select model parameters with relevant meanings;
- (2)
- The model should be able to reflect the battery’s characteristics more accurately, have higher calculation accuracy, and be able to adapt to different environments and working conditions;
- (3)
- Within the design requirements, the single-cell battery model should be as simple as possible, simplify the calculation process, and improve the usability of the model.
2.3. Battery Model Parameter Identification
2.3.1. SOC Calculation and Capacity Correction
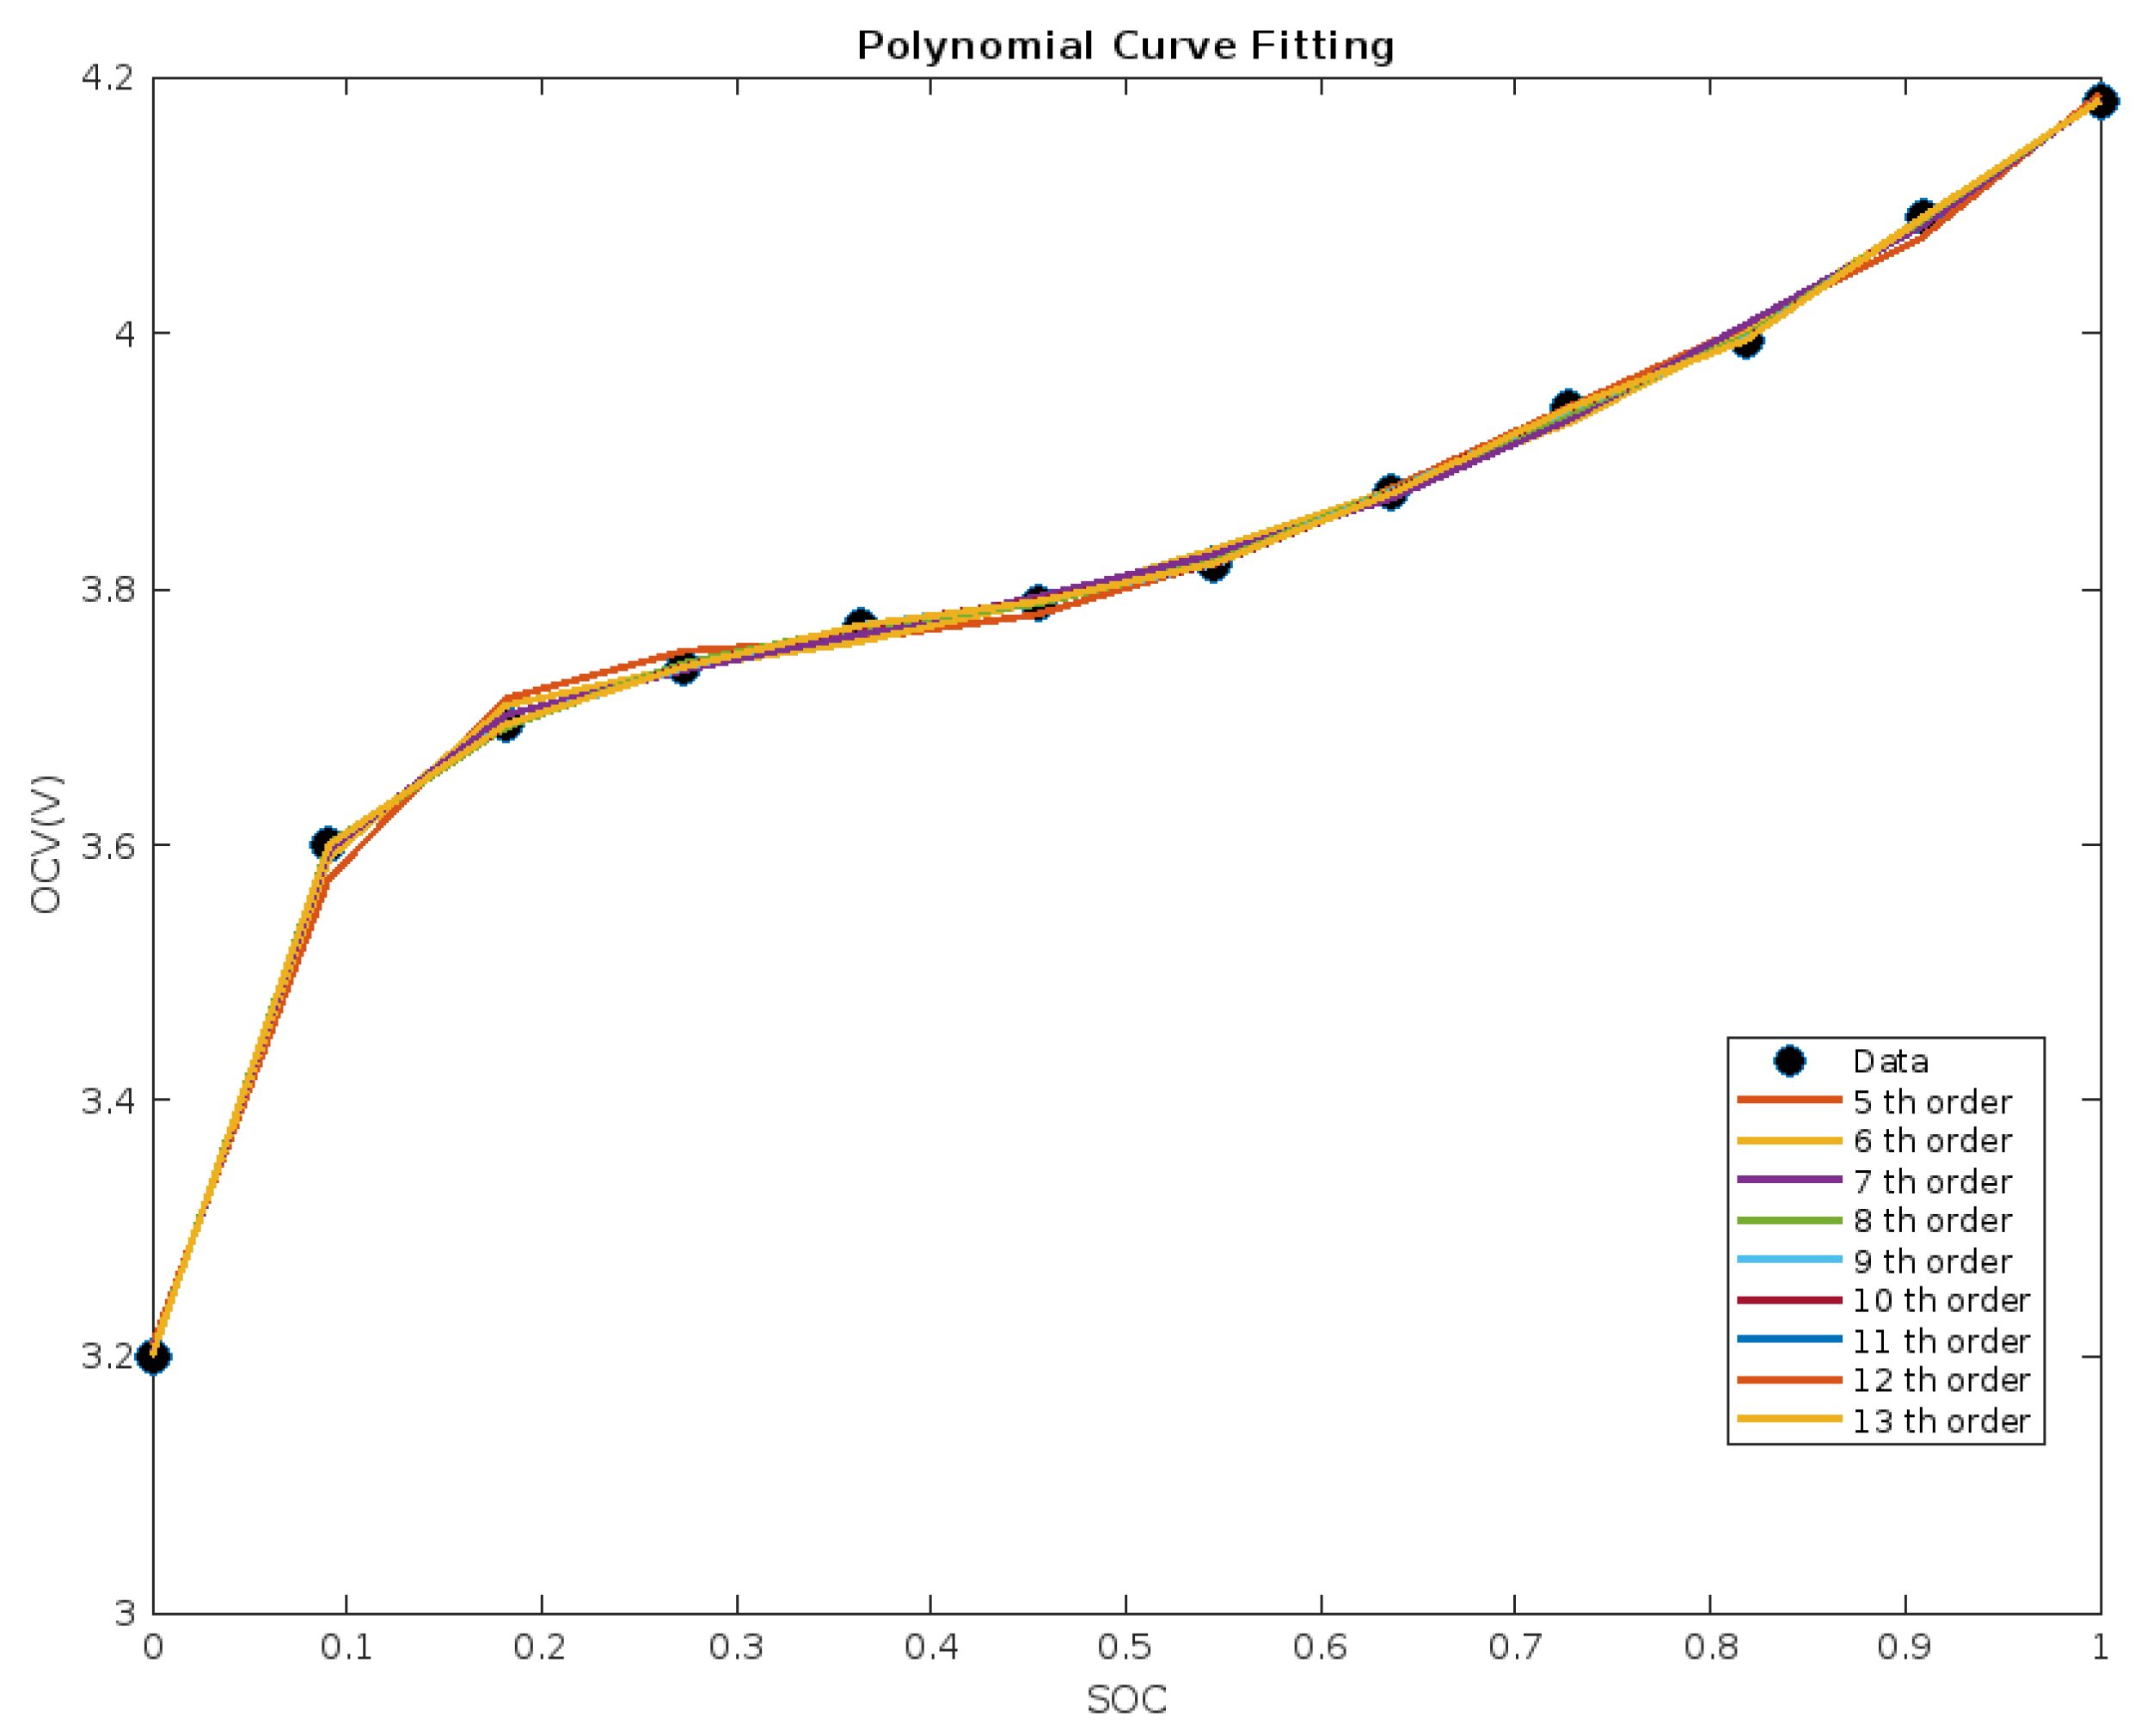
2.3.2. OCV-SOC Curve Identification
- (1)
- Place a single ternary lithium-ion battery in a constant temperature and humidity chamber at an ambient temperature of 25 °C for 2 h;
- (2)
- Use a constant-current discharge of a single cell at a discharge rate of 0.5 C to a cutoff voltage of 3.0 V. The battery is then discharged at a rate of 0.5 C for 2 h;
- (3)
- Leave the single-cell battery to stand for 2 h, after the battery is stabilized, fill the battery with standard charging requirements;
- (4)
- Perform constant current discharge of the battery for a duration of 12 min with a discharge multiplication rate of 0.5 C. After the battery has been fully rested (1 h) [30], use high-precision acquisition equipment to collect the open-circuit voltage;
- (5)
- Repeat step (4) until the battery voltage reaches a cutoff voltage of 3.0 V.
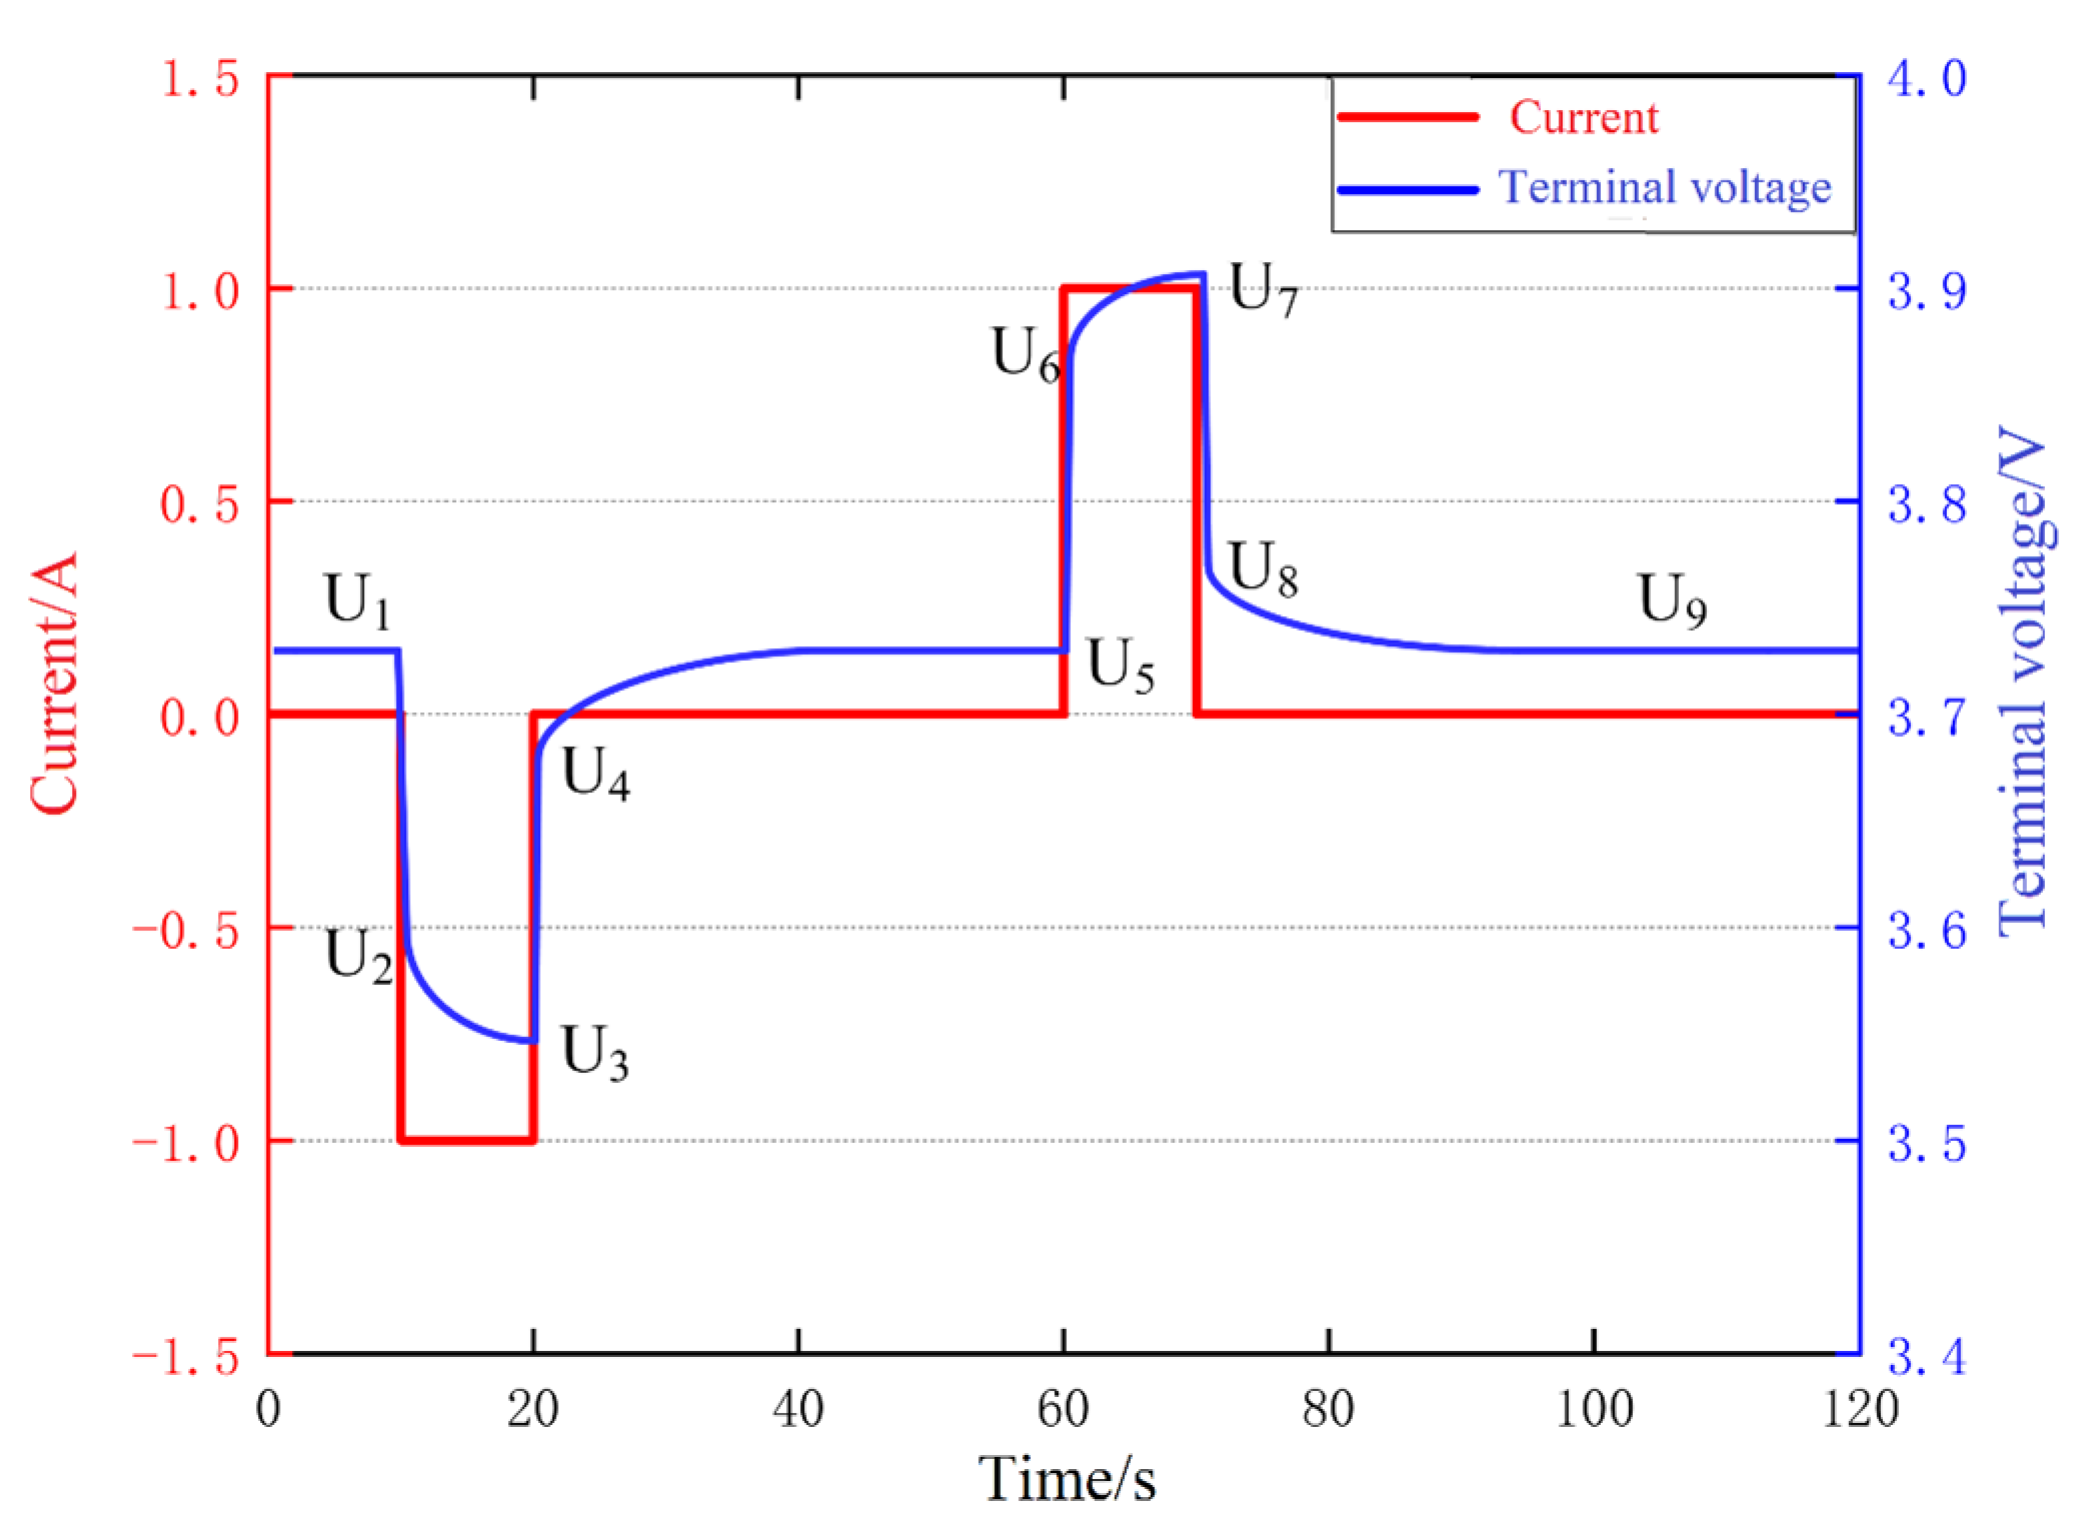
2.3.3. Identification of Ohmic Internal Resistance and RC Parameters
- (1)
- A single Li-ion battery is placed in a constant temperature and humidity chamber at an ambient temperature of 25 °C for 2 h;
- (2)
- Use a 0.5 C discharge multiplier on a single battery constant current discharge to the cut-off voltage of 3.0 V, leave the battery for 2 h, to be stable after the battery to the standard charging requirements of the battery full, leave the battery for 1 h;
- (3)
- Discharge the battery at a discharge multiplication rate of 0.5 C with a pulse discharge of 10 s and then leave it for 40 S. After the battery has been left to stand still, charge the battery at a discharge multiplication rate of 0.5 C with a pulse charge of 10 s, and then leave it for 40 s. Real-time collection of the battery terminal voltage is carried out in the whole process;
- (4)
- Discharge the battery at a constant discharge multiplication rate to the next SOC test point, fully rest the battery, and then repeat step 3 and stop after completing all test points.
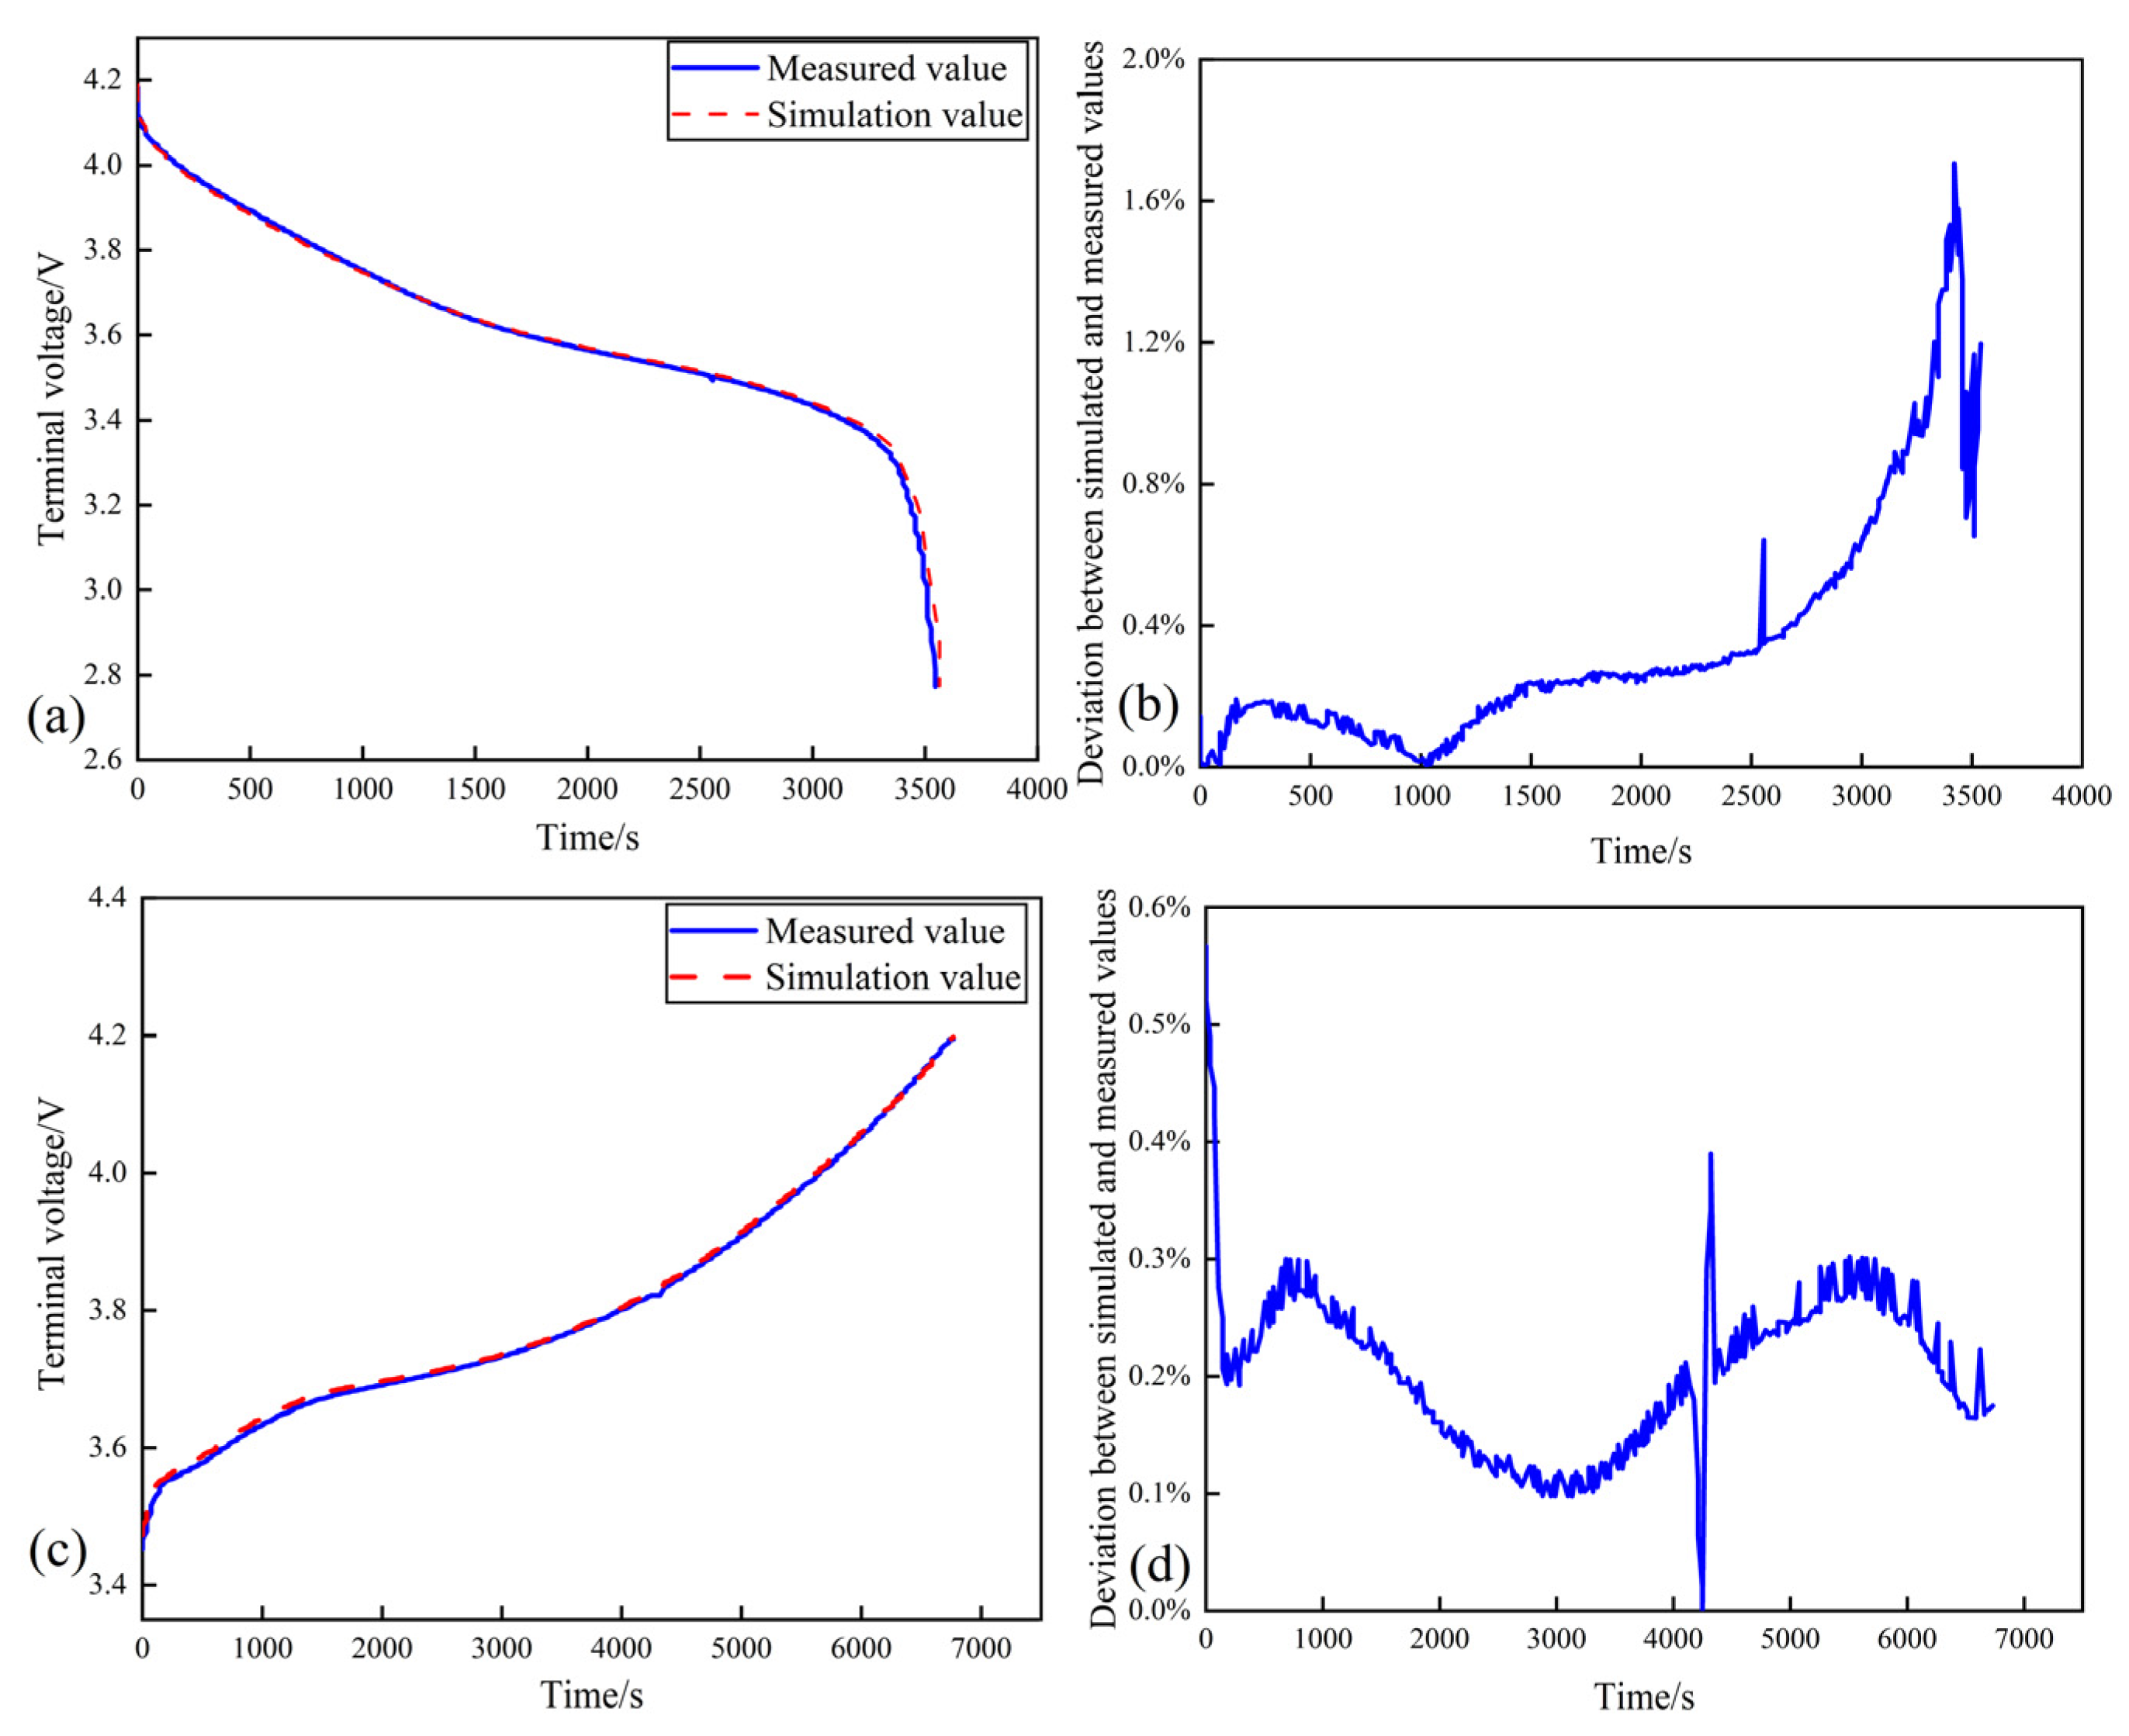
2.4. Validation of the Validity of the Monolithic Model
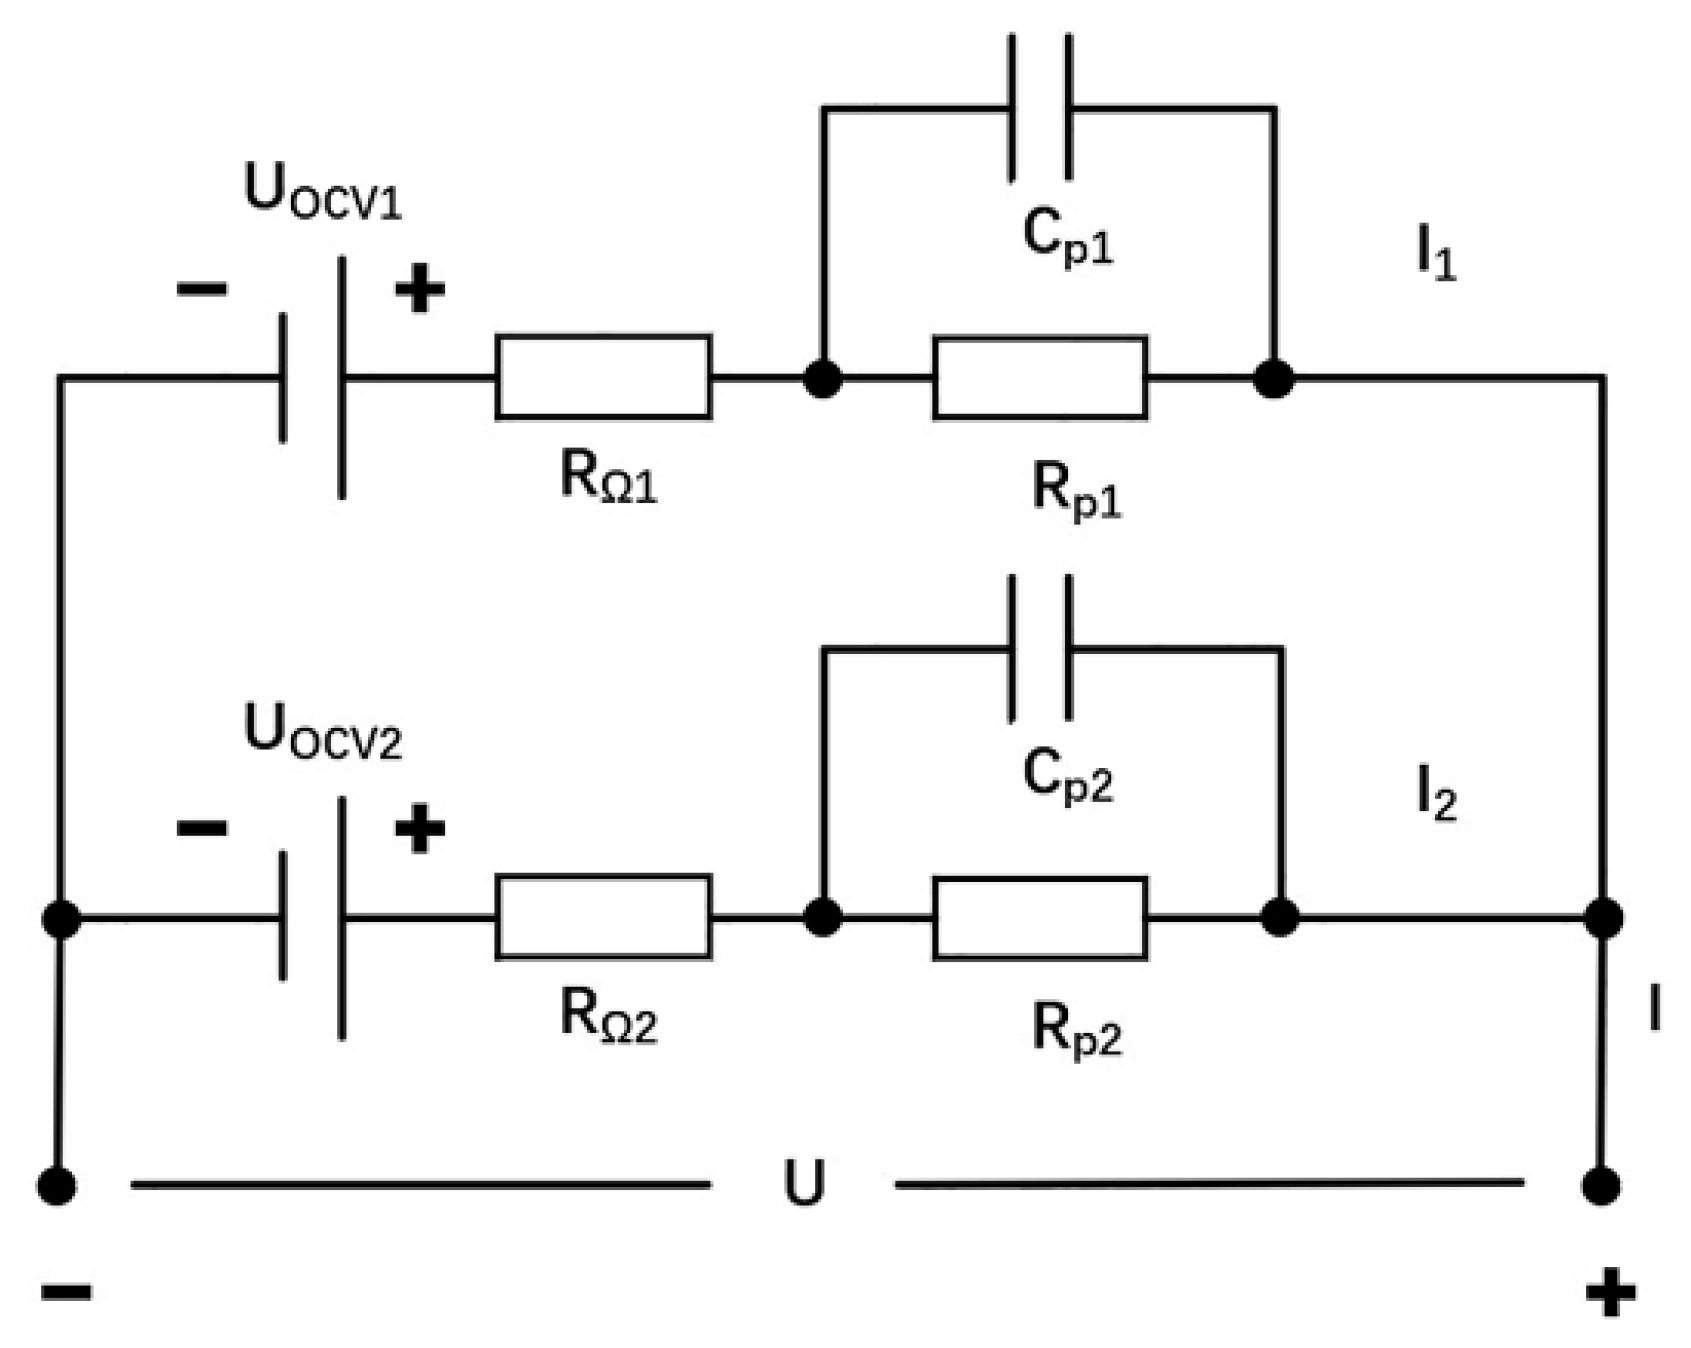
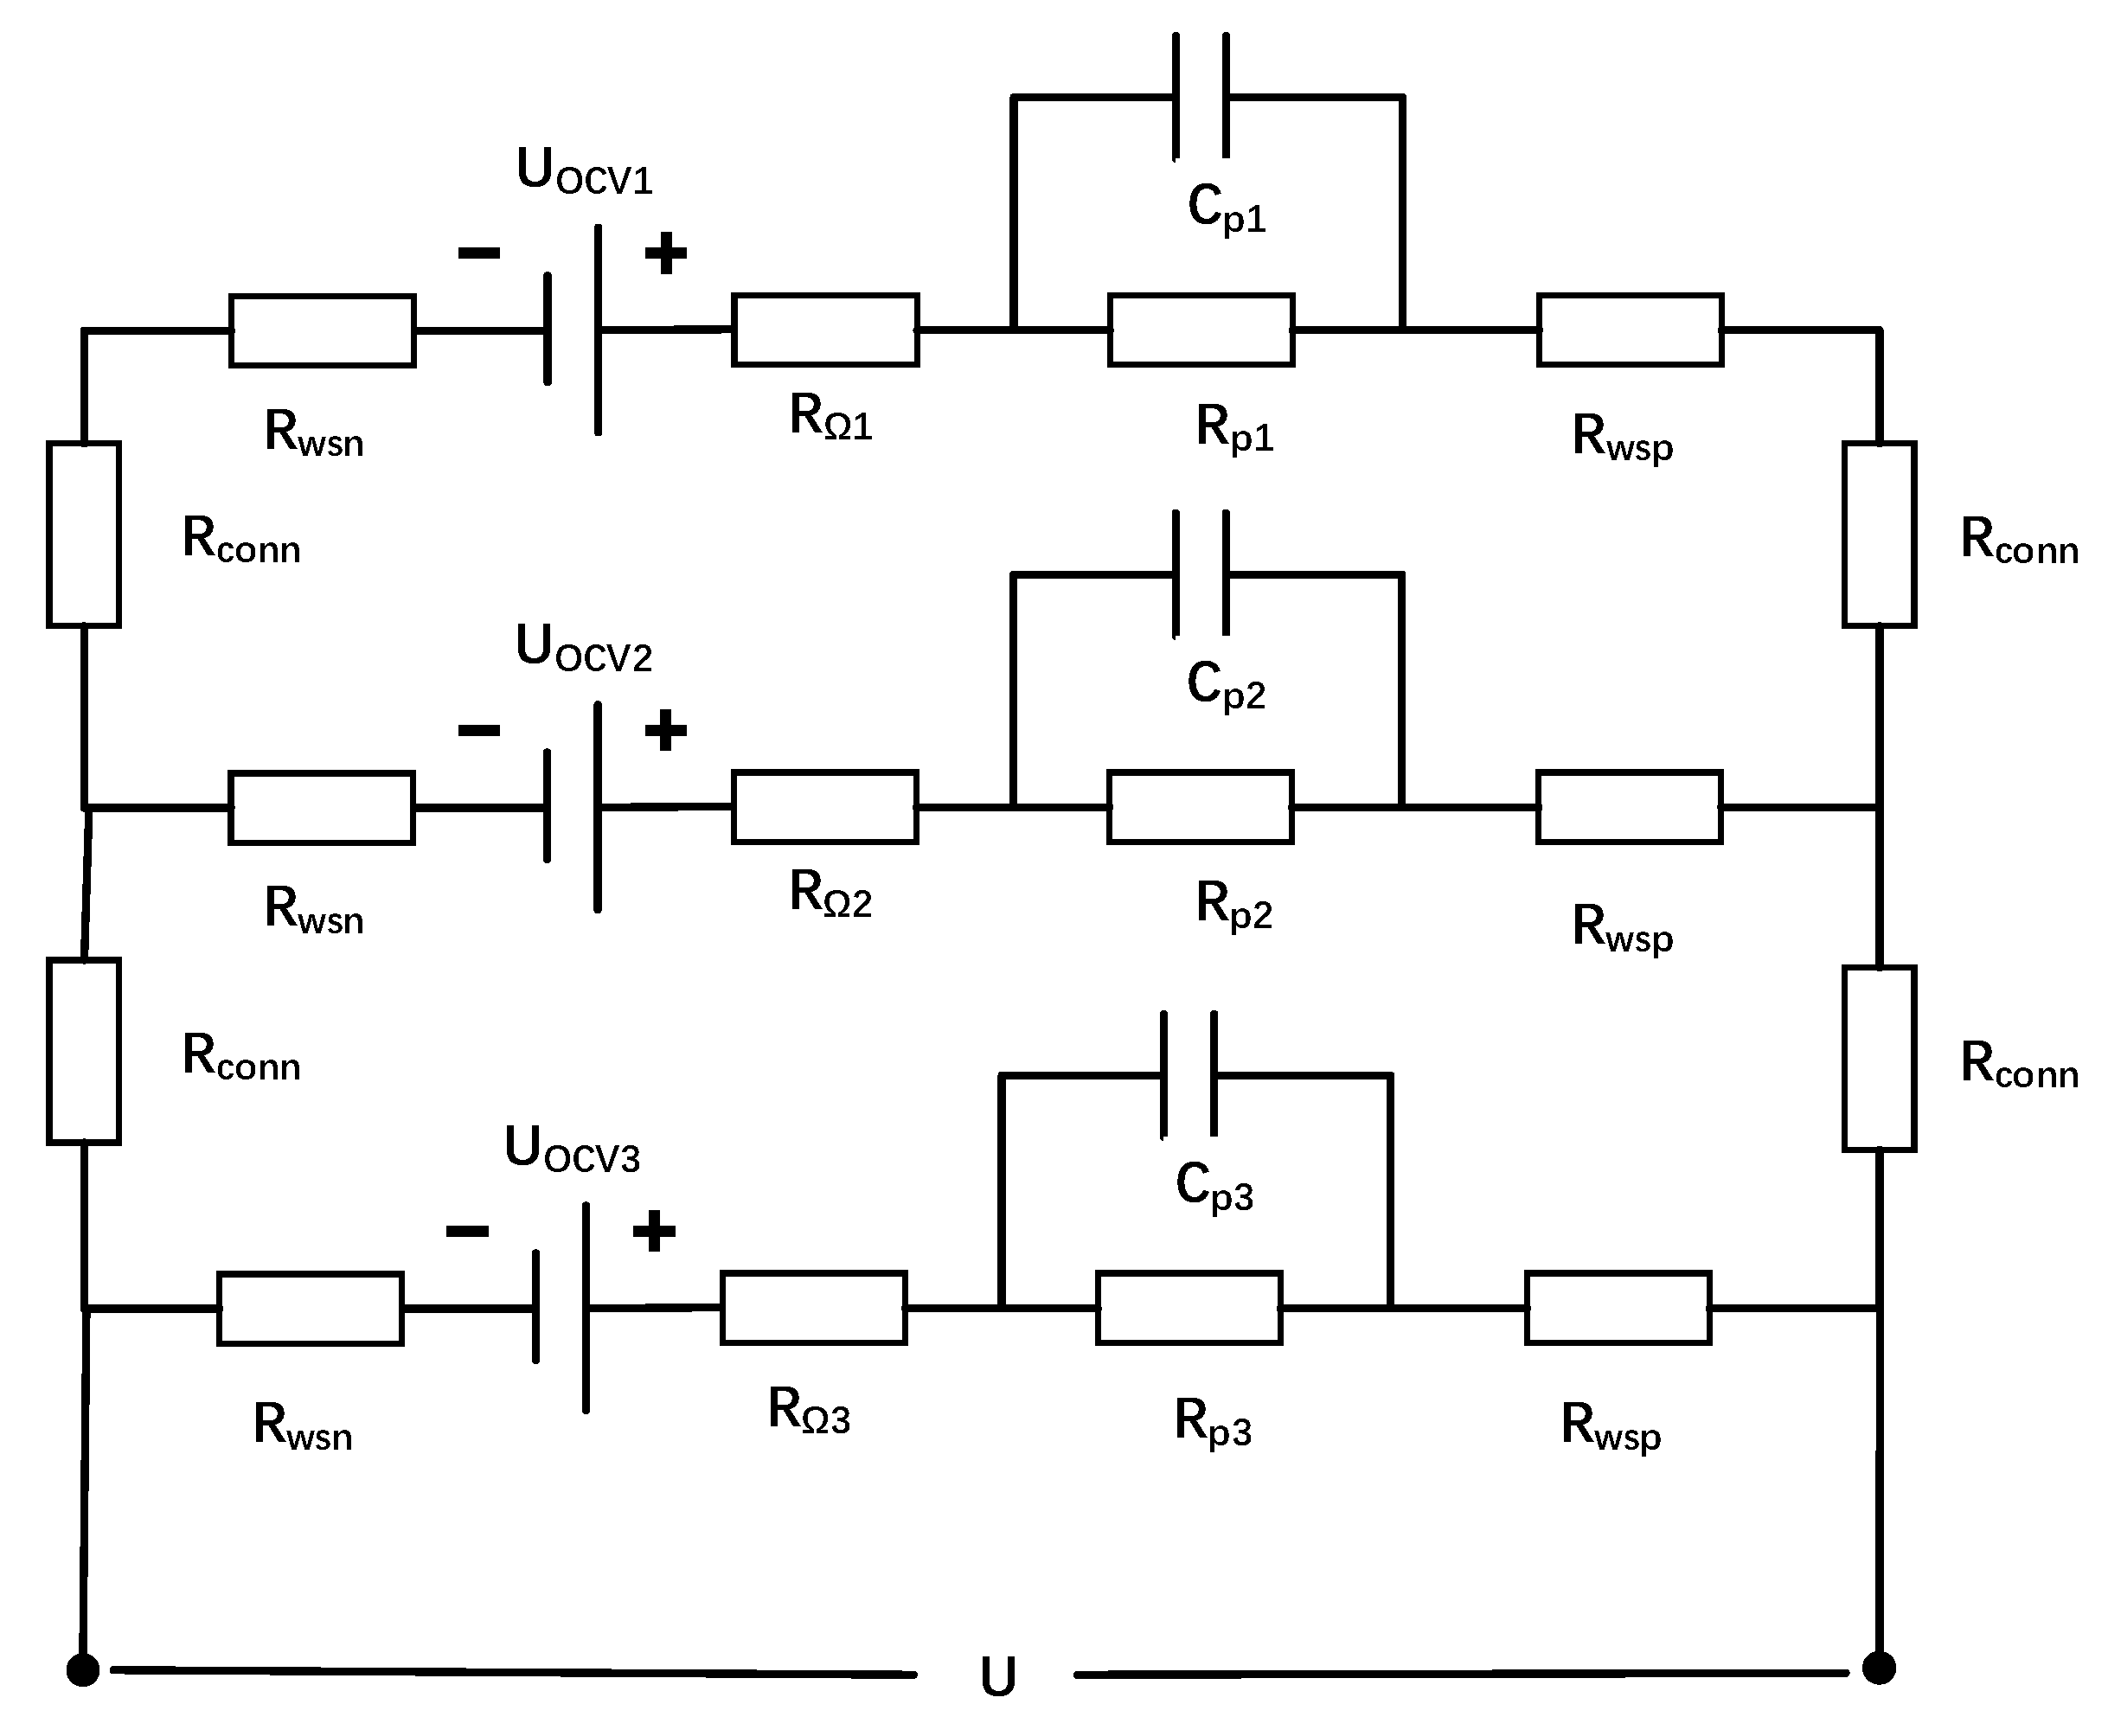
2.5. Parallel-Connected One-Order RC Model
3. Connection Structure on the Battery Pack Performance Impact Study
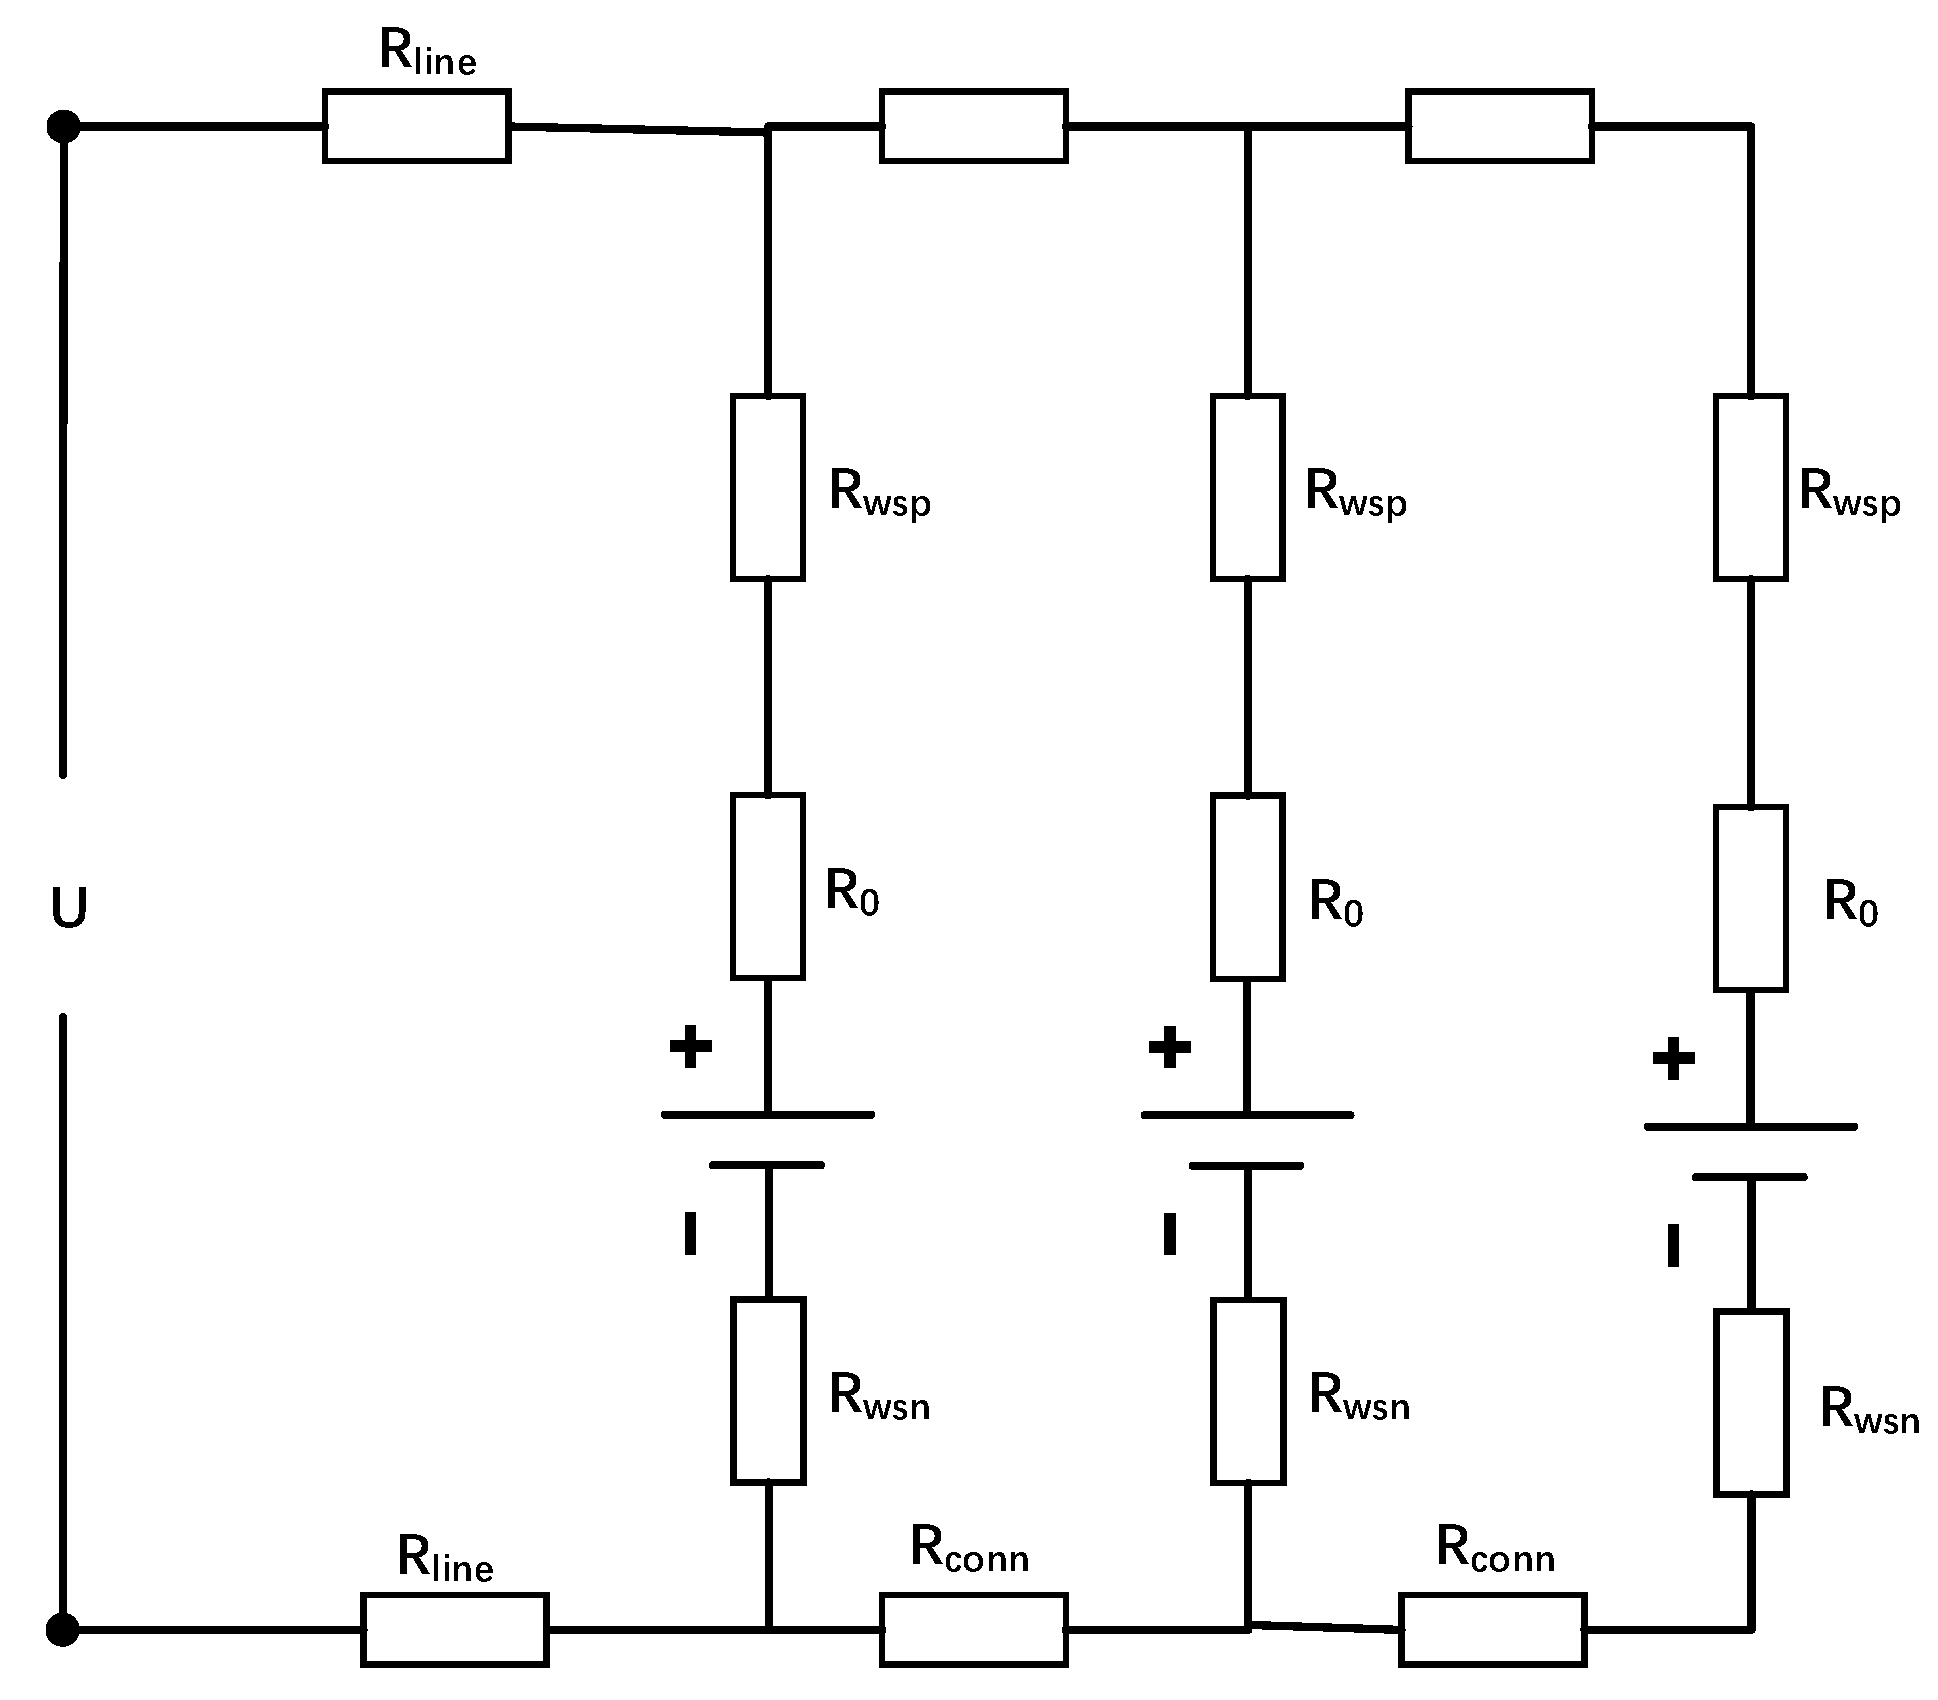
3.1. Simulation Analysis of Conventional Connection Structure of Battery Packs
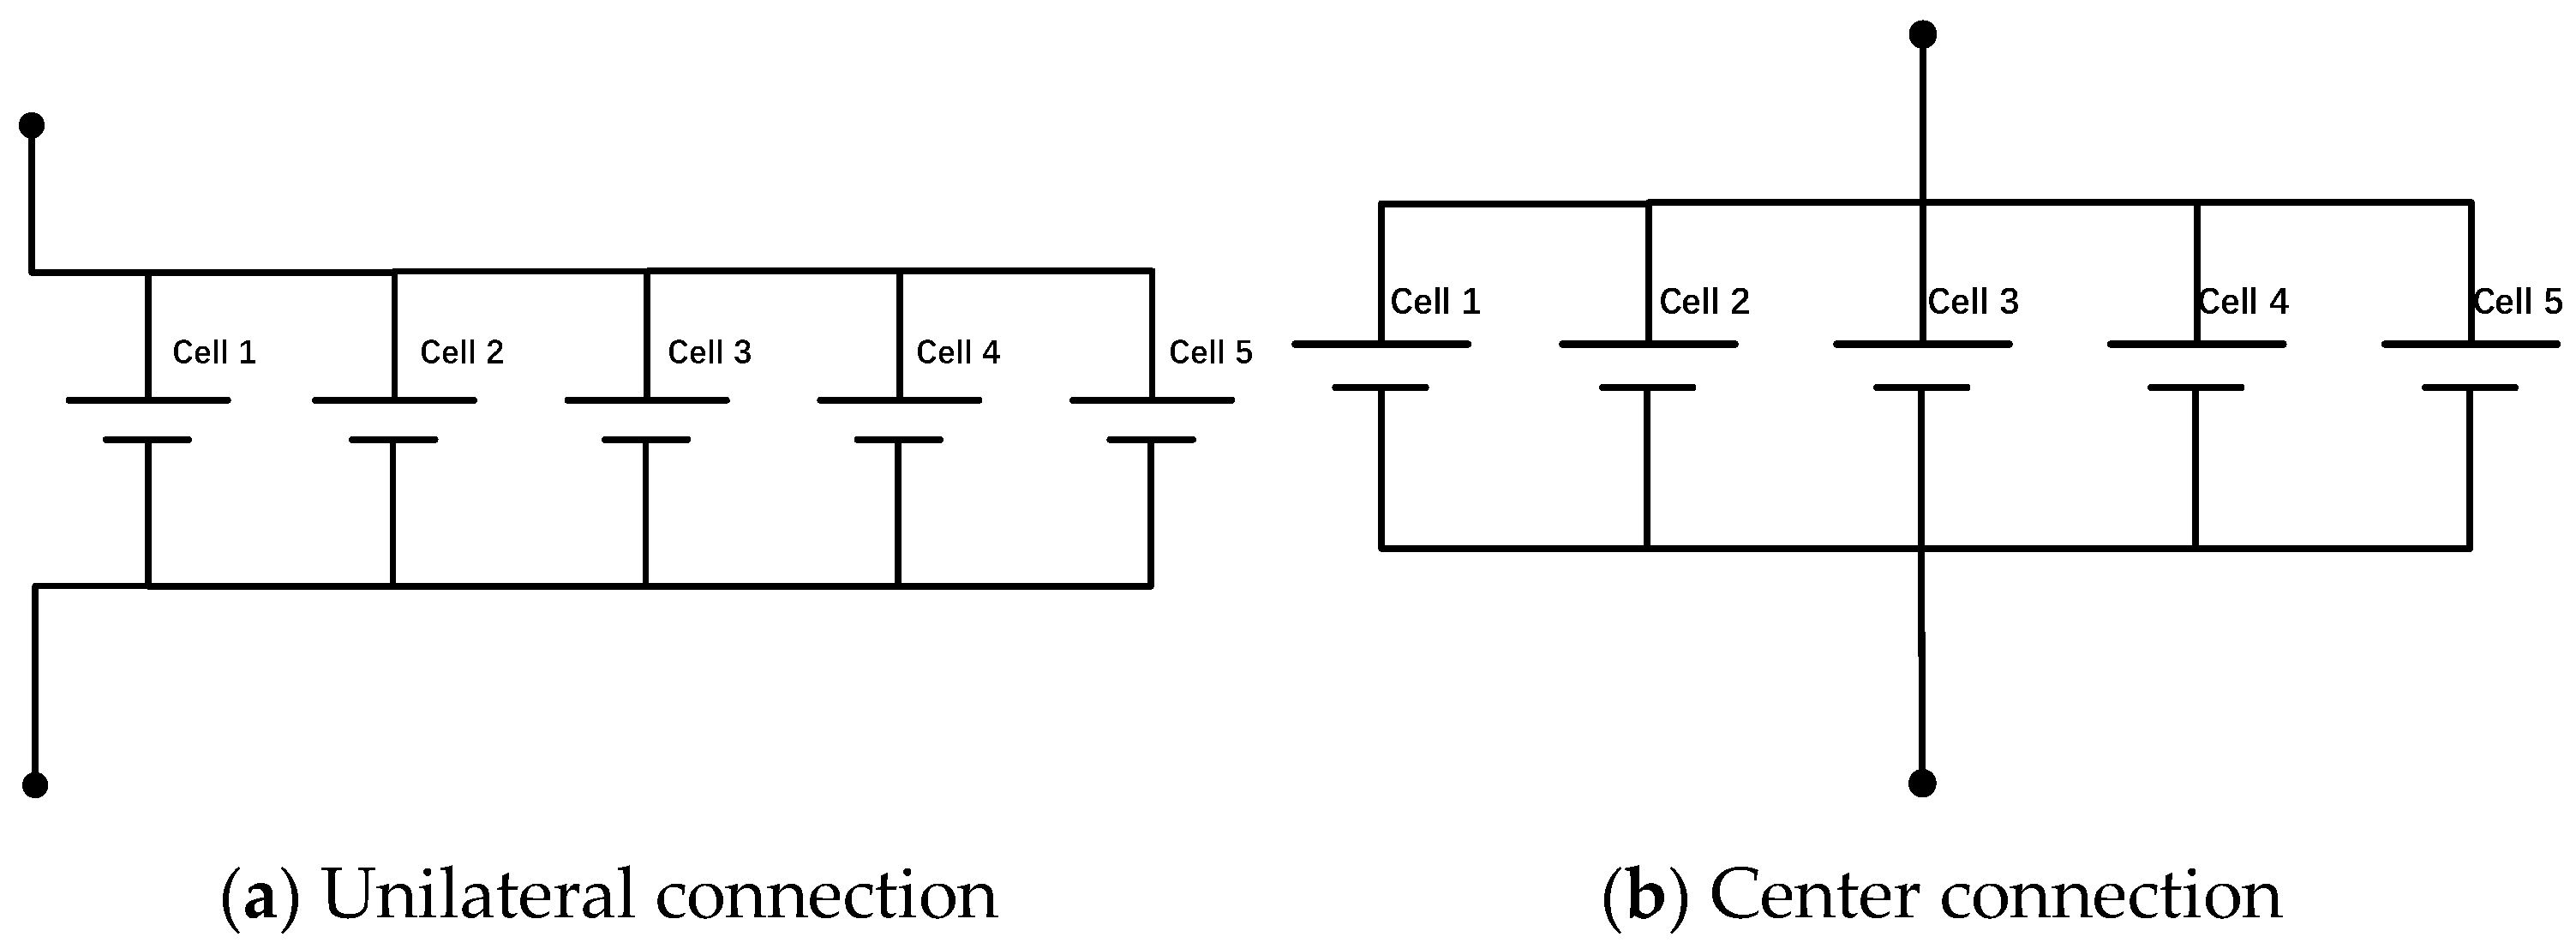
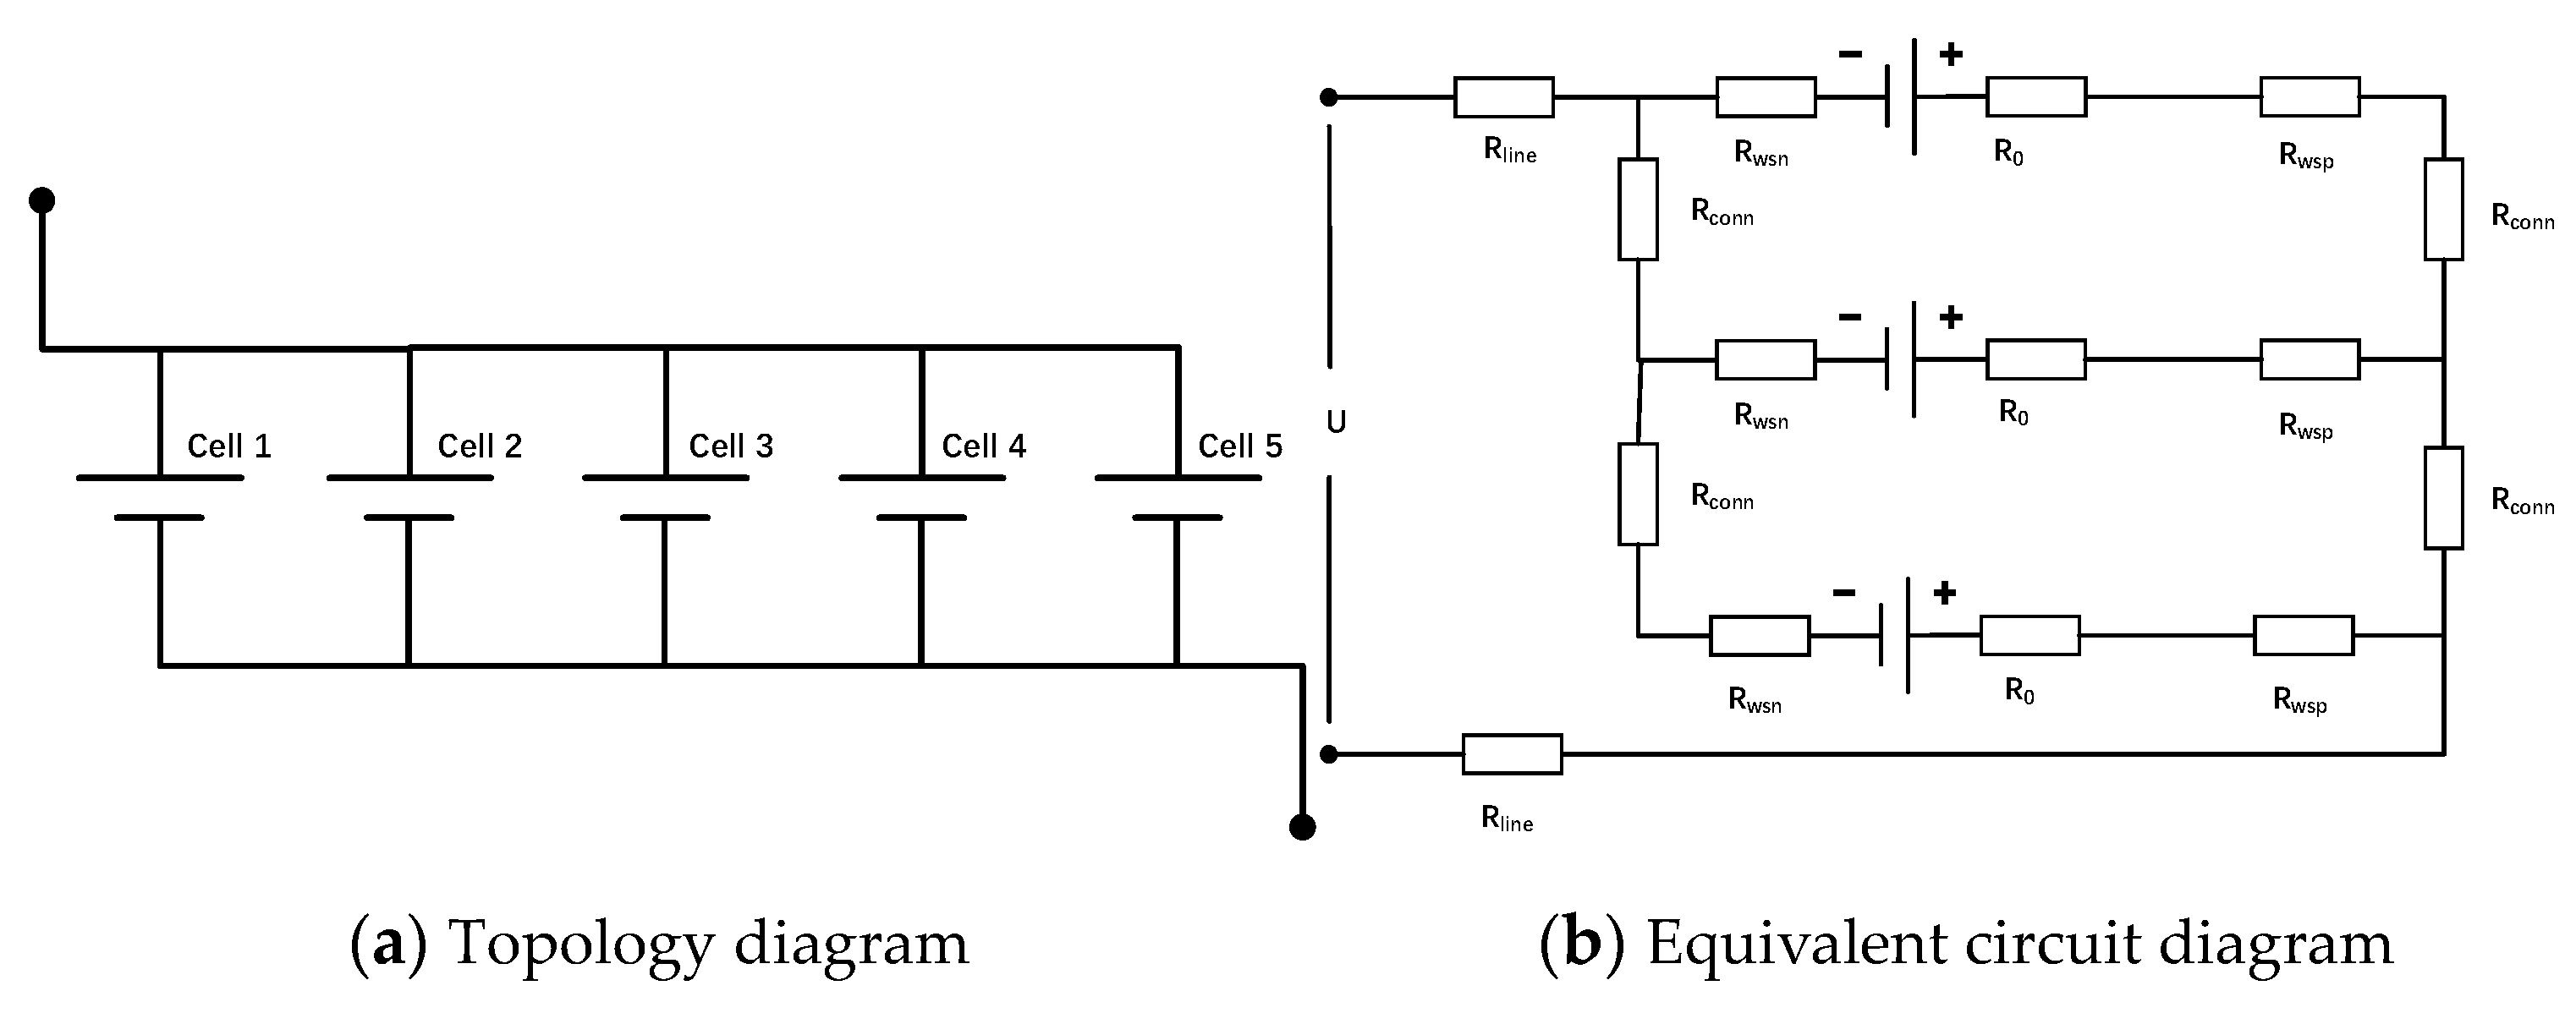
3.1.1. Battery Pack Model Considering Connection Structure
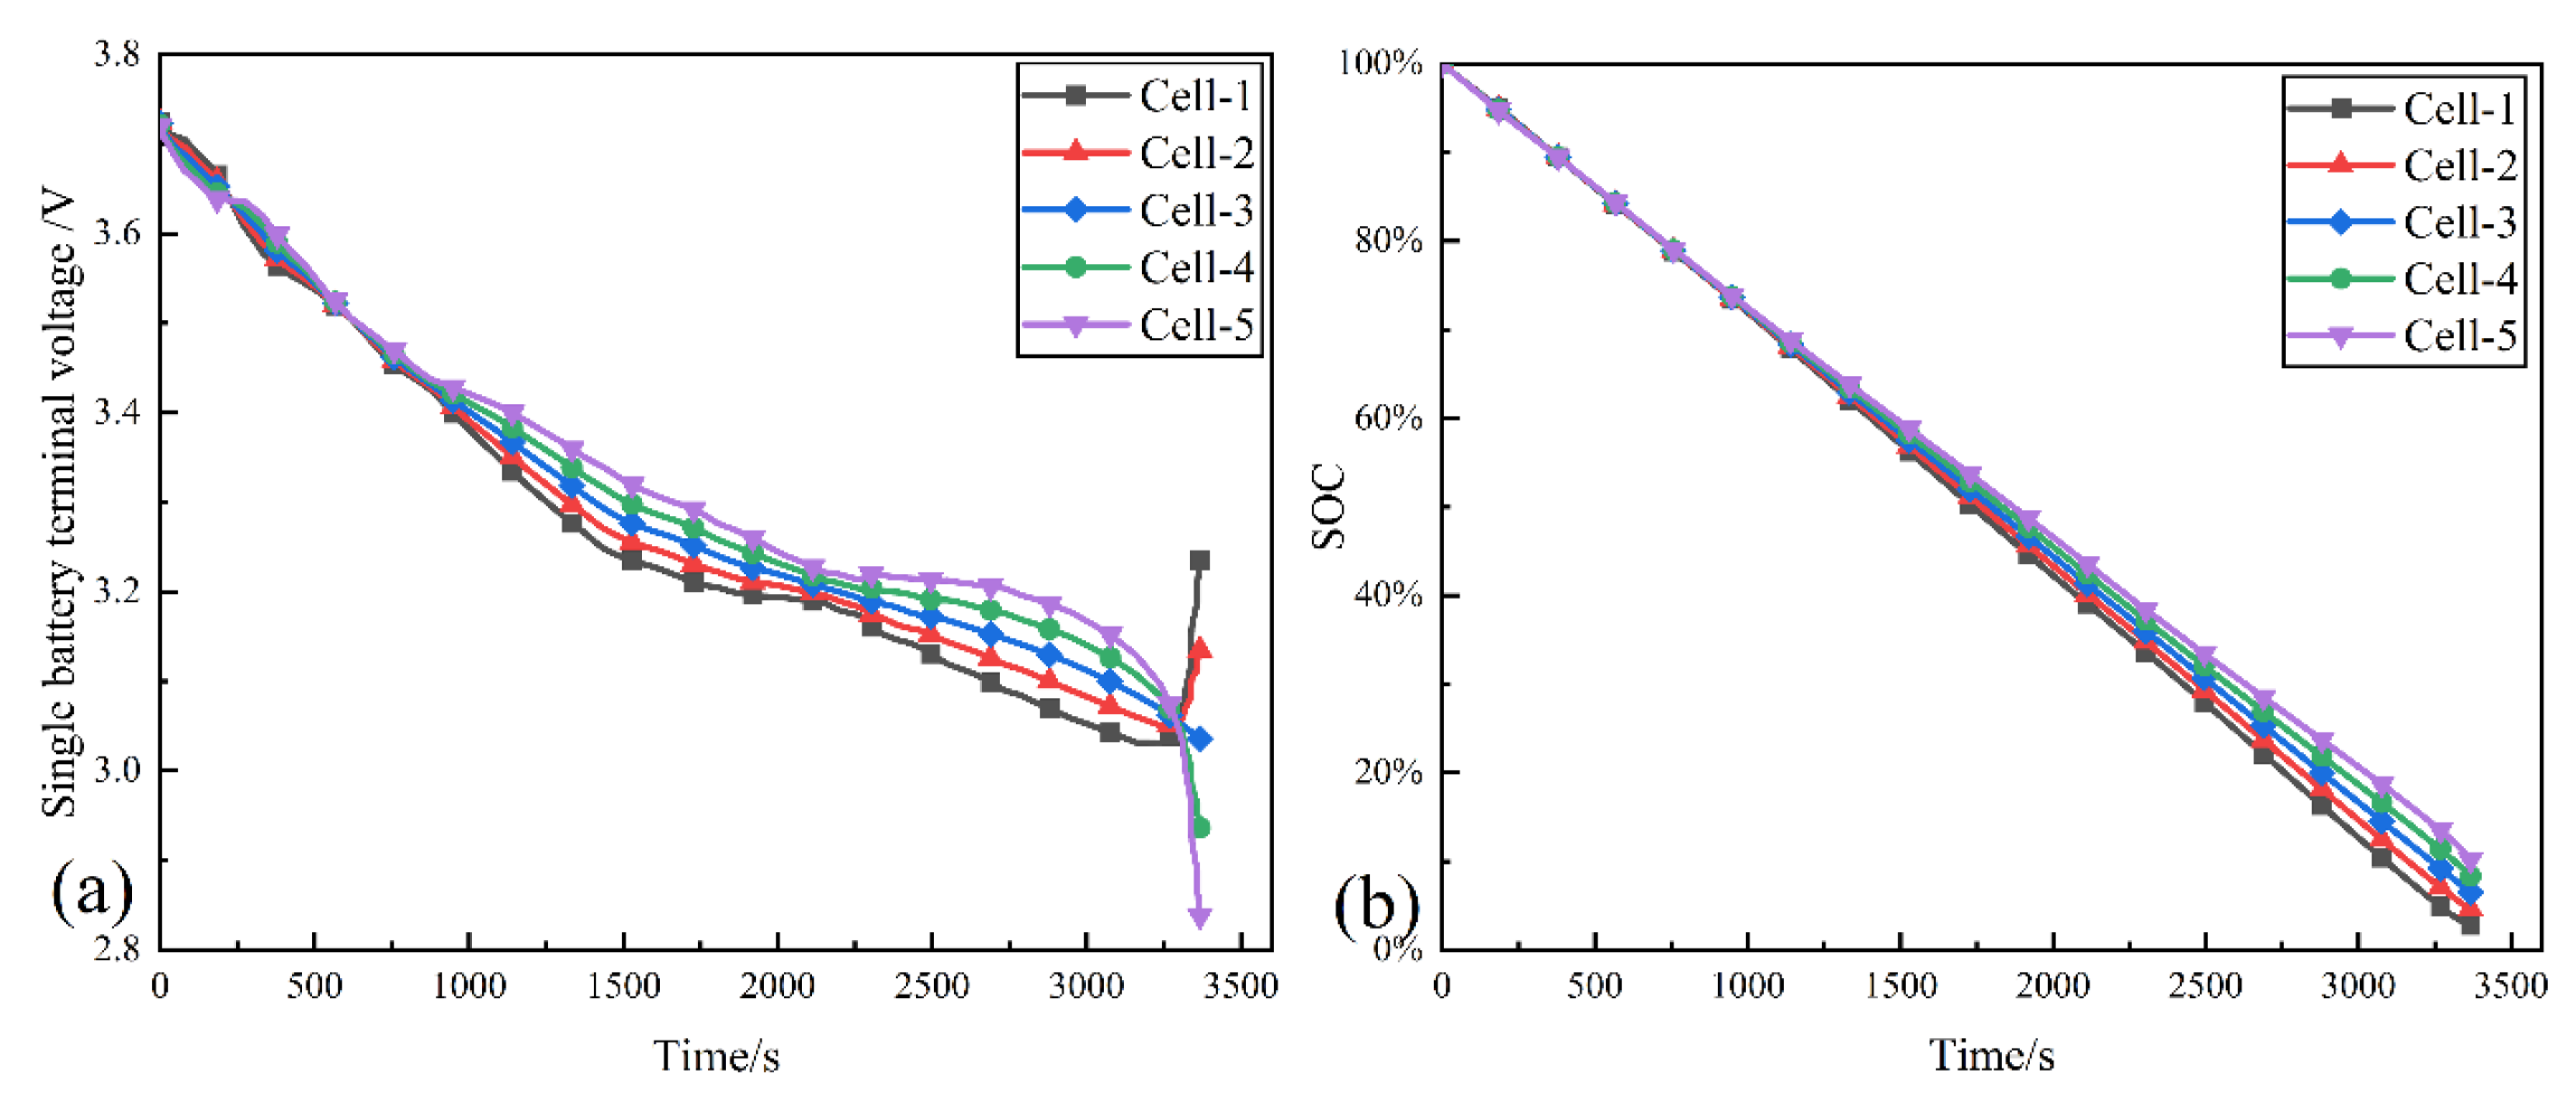
3.1.2. Conventional Connection Structure Simulation Analysis
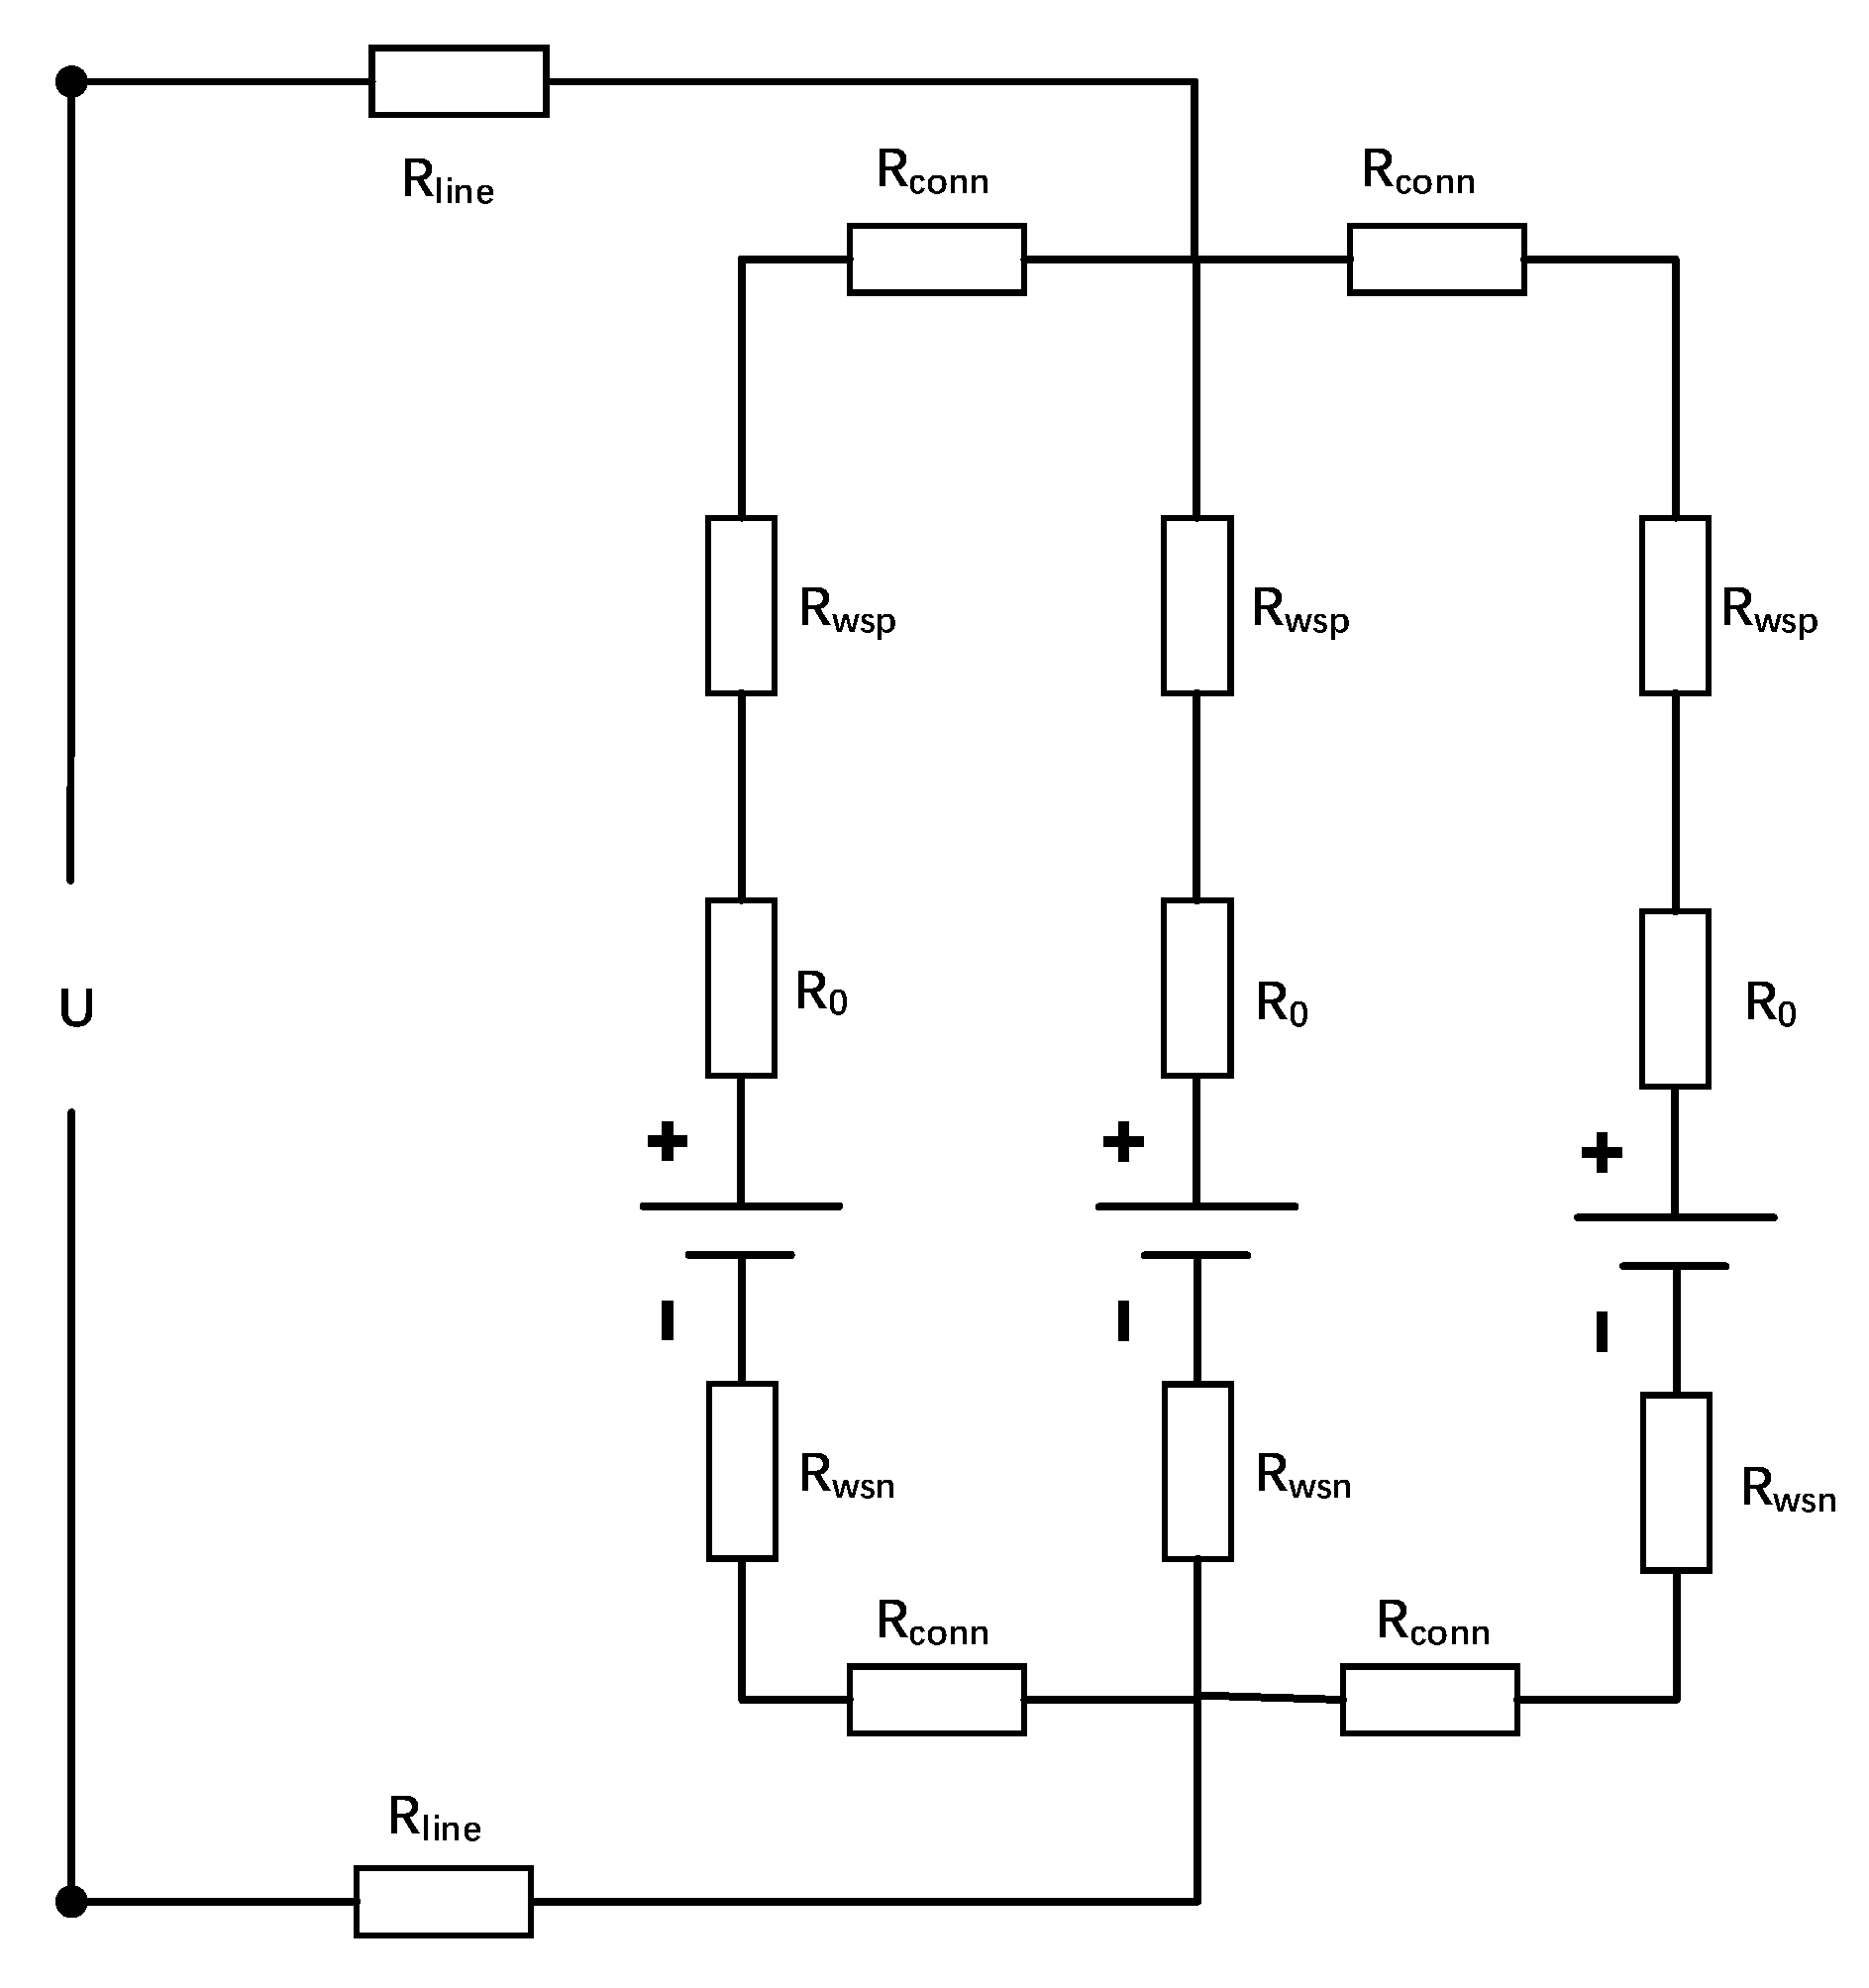
3.2. Optimisation Analysis of Battery Pack Connection Structure
3.2.1. Simulation Analysis of Diagonal Connection Structure
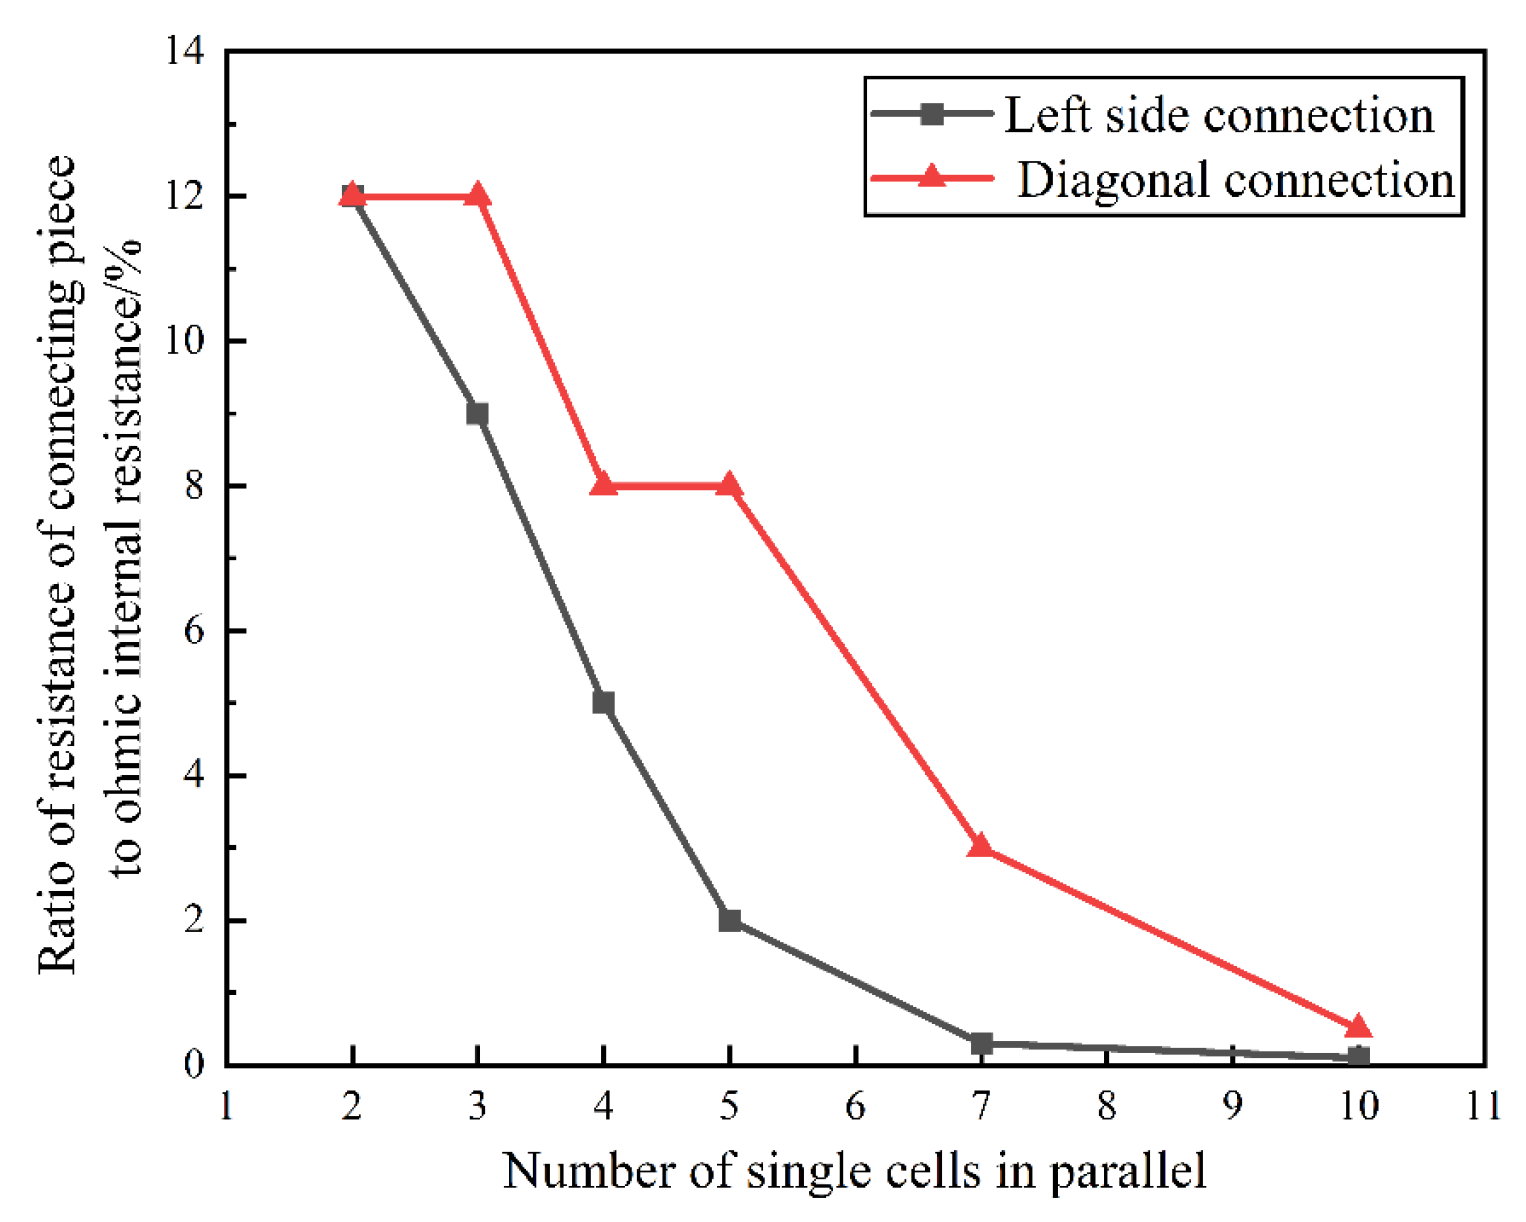
3.2.2. Simulation Analysis of Resistance Matching of Connecting Tabs
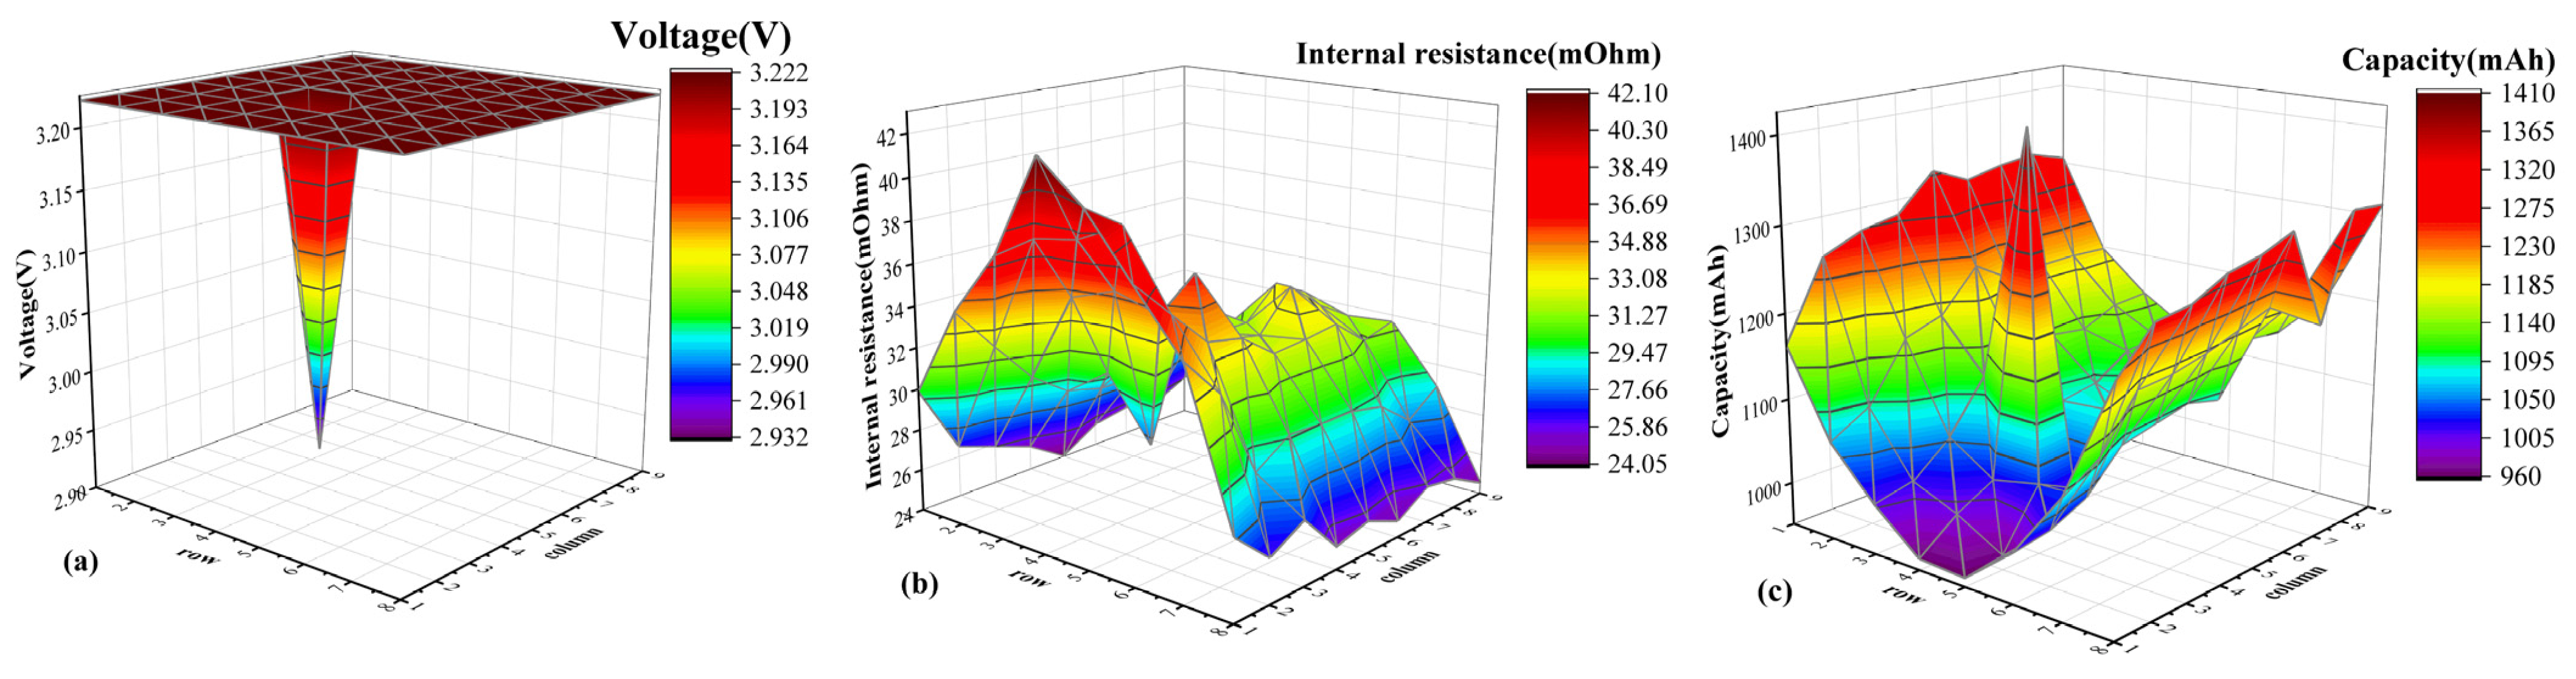
3.3. Experimental Verification of Simulation Results of Battery Packs with Different Connection Structures
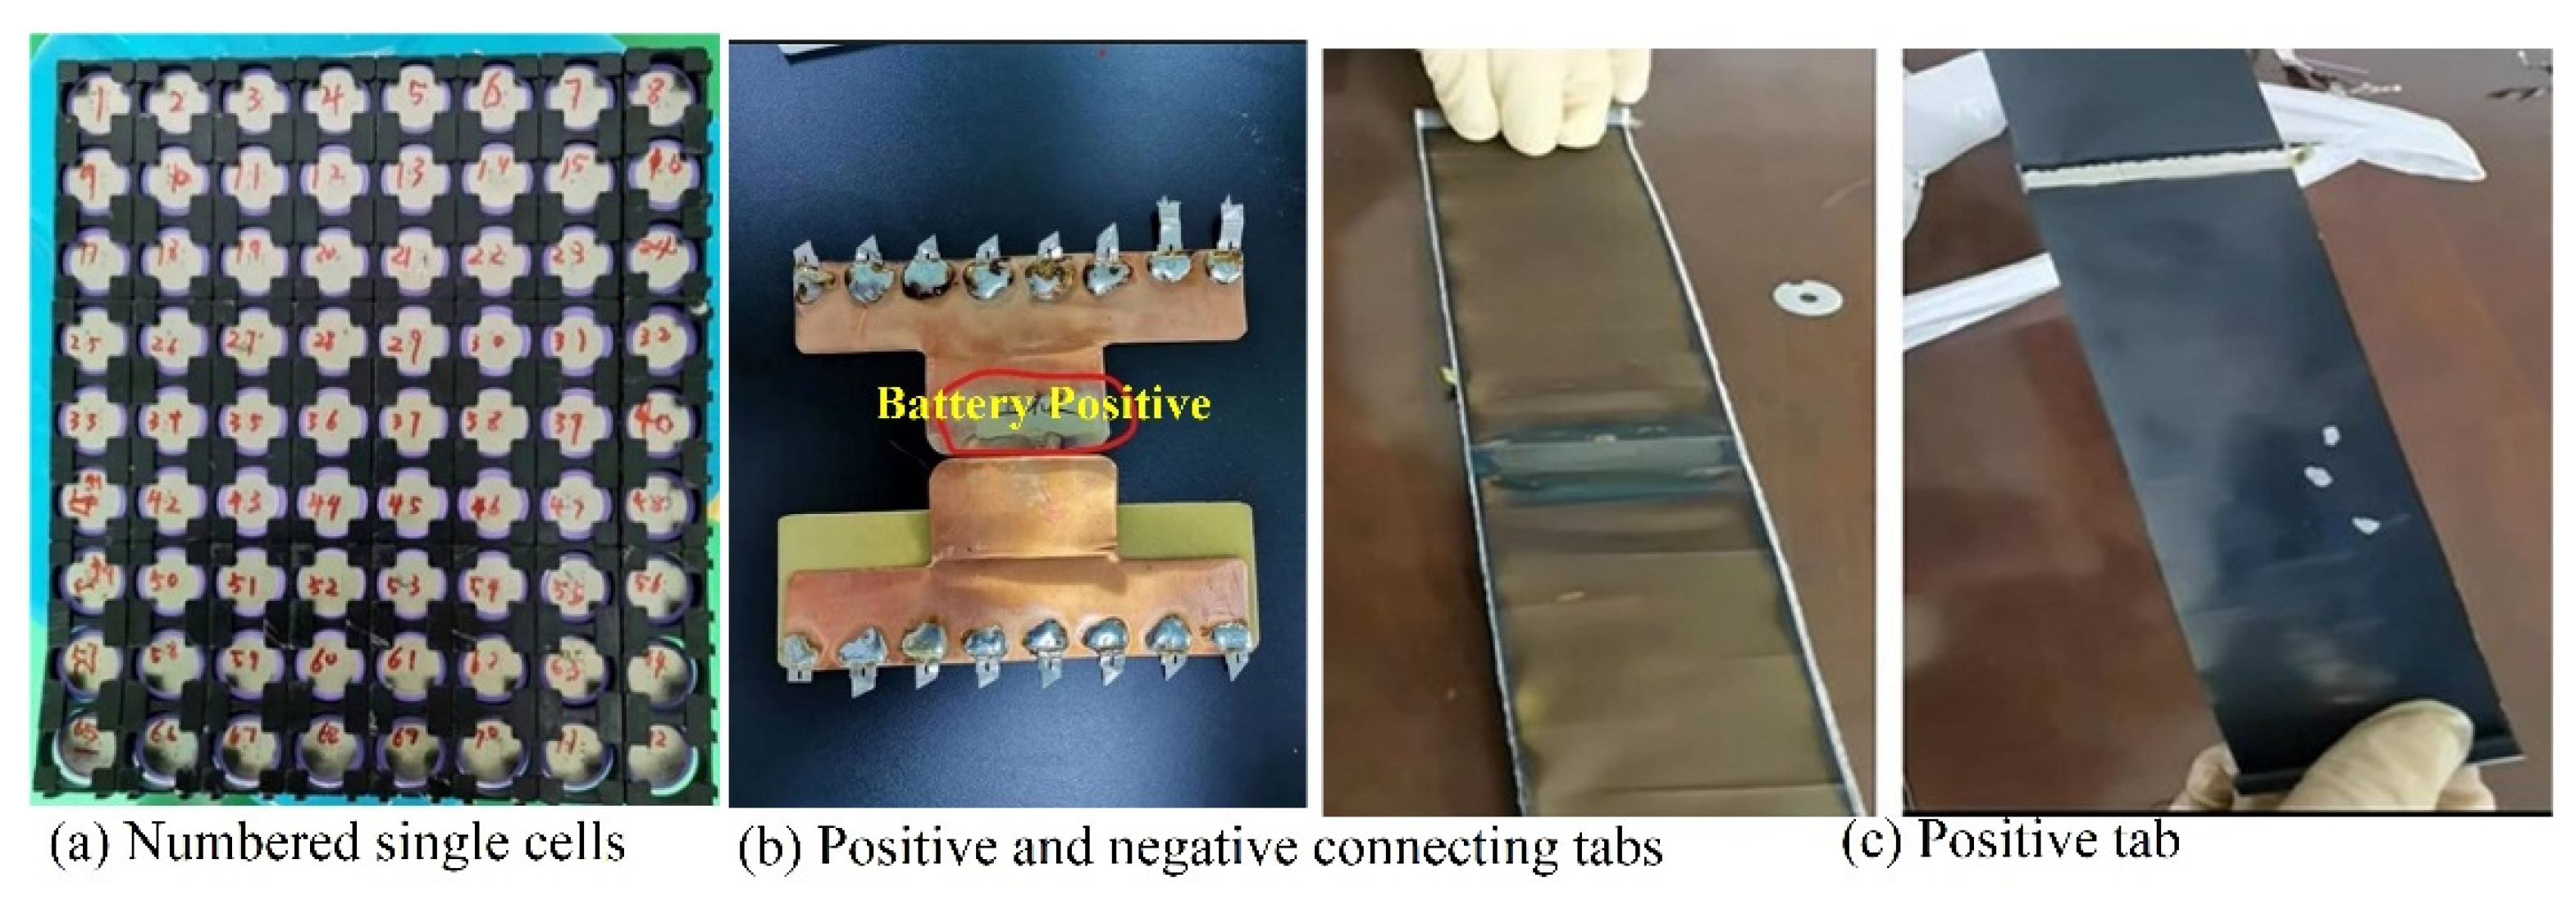
3.3.1. Experimental Design
- (1)
- 1 C constant-current charging to 3.65 V, then constant-voltage charging to a cutoff current of 100 mA;
- (2)
- Stand it for 10 min;
- (3)
- 1 C constant current discharge to 2 V;
- (4)
- Stand it for 10 min;
- (5)
- Repeat steps 1–4 until 300 cycles are completed.
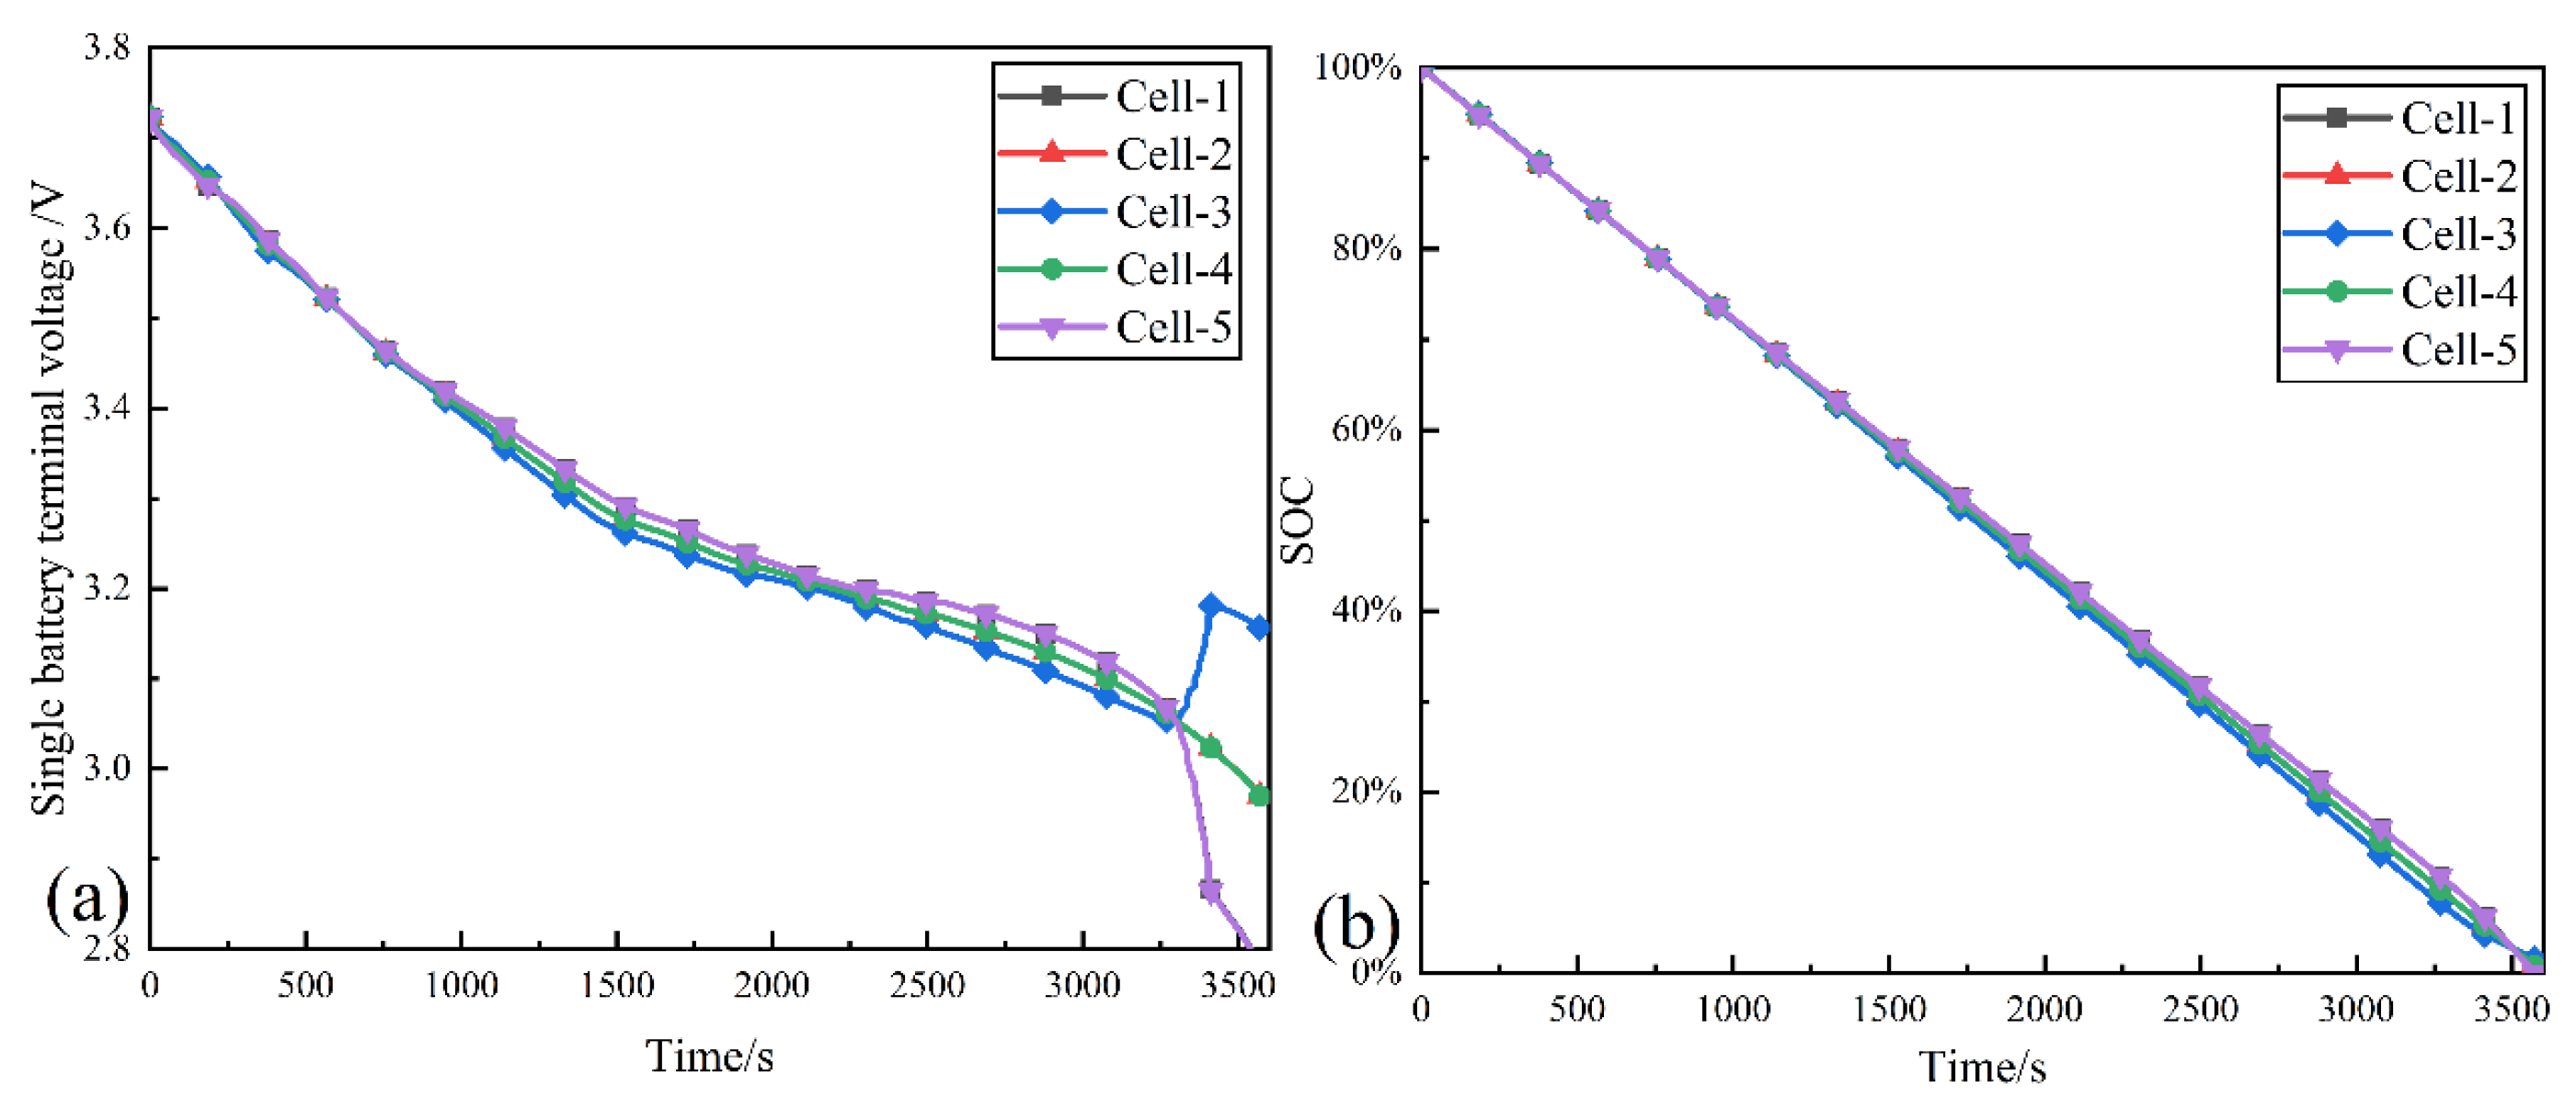
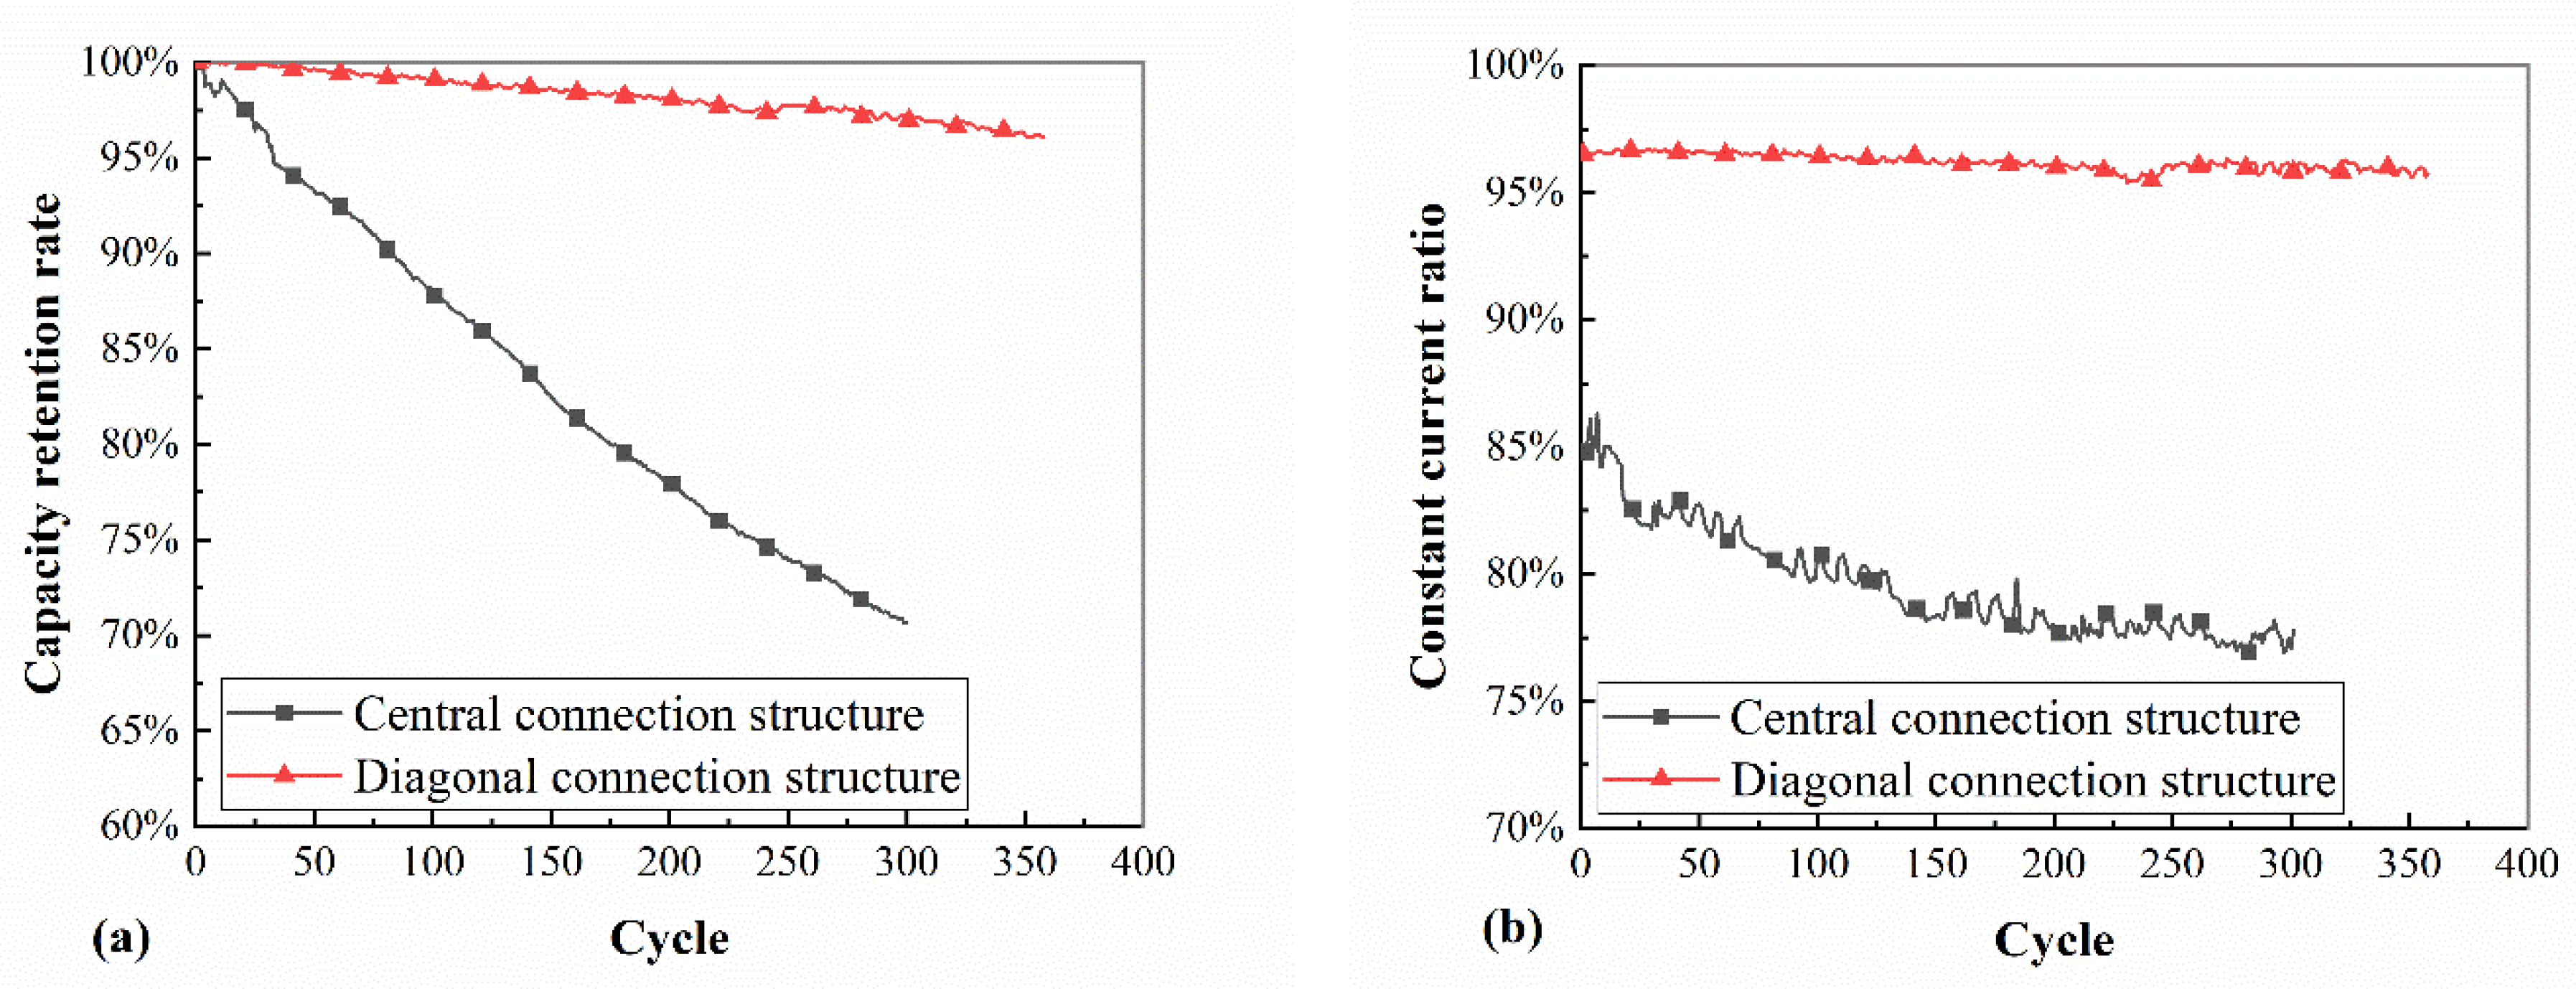
3.3.2. Analysis of Experimental Results
4. Conclusions
- (1)
- The current between the cells will be different due to the existence of the resistance of the connecting plate. The closer the battery cell is to the pole, the smaller its connecting plate resistance, the greater the current passing through it, and the easier it is to reach the aging state first.
- (2)
- The terminal voltage and SOC changes of each battery cell of the diagonal-connection structure have a higher degree of fitting over time and better consistency. The experimental verification shows that the capacity of the diagonal-connection structure decays by less than 5% after 350 cycles, its constant current ratio is very stable, and the attenuation of 300 charge/discharge cycles is only 1%.
Author Contributions
Funding
Data Availability Statement
Conflicts of Interest
References
- Wang, Y.; Cai, H.; Hu, X.; Liu, P.; Yan, Q.; Cheng, Y. Data-driven method for estimating emission factors of multiple pollutants from excavators based on portable emission measurement system and online driving characteristic identification. Sci. Total Environ. 2024, 912, 169472. [Google Scholar] [CrossRef]
- Luo, M.; Lin, X.; Feng, J.; Ling, Z.; Zhang, Z.; Fang, X. Fast Self-Preheating System and Energy Conversion Model for Lithium-Ion Batteries under Low-Temperature Conditions. J. Power Sources 2023, 565, 232897. [Google Scholar] [CrossRef]
- Wang, Y.; Zhang, X.; Chen, Z. Low Temperature Preheating Techniques for Lithium-Ion Batteries: Recent Advances and Future Challenges. Appl. Energy 2022, 313, 118832. [Google Scholar] [CrossRef]
- Li, Y.; Tang, W.; Chen, Y.; Liu, J.; Lee, C.F. Potential of Acetone-Butanol-Ethanol (ABE) as a Biofuel. Fuel 2019, 242, 673–686. [Google Scholar] [CrossRef]
- Li, Y.; Tang, W.; Abubakar, S.; Wu, G. Construction of a Compact Skeletal Mechanism for Acetone–n–Butanol–Ethanol (ABE)/Diesel Blends Combustion in Engines Using a Decoupling Methodology. Fuel Process. Technol. 2020, 209, 106526. [Google Scholar] [CrossRef]
- Dunn, B.; Kamath, H.; Tarascon, J.-M. Electrical Energy Storage for the Grid: A Battery of Choices. Science 2011, 334, 928–935. [Google Scholar] [CrossRef]
- Wang, Y.; Yin, W.; Yan, Q.; Cheng, Y. Emission Characteristics of Particulate Matter Emitted by Typical Off-Road Construction Machinery. Environ. Sci. Pollut. Res. 2022, 29, 44220–44232. [Google Scholar] [CrossRef]
- Kim, J.; Oh, J.; Lee, H. Review on Battery Thermal Management System for Electric Vehicles. Appl. Therm. Eng. 2019, 149, 192–212. [Google Scholar] [CrossRef]
- Thackeray, M.M.; Wolverton, C.; Isaacs, E.D. Electrical Energy Storage for Transportation—Approaching the Limits of, and Going beyond, Lithium-Ion Batteries. Energy Environ. Sci. 2012, 5, 7854. [Google Scholar] [CrossRef]
- Tarascon, J.-M.; Armand, M. Issues and Challenges Facing Rechargeable Lithium Batteries. Nature 2001, 414, 359–367. [Google Scholar] [CrossRef]
- Baumann, M.; Wildfeuer, L.; Rohr, S.; Lienkamp, M. Parameter Variations within Li-Ion Battery Packs–Theoretical Investigations and Experimental Quantification. J. Energy Storage 2018, 18, 295–307. [Google Scholar] [CrossRef]
- Brand, M.J.; Kolp, E.I.; Berg, P.; Bach, T.; Schmidt, P.; Jossen, A. Electrical Resistances of Soldered Battery Cell Connections. J. Energy Storage 2017, 12, 45–54. [Google Scholar] [CrossRef]
- Offer, G.J.; Yufit, V.; Howey, D.A.; Wu, B.; Brandon, N.P. Module Design and Fault Diagnosis in Electric Vehicle Batteries. J. Power Sources 2012, 206, 383–392. [Google Scholar] [CrossRef]
- Duan, B.; Li, Z.; Gu, P.; Zhou, Z.; Zhang, C. Evaluation of Battery Inconsistency Based on Information Entropy. J. Energy Storage 2018, 16, 160–166. [Google Scholar] [CrossRef]
- Feng, F.; Hu, X.; Liu, K.; Che, Y.; Lin, X.; Jin, G.; Liu, B. A Practical and Comprehensive Evaluation Method for Series-Connected Battery Pack Models. IEEE Trans. Transp. Electrif. 2020, 6, 391–416. [Google Scholar] [CrossRef]
- Baumhöfer, T.; Brühl, M.; Rothgang, S.; Sauer, D.U. Production Caused Variation in Capacity Aging Trend and Correlation to Initial Cell Performance. J. Power Sources 2014, 247, 332–338. [Google Scholar] [CrossRef]
- Kenney, B.; Darcovich, K.; MacNeil, D.D.; Davidson, I.J. Modelling the Impact of Variations in Electrode Manufacturing on Lithium-Ion Battery Modules. J. Power Sources 2012, 213, 391–401. [Google Scholar] [CrossRef]
- Dubarry, M.; Vuillaume, N.; Liaw, B.Y. Origins and Accommodation of Cell Variations in Li-Ion Battery Pack Modeling. Int. J. Energy Res. 2010, 34, 216–231. [Google Scholar] [CrossRef]
- Roscher, M.A.; Bohlen, O.S.; Sauer, D.U. Reliable State Estimation of Multicell Lithium-Ion Battery Systems. IEEE Trans. Energy Convers. 2011, 26, 737–743. [Google Scholar] [CrossRef]
- Wang, Y.; Zhao, Y.; Zhou, S.; Yan, Q.; Zhan, H.; Cheng, Y.; Yin, W. Impact of Individual Cell Parameter Difference on the Performance of Series–Parallel Battery Packs. ACS Omega 2023, 8, 10512–10524. [Google Scholar] [CrossRef]
- Wang, Y.; Liu, P.; Jin, X.; Zhang, K.; Cheng, Y.; Yin, W. Design and Experiment of a Novel Stepwise Preheating System for Battery Packs Coupled with Non-Dissipative Balancing Function Based on Supercapacitors. J. Energy Storage 2023, 66, 107444. [Google Scholar] [CrossRef]
- Zheng, Y.; Han, X.; Lu, L.; Li, J.; Ouyang, M. Lithium Ion Battery Pack Power Fade Fault Identification Based on Shannon Entropy in Electric Vehicles. J. Power Sources 2013, 223, 136–146. [Google Scholar] [CrossRef]
- Wang, L.; Cheng, Y.; Zou, J. Battery Available Power Prediction of Hybrid Electric Vehicle Based on Improved Dynamic Matrix Control Algorithms. J. Power Sources 2014, 261, 337–347. [Google Scholar] [CrossRef]
- Wang, L.; Pan, C.; Liu, L.; Cheng, Y.; Zhao, X. On-Board State of Health Estimation of LiFePO4 Battery Pack through Differential Voltage Analysis. Appl. Energy 2016, 168, 465–472. [Google Scholar] [CrossRef]
- Kim, G.-H.; Smith, K.; Ireland, J.; Pesaran, A. Fail-Safe Design for Large Capacity Lithium-Ion Battery Systems. J. Power Sources 2012, 210, 243–253. [Google Scholar] [CrossRef]
- Zheng, Y.; Ouyang, M.; Lu, L.; Li, J.; Han, X.; Xu, L.; Ma, H.; Dollmeyer, T.A.; Freyermuth, V. Cell State-of-Charge Inconsistency Estimation for LiFePO4 Battery Pack in Hybrid Electric Vehicles Using Mean-Difference Model. Appl. Energy 2013, 111, 571–580. [Google Scholar] [CrossRef]
- Su, H.; Zhang, H.; Tang, X.; Jing, Y. Influence of Connecting Plate Resistance upon LiFePO4 Battery Performance. Appl. Energy 2015, 147, 353–360. [Google Scholar] [CrossRef]
- Hu, X.; Li, S.; Peng, H. A Comparative Study of Equivalent Circuit Models for Li-Ion Batteries. J. Power Sources 2012, 198, 359–367. [Google Scholar] [CrossRef]
- He, H.; Xiong, R.; Fan, J. Evaluation of Lithium-Ion Battery Equivalent Circuit Models for State of Charge Estimation by an Experimental Approach. Energies 2011, 4, 582–598. [Google Scholar] [CrossRef]
- Wang, Y.; Cheng, Y.; Xiong, Y.; Yan, Q. Estimation of Battery Open-Circuit Voltage and State of Charge Based on Dynamic Matrix Control-Extended Kalman Filter Algorithm. J. Energy Storage 2022, 52, 104860. [Google Scholar] [CrossRef]
- Huria, T.; Ceraolo, M.; Gazzarri, J.; Jackey, R. High Fidelity Electrical Model with Thermal Dependence for Characterization and Simulation of High Power Lithium Battery Cells. J. Power Sources 2012, 1–8. [Google Scholar] [CrossRef]
- Wang, Y.; Yin, W.; Yan, Q.; Cheng, Y. Impact of Sensor Accuracy of Battery Management System on SOC Estimation of Electric Vehicle Based on EKF Algorithm. In Proceedings of the 2021 5th CAA International Conference on Vehicular Control and Intelligence (CVCI), Tianjin, China, 29–31 October 2021; pp. 1–6. [Google Scholar] [CrossRef]
- Wang, Y.; Hu, X.; Deng, X.; Cheng, Y.; Yin, W. Design and experiment of a low-temperature charging preheating system for power battery packs with an integrated dissipative balancing function. J. Power Sources 2023, 588, 233740. [Google Scholar] [CrossRef]
- Kim, J.; Shin, J.; Chun, C.; Cho, B.H. Stable configuration of a li-ion series battery pack based on a screening process for improved voltage/SOC balancing. IEEE Trans. Power Electron. 2012, 27, 411–424. [Google Scholar] [CrossRef]


| Parameter | Specification |
|---|---|
| Material | Ternary lithium-ion battery |
| Size | Diameter 18 mm, height 65 mm |
| Mass | 44 g |
| Nominal capacity | 2 Ah |
| Nominal voltage | 3.7 V |
| Cut-off voltage | Charging: 4.2 V Discharging: 2.75 V |
| Temperature range | Charging: 0~60 °C Discharging: −20~60 °C |
| Maximum continuous current | 5 C |
| Internal resistance | ≤20 mΩ |
| Equipment | Model | Specification |
|---|---|---|
| Programmable temperature cycling test chamber | Y70-1-DZ | Programmable temperature range: −60 °C~150 °C (±0.1 °C) Temperature fluctuation: ≤±0.5 °C Temperature resolution: 0.01 °C |
| Power battery performance test platform | S08-5-100-DZ | Voltage: 0~5 V (0.1%FS) Current: 500 mA~100 A (0.1%FS) |
| Power battery performance test platform | BTS550C8 | Voltage: 0~5 V (0.1%FS) Current: 150 mA~50 A (0.1%FS) |
| Dynamic signal acquisition card | ART-USB8812 | Channel number: 4 Resolution: 24-bit Input range: ±11 V, ±5.5 V Sampling mode: Synchronous acquisition Sampling frequency: 8 Hz~216 kHz Input impedance: 1 MΩ |
| Coefficient | Value |
|---|---|
| a | −1.06 × 10⁴ |
| b | 1.15 × 10⁵ |
| c | −5.60 × 10⁵ |
| d | 1.60 × 10⁶ |
| e | −2.88 × 10⁶ |
| f | 4.21 × 10⁶ |
| g | −4.06 × 10⁶ |
| h | 2.61 × 10³ |
| i | −1.13 × 10⁶ |
| j | 3.16 × 10⁵ |
| k | −5.58 × 10⁴ |
| l | 5.58 × 10³ |
| m | −2.42 |
| n | 3.2 |
| SOC | R0/mΩ | Rp/mΩ | Cp/kF |
|---|---|---|---|
| 0 | 5.825 | 7.925 | 3.043 |
| 0.1 | 4.225 | 9.275 | 3.660 |
| 0.2 | 3.450 | 3.325 | 9.033 |
| 0.3 | 3.075 | 3.325 | 16.063 |
| 0.4 | 3.025 | 3.325 | 19.771 |
| 0.5 | 2.975 | 3.325 | 21.292 |
| 0.6 | 2.975 | 3.325 | 16.742 |
| 0.7 | 2.925 | 3.325 | 14.654 |
| 0.8 | 2.925 | 2.925 | 19.229 |
| 0.9 | 2.925 | 2.925 | 18.287 |
| Connection Structure Method | Average SOC/% | SOC of Cell1/% | SOC of Cell2/% | SOC of Cell3/% | SOC of Cell4/% | SOC of Cell5/% |
|---|---|---|---|---|---|---|
| One-side connection structure | 6.47 | 2.76 | 4.61 | 6.47 | 8.32 | 10.18 |
| Central-connection structure | 0.67 | 0.14 | 0.83 | 1.53 | 0.81 | 0.06 |
| Parameters | Value |
|---|---|
| Materials for positive electrodes | LiFePO4 |
| Rated capacity | 110 Ah |
| Rated voltage | 3.2 V |
| Internal resistance | 2.1 mΩ |
| Battery cell group requirements | Internal resistance: 13–15 mΩ, Voltage: 3.2–3.3 V |
Disclaimer/Publisher’s Note: The statements, opinions and data contained in all publications are solely those of the individual author(s) and contributor(s) and not of MDPI and/or the editor(s). MDPI and/or the editor(s) disclaim responsibility for any injury to people or property resulting from any ideas, methods, instructions or products referred to in the content. |
© 2024 by the authors. Licensee MDPI, Basel, Switzerland. This article is an open access article distributed under the terms and conditions of the Creative Commons Attribution (CC BY) license (https://creativecommons.org/licenses/by/4.0/).
Share and Cite
Zhang, H.; Zhang, Y.; Huang, L.; Song, J.; Huang, Z. Study on the Influence of Connection Structure between Batteries on Battery Pack Performance. Electronics 2024, 13, 817. https://doi.org/10.3390/electronics13050817
Zhang H, Zhang Y, Huang L, Song J, Huang Z. Study on the Influence of Connection Structure between Batteries on Battery Pack Performance. Electronics. 2024; 13(5):817. https://doi.org/10.3390/electronics13050817
Chicago/Turabian StyleZhang, Hao, Yanting Zhang, Lumeng Huang, Jianfeng Song, and Zhangcong Huang. 2024. "Study on the Influence of Connection Structure between Batteries on Battery Pack Performance" Electronics 13, no. 5: 817. https://doi.org/10.3390/electronics13050817
APA StyleZhang, H., Zhang, Y., Huang, L., Song, J., & Huang, Z. (2024). Study on the Influence of Connection Structure between Batteries on Battery Pack Performance. Electronics, 13(5), 817. https://doi.org/10.3390/electronics13050817