Article

Total Power Factor Smart Contract with Cyber Grid Guard Using Distributed Ledger Technology for Electrical Utility Grid with Customer-Owned Wind Farm

1
Oak Ridge National Laboratory, Electrification and Energy Infrastructures Division, One Bethel Valley Road, Oak Ridge, TN 37831, USA
2
Oak Ridge National Laboratory, Cyber Resilience and Intelligence Division, One Bethel Valley Road, Oak Ridge, TN 37831, USA
*
Author to whom correspondence should be addressed.
Electronics 2024, 13(20), 4055; https://doi.org/10.3390/electronics13204055
Submission received: 31 August 2024 / Revised: 9 October 2024 / Accepted: 14 October 2024 / Published: 15 October 2024

Abstract

:
In modern electrical grids, the numbers of customer-owned distributed energy resources (DERs) have increased, and consequently, so have the numbers of points of common coupling (PCC) between the electrical grid and customer-owned DERs. The disruptive operation of and out-of-tolerance outputs from DERs, especially owned DERs, present a risk to power system operations. A common protective measure is to use relays located at the PCC to isolate poorly behaving or out-of-tolerance DERs from the grid. Ensuring the integrity of the data from these relays at the PCC is vital, and blockchain technology could enhance the security of modern electrical grids by providing an accurate means to translate operational constraints into actions/commands for relays. This study demonstrates an advanced power system application solution using distributed ledger technology (DLT) with smart contracts to manage the relay operation at the PCC. The smart contract defines the allowable total power factor (TPF) of the DER output, and the terms of the smart contract are implemented using DLT with a Cyber Grid Guard (CGG) system for a customer-owned DER (wind farm). This article presents flowcharts for the TPF smart contract implemented by the CGG using DLT. The test scenarios were implemented using a real-time simulator containing a CGG system and relay in-the-loop. The data collected from the CGG system were used to execute the TPF smart contract. The desired TPF limits on the grid-side were between +0.9 and +1.0, and the operation of the breakers in the electrical grid and DER sides was controlled by the relay consistent with the provisions of the smart contract. The events from the real-time simulator, CGG, and relay showed a successful implementation of the TPF smart contract with CGG using DLT, proving the efficacy of this approach in general for implementing electrical grid applications for utilities with connections to customer-owned DERs.

1. Introduction

The number of distributed energy resources (DERs) interconnected with utility systems, as well as the complexity of the configurations of these interconnections, has significantly increased [1]. The characteristics of electric power produced by customer-owned DERs using renewable energy sources (wind or photovoltaic) are often not as stable. Therefore, DER-produced electricity may exhibit undesirable variations from the norm in frequency, voltage, harmonic content, reliability/continuity, power factor, and stability. One approach to safely incorporating DERs into the power system is to install a relay at the point of common coupling (PCC) that can isolate the DER from the power system if the characteristics of the DER’s electricity production become unstable or cannot be tolerated. The approach presented in this article defines the rules of engagement for the DER (customer-owned wind farm) to connect to the electrical utility grid through a smart contract and transmit the operating and status data securely using distributed ledger technology (DLT), which are implemented using a Cyber Grid Guard (CGG) hardware/firmware system using a relay at the PCC when the DER must be disconnected from the utility in order to maintain power system stability.
Smart contracts are digital contracts stored on a distributed ledger that are automatically executed when predetermined terms and conditions are met [2] between an electrical grid utility and customer-owned DERs. The large and continuing increase in customer-owned DERs is accompanied by a corresponding increase in the number of relays deployed at the PCCs between the electrical grid utility and customer-owned DERs. Each renewable DER and relay require communications and data management at the PCC. The integrity of the data communicated among the DERs, the PCC relays, and the bulk power system is vital. DLTs are decentralized storage platforms that maintain data integrity without requiring mutual trust among participants [3].
Security, scalability, and governance are prominent subjects of recent advancements in DLT and smart contracts. Security is still a critical issue, with ongoing efforts to improve smart contract safety using libraries like OpenZeppelin and formal verification methods [4]. For example, composite smart contracts, which are smart contracts that call upon other smart contracts, introduce additional security challenges. These could be addressed using finite-state machine models and checking techniques. Other relevant formal methods include the Observe-based Statistical Model Checking (OSM) framework, which has been designed for the verification of complex software systems [5]. The BlockASP framework leverages Aspect-Oriented Programming (AOP) to address the dynamic nature of blockchain systems, including smart contracts, by enabling flexible instrumentation for monitoring runtime events and facilitating analysis [6]. Scalability is addressed through techniques like sharding [7,8] and rollups [9,10], particularly in the context of public DLTs, and off-chain storage strategies [11]. DLT governance encompasses the policies and procedures that help DLT development and usage adhere to both legal requirements and ethical responsibilities. Transitioning to consensus mechanisms like Proof-of-Stake (PoS) from Proof-of-Work (PoW) reduces resource consumption and enhances scalability [12], which is a significant trend pertinent to incorporating DLT into the regulated energy sector to meet regulatory standards [13].
Traditional cybersecurity solutions in protective relays and centralized monitoring systems managing DERs lack the decentralization, transparency, and immutability of smart contracts and DLT [14]. Smart contracts execute predefined agreements automatically and independently [15]. Cryptographic primitives such as hashing and digital signatures are used by DLTs to protect data integrity and secure sensitive information against unauthorized access [16]. These features make smart contracts and DLT well-suited for managing customer-owned DERs and their relays, as they can provide a secure, transparent, and tamper-evident means of translating operational constraints into relay actions/commands. The use of DLT to solve cybersecurity problems and improve resilience within electrical grids has been examined in recent studies, particularly for distributed generation systems [17]. For example, one study implemented a prototype using Hyperledger Fabric DLT and IoT for metering and billing small-scale consumers, emphasizing its scalability, low energy requirements, and reduced vulnerability to cyberattacks due to its data encryption capabilities and decentralized architecture [18]. A fault location and traceability system based on DLT was developed to protect IoT sensor data integrity, which is vital for grid security and reliability [19]. A realistic electric grid substation testbed was developed for researching fault detection and cyberattack scenarios involving DERs [20], which was used for executing the total power factor experiments described in this study.
Most potential energy applications of DLT have been based on software simulations [21,22,23,24,25]. However, software simulation algorithms cannot always be directly integrated with intelligent electronic devices (IEDs) like relays and meters because of measurement equipment boundaries. For example, problems could arise when IEDs have different measurement condition behaviors. When the breakers are opened, IEDs could measure a frequency of 60 Hz and/or power factor of 1.00 [26] or have different power factor sign conventions depending on IEEE and IEC standards [27]. This study used an advanced real-time simulator with a hardware in-the-loop (HIL) testbed, integrating the CGG system with DLT and a smart contract for a Schweitzer Engineering Laboratories (SEL) 700GT relay. This advanced testbed was essential for studying blockchain applications because it is based on using real relays and CGG with DLT and smart contracts. This testbed was established at Oak Ridge National Laboratory [28,29,30].
In this research, the CGG with DLT was combined with smart contracts to study the control application for improving the total power factor (TPF) between the electrical utility grid side and customer-owned wind farm side to reduce the power line losses generated by the reactive energy. This TPF smart contract was applied with the CGG using DLT and one SEL 700GT relay that controls the breakers at the grid and customer-owned DER sides of the PCC. The CGG with DLT and smart contract demonstrated a way to improve the integrity of data received from the breakers at the grid and customer-owned DER (wind farm) sides. The TPF smart contract was activated with a time window of 450 s because the frequency protection elements could have a maximum time setting of 400 s [26], and traditional power quality improvement methods (like load shedding, capacitor banks or transformer/load tap changers) could be applied on the utility grid side. Also, this 450 s time window avoids having the TPF smart contract operating breakers during anomalous events like disturbances or electrical faults. The TPF smart contract flowchart was developed by using the power factor explanations [31] and setting the condition of the good power factor between +0.90 and +1.00 because usually electrical utilities adjust customer bills for power factors smaller than +0.90 [32].
An HIL real-time simulator testbed platform was utilized in this smart contract experimental model, with a real CGG using DLT and one relay in the PCC, instead of using smart contract applications with only software simulations [33,34,35,36]. Therefore, this testbed platform allowed us to create a more realistic TPF smart contract algorithm, based on the relay TPF measurement observed conditions. This experimental model permitted us to compare and measure the different results of the relay versus the simulation in the PCC when the breaker was opened. In the simulation, the TPF depends on the “true power/apparent power” ratio, and when the breaker was opened and phase current magnitudes were zero, the numerator and denominator of the TPF resulted in an indeterminate TPF. However, the relay measured a TPF of +1.00 when the breaker was opened based on the relay. Another consideration is that the signs for measuring the TPF in a relay or meter could have different conventions, while the IEC standard defines the positive and negative power factor when the true power is positive and negative, respectively. On the other side, the IEEE standard defines the positive and negative power factor for leading current (capacitive effect) and lagging current (inductive effect), respectively. These TPF measurement considerations were observed when an HIL testbed platform was implemented. In this case, the relay’s behavior had shown the use of the IEC standard for the power factor sign convention based on its instruction manual [26]. The boundary condition of the opened breakers for the SEL 700GT relay, power factor limits, breaker states, and operation times were successfully integrated into the TPF smart contract with CGG using DLT at an electrical utility grid with a customer-owned DER. The novelties of this study are focused on the use of an (1) advanced power quality measurement method for operating a customer-owned DER to reduce the reactive energy on the grid-side power lines using a TPF smart contract with DLT as backup method after using capacitor banks, load shedding, or transformer/load tap changers on the grid side, (2) the development of a data security platform to use the CGG with DLT and smart contracts for securing data from the relay located at the PCC between the electrical utility grid and the customer-owned DER, and (3) an assessment of the HIL testbed platform to evaluate the TPF smart contract in an advanced substation grid testbed with a real-time simulator using DLT nodes and a protective relay instead of using only a software simulation platform. Table 1 shows the novelties of this study.
In this research article, the experimental model, power line diagrams, architecture, and equipment are described first. Then, the phase and TPF descriptions and equations with the smart contract flowcharts are described in detail. The test event plots from the real-time simulator, CGG system, and relay are presented and assessed. Finally, the main findings of this research are given, along with the possible future implementation of new smart contract applications.

2. Test Model

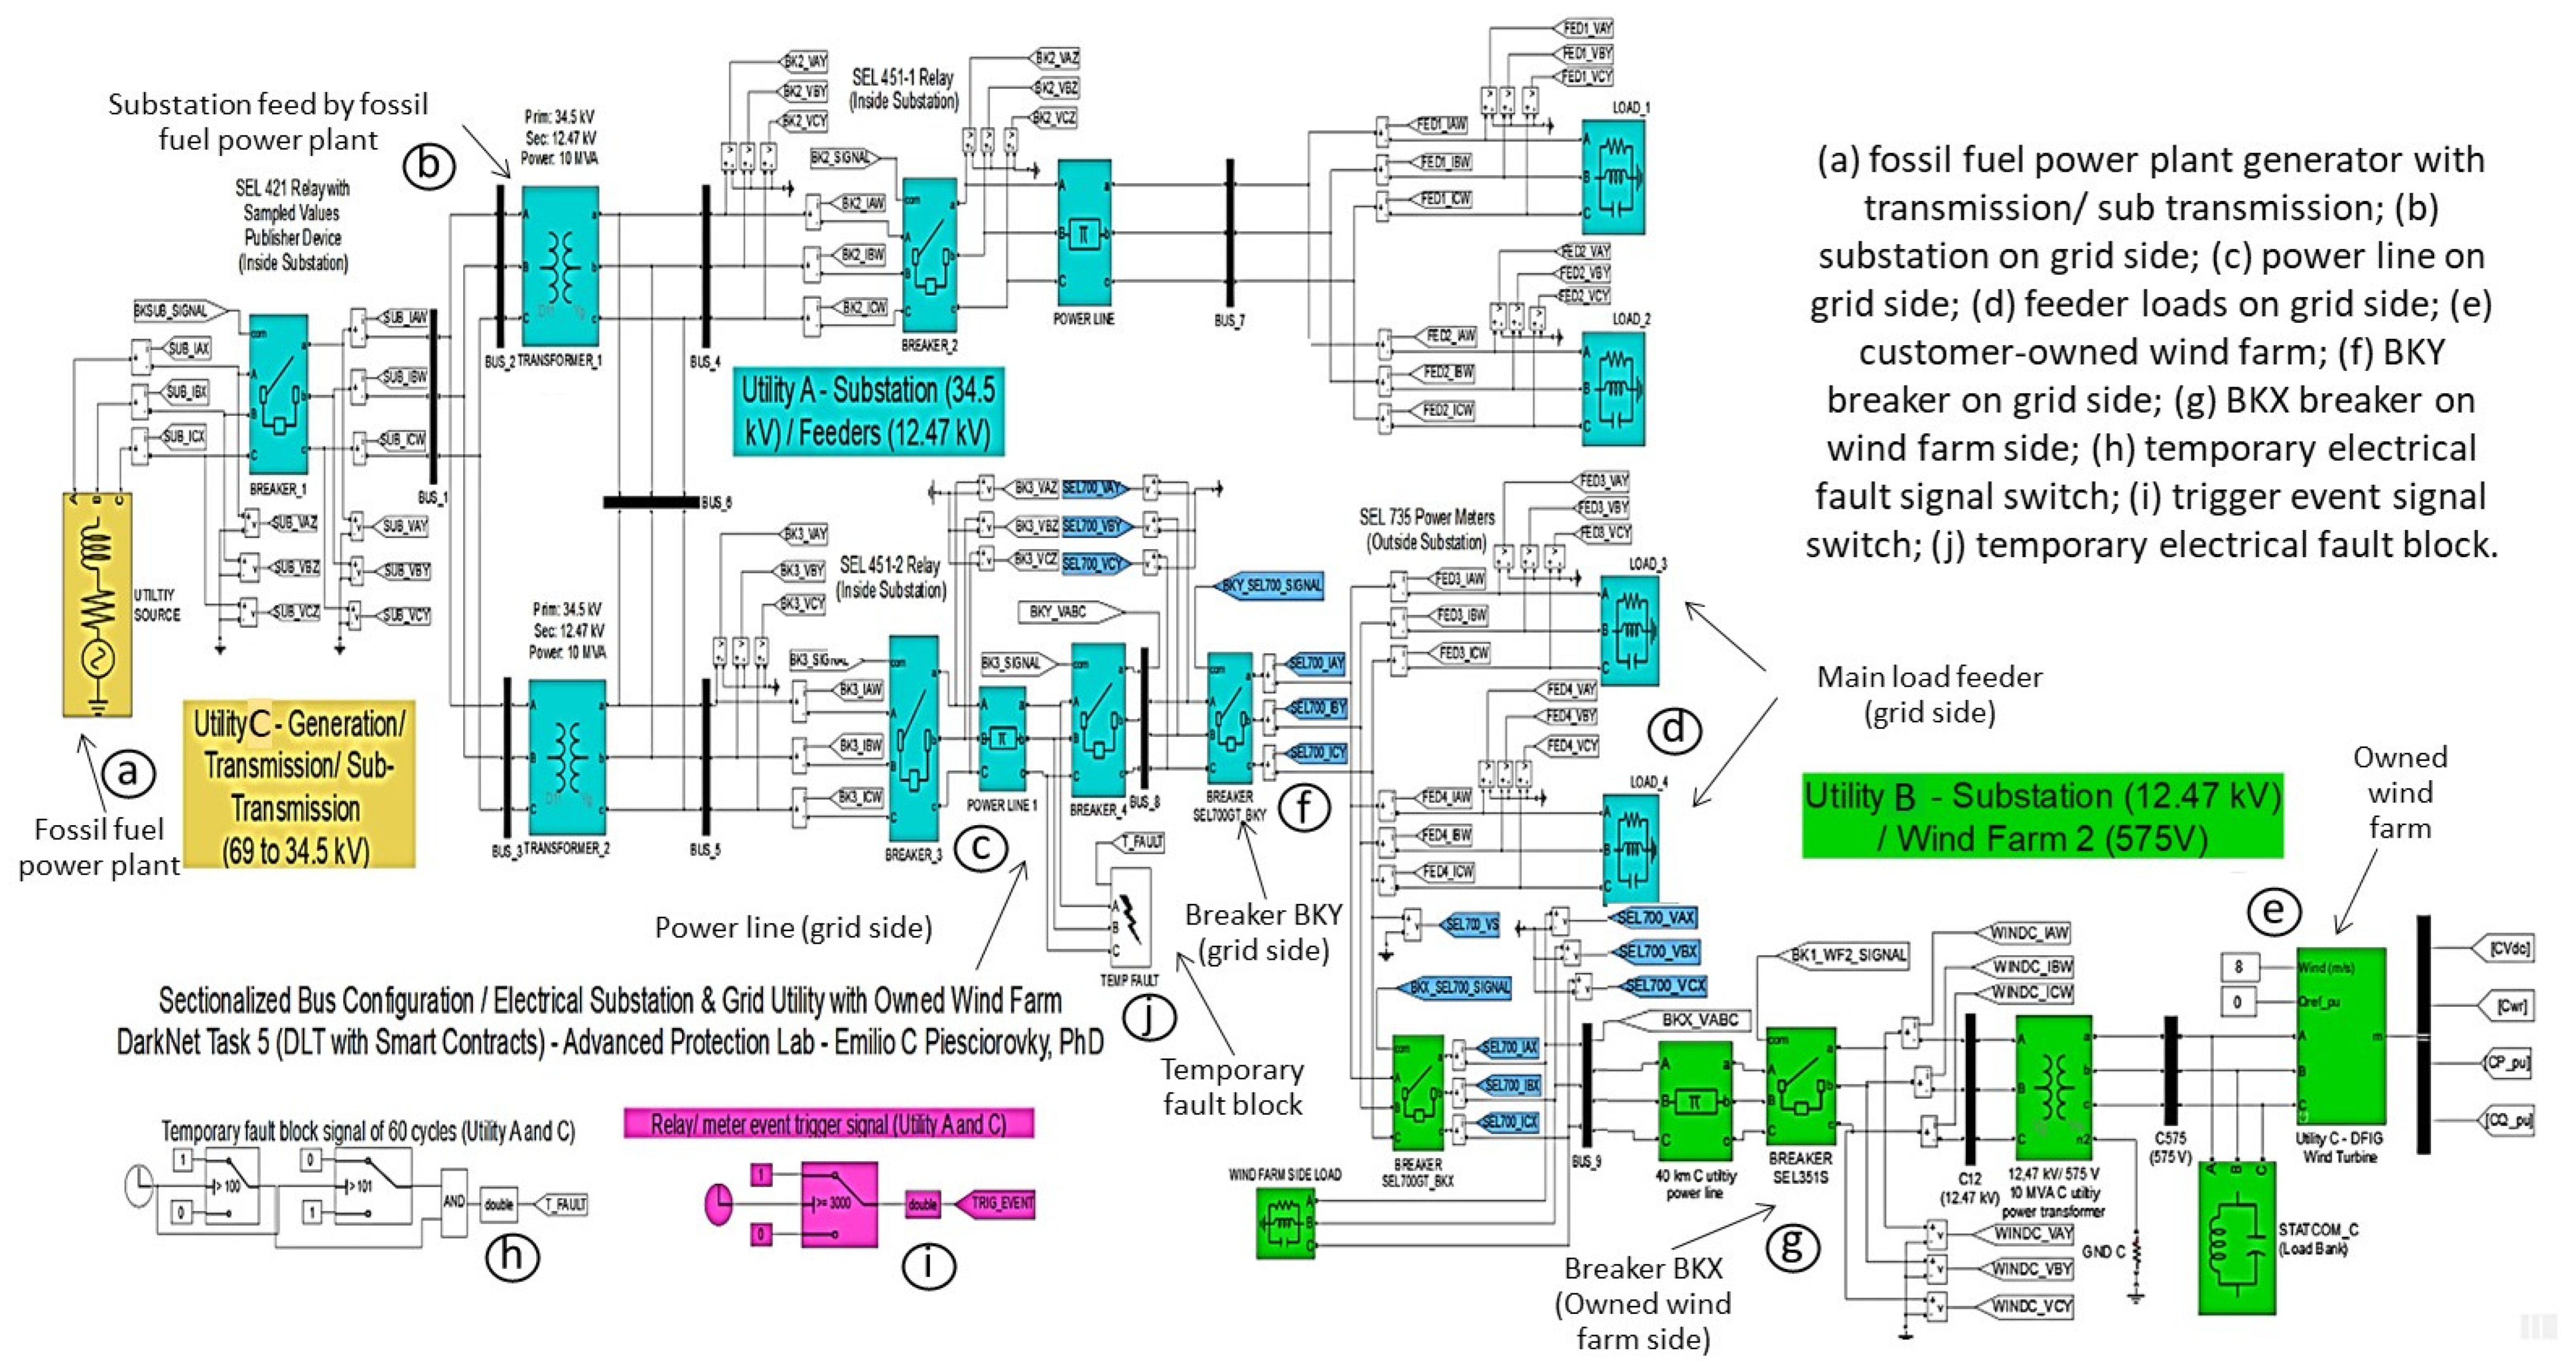
2.1. Grid and Equipment

The TPF smart contract was applied to a substation grid testbed with customer-owned wind farm, using IEDs that managed, monitored, and controlled the smart contract-based application. This testbed used a software model and a simulated electrical grid with a trigger-event system and synchronized time source. The time source enables synchronization between the relays and meters and, consequently, the CGG system. The trigger-event system was implemented in the testbed for recording the events of the relay at the desired time.
The objective of this testbed was to assess whether the DLT architecture was successful in executing the TPF smart contract between the electrical utility grid and customer-owned wind farm. A diagram of the equipment and electrical grid is shown in Figure 1. Figure 1a represents a sectionalized bus substation configuration [37] and electrical grid with one customer-owned DER (wind farm). Utility A has one substation with two transformers, using primary/secondary voltages of 34.5/12.47 kV, and feeders that are connected to power lines. The loads can be fed by the wind farm (Utility B) or substation (Utility A). The customer-owned DER has six 1.5 MW wind turbines (Utility B), and Utility C represents a fossil fuel power plant. In Figure 1b, the equipment rack includes the meters and relays. These IEDs (meters and relays) are wired to communication devices and a real-time simulator that are linked to a synchronized-time system. All meters [38] and relays [39,40,41] use the Generic Object-Oriented Substation Event (GOOSE) IEC 61850 protocol. In this experimental model, the test scenarios were run in the red dashed-line square area (Figure 1a) to evaluate the CGG system for the TPF smart contract, based on operating the breakers BKY (grid-side) and BKX (wind farm-side). The SEL 700GT relay measured the TPFs and states of the BKY (Utility A) and BKX (Utility B) breakers.

2.2. Testing Platform

In this study, the testbed was implemented with the CGG using DLT and smart contracts. This testbed had IEDs (meters and relays) wired to a real-time simulator. This testbed has a real-time simulator rack, relay/meter rack, and CGG rack (Figure 2). The four workstation computers in Figure 2 are the host laptop, monitoring laptop, human machine interface (HMI) laptop, and CGG laptop. The synchronized time system was implemented using a time source clock used as a master and clock displays as slaves, which were connected to the meters and relays.
Figure 3 shows the architecture of the testbed with CGG using DLT and smart contracts. In the control center, the settings of the HMI local substation, HMI control center, EmSense high-speed smart visu, and virtual machine Blueframe servers/computers are set. This architecture has four layers:
  • The first layer (the physical layer) includes the breakers, power lines, and other grid elements simulated by the real-time simulator.
  • The second layer (protection and metering layer) includes the HIL, represented by the relays and meters.
  • The third layer (the automation layer) includes the Ethernet switches and remote terminal units.
  • The fourth layer includes the CGG system, synchronized time system, trigger-event system, supervisory control and data acquisition, and HMI.
The SEL 700GT relay was connected to the trigger-event trigger system and synchronized time system. The relay recorded the test events by receiving a digital signal from the trigger-event system. In the testbed architecture, the synchronized time protocol implemented was based on the inter-range instrumentation group time code B (IRIG-B) signals for relays and meters. However, the CGG system through the Ethernet network used precision time protocol (PTP) communication. The relays transmitted IEC 61850 GOOSE messages.

2.3. Three-Phase Diagram and Real-Time Simulation Properties

In this experimental model, a three-phase diagram of the power system was created with MATLAB/Simulink (2015b) software models, which were then turned into an RT-LAB (V2020.2.2.82) software project which was integrated into a real-time simulator with meters and relays in-the-loop. The RT-LAB software is fully integrated with MATLAB/Simulink, and it enables the Simulink models to interact with the real-time simulator in real time. The RT-LAB software is a platform used for real-time simulation to develop and validate the power system application. The RT-LAB software is a multi-domain platform that provides a flexible and scalable solution for power system test scenarios, like in other research applications [42,43,44,45].
This advanced testbed platform simulated different use case scenarios for normal operation and temporary electrical faults tests. However, anomalous events related to electrical faults are not likely to be present in a real electrical grid on the field. This is because electrical fault tests are non-desired testing situations that can damage electrical equipment (power transformers, capacitor banks, power lines, generators, etc.) and/or personal staff, and/or can generate electrical grid blackouts. As such, the real-time simulator with relays and meters in-the-loop was the best testbed platform to perform tests on the TPF smart contract with the CGG using DLT. Figure 4 shows the power grid and substation with the customer-owned wind farm. A 34.5/12.47 kV voltage system was used in the substation. The wind farm used a 0.575/12.47 kV voltage system. The wind farm included six 1.5 MW wind turbines. In the substation, two power transformers were connected in parallel with two power lines and load feeders. The load feeders had 50 T and 100 T fuses [46]. In the PCC between the grid-side and wind farm-side, the SEL 700GT relay controlled the BKY (grid-side) and BKX (wind farm-side) breakers.
In the CGG with DLT and the smart contract, the BKY/BKX breaker states and TPF values were measured from the SEL 700GT relay. Then, the BKY/BKX breakers were operated based on the TPF boundary conditions. The desired TPF limits on the grid-side were between +0.90 and +1.00. The main goal was to minimize the power losses in the grid-side power line by reducing the reactive power. The BKY/BKX breakers were operated by the SEL 700GT relay through the CGG using the DLT and smart contract if the TPF at the grid-side was less than +0.90. The CGG using DLT and the smart contract were used in the PCC between the electrical utility grid and customer-owned wind farm. The integrity of data from the SEL 700GT relay at the PCC is vital, and DLT enhances the resilience of the electrical grid by securing the shared data.
Figure 4 shows a diagram of the three-phase power system. The substation grid (Utility A) can be connected to the customer-owned wind farm (Utility B). Utility C represents a large fossil power plant with a transmission and sub-transmission model (Figure 4a). Utility A has a substation (Figure 4b), power line/s (Figure 4c), and feeder loads (Figure 4d). Utility B represents a customer-owned wind farm (Figure 4e). The BKY breaker on the grid side (Figure 4f) and BKX breaker on the farm side (Figure 4g) have three-phase poles. The temporary fault block (Figure 4j) is controlled by the signals from the breaker operation circuits in Figure 4h. The trigger-event circuit (Figure 4i) generates a 24 VDC signal that is sent to relays and meters for recording the events during the simulation tests at a specific time or when the breakers are operated. The temporary fault block (Figure 4j) can generate no permanent electrical faults during 60 cycles at a specific time in the grid-side power line when the fault signal is received from the temporary fault block signal circuit (Figure 4h).
The real-time simulation tests were run with the real-time simulator and relays/meters in the loop, using MATLAB/Simulink (2015b) and the RT-LAB (V2020.2.2.82) software. In the RT-LAB project, a simulation powergui block was set up with a Discrete simulation, Tustin/Backward Euler solver, and sample time of 50 micro-seconds. Then, the real time simulation tests were started from the host computer before each simulation was run. The real-time properties were set for the target platform (OPAL-RT Linux, x86-based), real-time simulation mode (Hardware synchronized), real time communication link type (UDP/IP), time factor (1.0), and stop/pause time (600 s).

3. Theory and Equations

3.1. Power Factor

The power factor [47] is represented by Equation (1) as the ratio between the true power and the apparent power. The magnitude of the voltage and current multiplied by the cosine angle between the voltage and current is the true power. However, the apparent power is the product of the current and voltage. A power factor magnitude of less than one indicates that the voltage and current are not in phase. A negative power factor occurs when the true power flows back toward the source.
P F = P S = V × I × cos θ V θ I V × I = cos θ V θ I ,
where PF is the power factor measured between ±1.00, P is the true power in Watts, S is the apparent power in volt-amperes, V is the phase voltage magnitude in volts, I is the phase current magnitude in amps, ϴV is the phase voltage angle in degrees, ϴI is the phase current angle in degrees.

3.2. Average versus Total Power Factor

The average power factor represents the average of the measured power factors for phases A, B, and C. The average power factor can be estimated by calculating the power factor for each phase using Equation (1), measuring the phase current/voltage magnitudes and angles. Then, the average power factor is calculated as the sum of the power factors for phases A, B, and C divided by three. The average power factor is represented by Equation (2):
A P F = P F A + P F B + P F C 3 ,
where APF is the average power factor, PFA is the power factor of phase A, PFB is the power factor of phase B, and PFC is the power factor of phase C.
Meters and relays usually measure the TPF instead of the average power factor because the average power factor does not represent the power factor of a three-phase power system effectively, especially when phases A, B, and C loads are unbalanced. Therefore, the TPF represents a better way of measuring the efficiency of three-phase power systems. The TPF is estimated using the ratio between the true power sum and apparent power sum for phases A, B, and C. The TPF can be calculated by using Equation (3).
T P F = P A + P B + P C S A + S B + S C ,
where TPF is the total power factor, PA is the true power of phase A in watts, PB is the true power of phase B in watts, PC is the true power of phase C in watts, SA is the apparent power of phase A in volt-amperes, SB is the apparent power of phase B in volt-amperes, and SC is the apparent power of phase C in volt-amperes.
If the relay-recorded events do not provide the measured true and apparent power for phases A, B, and C, calculate t the TPF using Equation (3), and then the TPF can be estimated directly using the measured current/voltage magnitudes and angles for phases A, B, and C. Then, by combining Equations (1) and (3), the TPF can be calculated using Equation (4):
T P F =   m = A   C V m × I m × cos θ V m θ I m m = A C V m × I m ,
where TPF is the total power factor, Vm is the voltage magnitude of the generic phase m (A, B, C) in volts, Im is the current magnitude of the generic phase m (A, B, C) in amperes, ϴVm is the voltage angle of the generic phase m (A, B or C) in degrees, and ϴIm is the current angle of the generic phase m (A, B or C) in degrees.

3.3. Power Factor Convention Signs

The power factor is measured by relays or meters between ±1.00. The power factor can be measured as a percentage or unit. However, a unit measurement is usually the more common method. The power factor represents the efficiency of the power system with respect to losses generated by the reactive energy flowing in an electrical grid point. The maximum power factor is +1.00, and the minimum power factor limits are usually between +0.80 and +0.98 [47].
Based on an industrial meter manual [27], the measured power factor sign convention could be defined for the IEEE or IEC standards, and sometimes meters allow for setting the power factor sign convention that is used on the display to either IEC or IEEE [27]. The conventional power factor signs based on the IEC and IEEE standards are shown in Figure 5a and Figure 5b, respectively, based on a meter instruction manual [27].
The IEC standard (Figure 5a) defines the positive and negative power factor when the true power is positive and negative, respectively. However, the IEEE standard (Figure 5b) defines the positive and negative power factor for leading current (capacitive effect) and lagging current (inductive effect), respectively. For the IEC standard [27], in Figure 5a, quadrants 1 and 4 with positive true powers have a positive power factor. However, quadrants 2 and 3 with negative true powers have a negative power factor. For the IEEE standard [27], in Figure 5b, quadrants 2 and 4 with capacitive loads (power factor leading) have a positive power factor. However, quadrants 1 and 3 with inductive loads (power factor lagging) have a negative power factor. In Figure 5, the green and blue quadrants represent the positive and negative power factors, respectively. In this study, the TPF smart contract with CGG using DLT for the electrical utility grid with a customer-owned wind farm was used with an SEL 700GT relay [26] that uses the power factor sign convention, based on the IEEE standard in Figure 5b.

4. Methodology

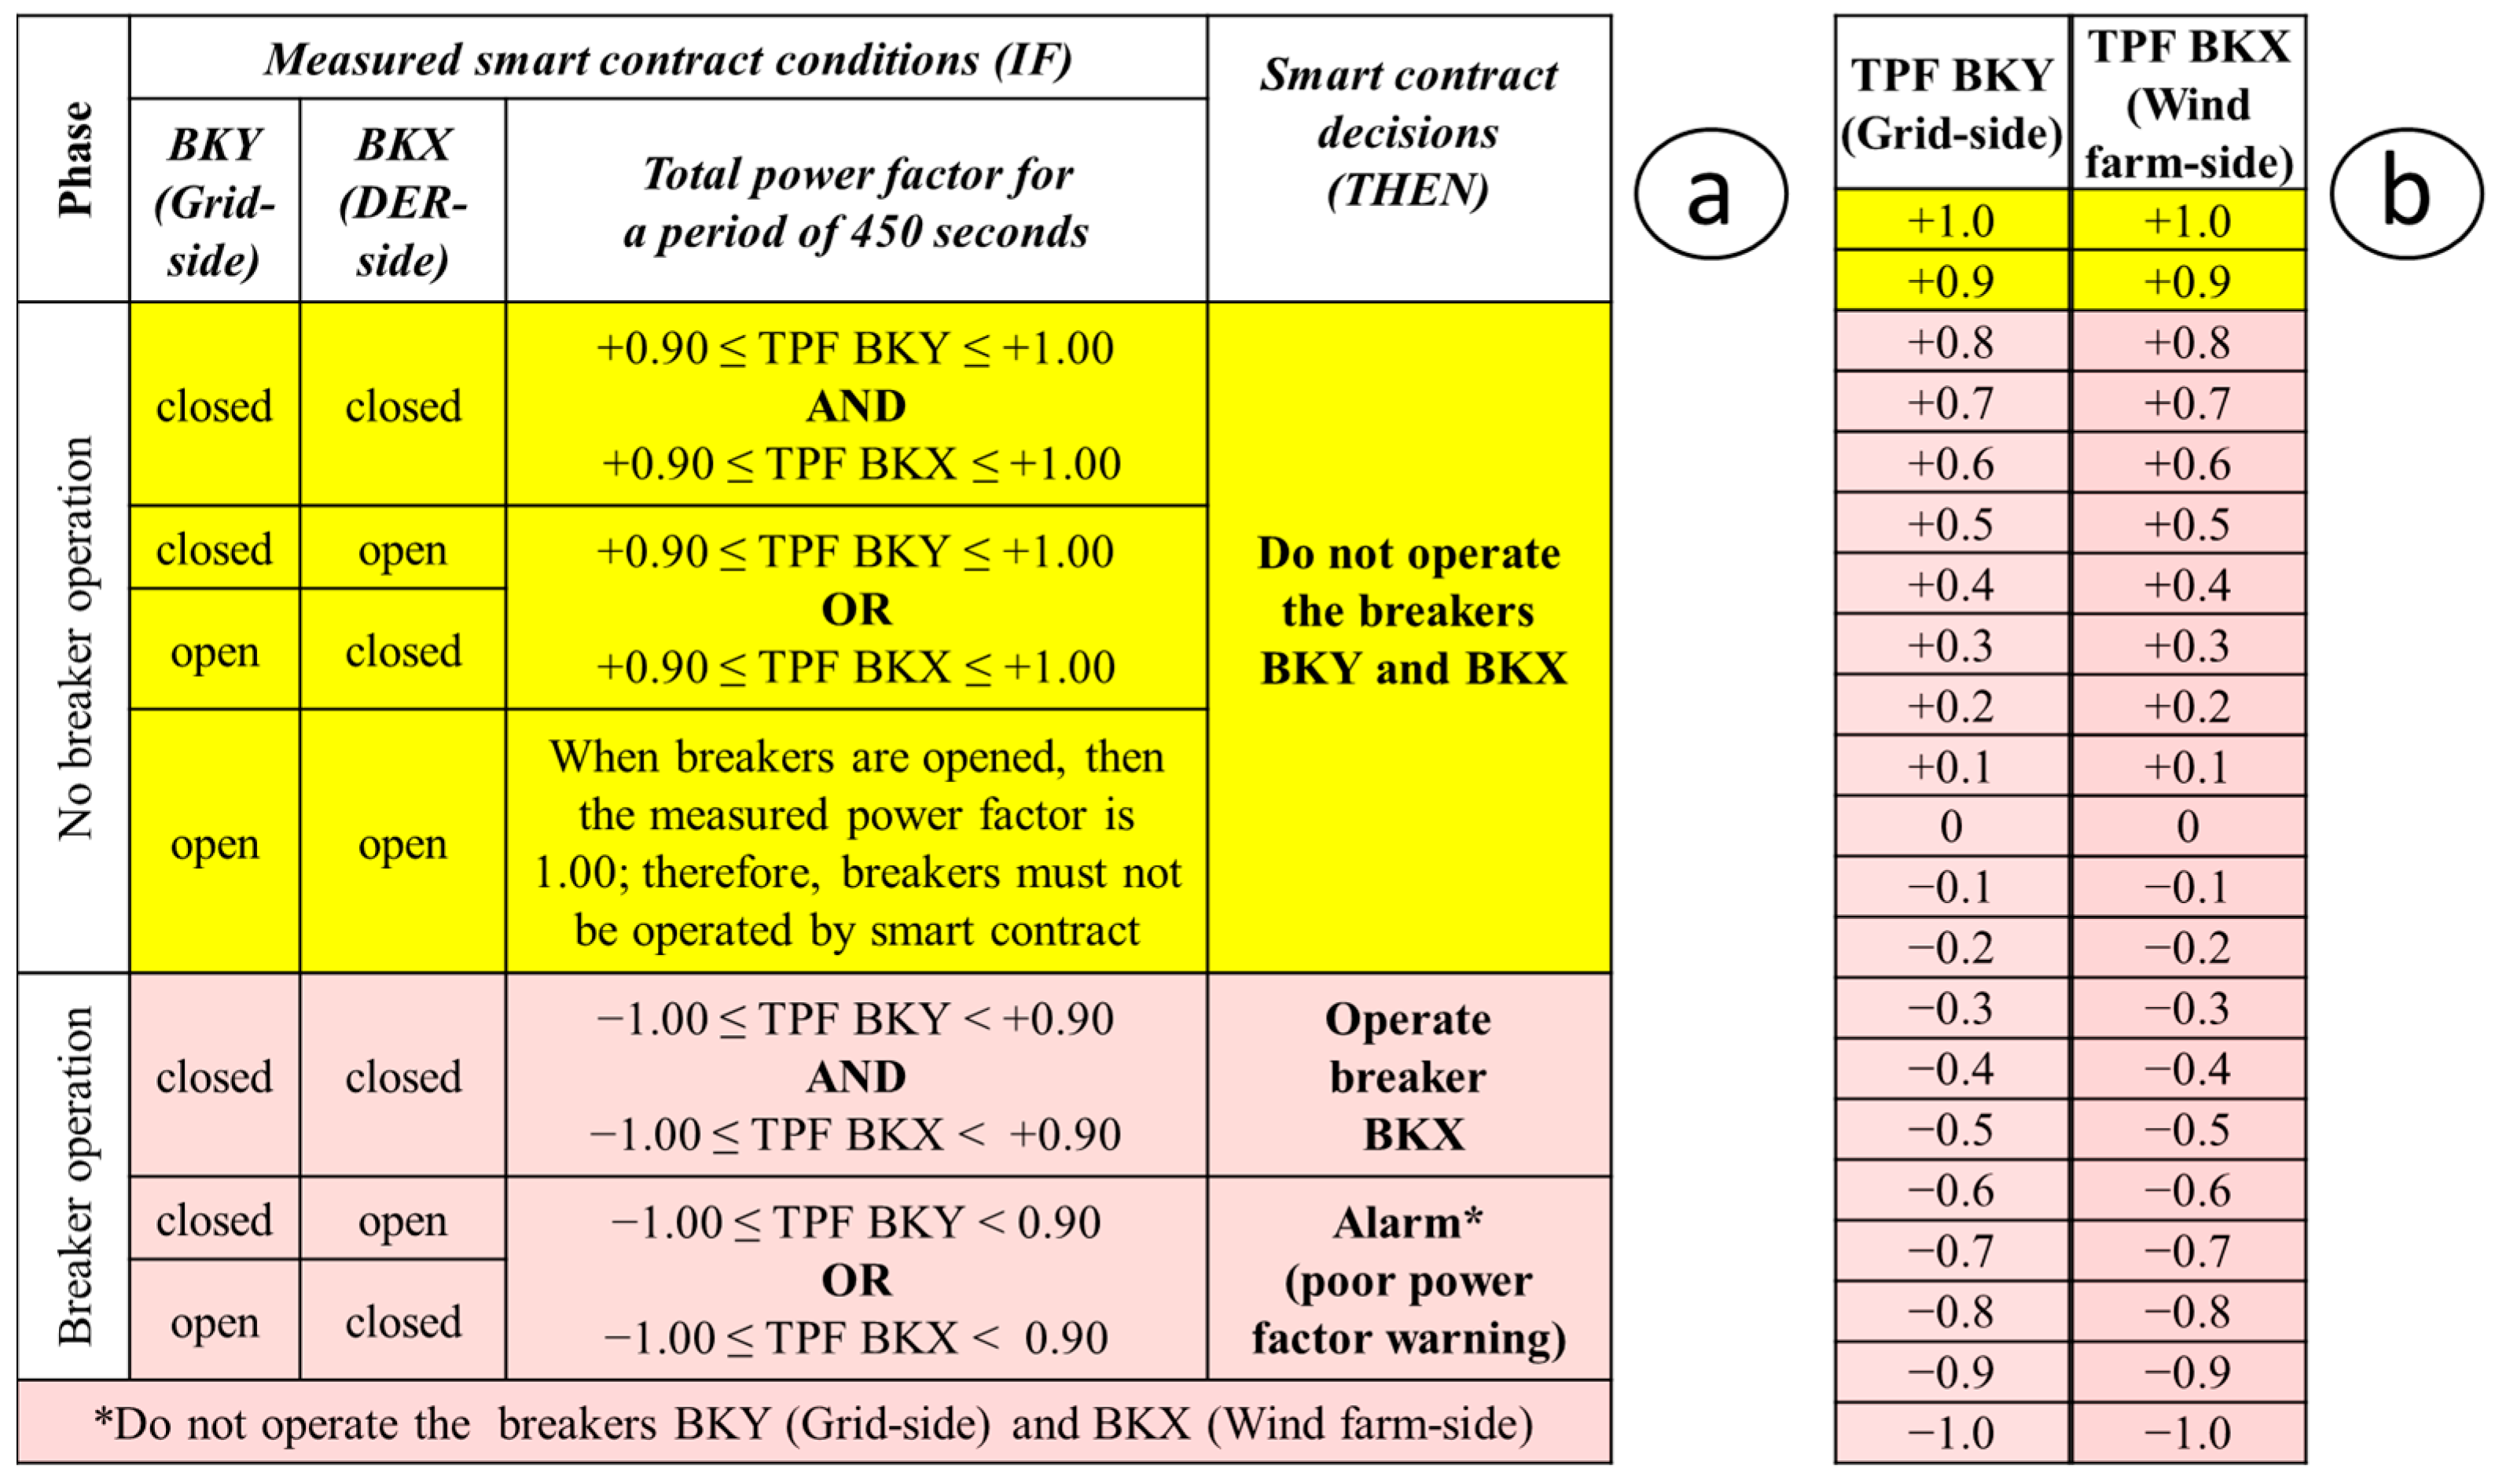
4.1. Total Power Factor Smart Contract

The smart contract is defined as a digital contract stored on a distributed ledger that is automatically performed when the predetermined terms and conditions are reached. Smart contracts are commonly used to automate the execution of transactions consistent with agreed-upon set rules or according to specific conditions so that all members (electrical utilities) can operate according to the agreed-upon consensus. The TPF smart contract was applied to a CGG with DLT, to manage an electrical utility grid with a customer-owned wind farm, therefore maintaining the integrity of data from a relay at the PCC. In addition, it becomes more difficult in the future, as the number of DERs and PCCs increases; however, DLT could enhance the resilience of modern electrical grids by effectively securing the shared data. The TPF smart contract was based on using CGG with DLT and a relay that measures the TPF at breaker BKY (grid-side) and breaker BKX (wind farm-side) for the A, B, and C phases. The TPF smart contract application was implemented by integrating a real-time simulator with the CGG system and a relay in-the-loop.
The main goal of the TPF smart contract is to use the CGG with DLT to offer a solution at PCCs for improving the TPF at the grid-side of an electrical utility grid connected to a customer-owned DER (wind turbine farm). The data collected from the CGG system were used for performing the TPF smart contract. The desired TPF limits on the grid-side were set to be between +0.9 and +1.0, and the operation of the breakers in the electrical grid and DER side were controlled by the CGG with DLT and the SEL 700GT relay by applying the terms of the smart contract. The boundaries of the TPF smart contract are defined by the breaker states at the grid side (BKY) and wind farm side (BKX), the TPF measured on the grid side (TPFBKY) and wind farm side (TPFBKX), and the condition that the TPF measured at the grid side must be between +0.9 and +1.0 for the main load feeders.
Another boundary condition is based on the selected period for measuring and keeping the TPF from the CGG. If the TPF measured at the grid-side (TPFBKY) is smaller than +0.9, this condition needs to be measured and kept for more than 400 s to allow for BKX and BKY breaker operations from the TPF smart contract. In the TPF smart contract, the time window was defined at 450 s, but it depends on the implementation of the TPF smart contract for normal operation and electrical fault situations in the electrical grid. In normal operation, this time window allows for the operation of the breakers by the TPF smart contract after the use of other power factor quality techniques (like capacitor banks, load shedding, transformer/load tap changers) from the grid-side utility, without the use of the smart contract and with other relays and breakers. Coordination with load tap changers is commonly used in distribution substations. The load tap changer can raise the voltages but cannot improve the reactive power or power factor [48]. Then, capacitor banks are usually selected instead of overload tap changers at the distribution substation. However, the feed of industrial loads is achieved with a proper time delay at both controllers. Capacitor bank controllers are used on the high-voltage side, but load tap changers controllers are used on the low-voltage side of the transformer, which are regulated by the load tap changer [48]. In transformers, the onload tap changers can regulate the voltages in steps of 0.625% to 2.5% with a time delay of 1–3 min (60–180 s) for each step operation, [48] but switching on a capacitor bank can provide the same or a larger voltage increase much faster [48]. The other power quality method is the load shedding that may occur if there is a shortage of electricity supply, or to keep prevent power lines from becoming overloaded by poor power factors. A load shedding program is successfully implemented when the system frequency has recovered to 60 Hz, but it can take several minutes [49] or hours depending on the electrical grid.
In this study, a time window greater than 400 s (6.66 min) is also related to the TPF smart contract condition that it must not operate the breakers for a poorly measured TPF of less than +0.9 from the grid-side (TPFBKY < +0.9) during anomalous events such as electrical fault states. The reason for this is that poor measured TPF could be detected during an electrical fault state for short periods of less than 1 s, and relays first need to clear the electrical fault by opening the breakers before the CGG triggers a low-TPF condition. In addition, a time window greater than 400 s was selected based on the maximum time setting limit for the frequency protection elements, defined as 400 s for frequency protection elements [50] based on the relay manual [26] and shown in Table 2.
In the SEL 700GT relay, the conventional sign for the power factor is based on the IEEE standard. Based on the power factor sign convention for the IEEE standard, when the current lagging voltage (Figure 6a) or power factor is lagging (inductive behavior), the power factor is negative. However, when the current leading voltage (Figure 6b) or power factor is leading (capacitive behavior), the power factor is positive. Figure 6 shows phasor diagrams (Figure 6a,b) and the IEEE standard power factor sign conventions (Figure 6c) for the SEL 700GT relay.
In the SEL 700GT relay, the measured power factor at phases A, B, and C in the breakers on the grid side and the wind farm side can be calculated as the cosine of the angle between the phase voltage and phase current based on Equation (5),
P F m B K n = cos θ V m B K n θ I m B K n ,
where PFmBKn is the power factor of generic phase m (A, B, or C) for the breaker n (BKY or BKX) measured between ±1.00, ϴVmBKn is the voltage angle of the generic phase m (A, B, or C) for the breaker n (BKY or BKX) measured in degrees, and ϴImBKn is the current angle of the generic phase m (A, B, or C) for the breaker n (BKY or BKX) measured in degrees.
In the SEL 700GT relay, the TPF or three-phase power factor for the grid side (TPFBKY) and the wind farm side (TPFBKX) depends on the true and apparent power of phases A, B, and C; it can be calculated using Equation (6):
T P F B K n = P A B K n + P B B K n + P C B K n S A B K n + S B B K n + S C B K n ,
where TPFBKn is the total power factor for the breaker n (BKY or BKX) measured between ±1.00; PABKn, PBBKn, and PCBKn are the true powers of phases A, B, and C, respectively, for the breaker n (BKY or BKX) measured in kW; SABKn, SBBKn, and SCBKn are the apparent powers of phases A, B, and C, respectively, for the breaker n (BKY or BKX) measured in kVA.
In the SEL 700GT relay, if the three-phase pole breaker is open (BKY or BKX), the measured TPF is +1.00. This approach is taken to avoid the measurement of indetermined TPF values that result when the breakers (BKY or BKX) are opened and the phase currents are not flowing there. The situation when the breakers are opened could be represented by the generic expression of the TPF definition in Equation (7). When the phase currents are zero, the total true and apparent powers also are zero; consequently, the TPF result is indeterminate, and the SEL 700GT relay measures the TPF as +1.00.
I f   T P F = Total   true   power Total   apparent   power = 0.00 0.00 = T h e n   measured   TPF = + 1.00 .  
The TPF is +1.00 when a breaker is opened; this is a boundary condition that is set by the manufacturer instead of measurement of an indetermined (swing) TPF. Thus, the TPF smart contract should not operate the grid-side (BKY) and wind farm-side (BKX) breakers. Figure 7 shows the measured TPF from the real-time simulation versus the relay. From the real-time simulator (Figure 7a), the measured TPF swings when the breaker BKX is opened. However, in the CGG system (Figure 7b), the measured TPF from the SEL 700GT relay is +1.00, validating the boundary condition calculated for the relay using Equation (7).
The objective of the TPF smart contract is to reduce the reactive power flowing along the power line at the grid side when an electrical utility grid is integrated with a customer-owned DER (wind farm); another objective is to maintain the data security and reliability offered by CGG using DLT and smart contracts. The power line losses caused by reactive power need to be kept with a TPF between +1.00 and +0.90. A flowchart of the TPF smart contract for the time window operation is shown in Figure 8.

4.2. Time Window Flowchart

In this study, the proposed time window operation for the TPF smart contract is defined at 450 s; the time was selected for normal grid operation. This time window allows breaker BKX and BKY to be operated under the TPF smart contract following the power factor improvement techniques (like capacitor banks, load shedding, transformer/load tap changers) used in the grid-side utility (Figure 8a). The time window of 450 s is also chosen so that the TPF smart contract is not operated for a transient anomaly event that generates a poorly measured TPF for only a couple of cycles, such as an electrical fault that is cleared by nearby relays (Figure 8b). The TPF smart contract boundary conditions need to be measured and held for a period of 450 s to allow protection elements, such as transformer/load tap changers, load shedding, and capacitor banks from the grid-side, to be used, before the BKX and BKY breakers will be operated with the CGG system using DLT and smart contracts.

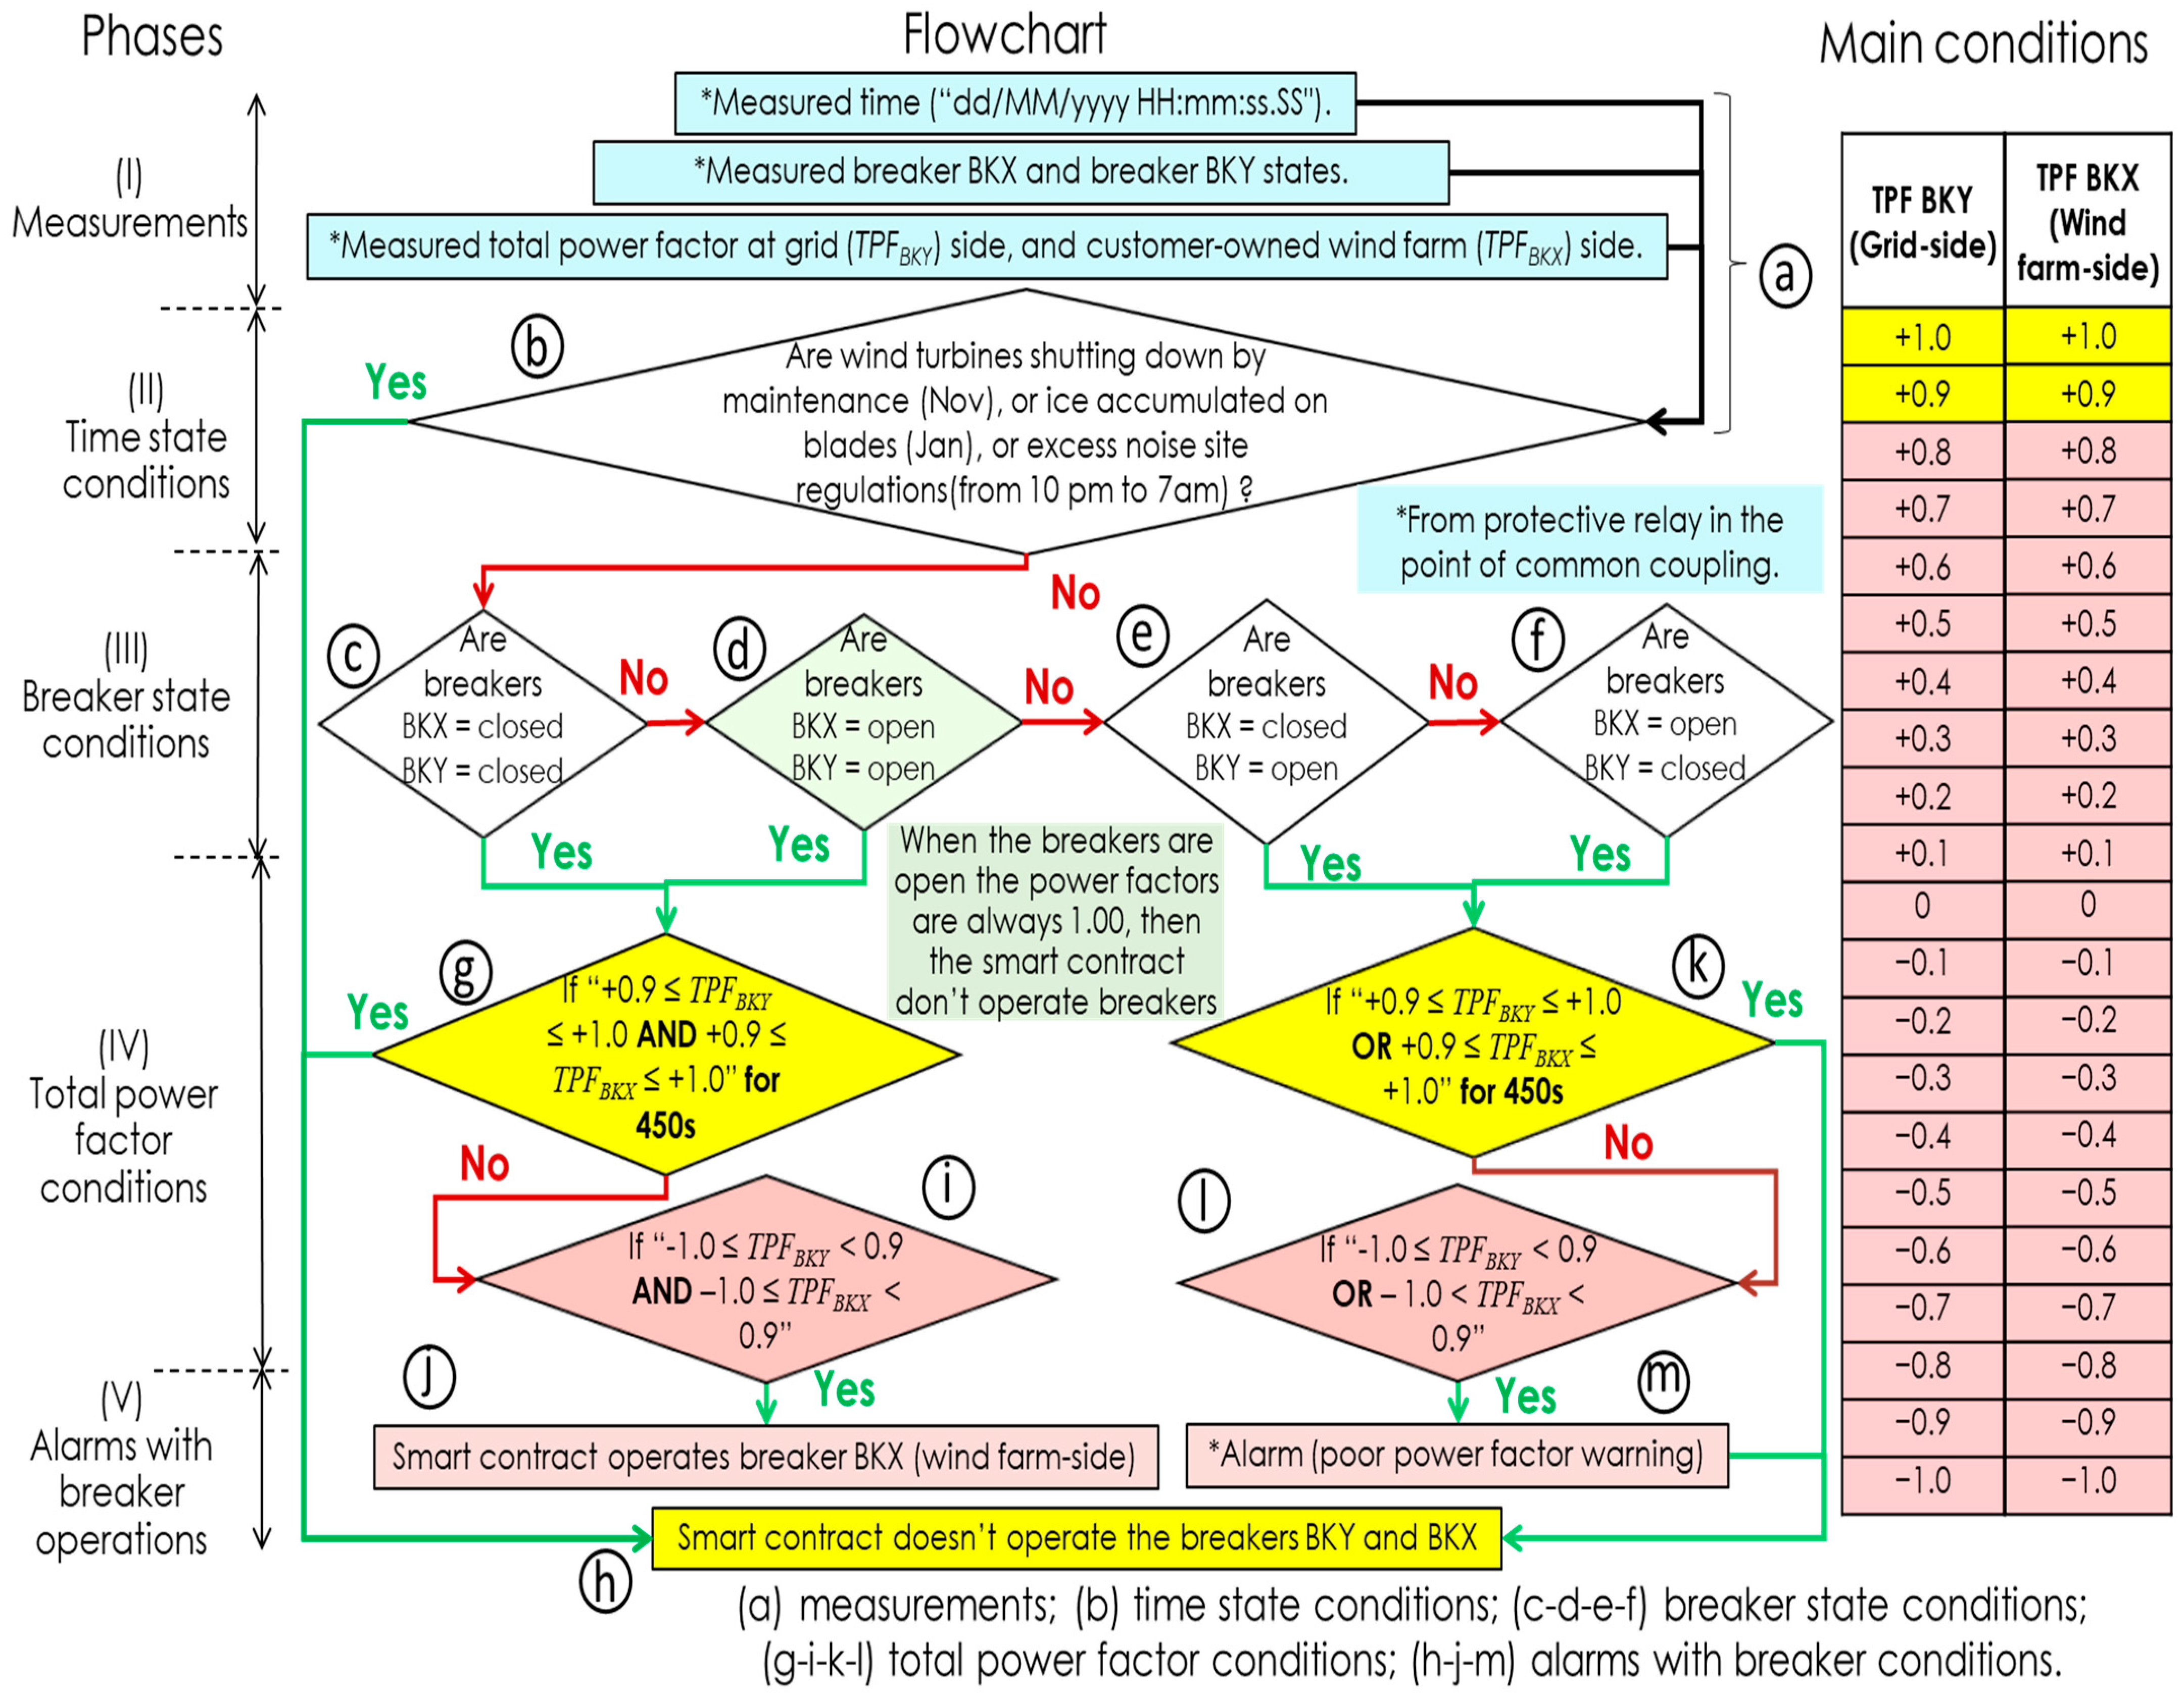
4.3. Total Power Factor Smart Contract Flowchart

The phases and main conditions of the TPF smart contract are shown in the flowchart in Figure 9. The TPF smart contract was defined by a breaker non-operation condition for a measured TPF between +1.00 and +0.90 (good power factor), and a breaker operation condition defined for measured TPFs smaller than +0.90 (poor power factor). Based on the definition of good and poor power factors, the TPF boundaries and time window of 450 s were chosen for the flowchart of the TPF smart contract.
The flowchart (Figure 9) was created based on the power factor measurement behavior of the SEL 700GT relay from Equation (7) and the TPF or three-phase power factors (PF3X and PF3Y) measured from the relay using the CGG with IEC 61850 GOOSE messages. In Figure 9, the phases of the TPF smart contract flowchart are defined by the measurements (I), time state conditions (II), breaker state conditions (III), total power factor conditions (IV), and alarms for breaker operations (V).
In phase (I) of the flowchart (Figure 9a), the time (day, month, year, minutes, and seconds), states, and TPFs of the BKY (grid side) and BKY (wind farm side) breakers are measured. In phase (II) of the flowchart (Figure 9b), the time sate conditions are assessed for the TPF smart contract. This contract must consider periods when disturbances related to low-power-quality scenarios and shut down situations on the wind farm impact the utility grid-side. These scenarios are programmed maintenance operations (November), possible extreme ice accumulation on the blades (January), and excess noise site regulations (from 10 p.m. to 7 a.m.). The time stamps are measured in the “dd/MM/yyyy HH:mm:ss.SS” format from the SEL 700GT relay to activate the TPF smart contract (Figure 9b).
In phase (III) of the flowchart (Figure 9c–f), the breaker state conditions are assessed. The breaker state situations were defined for scenarios for the conditions of the flowchart when the BKX (wind farm side) and BKY (grid side) breakers are closed and open. In phase (IV) of the flowchart (Figure 9g,i,k,l), the AND/OR logic TPF conditions for the BKX (wind farm side) and BKY (grid side) breakers are assessed. In phase (V) of the flowchart (Figure 9h,j,m), the TPF smart contract operates the BKX breaker (wind farm side) for a measured TPF smaller than +0.90 on the grid side (TPFBKY). Also, a warning alarm is activated in case the TPF smart contract does not operate the BKX (wind farm-side) and BKY (grid-side) breakers.
The main goal of the TPF smart contract flowchart (Figure 9) is to prioritize the operation of breaker BKX (wind farm-side) instead of breaker BKY (grid-side), because breaker BKY (grid-side) feeds the main load feeders (Figure 1a), and the main electrical grid (utility A) does not permit the breaker to be controlled by the smart contract of the CGG. In addition, the smart contract does not operate the BKY and BKX breakers for a well-measured TPF between +0.90 and +1.00. In the flowchart of the TPF smart contract (Figure 9) the following conditional sequences are defined:
  • If both breakers are closed (Figure 9c), and the measured TPFs on the grid side (TPFBKY) and wind farm side (TPFBKX) are between +0.90 and +1.00 (Figure 9g) for 450 s, then the smart contract does not operate any breakers (Figure 9h). However, if the measured TPFs on the grid side (TPFBKY) and wind farm side (TPFBKX) are smaller than +0.90 (Figure 9i) after 450 s, then the smart contract operates the BKX breaker on the wind farm side (Figure 9j).
  • If both breakers are open (Figure 9d), and the measured TPFs on the grid-side (TPFBKY) and wind farm-side (TPFBKX) are +1.00 because of the measurement relay condition in Equation (7) when breakers are open, then the smart contract does not operate any breakers (Figure 9h).
  • If only one breaker is closed (Figure 9e,f), and the measured TPF on the grid side (TPFBKY) or wind farm side (TPFBKX) is between +0.90 and +1.00 (Figure 9k) for 450 s, then the smart contract does not operate any breakers (Figure 9h). However, if the measured TPF on the grid side (TPFBKY) or wind farm side (TPFBKX) is smaller than +0.90 (Figure 9l) after 450 s, then a warning alarm is triggered (Figure 9m), to indicate a poor power factor without operating the BKY (grid-side) and BKX (wind farm-side) breakers.

5. Cyber Grid Guard with DLT and Smart Contract

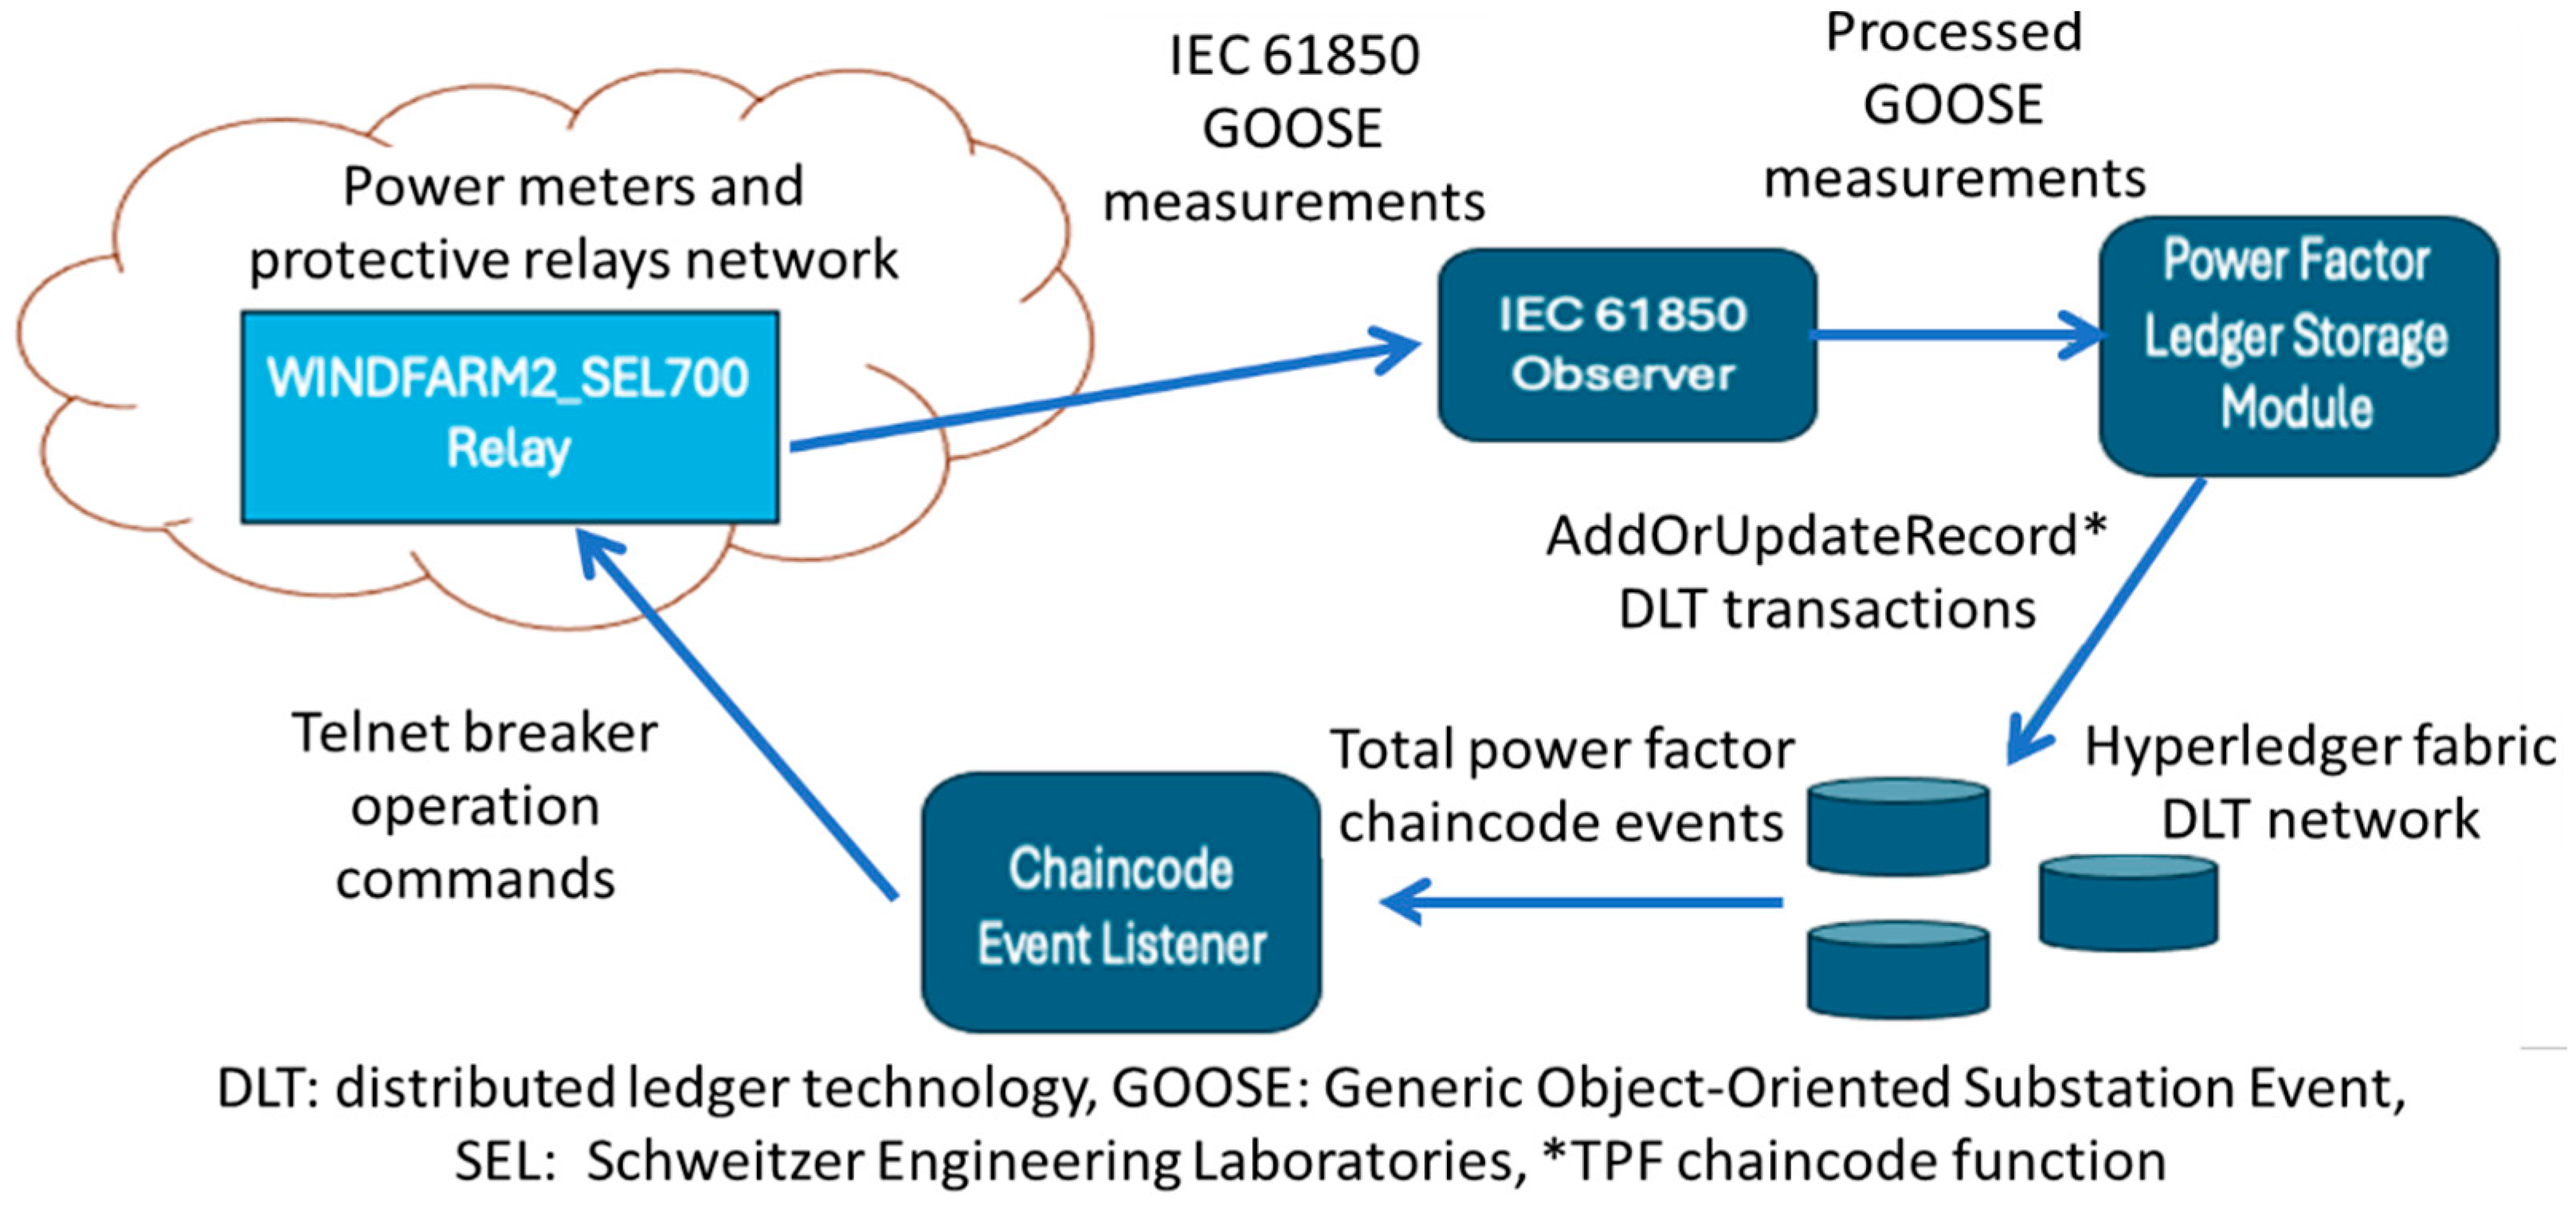
5.1. Cyber Grid Guard and Definitions

The CGG system is a modular software platform created for handling data ingestion and processing tasks related to securing IED data and configuration settings. It is responsible for ingesting data into the storage layer, consisting of on-chain (DLT) and off-chain (SQL database) data stores, and using that data to detect anomalies and other issues. At a high level, the modules are organized around tasks that include data ingestion, processing, and anomaly detection. Data ingestion involves collecting data and configuration settings from devices via the network using protocols such as IEC 61850 GOOSE and FTP. Data are stored on-chain in the DLT by sending transactions using smart contract functions; they are stored off-chain in a PostgreSQL database with the TimescaleDB extension. Data processing includes converting data from wire formats to JSON for more convenient storage and parsing or generating statistics. Anomaly detection is carried out using methods such as analyzing generated statistics and looking at comparisons of on-chain and off-chain data to detect anomalous events. Table 3 shows the definitions of terms related to DLT.

5.2. Architecture of Smart Contract

The TPF smart contract was implemented with the CGG using DLT and an SEL 700GT relay. The smart contract for checking TPF conditions for the BKY (grid side) and BKX (wind farm side) breakers was created using Hyperledger Fabric (HLF) 2.5. HLF is a modular, open-source, and permissioned DLT platform. It is designed for enterprise-grade, general-purpose use test cases. Smart contracts are defined as self-executing contracts in which the contract terms are defined in the code. They operate on DLT platforms, enabling execution and automatic enforcement without the need for intermediaries. In the HLF DLT platform, smart contract programs are referred to as “chaincode” and can be implemented in various programming languages. In this study, the Go language was used to implement the TPF chaincode. The TPF chaincode is used to store IEC 61850 GOOSE-based measurements, breaker states, and the TPFs presented in Table 4 from the WINDFARM2_SEL700 relay in the ledger and initiate the condition checks.
The architecture of the implemented system is shown in Figure 10. The software modules form parts of the CGG system. The IEC 61850 GOOSE measurements in Table 4 are published by the WINDFARM2_SEL700 relay and received by the observer program. This program uses the libiec61850 library to receive GOOSE messages and process the data, which includes filtering duplicate messages and formatting them as JSON. The TPF ledger storage module handles receiving the formatted GOOSE messages and creating and sending DLT transactions with the relevant data using the TPF chaincode AddOrUpdateRecord function.
The conditions for the TPF smart contract are created based on the flowcharts in Figure 8 and Figure 9. The TPF smart contract is a backup power quality method that can be applied following the use of load shedding, transformer/load tap changers, and capacitor bank applications on the grid side. Therefore, a time of 450 s is implemented for measuring TPF conditions and operating the BKX (DER side) breaker. These conditions depend on the measured time, breaker state, and TPF, as shown in Figure 11. When a condition is met (based on the conditions and logic detailed in Figure 11), a DLT event is emitted. This event is a JSON message that is received by a listener application that handles operating a breaker. The listener application implemented was a Go program using the HLF Fabric Gateway client API version 1.4.0 to receive the event from the smart contract and handle the communication with the SEL 700GT relay that operates the breakers. This design choice was made because smart contracts are unable to directly interact with external resources. They are executed in a distributed manner and must reach a result that is consistent and deterministic.
The smart contract conditions (Figure 11a) that represent the TPF boundaries are shown in yellow and red in Figure 11b. If the measured TPF conditions are reached for a duration of 450 s, then the wind farm-side breaker is operated for a measured TPF smaller than 0.90. The breaker states are based on the “AND/OR” logic conditions in Figure 11a. When a condition check is triggered, a transaction is sent to the DLT using the CheckConditions function of the TPF chaincode; the TPF smart contract conditions (Figure 11) are evaluated for the past 450 s period based on the provided timestamp. If a condition is met, a chaincode event will be generated. The chaincode event listener subscribes to these events and, upon receiving one, will initiate the required action. If the event requires a breaker operation, the listener will trigger the code to send a breaker operation command using the Telnet protocol.

6. Results

6.1. Test Scenarios

In this study, a CGG using DLT and a TPF smart contract was tested under normal and electrical fault situations. In a normal situation, the TPF smart contract conditions are delayed for 450 s to allow for the operation of transformer/load tap changers, load shedding, and/or capacitor banks on the grid side. After that period, the CGG can implement the smart contract using DLT and the relay. As in an electrical fault situation, the TPF smart contract should not operate the breakers in the SEL 700GT relay. Therefore, based on the maximum time limit for the frequency protection elements of 400 s (Table 2), the TPF smart contract time window was set at 450 s. Tests 1 and 2 were based on normal electrical grid situations. In test 1, the main feeder loads were connected only with the grid-side breaker (BKY), which measured TPFs between +0.90 and +1.00; in that case, the smart contract did not operate any breaker. In test 2, the main feeder loads were connected with the grid-side breaker (BKY) and the wind farm-side breaker (BKX). In this case, the grid-side breaker (BKY) measured a poor TPF, and the wind farm-side breaker (BKX) was opened.
Tests 3 and 4 were based on temporary electrical fault situations—such as lightning, windblown tree branches or wires, birds, or rodents [51]—that do not initiate the TPF smart contract because they last only for a few cycles or s [51]. In test 3, the main feeder loads were connected only with the grid-side breaker (BKY) and measured a TPF between +0.90 and +1.00. In this case, a temporary three line-to-ground (3LG) electrical fault of 1 s (60 cycles) at the grid-side power line was set, but the smart contract did not operate a breaker because the electrical fault cleared itself. In test 4, a similar scenario was presented, but a temporary single line-to-ground (SLG) electrical fault of 1 s (60 cycles) in the grid-side power line occurred. Table 5 shows the test scenarios implemented based on the three-phase power system of the substation grid with customer-owned DER (a wind farm) in Figure 4.

6.2. Measured Total Power Factor

The TPF smart contract was assessed by comparing the measured data from the real-time simulator, CGG, and relay. The data collected from the CGG system were used to operate the TPF smart contract. The desired TPF limits on the grid-side were defined as being between +0.9 and +1.0, and the operation of the breakers on the grid side and wind farm side was controlled by the SEL 700GT relay using the smart contract. The events from the real-time simulator, CGG, and relay showed a successful assessment of the TPF smart contract with the CGG using DLT. The TPF smart contract was assessed for normal situation tests and temporary electrical fault tests; then, the CGG using DLT with the smart contract was evaluated for normal and anomalous event situations, observing operation and non-operation of the smart contract. The normal situation tests (Figure 12 and Figure 13) and temporary electrical fault situation tests (Figure 14 and Figure 15) were run for a total simulation time of 600 s to allow for the implementation of the smart contract for a TPF smaller than +0.9 on the grid-side for more than 400 s. In the temporary electrical fault situation tests, for a couple of cycles, a measured TPF smaller than +0.9 during fault states was observed; however, the TPF smart contract did not operate the SEL 700GT relay breakers in the PCC between the electrical grid side and the wind farm side because anomalous transient events were present.

6.2.1. Normal Situation Tests

The normal situation in test 1 (Table 5) presents a comparison between the measured TPFs of the grid side (TPFBKY) and wind farm side (TPFBKX) obtained from the real-time simulator (Figure 12a,b), the CGG (Figure 12c,d), and the relay (Figure 12e,f). The real-time simulator and CGG recorded the TPF plots for 600 s, and the relay recorded the TPF plots at a specific time (7:28 p.m.). Figure 12a,c,e show the measured TPFs for the grid side (TPFBKY) and Figure 12b,d,f show the measured TPFs of the wind farm side (TPFBKX). In the real-time simulator and CGG (Figure 12a–d), initially, the grid simulation has all breakers closed and a measured TPF swing of around ±1.00 for a couple of s when the wind farm is connected. Then, the wind farm-side breaker (BKX) is opened to obtain the desired conditions for test 1. From Figure 4, in this test, the fossil fuel power plant (Utility C) and the substation (Utility A) are connected to the main feeder loads. The grid-side breaker (BKY) presents a TPF between +0.90 and +1.00, which means that reactive losses are practically nonexistent on the grid-side power line. The TPF smart contract does not operate the breakers on the grid side (BKY) or the wind farm side (BKX) for a TPF between +0.90 and +1.00. In Figure 12b, as can be seen from the real-time simulator, a TPF swing was measured for the wind farm side because the breaker (BKX) was opened and the phase currents were zero; then, an indetermined value was measured based on Equation (4). However, from the CGG, the wind farm-side TPF (Figure 12d) was measured to be +1.00 because the manufacturer’s conditions for the relay state that when the breaker is opened at a measured TPF of +1.00, an indetermined value is not measured. However, from the relay event (Figure 12f) at 7:28 p.m., a wind farm-side TPF swing was seen because the breaker (BKX) was opened and phase currents were zero, and then an indeterminate value was measured based on Equation (4). In this normal situation test, it was concluded that the TPF smart contract did not operate the relay’s breakers because the measured TPF of the grid-side (TPFBKY) was between the TPF limits of +0.90 to +1.00.
The normal situation in test 2 (Table 5) presents a comparison between the measured TPFs for the grid side (TPFBKY) and wind farm side (TPFBKX) obtained from the real-time simulator (Figure 13a,b), CGG (Figure 13c,d), and relay (Figure 13e,f). The real-time simulator and CGG record the TPF plots for 600 s, and the relay records the TPF plots at a specific time (7:09 p.m.). Figure 13a,c,e show the measured TPFs for the grid-side (TPFBKY) and Figure 13b,d,f show the measured TPFs for the wind farm side (TPFBKX). In the real-time simulator and CGG (Figure 13a–d), initially, the grid simulation has all breakers closed and the measured TPF swing is around ± 1.00 for a couple of seconds when the wind farm is connected. Then, the measured TPF for the grid-side (TPFBKY) is smaller than +0.90 for the real-time simulator and CGG plots (Figure 13a–c) for more than 400 s. As seen in Figure 4, in this test, the fossil fuel power plant (Utility C), the substation (Utility A), and the wind farm (Utility B) are connected to the main feeder loads. The grid-side breaker (BKY) shows a TPF smaller than +0.90, meaning the TPF on the grid-side power line generates reactive losses. The wind farm-side breaker (BKX) is opened after 400 s. and a TPF between +0.90 and +1.00 is obtained for the grid side breaker (BKY). In Figure 13b, from the real-time simulator, TPF swing was measured for the wind farm side because the breaker (BKX) was opened and phase currents were zero; then, an indeterminate value was measured based on Equation (4). However, the wind farm-side TPF measured from the CGG (Figure 13d) is +1.00 because the manufacturer’s conditions for the relay state that, when the breaker is opened, the measured TPF is +1.00. However, from the relay event (Figure 13f) at 7:09 p.m., TPF swing was measured for the wind farm side because the breaker (BKX) was opened and the phase currents were zero, and then an indeterminate value was measured based on Equation (4). In this normal situation test, it was concluded that the TPF smart contract opened the wind farm-side breaker (BKX) of the relay because the TPF measured on the grid side (TPFBKY) was smaller than +0.90.

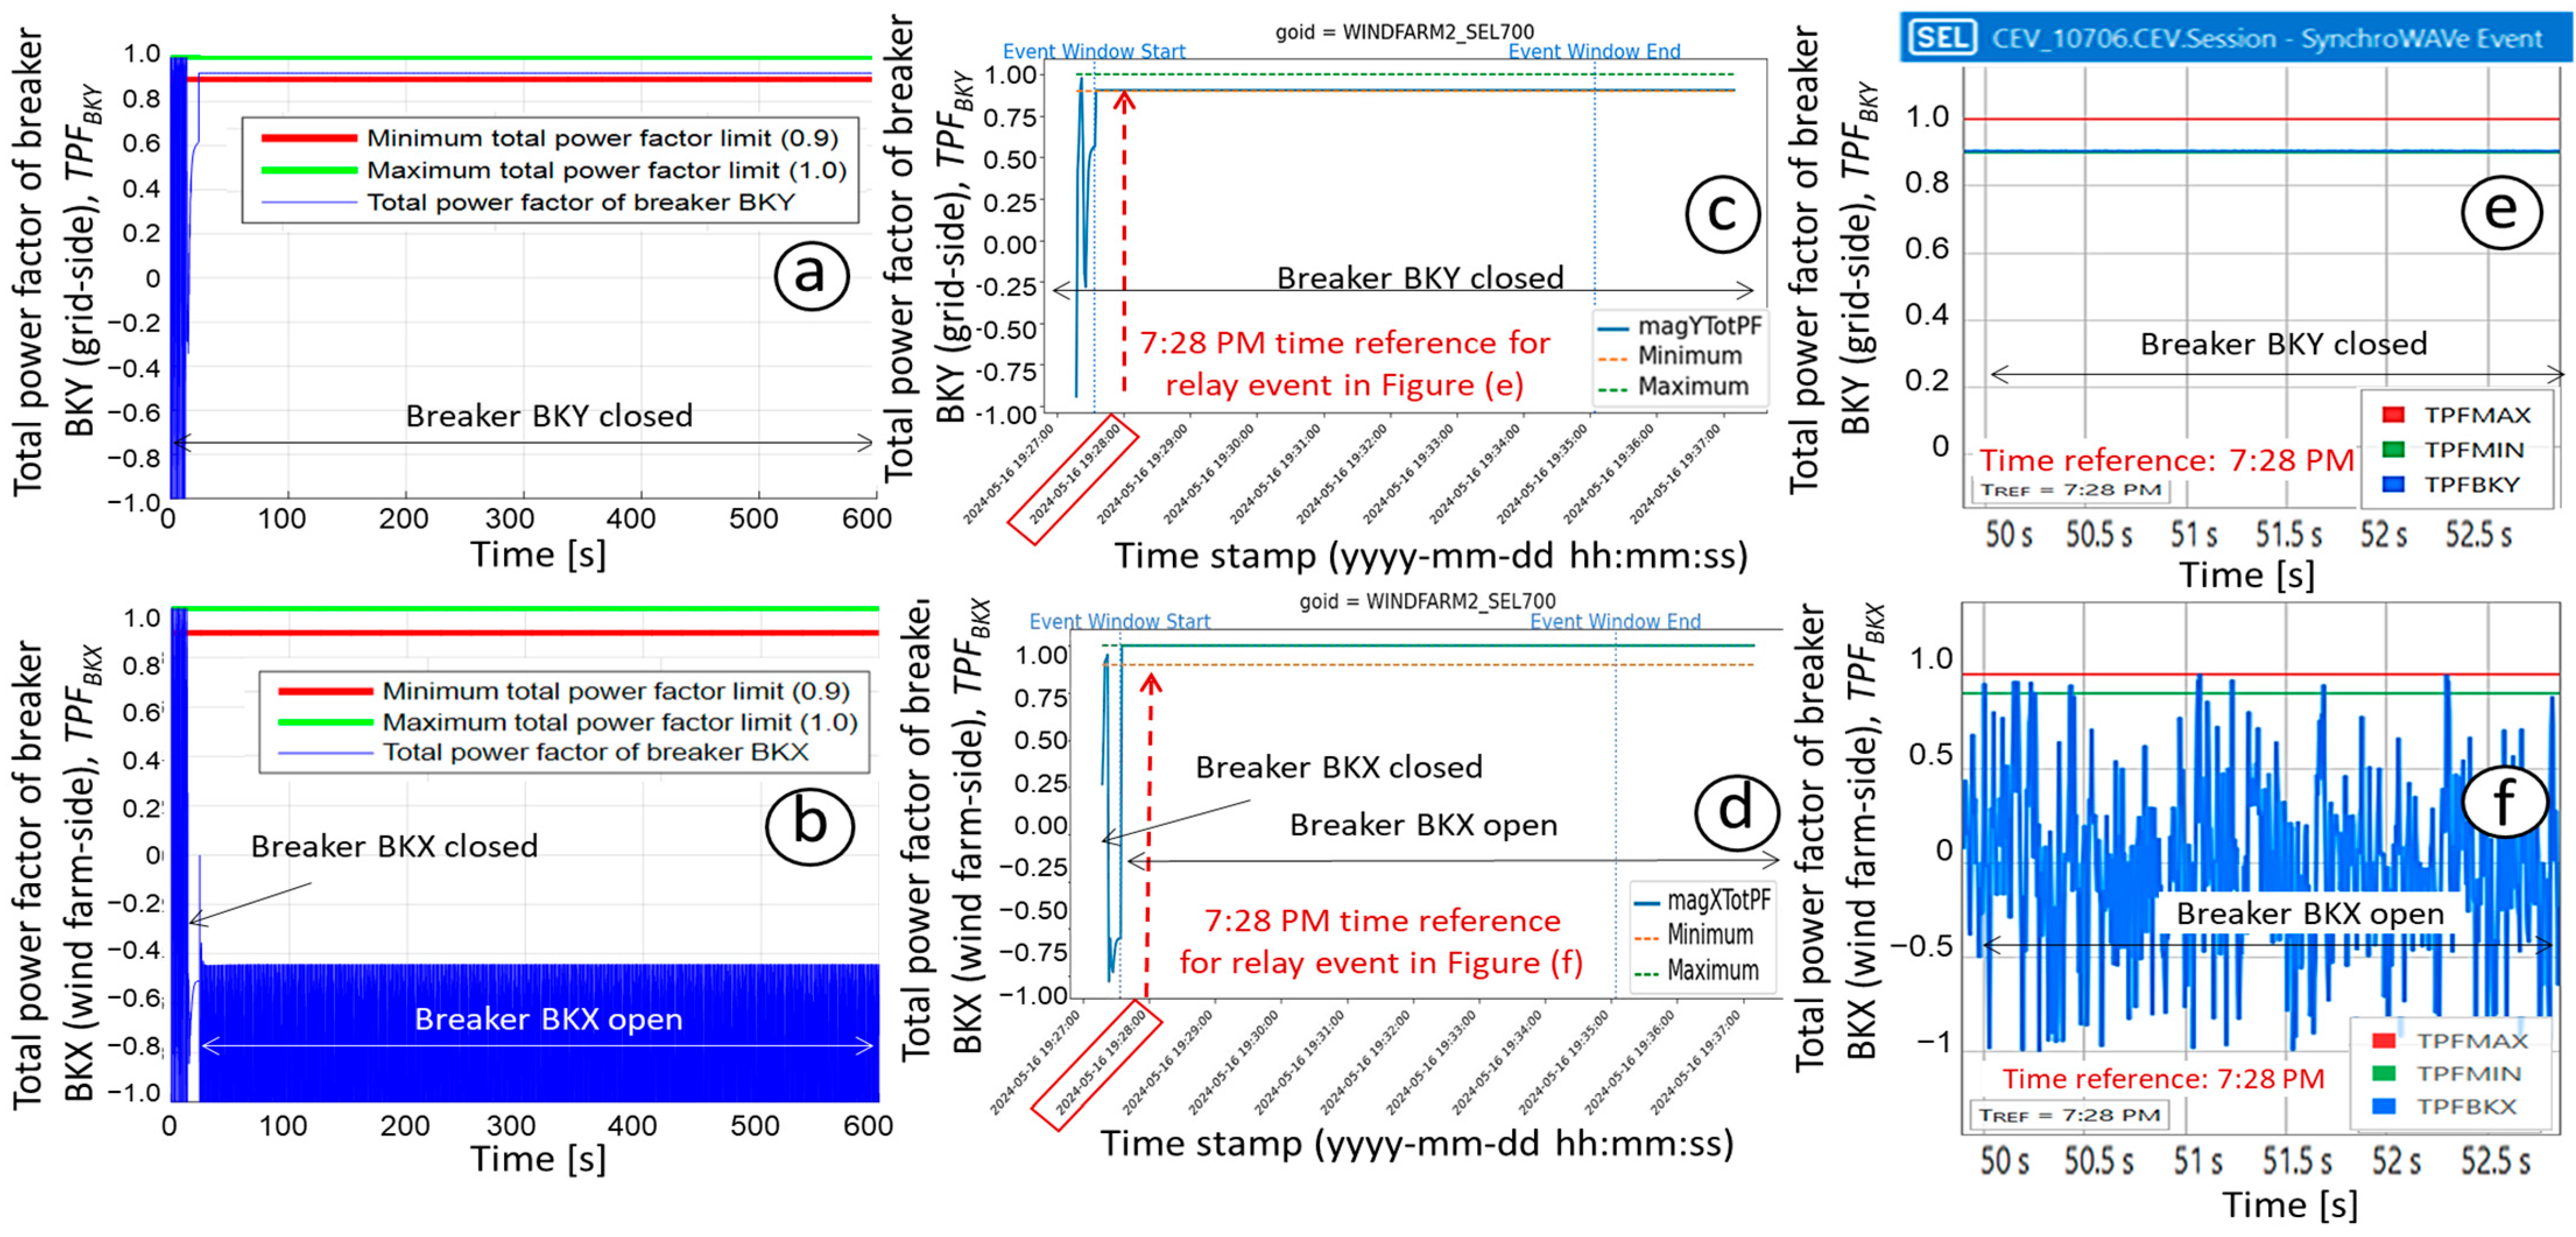
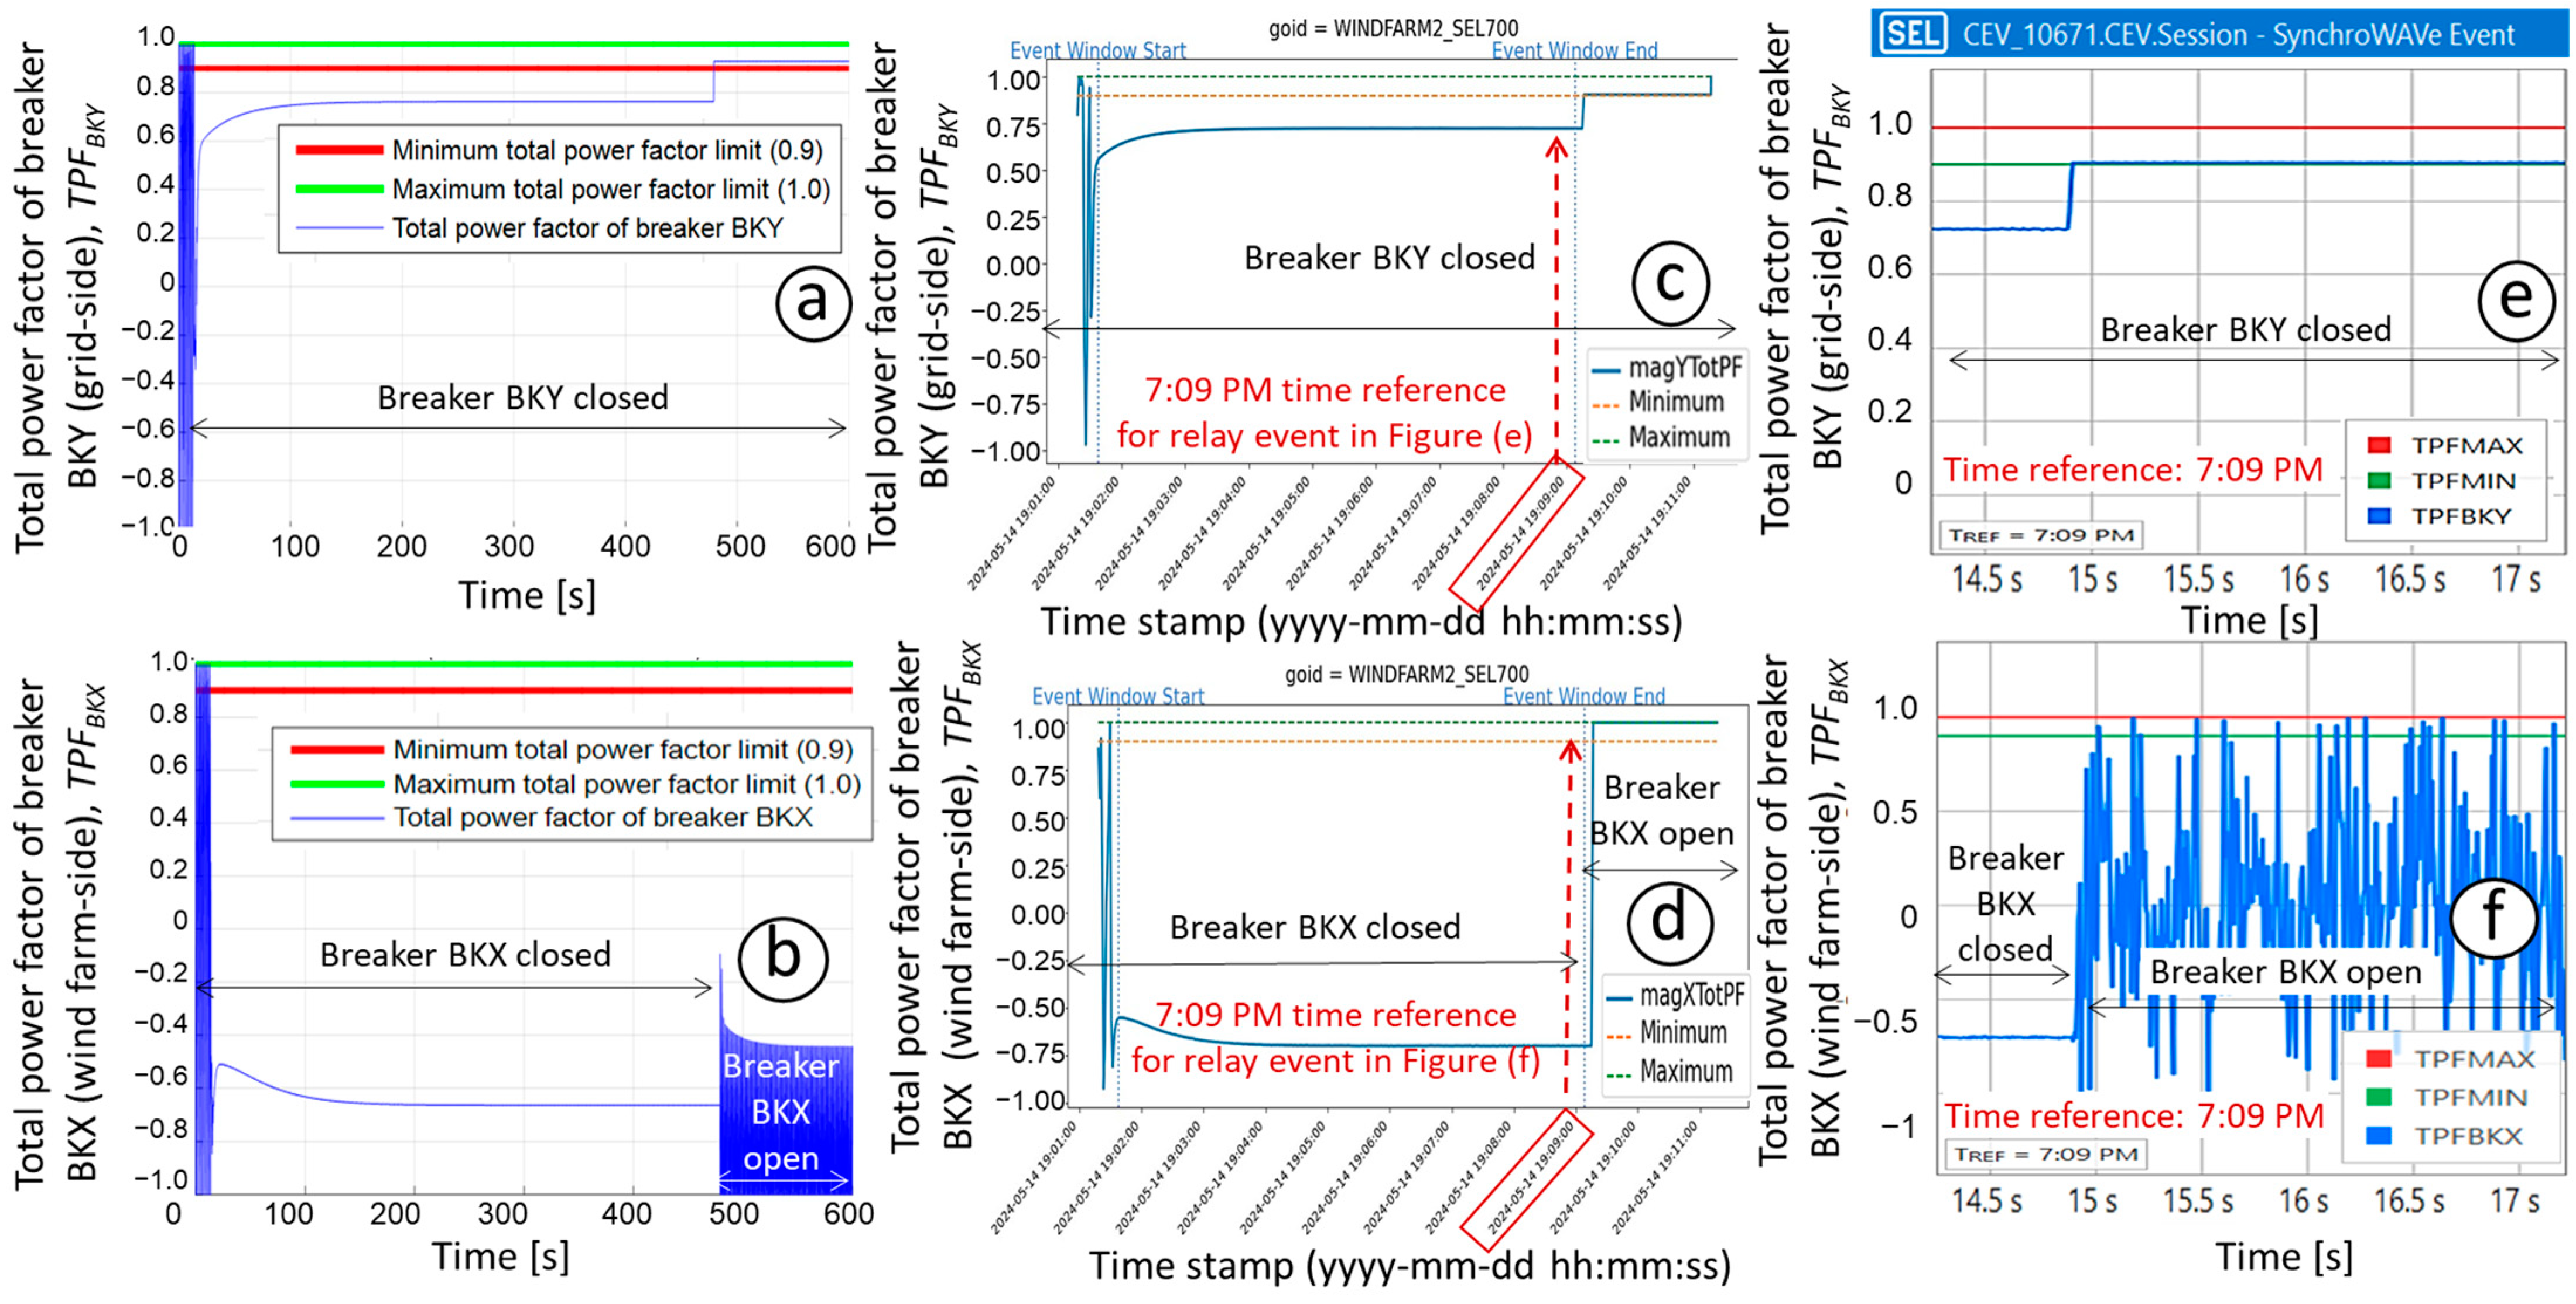
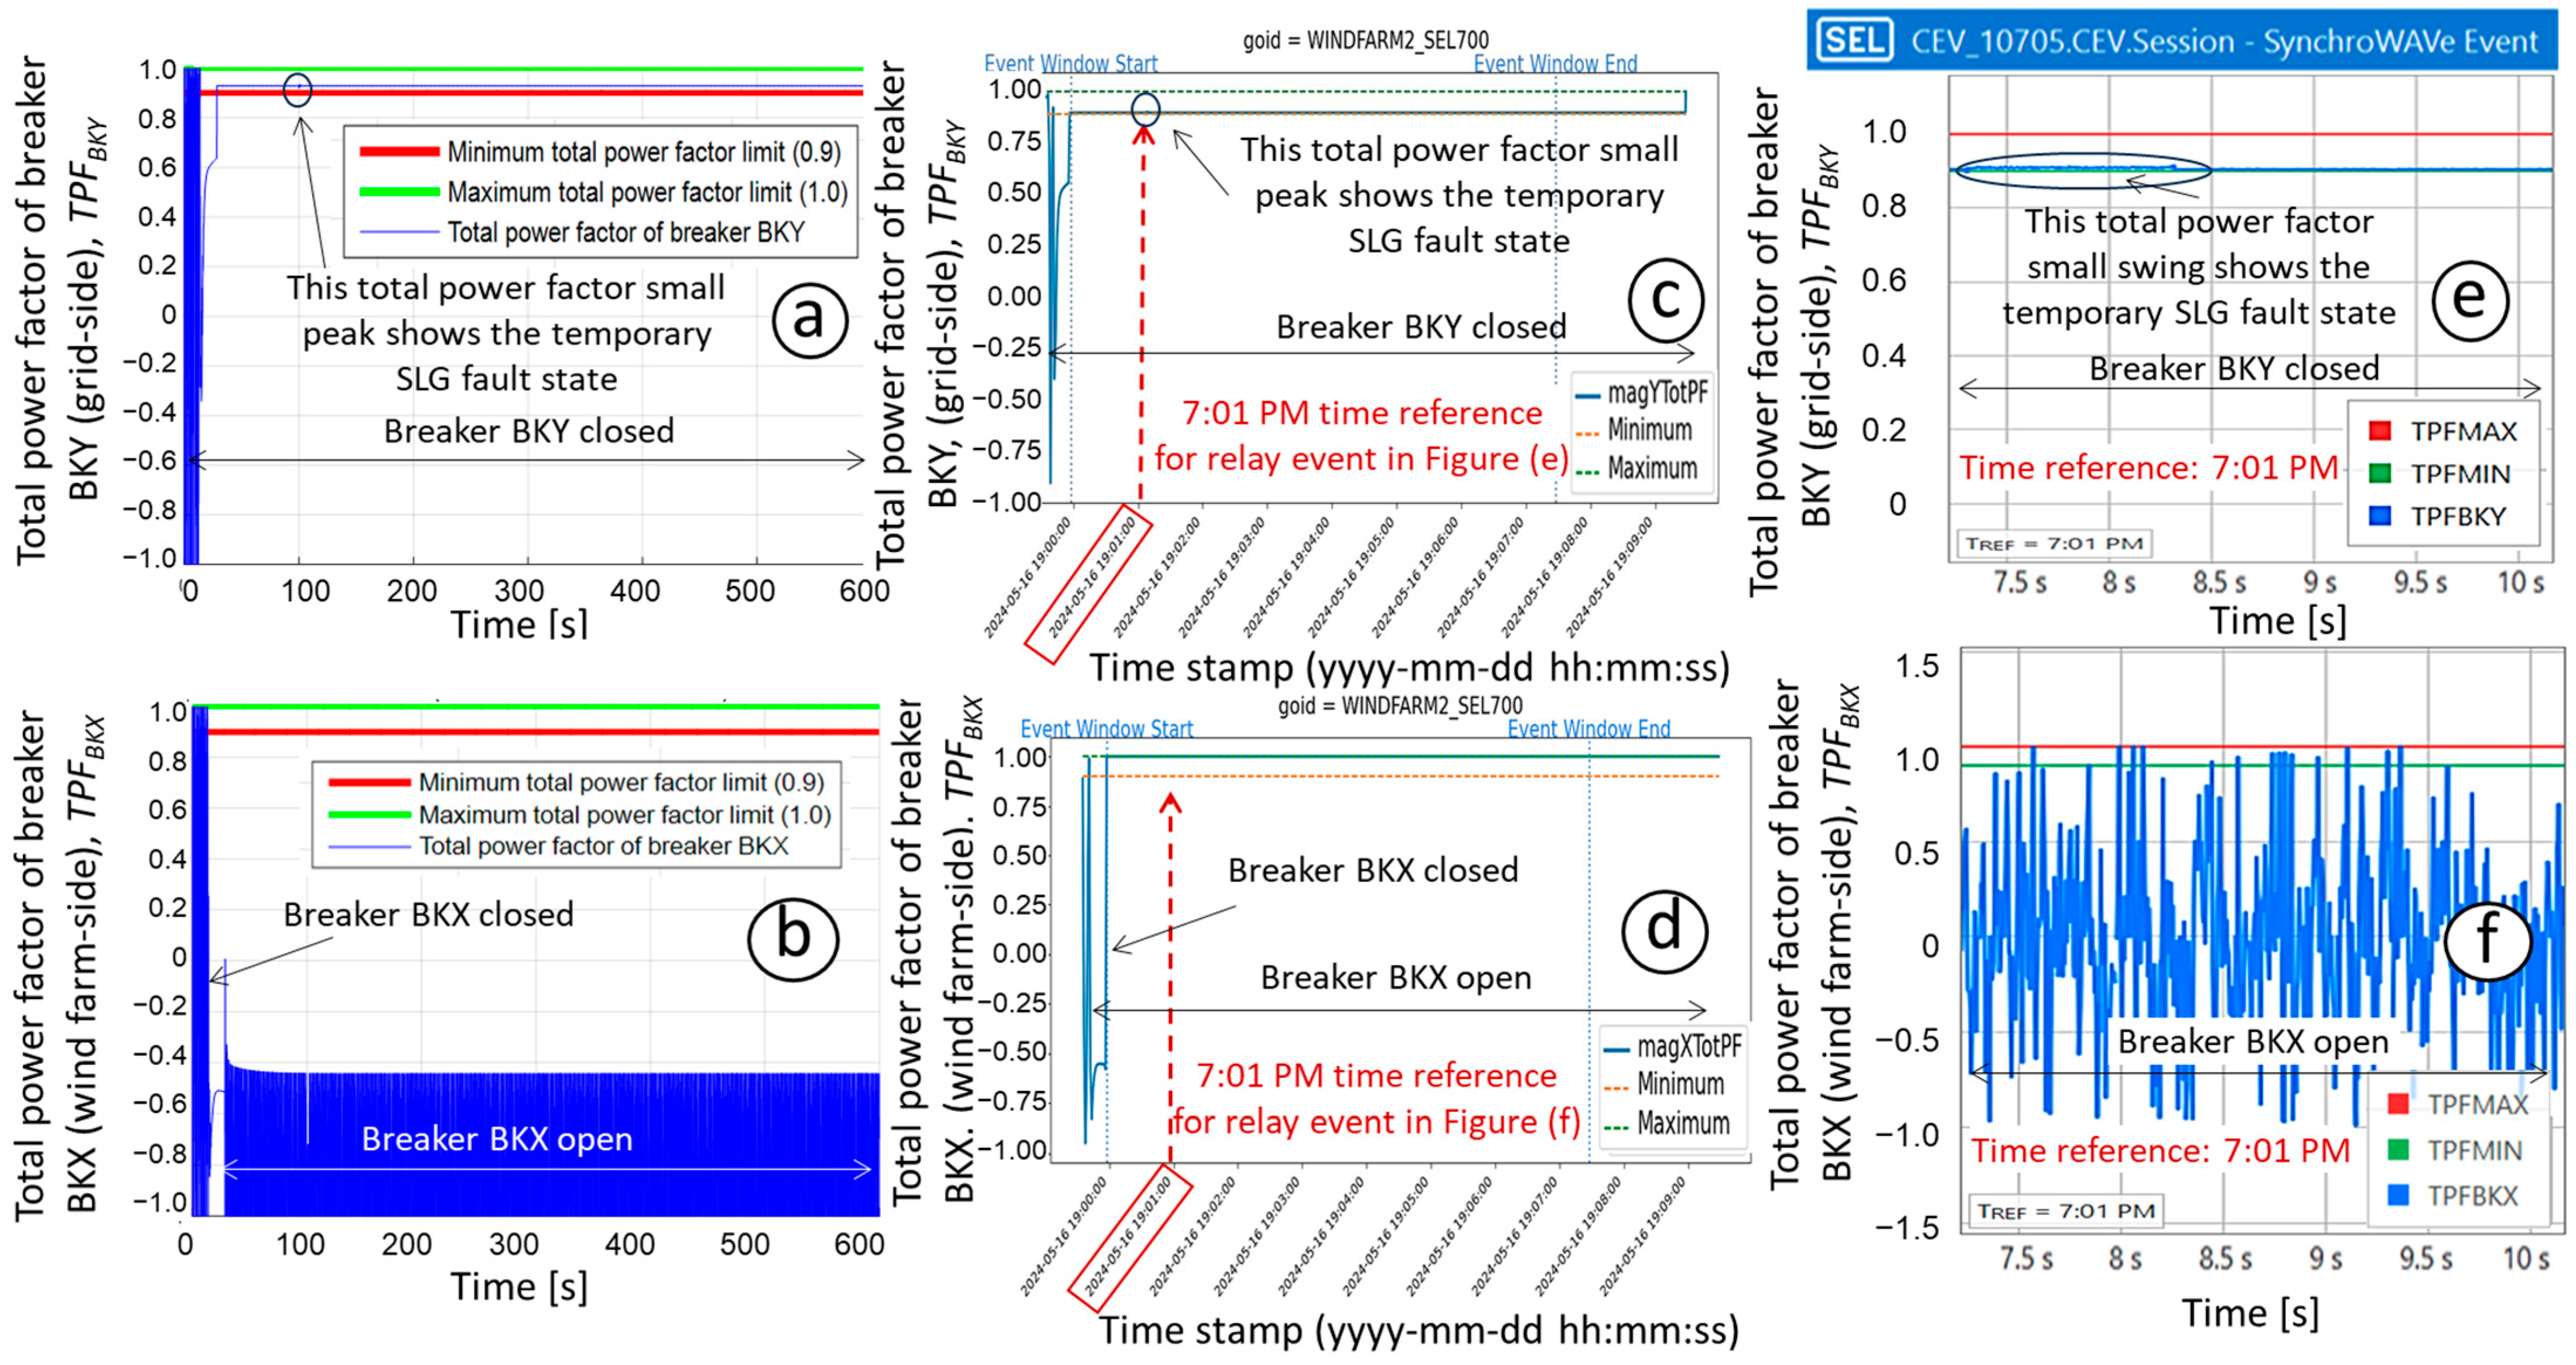
6.2.2. Temporary Electrical Fault Situation Tests

The temporary electrical fault in test 3 (Table 5) represents the TPFs measured for the grid side (TPFBKY) and wind farm side (TPFBKX) by the real-time simulator (Figure 14a,b), the CGG (Figure 14c,d), and the relay (Figure 14e,f). The real-time simulator and CGG recorded the TPF plots for 600 s, and the relay recorded the TPF plots at a specific time (6:10 p.m.). Figure 14a,c,e show the TPF measured for the grid side (TPFBKY) and Figure 14b,d,f shows the TPF measured for the wind farm side (TPFBKX). In the real-time simulator and CGG (Figure 14a–d), initially, the grid simulation has all breakers closed and a measured TPF swing of around ±1.00 for a couple of seconds when the wind farm is connected. Then, the wind farm-side breaker (BKX) is opened to obtain the desired initial conditions for test 3. From Figure 4 it can be seen that, in this test, the fossil fuel power plant (Utility C) and the substation (Utility A) are connected to the main feeder loads. Then, a temporary 3LG electrical fault of 1 s (60 cycles) at the end of the grid-side power line occurs for 100 s. Then, the grid-side breaker (BKY) presents a poor power factor during the fault state (Figure 14a), until a time when the temporary electrical fault clears by itself. However, the TPF smart contract does not operate the grid-side breaker (BKY) and wind farm-side breaker (BKX) because this is a temporary electrical fault situation. In Figure 14a, from the real-time simulator, it can be seen that the measured grid-side TPF presents a peak during a fault state, like the grid-side TPF measured by the CGG (Figure 14c). However, from the relay event (Figure 14f) at 6:10 p.m., the measured wind farm-side TPF swings because the breaker (BKX) is opened and the phase currents are zero, and then an indeterminate value is measured based on Equation (4). In this temporary electrical fault situation test, it was concluded that the TPF smart contract did not operate the relay’s breakers because the poorly measured TPF on the grid side (TPFBKY) was measured during a temporary electrical fault.
The temporary electrical fault in test 4 (Table 5) represents the TPFs for the grid side (TPFBKY) and wind farm side (TPFBKX) measured by the real-time simulator (Figure 15a,b), CGG (Figure 15c,d), and relay (Figure 15e,f). The real-time simulator and CGG record the TPF plots for 600 s, and the relay records the TPF plots at a specific time (7:01 p.m.). Figure 15a,c,e show the TPF measured for the grid side (TPFBKY) and Figure 15b,d,f show the TPF measured forthe wind farm side (TPFBKX). In the real-time simulator and CGG (Figure 15a–d), initially, the grid simulation has all breakers closed and a measured TPF swing of around ±1.00 for a couple of seconds when the wind farm is connected. Then, the wind farm side breaker (BKX) is opened to obtain the desired initial conditions for test 4. From Figure 4, in this test, the fossil fuel power plant (Utility C) and the substation (Utility A) are connected to the main feeder loads. Then, a temporary SLG electrical fault of 1 s (60 cycles) at the end of the grid-side power line occurs for 100 s. Then, the grid-side breaker (BKY) presents a small change in TPF during the fault state (Figure 15a,c,e), until the temporary electrical fault clears by itself. However, the TPF smart contract does not operate the grid-side (BKY) and wind farm-side (BKX) breakers because this is a temporary electrical fault situation. In Figure 15a, from the real-time simulator, it can be seen that the measured grid-side TPF shows a small peak during the fault state, like the measured grid-side TPF from the CGG (Figure 14c). However, from the relay event (Figure 15f) at 7:01 p.m., it can be seen that the measured wind farm-side TPF swings because the breaker (BKX) is opened and the phase currents are zero, and then an indeterminate value is measured based on Equation (4). In this temporary electrical fault situation test, it was concluded that the TPF smart contract did not operate the relay’s breakers during a temporary electrical fault.

7. Discussion

The experimental model for this research was based on using different case studies (normal situation tests and temporary electrical fault tests) instead of performing statistical studies. As such, the results from the real-time simulator, CGG and relay events were collected to compare the behavior of the TPFs measured on the utility grid side and the customer-owned wind farm side. As the main goal was to assess the TPF smart contract, a statistical analysis was not needed in this study because the results were based on plotting the behavior of measured TPFs (Figure 12, Figure 13, Figure 14 and Figure 15) without quantifying the results. These measured TPF plots from the real-time simulator, CGG, and relay validated the TPF smart contract flowchart in Figure 9.
In the TPFs measured by the real-time simulator (Figure 12 and Figure 13a,b) in tests 1 and 2 (normal situations) without breaker operation, a measured swing TPF behavior was observed for the breakers on the grid side (TPFBKY) and wind farm side (TPFBKX). In these real-time simulation tests, initially, the electrical grid had all breakers closed and a measured TPF swing of around ±1.00 for a couple of s was assessed when the wind farm was connected. This transient event behavior with a measured swing TPF is related to the impact of connecting the customer-owned wind farm (six 1.5 MW wind turbines) to the load feeders on the grid side. This transient event shows a ±1.00 variation in the measured TPF that is related to a power swing phenomenon that occurs when disturbances in a power system cause oscillations in the active and reactive power flows of the power lines. If these transient events continue for a long period of time, it could affect the electrical grid reliability by triggering the breakers’ protective relay for non-desired transient events, consequently generating possible protective relay misoperations because of wrongly calibrated time windows for protection functions (over–under frequency, over–under voltage, etc.).
The TPF smart contract was satisfactorily evaluated by analyzing the test scenarios of normal (Figure 12 and Figure 13) and non-normal (Figure 14 and Figure 15) operations. In the normal operation, a good TPF between +0.90 and +1.00 (grid side) and more than 400 s was observed as the breakers were not operated by the smart contract (Figure 12). In the normal operation, a poor TPF smaller than +0.90 (grid side) and more than 400 s was observed as the wind farm side breaker (BKX) was operated by the smart contract (Figure 13). In non-normal operations like temporary electrical faults that could occur over a period of less than 400 s and could cause a poor TPF smaller than +0.90 on the grid-side (Figure 14a), the smart contract did not operate the breakers of the SEL 700GT relay (Figure 14 and Figure 15). The test scenarios for the temporary electrical faults were performed at the 3LG (Figure 14) and SLG (Figure 15) faults located at the end of the power line on the grid side, and these temporary faults had durations of 60 cycles (1 s).
In the test scenarios of the temporary electrical faults (Figure 14 and Figure 15), the measured TPFs at the fault states on the grid side (TPFBKY) showed a high and low swing value for the 3LG (Figure 14a) and SLG (Figure 15a) fault, respectively. This is because the 3LG fault had a power factor impact greater than the SLG fault. Also, the TPFs measured for the grid side (TPFBKY) and wind farm side (TPFBKX) at the fault states in the real-time simulator (Figure 14a and Figure 15a) had a better resolution than the CGG (Figure 14b and Figure 15b) because the real-time simulator used a time step of 50 micro-seconds to calculate the total power factor values, and the CGG collected the three-phase power factors (PF3X and PF3Y) from the relay using IEC 61850 GOOSE messages. However, if a relay with time domain protocols is connected to the CGG using DLT and smart contracts, the accuracy of the measurements and algorithms could be improved for the CGG. The implementation of sample values or phasor measurement unit protocols in the measurement of voltage/current harmonics on inverter-based photovoltaic (IB-PV) arrays in the PCC could enhance the power system applications of both DLT and smart contracts.
The three-phase power system circuit of the grid substation with the customer-owned wind farm (Figure 4) simulated real devices (power lines, loads, power transformers, wind farm, etc.) because the simulation time step was 50 micro-seconds in the real-time simulation tests, with real IEDs (relays and meters) in the loop. Then, the noise (or harmonics) from the phase current/voltage signals for the wind farm interconnection and/or electrical fault states was simulated because of the time step of 50 micro-seconds that was used, which represents a sampling frequency of 20 kHz that can be used to measure up to 333 samples per cycle (166th harmonics).
In this research, a TPF smart contract flowchart (Figure 9) was designed based on the theory behind and traditional equations for power factors [26,27,31,32,47]. However, these factors were insufficient and so a study of the relay behavior at the PCC between the electrical grid and wind farm sides was necessary to define the boundaries of the TPF smart contract algorithm. This approach was based on the measured unity TPF when the breakers were opened for the relay, and the IEEE or/and IEC conventional power factor signs (IEEE was used for the SEL 700GT relay). Many of the studies of the electrical grid applications of smart contracts used software simulations [33,34,35,36] that did not use real IEDs, an approach that could result in issues with verifying their applicability to realistic scenarios, as opposed to when those smart contracts are integrated with HIL. A way of using real relays with substation protocols is critical to properly assess the proposed smart contract algorithms in the CGG system with DLT for an electrical grid utility with a customer-owned wind farm.
The TPF smart contract between the electrical grid and customer-owned wind farm is a backup method to reduce the reactive losses on the grid-side power line before applying the capacitor bank, load shedding, and transformer/load tap changer techniques from the grid side. In the TPF smart contract, the time taken to operate the breakers in the PCC will depend on the time for operating the power quality grid methods (capacitor bank, load shedding and transformer/load tap changers). Also, the time window will depend on the maximum time limit of the frequency-protection elements of the relays, based on the complexity of the electrical grid. The TPF smart contract needs to allow time for the power quality grid methods on the grid side; in this case, it was chosen to be 450 s, but it could be set at a different time depending on the control systems of electrical distribution utilities.
In the TPF smart contract, while DLT is capable of providing a low latency of less than 1000 ms for 10 transactions per second [52], the introduction of DLT may still introduce additional computational overhead and network jitter that could affect real-time performance. This overhead could include the time taken for transaction preparation, consensus algorithms, and data replication across nodes [53]. These factors raise concerns about scalability and real-time performance in large-scale grids. While designed as a backup method, DLT scalability and performance issues could lead to potential delays in time-critical processing commands such as trip commands for breakers in fault states. To mitigate these concerns, optimizations and enhancements can be applied to the DLT platform, such as sharding or partitioning the network to reduce the transaction load on individual nodes [54] or employing lightweight consensus algorithms [55]. For example, Hyperledger Fabric is a permissioned DLT, meaning all participants are known and authenticated. This avoids the need for resource-intensive consensus mechanisms designed to prevent malicious behavior in open, anonymous networks. Additionally, integrating DLT with existing communication protocols like GOOSE messages must be carefully designed to ensure the timely delivery of time-critical commands, as the transfer time for the trip command in the GOOSE messages must be within 3 ms [56]. Therefore, the CGG system with smart contract could be a more appropriate and useful tool in this application for measuring the TPF in a PCC between the grid side and customer-owned wind farm side, notably to operate breakers as a backup alternative through the relay using the smart contract.
Power systems are vulnerable to both cyberattacks and severe weather events, each posing distinct threats to their stability and functionality, imposing severe financial costs on grid operators. Cyberattacks can exploit vulnerabilities in smart grids and DERs, affecting integrity, confidentiality, availability, and accountability. Integrity attacks, such as false data injection (FDI) [57], can lead to unauthorized modifications of field measurement data, potentially causing cascading failures in the electric grid [14]. Severe weather events are a primary cause of large-scale power outages, particularly in distribution systems. These events, such as hurricanes and winter storms, have led to significant economic damages, with up to 90% of power failures being attributed to disruptions in the distribution system [58]. The implementation of DLT with smart contracts for monitoring power factor data at the PCC could offer significant economic benefits due to enhanced cybersecurity and reliability. The immutability of blockchain ensures that all data transactions are secure and tamper-evident, which reduces the risk of fraudulent activities and operational errors [59]. This increased data security can lead to cost savings by minimizing the need for additional manual oversight and reducing potential downtime due to cyber threats [14]. DLT also provides a resilient platform that ensures continuous operation even in the event of individual component failures. This reliability could translate into lower operational costs as it reduces the frequency and impact of outages. While initial investments in setting up a DLT-based system can be substantial in both cost and complexity [18], the long-term benefits in terms of reduced maintenance costs, enhanced security, and improved grid resilience make this approach economically viable for grid operators and utilities.
The TPF application using a CGG with smart contract was satisfactorily implemented on this study. The novelties herein are based on securing data between the utility grid and customer-owned wind farm and reducing the grid-side power line losses at the PCC, using a CGG with DLT and smart contracts. In addition, the TPF smart contract, applied with the CGG and relay—for controlling breakers at the PCC between the grid-side and customer-owned wind farm-side—was based on a smart contract with multiple boundaries represented by the operation time, breaker states, and power quality conditions, to obtain a TPF between 0.90 and 1.00 at the grid-side and consequently reduce power line losses. As a future research topic, the number of use case test scenarios with multiple DERs will be increased, focusing not only on power factor deviations during normal operations and temporary electrical faults, but also covering extreme electrical grid conditions like cyberattacks or protective relay misoperations. It will assess the robustness of the CGG system, evaluating the scalability and real-time performance of the DLT in large-scale grids with numerous PCCs for applications using customer-owned wind farms and IB-PV array farms, and in advanced smart contract applications, like the detection of transient anomaly events with high harmonics using time domain protocols.

8. Conclusions

The novel employment of CGG using DLT with a TPF smart contract is a modern electrical grid application, using a relay at the PCC between the main electrical utility and a customer-owned wind farm and protecting the integrity of shared data from the relay. In this study, the TPF smart contract with CGG using DLT for the electrical grid with a customer-owned wind farm was implemented, and the flowcharts for the TPF smart contract were satisfactorily assessed with a real-time simulator and a CGG system with relays in the loop.
This TPF smart contract was satisfactorily assessed in different test scenarios. In normal operations, a poor TPF smaller than +0.90 (grid-side) lasting for more than 400 s was observed as the breaker (wind farm side) was operated by the smart contract. A good TPF between +0.90 and +1.00 on the grid side for more than 400 s was observed as the breakers were not operated by the smart contract. Also, in abnormal conditions, such as temporary electrical faults that resulted in a poor TPF smaller than +0.90 on the grid side, the smart contract did not operate the breakers of the SEL 700GT relay.
The TPF smart contract improved the TPF on the grid-side, and consequently reduced the power line losses on the grid-side. It did so by eliminating the reactive power fed to the wind farm-side and by implementing a CGG with DLT that secured the data and breaker control commands between the main electrical grid utility and a customer-owned wind farm. The desired TPF limits on the grid-side were defined as being between +0.9 and +1.0, and the operation of the breakers on the grid side and customer-owned wind farm side were controlled by the relay through the smart contract. The data collected from the CGG system were used to enact the TPF smart contract. The events from the real-time simulator, CGG, and relay show a successful assessment of the TPF smart contract with a CGG using DLT. In the future, a CGG with DLT and a smart contract will be used in other electrical grid applications between the main utility grids and customer-owned DER.

Author Contributions

Conceptualization, E.C.P., G.H., R.B.H. and A.W.; methodology, E.C.P., G.H. and A.W.; validation, E.C.P. and G.H.; formal analysis, E.C.P. and G.H.; investigation, E.C.P. and G.H.; resources, E.C.P., G.H. and R.B.H.; data curation, E.C.P. and G.H.; writing—original draft preparation, E.C.P., G.H., A.W. and R.B.H.; writing—review and editing, E.C.P., G.H., A.W. and R.B.H. All authors have read and agreed to the published version of the manuscript.

Funding

This research received no external funding.

Data Availability Statement

Data available on request from the authors.

Acknowledgments

This manuscript has been authored by UT–Battelle, LLC, under contract DE–AC05–00OR22725 with the US Department of Energy (DOE). The US government retains and the publisher, by accepting the article for publication, acknowledges that the US government retains a nonexclusive, paid-up, irrevocable, worldwide license to publish or reproduce the published form of this manuscript, or allow others to do so, for US government purposes. DOE will provide public access to these results of federally sponsored research in accordance with the DOE Public Access Plan (http://energy.gov/downloads/doe-public-access-plan, accessed on 1 January 2023).

Conflicts of Interest

The authors declare no conflicts of interest.

References

  1. Rizwan, M.; Hong, L.; Waseem, M.; Ahmad, S.; Sharaf, M.; Shafiq, M. A Robust Adaptive Overcurrent Relay Coordination Scheme for Wind-Farm-Integrated Power Systems Based on Forecasting the Wind Dynamics for Smart Energy Systems. Appl. Sci. 2020, 10, 6318. [Google Scholar] [CrossRef]
  2. Naheed, K.S.; Louki, S.; Ghedira-Guegan, C.; Benkhelifa, E.; Bani-Hani, A. Blockchain smart contracts: Applications, challenges, and future trends. Peer-Peer Netw. Appl. 2021, 14, 2901–2925. [Google Scholar]
  3. Foti, M.; Vavalis, M. What blockchain can do for power grids? Blockchain Res. Appl. 2021, 2, 100008. [Google Scholar] [CrossRef]
  4. Bellaj, B.; Ouaddah, A.; Bertin, E.; Crespi, N.; Mezrioui, A. Drawing the Boundaries Between Blockchain and Blockchain-Like Systems: A Comprehensive Survey on Distributed Ledger Technologies. Proc. IEEE 2024, 112, 247–299. [Google Scholar] [CrossRef]
  5. AlSobeh, A.M.R. OSM: Leveraging model checking for observing dynamic behaviors in aspect-oriented applications. Online J. Commun. Media Technol. 2023, 13, e202355. [Google Scholar] [CrossRef]
  6. AlSobeh, A.M.R.; Magableh, A.A. BlockASP: A Framework for AOP-Based Model Checking Blockchain System. IEEE Access 2023, 11, 115062–115075. [Google Scholar] [CrossRef]
  7. Hong, Z.; Guo, S.; Zhou, E.; Chen, W.; Huang, H.; Zomaya, A. GriDB: Scaling Blockchain Database via Sharding and Off-Chain Cross-Shard Mechanism. Proc. VLDB Endow. 2023, 16, 1685–1698. [Google Scholar] [CrossRef]
  8. Li, Y.; Wang, J.; Zhang, H. A survey of state-of-the-art sharding blockchains: Models, components, and attack surfaces. J. Netw. Comput. Appl. 2023, 217, 103686. [Google Scholar] [CrossRef]
  9. Gorzny, J.; Derka, M. A Rollup Comparison Framework. arXiv 2024, arXiv:2404.16150. [Google Scholar] [CrossRef]
  10. Thibault, L.T.; Sarry, T.; Hafid, A.S. Blockchain Scaling using Rollups: A Comprehensive Survey. IEEE Access 2022, 20, 93039–93054. [Google Scholar] [CrossRef]
  11. Cai, T.; Chen, W.; Psannis, K.E.; Goudos, S.K.; Yu, Y.; Zheng, Z.; Wan, S. On-Chain and Off-Chain Scalability Techniques chapter. In Blockchain Scalability; Chen, W., Zheng, Z., Huang, H., Eds.; Springer: Singapore. [CrossRef]
  12. Liu, Y.; Lu, Q.; Zhu, L.; Paik, H.Y.; Staples, M. A Systematic Literature Review on Blockchain Governance. arXiv 2021, arXiv:2105.05460. [Google Scholar] [CrossRef]
  13. Barceló, E.; Dimić-Mišić, K.; Imani, M.; Brkić, V.S.; Hummel, M.; Gane, P. Regulatory Paradigm and Challenge for Blockchain Integration of Decentralized Systems: Example—Renewable Energy Grids. Sustainability 2023, 15, 2571. [Google Scholar] [CrossRef]
  14. Zhuang, P.; Zamir, T.; Liang, H. Blockchain for Cyber Security in Smart Grid: A Comprehensive Survey. IEEE Trans. Ind. Inform. 2020, 17, 3–19. [Google Scholar] [CrossRef]
  15. Chu, H.; Zhang, P.; Dong, H.; Xiao, Y.; Ji, S.; Li, W. A survey on smart contract vulnerabilities: Data sources, detection and repair. Inf. Softw. Technol. 2023, 159, 107221. [Google Scholar] [CrossRef]
  16. Kolb, J.; AbdelBaky, M.; Katz, R.H.; Culler, D.E. Core Concepts, Challenges, and Future Directions in Blockchain. ACM Comput. Surv. (CSUR) 2020, 53, 1–39. [Google Scholar] [CrossRef]
  17. Yap, K.Y.; Chin, H.H.; Klemeš, J.J. Blockchain technology for distributed generation: A review of current development, challenges and future prospect. Renew. Sustain. Energy Rev. 2023, 175, 113170. [Google Scholar] [CrossRef]
  18. Nour, M.; Chaves-Avila, J.P.; Sanchez-Miralles, A. Review of Blockchain Potential Applications in the Electricity Sector and Challenges for Large Scale Adoption. IEEE Access 2022, 10, 47384–47418. [Google Scholar] [CrossRef]
  19. Ji, Q.; Hu, C.; Duan, Q.; Huang, C.; Zhao, X. Decentralized power grid fault traceability system based on internet of things and blockchain technology. Front. Energy Res. 2023, 10, 861321. [Google Scholar] [CrossRef]
  20. Piesciorovsky, E.C.; Hahn, G.; Borges Hink, R.; Werth, A.; Lee, A. Electrical substation grid testbed for DLT applications of electrical fault detection, power quality monitoring, DERs use cases and cyber-events. Energy Rep. 2023, 10, 1099–1115. [Google Scholar] [CrossRef]
  21. He, H.; Luo, Z.; Wang, Q.; Chen, M.; He, H.; Gao, L. Joint Operation Mechanism of Distributed Photovoltaic Power Generation Market and Carbon Market Based on Cross-Chain Trading Technology. IEEE Access 2020, 8, 66116–66130. [Google Scholar] [CrossRef]
  22. Bokkisam, H.R.; Singh, S.; Acharya, R.M.; Selvan, M.P. Blockchain-based peer-to-peer transactive energy system for community microgrid with demand response management. CSEE J. Power Energy Syst. 2022, 8, 198–211. [Google Scholar]
  23. Liang, G.; Weller, S.R.; Luo, F.; Zhao, J.; Dong, Z.Y. Distributed Blockchain-Based Data Protection Framework for Modern Power Systems Against Cyber Attacks. IEEE Trans. Smart Grid. 2019, 10, 3162–3173. [Google Scholar] [CrossRef]
  24. Mnatsakanyan, A.; Albeshr, H.; Al Marzooqi, A.; Bilbao, E. Blockchain-Integrated Virtual Power Plant Demonstration. In Proceedings of the 2020 2nd International Conference on Smart Power and Internet Energy Systems, Bangkok, Thailand, 15–18 September 2020; pp. 172–175. [Google Scholar]
  25. Cioara, T.; Antal, M.; Mihailescu, V.T.; Antal, C.D.; Anghel, I.M.; Mitrea, D. Blockchain-Based Decentralized Virtual Power Plants of Small Prosumers. IEEE Access 2021, 9, 29490–29504. [Google Scholar] [CrossRef]
  26. Schweitzer Engineering Laboratories Inc. SEL-700G Generator and Intertie Protection Relays Instruction Manual. Available online: https://selinc.com/products/700G/docs/ (accessed on 9 October 2024).
  27. PowerLogic™ PM5500/PM5600/PM5700 Series User Manual. Schneider Electric, Document Number HRB1684301, Version 16, 31 December 2023. pp. 1–238. Available online: https://www.se.com/us/en/download/document/HRB1684301/ (accessed on 9 October 2024).
  28. Piesciorovsky, E.C.; Borges Hink, R.; Werth, A.; Hahn, G.; Lee, A.; Richards, J.; Polsky, Y. Assessment of the Electrical Substation-Grid Test Bed with Inside/Outside Devices and Distributed Ledger; ORNL/TM-2022/1840; Oak Ridge National Laboratory: Oak Ridge, TN, USA, 2022; pp. 1–87. [Google Scholar]
  29. Piesciorovsky, E.C.; Borges Hink, R.; Werth, A.; Hahn, G.; Lee, A.; Polsky, Y. Assessment and Commissioning of Electrical Substation Grid Testbed with a Real-Time Simulator and Protective Relays/Power Meters in the Loop. Energies 2023, 16, 4407. [Google Scholar] [CrossRef]
  30. Borges Hink, R.; Hahn, G.; Werth, A.; Piesciorovsky, E.C.; Lee, A.; Monday, W.; Polsky, Y. Oak Ridge National Laboratory Pilot Demonstration of an Attestation and Anomaly Detection Framework Using Distributed Ledger Technology for Power Grid Infrastructure; ORNL/TM-2022/2527; Oak Ridge National Laboratory: Oak Ridge, TN, USA, 2022; pp. 1–56. [Google Scholar]
  31. IEEE Std 1459TM-2010; Standard Definitions for the Measurement of Electric Power Quantities Under Sinusoidal, Nonsinusoidal, Balanced, or Unbalanced Conditions. IEEE Power & Energy Society: Piscataway, NJ, USA, 2010; pp. 1–40.
  32. Introduction to Power Factor. Introduction to Power Factor. Wyandotte Municipal Services, Revision 15 September 2004. pp. 1–12. Available online: https://cms2.revize.com/revize/wyandottems/document_center/Electric/PowerFactor.pdf (accessed on 9 October 2024).
  33. Zhao, C.; Han, D.; Li, C.; Wang, H. A Blockchain Consensus Mechanism to Optimize Reputation-Based Distributed Energy Trading in Urban Energy System. IEEE Access 2024, 12, 53698–53712. Available online: https://ieeexplore.ieee.org/document/10496579 (accessed on 13 October 2024). [CrossRef]
  34. Yao, S.; Tian, X.; Chen, J.; Xiong, Y. Privacy preserving distributed smart grid system based on Hyperledger Fabric and Wireguard. Int. J. Netw. Manag. 2023, 33, e2193. [Google Scholar] [CrossRef]
  35. Zhao, Z.; Guo, J.; Luo, X.; Xue, J.; Sing Lai, C.; Xu, Z.; Lei Lai, L. Energy Transaction for Multi-Microgrids and Internal Microgrid Based on Blockchain. IEEE Access 2020, 8, 144362–144372. [Google Scholar] [CrossRef]
  36. Sikeridis, D.; Bidram, A.; Devetsikiotis, M.; Reno, M.J. A Blockchain-Based Mechanism for Secure Data Exchange in Smart Grid Protection Systems. In Proceedings of the 2020 IEEE 17th Annual Consumer Communications & Networking Conference (CCNC), Las Vegas, NV, USA, 10–13 January 2020; pp. 1–6. [Google Scholar]
  37. Edvard, C. Six Common Bus Configurations in Substations up to 354 kV. Electrical Engineering Portal, 18 March 2019. Available online: https://electrical-engineering-portal.com/bus-configurations-substations-345-kv (accessed on 9 October 2024).
  38. Schweitzer Engineering Laboratories Inc. SEL 735 Power Quality and Revenue Meter Instruction Manual. Available online: https://selinc.com/products/735/docs/ (accessed on 9 October 2024).
  39. Schweitzer Engineering Laboratories Inc. SEL 421-4, -5, Protection, Automation, and Control System Instruction Manual. Available online: https://selinc.com/products/421/docs/ (accessed on 9 October 2024).
  40. Schweitzer Engineering Laboratories Inc. SEL 451-5 Protection, Automation, and Bay Control System and SEL 400 Series Relays Instruction Manual. Available online: https://selinc.com/products/451/docs/ (accessed on 9 October 2024).
  41. Schweitzer Engineering Laboratories Inc. SEL 351S Protection System Instruction Manual. Available online: https://selinc.com/products/351S/docs/ (accessed on 9 October 2024).
  42. Du, B.; He, Y.; An, B.; Zhang, C. Remaining Useful Performance Estimation for Complex Analog Circuit Based on Maximal Information Coefficient and Bidirectional Gate Recurrent Unit. IEEE Access 2020, 8, 102449–102466. [Google Scholar] [CrossRef]
  43. Piesciorovsky, E.C.; Smith, T.; Mukherjee, S.K.; Marshall, M.W. A Generic Method for Interfacing IEDs using Low Voltage Interfaces to Real-time Simulators with Hardware in the Loop. Electr. Power Syst. Res. J. 2021, 199, 107431. [Google Scholar] [CrossRef]
  44. Piesciorovsky, E.C.; Schulz, N.N. Comparison of Programmable Logic and Setting Group Methods for Adaptive Overcurrent Protection in Microgrids. Electr. Power Syst. Res. J. 2017, 151, 273–282. [Google Scholar] [CrossRef]
  45. Piesciorovsky, E.C.; Schulz, N.N. Fuse Relay Adaptive Overcurrent Protection Scheme for Microgrid with Distributed Generators. IET Gener. Transm. Distrib. 2016, 11, 540–549. [Google Scholar] [CrossRef]
  46. S&C Electric Company. Total Clearing Time—Current Characteristic Curves Positrol® Fuse Links–S&C “T” Speed (TCC 170-6-2). Available online: https://www.sandc.com/en/products--services/products/positrol-fuse-links/ (accessed on 9 October 2024).
  47. DTE Energy. Electric Choice Understanding Power Factor. Available online: https://www.dteenergy.com/content/dam/dteenergy/deg/website/business/service-request/electric/electric-choice/powerFactor.pdf (accessed on 9 October 2024).
  48. Voloh, I.; Ernst, T. Review of Capacitor Bank Control Practices, GE Grid Solutions. In Proceedings of the 72nd Annual Conference for Protective Relay Engineers, Texas A&M University, College Station, TX, USA, 25–28 March 2019; pp. 1–13. [Google Scholar]
  49. New, W.C. Load Shedding, Load Restoration and Generator Protection Using Solid-state and Electromechanical Underfrequency Relays. GET-6449, GE Power Management, 215 Anderson Avenue, Markham, Ontario, Canada. Available online: https://www.gevernova.com/grid-solutions/products/applications/get6449.pdf (accessed on 9 October 2024).
  50. ANSI/IEEE Standard C37.2; Standard for Electrical Power System Device Function Numbers, Acronyms, and Contact Designations. IEEE Power and Energy Society: Piscataway, NJ, USA, 3 October 2008.
  51. Hosseinzadeh, H. Distribution System, Protection ES586B: Power System Protection. University of Western Ontario, 5 May 2008. pp. 1–16. Available online: https://www.eng.uwo.ca/people/tsidhu/documents/es586b-hesam%20hosseinzadeh-250441131.pdf (accessed on 9 October 2024).
  52. Dreyer, J.; Fischer, M.; Tönjes, R. Performance Analysis of Hyperledger Fabric 2.0 Blockchain Platform. In Proceedings of the Workshop on Cloud Continuum Services for Smart IoT Systems, New York, NY, USA, 16–19 November 2020; pp. 32–38. [Google Scholar] [CrossRef]
  53. Zhou, Y.; Manea, A.N.; Hua, W.; Wu, J.; Zhou, W.; Yu, J. Application of Distributed Ledger Technology in Distribution Networks. Proc. IEEE 2022, 110, 1963–1975. [Google Scholar] [CrossRef]
  54. Liu, Y.; He, J.; Li, X.; Chen, J.; Liu, X.; Peng, S.; Cao, H.; Wang, Y. An overview of blockchain smart contract execution mechanism. J. Ind. Inf. Integr. 2024, 41, 100674. [Google Scholar] [CrossRef]
  55. Stefanescu, D.; Montalvillo, L.; Galán-García, P.; Unzilla, J.; Urbieta, A. A Systematic Literature Review of Lightweight Blockchain for IoT. IEEE Access 2022, 10, 123138–123159. [Google Scholar] [CrossRef]
  56. Van Rensburg, M.; Dolezilek, D.; Dearien, J. Case Study: Using IEC 61850 Network Engineering Guideline Test Procedures to Diagnose and Analyze Ethernet Network Installations. In Proceedings of the PAC World Africa Conference, Johannesburg, South Africa, 12–13 November 2015; pp. 1–10. [Google Scholar]
  57. Habib, A.A.; Hasan, M.K.; Alkhayyat, A.; Islam, S.; Sharma, R.; Alkwai, L.M. False data injection attack in smart grid cyber physical system: Issues, challenges, and future direction. Comput. Electr. Eng. 2023, 107, 108638. [Google Scholar] [CrossRef]
  58. Daeli, A.; Mohagheghi, S. Power Grid Infrastructural Resilience against Extreme Events. Energies 2023, 16, 64. [Google Scholar] [CrossRef]
  59. Immaniar, D.; Aryani, A.A.; Ula, S.Z. Challenges Smart Grid in Blockchain Applications. Blockchain Front. Technol. 2023, 2, 1–9. [Google Scholar] [CrossRef]
Figure 1. (a) Electrical grid diagram and (b) equipment rack.
Electronics 13 04055 g001
Figure 2. Testbed with relays, meters, and workstation computers.
Electronics 13 04055 g002
Figure 3. Architecture of testbed.
Electronics 13 04055 g003
Figure 4. Three-phase power system diagram of the substation and grid with customer-owned wind farm.
Electronics 13 04055 g004
Figure 5. Power factor sign convention based on IEC (a) and IEEE (b) standards.
Electronics 13 04055 g005
Figure 6. Phasor diagrams (a,b) and IEEE standard power factor sign convention (c).
Electronics 13 04055 g006
Figure 7. Measured TPF from real-time simulator (a) and CGG (b).
Electronics 13 04055 g007
Figure 8. Time window flowchart for TPF smart contract.
Electronics 13 04055 g008
Figure 9. Phases and main conditions of TPF smart contract alongside a flowchart of the operation.
Electronics 13 04055 g009
Figure 10. Architecture of the DLT with TPF condition chaincode.
Electronics 13 04055 g010
Figure 11. Measured smart contract conditions (a) and boundaries (b).
Electronics 13 04055 g011
Figure 12. Measured TPF from real-time simulator (a,b), CGG (c,d), and relay (e,f) in test 1 for a normal situation and no breaker operation.
Electronics 13 04055 g012
Figure 13. TPF measured using real-time simulator (a,b), CGG (c,d), and relay (e,f) in test 2 for a normal situation and wind farm-side breaker BKX operation.
Electronics 13 04055 g013
Figure 14. TPF measured using real-time simulator (a,b), CGG (c,d), and relay (e,f) in test 3 for temporary 3LG electrical fault situation and no breaker operation.
Electronics 13 04055 g014
Figure 15. TPF measured using real-time simulator (a,b), CGG (c,d), and relay (e,f) in test 4 for temporary SLG electrical fault situation and no breaker operation.
Electronics 13 04055 g015
Table 1. Novelties of this study.
FieldNovelties
ApplicationOperating a power quality method with a customer-owned DER, based on reducing the reactive energy in the grid-side power lines using a TPF smart contract with CGG and DLT, following the use of traditional power quality methods like capacitor banks, load shedding, or transformer/load tap changers.
Data SecurityUsing the CGG with DLT and smart contracts for securing data from the relay located at the PCC between electrical utility grid and customer-owned DER.
AssessmentEvaluating the TPF smart contract in an advanced substation grid testbed with a real-time simulator using DLT nodes and relay in-the-loop instead of using software simulations.
DER: distributed energy resource; TPF: total power factor; CGG: cyber grid guard; DLT: distributed ledger technology; PCC: point of common coupling.
Table 2. Time range of frequency protection elements.
Protection
Elements
Protection NumberProtection DescriptionTime SettingTime Range (s)
X side frequency8181: Frequency protection on the BKX breaker sideFrequency delay time0.00 to 400.00
Y side frequency8181: Frequency protection on the BKY breaker sideFrequency delay time0.00 to 400.00
V/Hz 2424: Overexcitation protection, ratio of the voltage to frequencyReset time0.00 to 400.00
Table 3. Definitions of terms related to Distributed Ledger Technology.
TermsDefinitions
Cyber Grid Guard (CGG)Cyber Grid Guard is a modular software framework that performs data integrity attestation using a storage layer consisting of a database and DLT.
Distributed Ledger Technology (DLT)Distributed Ledger Technology (DLT) refers to distributed and decentralized secure database platforms that use consensus mechanisms to reach agreements on state. The most common types of DLT are implemented using blockchains.
Smart ContractsSmart contracts are automated programs that run on top of DLTs and enforce terms and conditions on transaction data and are executed in a distributed manner.
On-chainOn-chain refers to functionality or data that exist in the distributed ledger.
Off-ChainOff-Chain refers to functionality or data that exist outside of the distributed ledger (e.g., in a traditional database).
Table 4. GOOSE data set fields used in event checks.
Field NameData TypeData Description
magXTotPFFloat32Total power factor for X.
magYTotPFFloat32Total power factor for Y.
breakerXOpenBooleanStatus of breaker X (open = 1, closed = 0).
breakerYOpenBooleanStatus of breaker Y (open = 1, closed = 0).
Table 5. Test scenarios.
* TEST 1: Normal situation and no breaker operation.Title: Main feeder loads are connected only with the grid-side breaker (BKY) that measures a TPF ≥ +0.90; thus, the smart contract does not operate any breakers.
Description: Initially the grid-side breaker (BKY) is closed and the wind farm-side breaker (BKX) is opened. The wind farm–side load has 2.06 MW, +1000 VAR, −1000 VAR. The fossil fuel power plant (Utility C) and the substation (Utility A) are connected to the main feeder loads (2 × [1.25 MW, +0.5 MVAR, −1000 VAR]). The grid-side breaker (BKY) shows a TPF ≥ +0.90, meaning reactive losses are practically none on the grid-side power line. The TPF smart contract does not operate the breakers or the grid side (BKY) or wind farm (BKX) for a TPF ≥ +0.90.
* TEST 2:
Normal situation and wind farm-side breaker (BKX) operation.
Title: Main feeder loads are connected with the grid-side breaker (BKY) and wind farm-side breaker (BKY); then the grid-side breaker (BKY) measures a poor TPF, and the wind farm-side breaker (BKX) is opened.
Description: Initially the grid-side breaker (BKY) is closed and the wind farm-side breaker (BKX) is closed. The wind farm-side load has 2.06 MW, +1000 VAR, −1000 VAR. The fossil fuel power plant (Utility C) through the substation (Utility A) and the wind farm are connected to the main feeder loads (2 × [1.25 MW, +0.5 MVAR, −1000 VAR]). The grid-side breaker (BKY) shows a TPF < +0.90, meaning that the TPF in the grid-side power line generates reactive losses. The wind farm-side breaker (BKX) is opened after 400 s, and the TPF is ≥ +0.90 at the grid-side breaker (BKY).
* TEST 3: Temporary 3LG electrical fault situation and no breaker operation.Title: Main feeder loads are connected only with the grid-side breaker (BKY) and measure a TPF > +0.90. Thus, a temporary 3LG electrical fault of 1 s (60 cycles) at the grid-side power line is set, but the smart contract does not operate any breaker because the electrical fault is cleared.
Description: Initially the grid-side breaker (BKY) is closed and the wind farm–side breaker (BKX) is opened. The wind farm–side load has 2.06 MW, +1000 VAR, −1000 VAR. The fossil fuel power plant (Utility C) through the substation (Utility A) is connected to the main feeder loads (2 × [1.25 MW, +0.5 MVAR, −1000 VAR]). Then, a temporary 3LG electrical fault of 1 s (60 cycles) at the end of the grid-side power line is set at 100 s. The grid-side breaker (BKY) shows a swing and poor power factor during the fault state, until the fault is clears by itself. However, the TPF smart contract does not operate the grid-side breaker (BKY), and the wind farm–side breaker (BKX) remains open.
* TEST 4: Temporary SLG electrical fault situation and no breaker operation.Title: Main feeder loads are connected only with the grid-side breaker (BKY) and measure a TPF > +0.90. Thus, a temporary SLG electrical fault of 1 s (60 cycles) at the grid-side power line is set, but the smart contract does not operate any breaker because the electrical fault is cleared.
Description: Initially the grid-side breaker (BKY) is closed and the wind farm-side breaker (BKX) is opened. The wind farm-side load has 2.06 MW, +1000 VAR, −1000 VAR. The fossil fuel power plant (Utility C) and the substation (Utility A) are connected to the main feeder loads (2 × [1.25 MW, +0.5 MVAR, −1000 VAR]). Then, a temporary SGL electrical fault of 1 s (60 cycles) at the end of the grid-side power line is set at 100 s. The grid-side breaker (BKY) swings and shows a poor power factor during the fault state, until the fault clears by itself. However, the TPF smart contract does not operate the grid-side breaker (BKY), and the wind farm-side breaker (BKX) remains open.
* Tests 1–4 were run for a total time of 600 s. Tests 1, 3, and 4 started the simulation with all breakers closed; then, the breaker BKX (wind farm-side) was tripped manually from the SEL 700GT relay to obtain the initial condition, 3LG (three lines to ground), and SLG (single line to ground).
Disclaimer/Publisher’s Note: The statements, opinions and data contained in all publications are solely those of the individual author(s) and contributor(s) and not of MDPI and/or the editor(s). MDPI and/or the editor(s) disclaim responsibility for any injury to people or property resulting from any ideas, methods, instructions or products referred to in the content.

