Article

Usability of Inexpensive Optical Pulse Sensors for Textile Integration and Heartbeat Detection Code Development

1
Faculty of Engineering Sciences and Mathematics, Bielefeld University of Applied Sciences, 33619 Bielefeld, Germany
2
Virtual Institute of Applied Research on Advanced Materials (VIARAM)
*
Author to whom correspondence should be addressed.
Electronics 2023, 12(7), 1521; https://doi.org/10.3390/electronics12071521
Submission received: 27 February 2023 / Revised: 18 March 2023 / Accepted: 22 March 2023 / Published: 23 March 2023
(This article belongs to the Special Issue Wearable Sensing Devices and Technology)

Abstract

:
Low-cost sensors and single circuit boards such as Arduino and Raspberry Pi have increased the possibility of measuring biosignals by smart textiles with embedded electronics. One of the main problems with such e-textiles is their washability. While batteries are usually removed before washing, single-board computers and microcontrollers, as well as electronic sensors, would ideally be kept inside a user-friendly smart garment. Here, we show results of washing tests with optical pulse sensors, which can be used in smart gloves not only for hospitalized patients, and ATtiny85 as an example of a single-board microcontroller, sewn onto different cotton fabrics. We report that even without any encapsulation, all tested sensors and microcontrollers endured 10 washing cycles at 30–60 °C without defects. For easier garment integration, we suggest using an ESP8266 with integrated Wi-Fi functionality and offer a new program code to measure beats per minute (BMP) with optimized accuracy.

1. Introduction

The increasing amount of cardiac diseases in many countries suggests the implementation of biosignal measurements in smart textiles [1,2]. Usually, the electrocardiogram (ECG) of a person is measured as one of the most important ways to detect potential irregularities, which is why several research groups developed single-lead or even 12-lead ECG garments with textile electrodes [3,4,5,6]. However, such textile electrodes necessitate a sufficient skin contact to transfer the very small ECG voltages from the skin reliably. This is normally achieved by applying a relatively high pressure [7,8,9,10], which may result in an undesired feeling and potentially even skin irritations.
In many cases, however, only the pulse needs to be monitored, offering not only the pure pulse rate but also the pulse variability as a measure of the wealth of the heart and the potential to register missing beats, if the applied software is suitable for this. While the pulse can be measured by the aforementioned conductive textile ECG electrodes, it can also be detected optically [11,12,13]. Especially when patients are examined by magnetic resonance imaging (MRI), optical pulse measurements can avoid any potential hazard, which may occur due to the wires of conventional ECG equipment [14].
In optical pulse measurements, the photoplethysmographic (PPG) waveform is derived by the time-dependent light absorption in the local tissue [15] and is strongly correlated with the ECG, if measured with high accuracy. An example of the correlation between both measures in the case of cardiac arrhythmia is shown in Figure 1 [15]. The pulse rate is usually measured between neighboring peaks or troughs or at the mean values [15]. In a highly resolved signal, a small minimum between the systole part, starting from the trough, and the subsequent diastole part can be visible [16].
Pulse oximeters are used in many clinical areas, but their measurements can be negatively influenced by patients’ behavior, as well as technical errors [17]. Another problematic feature of common pulse oximeters is the rigid material of the clip, used to fix it on a finger, especially in long-term measurements [18]. On the other hand, smart watches containing optical pulse sensors may work properly for healthy people [19], but are again not suitable for 24/7 monitoring of patients in hospitals where correct placement cannot be regularly checked, and data transfer cannot be fit to the respective IT infrastructure. Most important, however, is the finding that pulse measurements are most sensitive in the carotid region and lowest in the wrist region, where smart watches are usually worn [20].
While the idea to use optical pulse measurements instead of electrical ECG measurements is, as discussed above, not new and has long been introduced into common medical technology in hospitals, the advent of steadily miniaturized microcontrollers and microcomputers nowadays offers new possibilities to integrate optical pulse sensors and the equipment for their evaluation into garments, which will not damage a patient’s skin even during long-term measurements and allow defining the optimum position(s) of one or more pulse sensors [21,22]. Nevertheless, most researchers integrate only the sensors themselves into medical smart textiles and do not examine the integration of microcontrollers or microcomputers into the fabric [23,24,25,26]. One of the main reasons for this is probably the necessary washability of all electronics which are constantly embedded in textile fabrics.
Here, we thus investigate the washability of low-cost optical pulse sensors from different producers as well as ATtiny85 as one potential microcontroller small enough to be fully embedded into a medical textile. During our study, we recognized some unnecessarily complicated parts and mathematical inaccuracies of the commonly used Arduino code for such low-cost pulse sensors and thus developed a new code for Arduino, also suitable for ESP 32 which we found to be highly suitable for such measurements as well as for textile integration.

2. Materials and Methods

The following pulse sensors were purchased for the washing tests: Funduino heart rate sensor “R13-B-6-2”, Berrybase pulse sensor, IDUINO SE050 (purchased from Conrad Electronic, Hirschau, Germany), Keyestudio XD-58C pulse sensor (purchased from Eckstein Komponente, Clausthal-Zellerfeld, Germany), and Joy-it KY-039 (DEBO Sens Heart) pulse sensor (purchased from Reichelt Elektronik, Sande, Germany). Moreover, the microcontroller Digispark Rev.3 ATtiny85 (AZ Delivery, Germany) was used in the washing tests.
While the Funduino sensor was washed separately in pre-tests for ten washing cycles, the other sensors and ATtiny85 were sewn on five different cotton woven fabrics, as depicted in Figure 2 (n = 5 for all pulse sensors and the microcontroller).
Washing was performed in a household washing machine Miele WWA028 WPS Active White with heavy-duty detergent in liquid form (30 °C, 40 °C) or in powder form (60 °C). The washing parameters for the main tests are depicted in Table 1. Washing was always performed in a laundry bag to avoid contacting the residual laundry with the multi-pin connectors of the sensors.
For the setup to be included in medical garments, the following parts were tested: A small microcontroller ESP8266 D1 mini with Wi-Fi functionality via ESPNOW, enabling unobtrusive integration into smart clothes and data transfer towards a receiver; a larger microcontroller ESP 32 as receiver, and a 1.8″ display to allow for showing the pulse signal without an additional computer monitor.

3. Results

After a brief comparison of the different pulse sensors, the results of the washing tests are depicted and discussed before improved software and hardware solutions for the future integration of a pulse sensor into medical smart clothes are provided.

3.1. Sensor Comparison
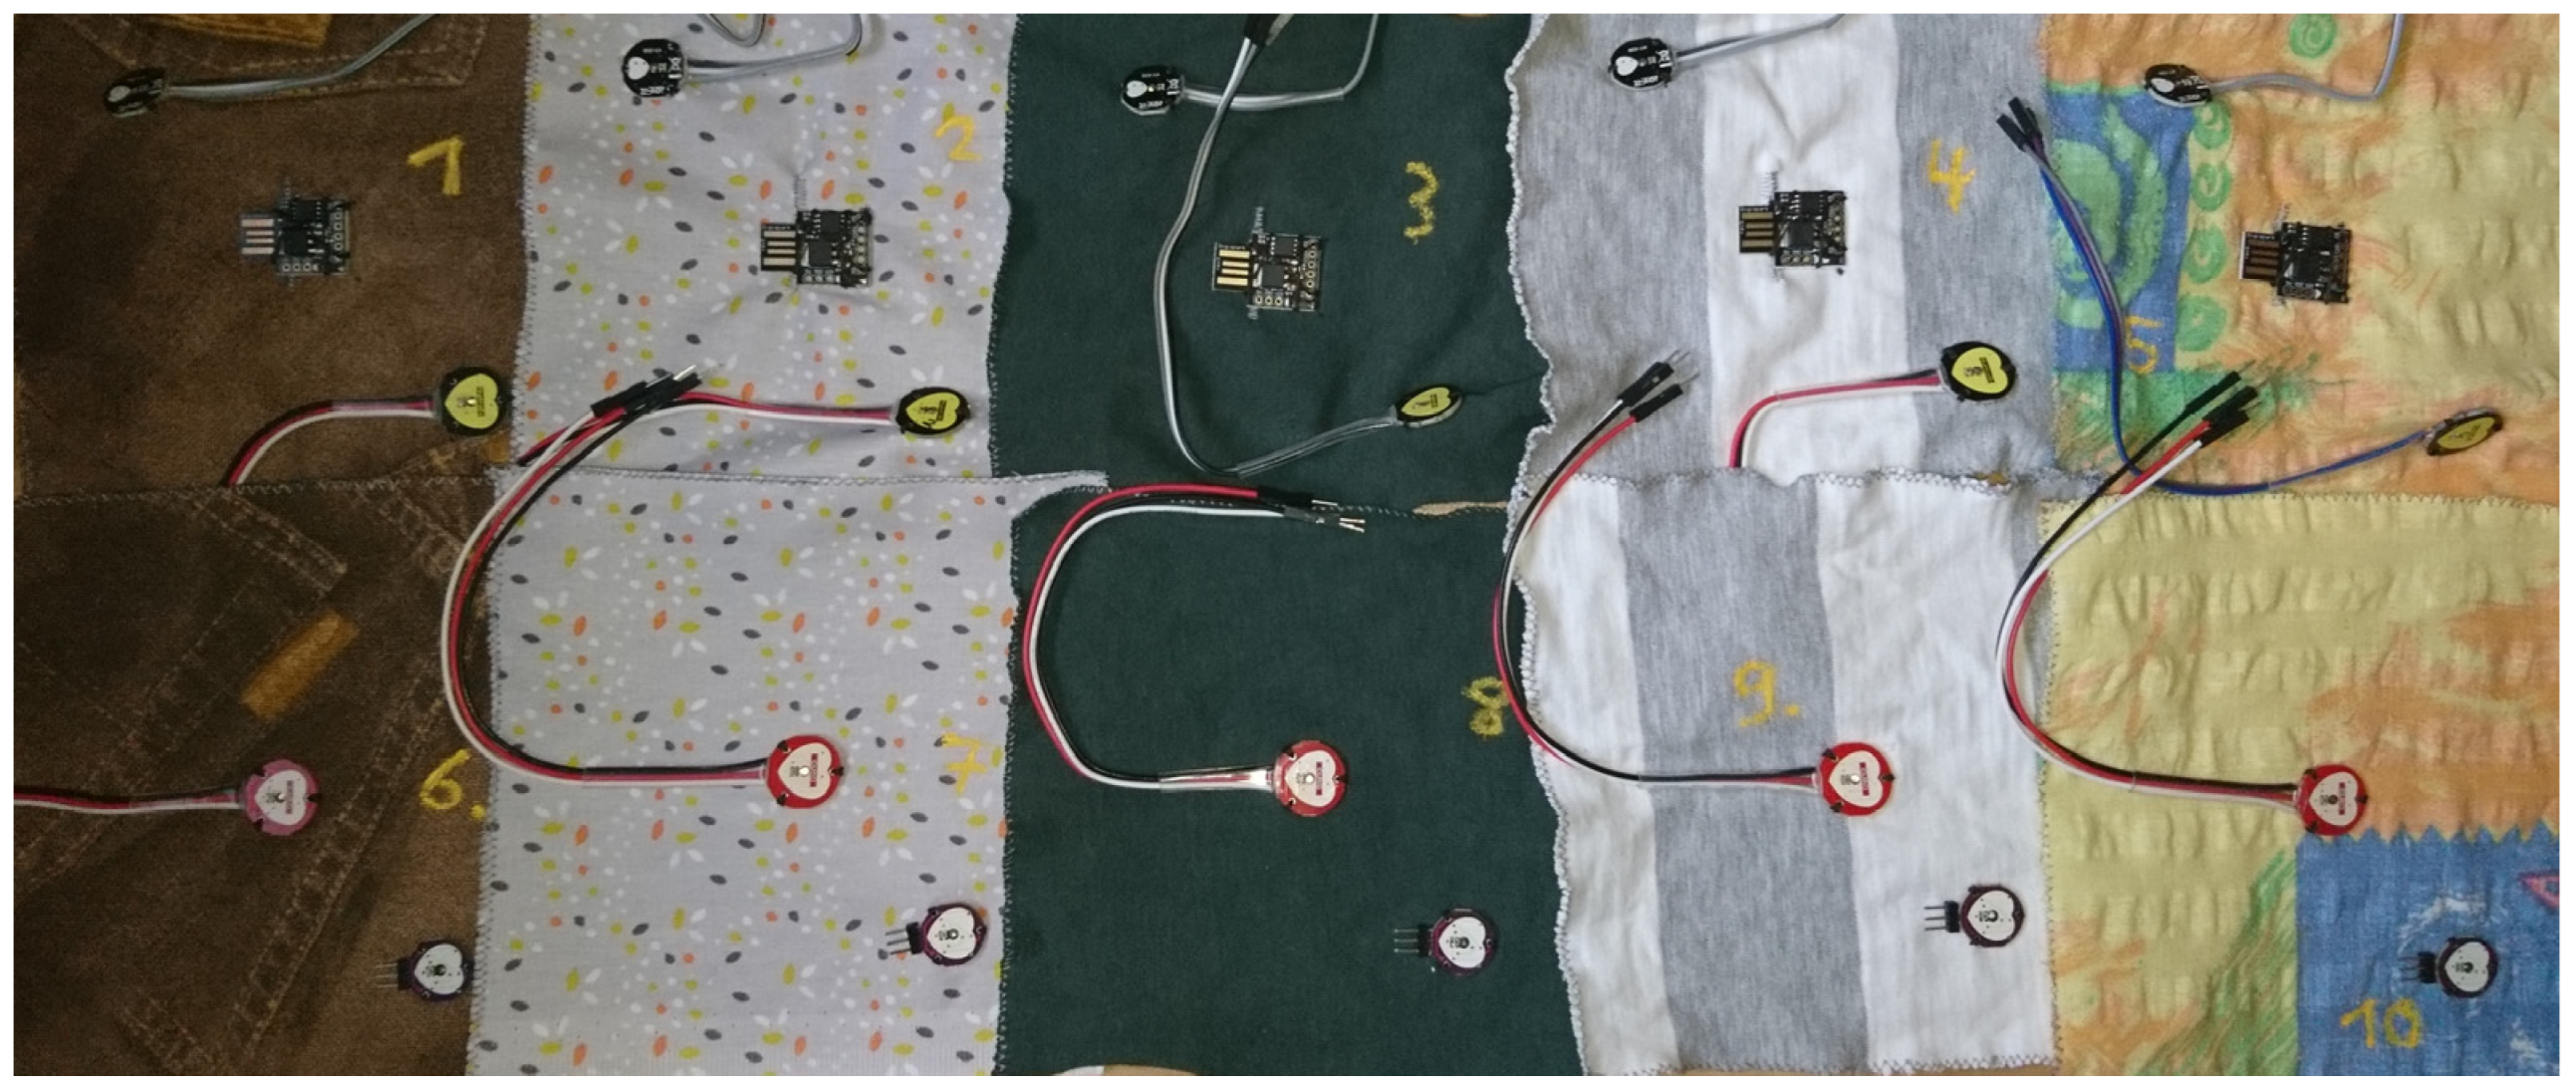
Generally, all of the aforementioned pulse sensors allow measuring the pulse, with more or less resolution. The first measurements were performed based on the code from Pulsesensor.com [27], allowing the pulse signal in the serial plotter of the Arduino IDE to be depicted. The signal of the 10-bit Arduino input is given in the value range of 0–1023, corresponding to the voltage range of 0–5 V. The base line of the signal is usually found in the middle of this value range, i.e., around 511. Figure 3 depicts measurements of different fingers from two probands, taken by the Funduino heart rate sensor, indicating the high dependence of these measurements on positioning and pressure on the skin.
Generally, for a single sensor, signal heights between approx. 100 and 500 were found, depending on the pressure between the sensor and skin, the sensor position, the blood pressure, etc. In most cases, only digital noise was observed, no power grid noise or the like which may occur due to the USB connection to the laptop [28]. For signal heights of around 100, the digital noise of ±1 corresponds to a signal variation of ±1%, which is negligible for data evaluation. Although being low-cost, this sensor apparently enables sufficiently resolved pulse measurements.
The other pulse sensors showed strongly varying signals, partly with additional noise, partly with much smaller signal heights than in the pretest with the Funduino sensor. Figure 4 depicts exemplary measurements taken on proband B’s left little finger with different sensors. While there is again a large variability of the signal height upon changes in the measurement conditions, it was also found that the maximum signal height is not identical for all sensors, i.e., with some sets of sensors from the same producer, only signal heights much smaller than 100 could be reached (e.g., Figure 4a).

3.2. Washing Tests

For a future integration of sensors and microcontrollers into smart clothes, it can be expected that microcontrollers and soldering points will be carefully encapsulated. However, it is not fully clear whether this is also possible for the optical pulse sensor, without disturbing its function. Here, washing tests were thus performed for the worst possible case, i.e., without any encapsulation.
In the pre-tests, one ATtiny85 was programmed to blink when inserted into a USB port and washed 10 times, without any reduction of this function. In the main test series, five microcontrollers sewn on textile fabrics (cf. Figure 2) were washed 10 times (cf. Table 1), again showing no inhibition of their function. Apparently, these microcontrollers are washable even without encapsulation.
The results of the sensor washing tests are given in Table 2.
While the connector cables were mostly detached after a few washing cycles, measuring pulse signals in a similar quality as before washing (cf. Figure 3) was possible for all 40 sensors after re-establishing a connection at the sensors that had connector cables attached in their original state. The self-soldered multi-pin connectors of the Berrybase sensors were not impacted by washing.
These results are promising for the planned integration of such low-cost sensors and microcontrollers into smart clothes, even if it turns out that the optical sensor unit cannot be encapsulated. However, ATtiny85 may not be the ideal choice of a small microcontroller since programming is unnecessarily complicated due to pins with double functions, and no Wi-Fi functionality is embedded. This is why the next sub-section describes a more sophisticated hardware setup, including ESP8266 D1 mini as a sender and ESP 32 as a receiver, as well as a new lean code usable on Arduino, ESP, and other microcontrollers.

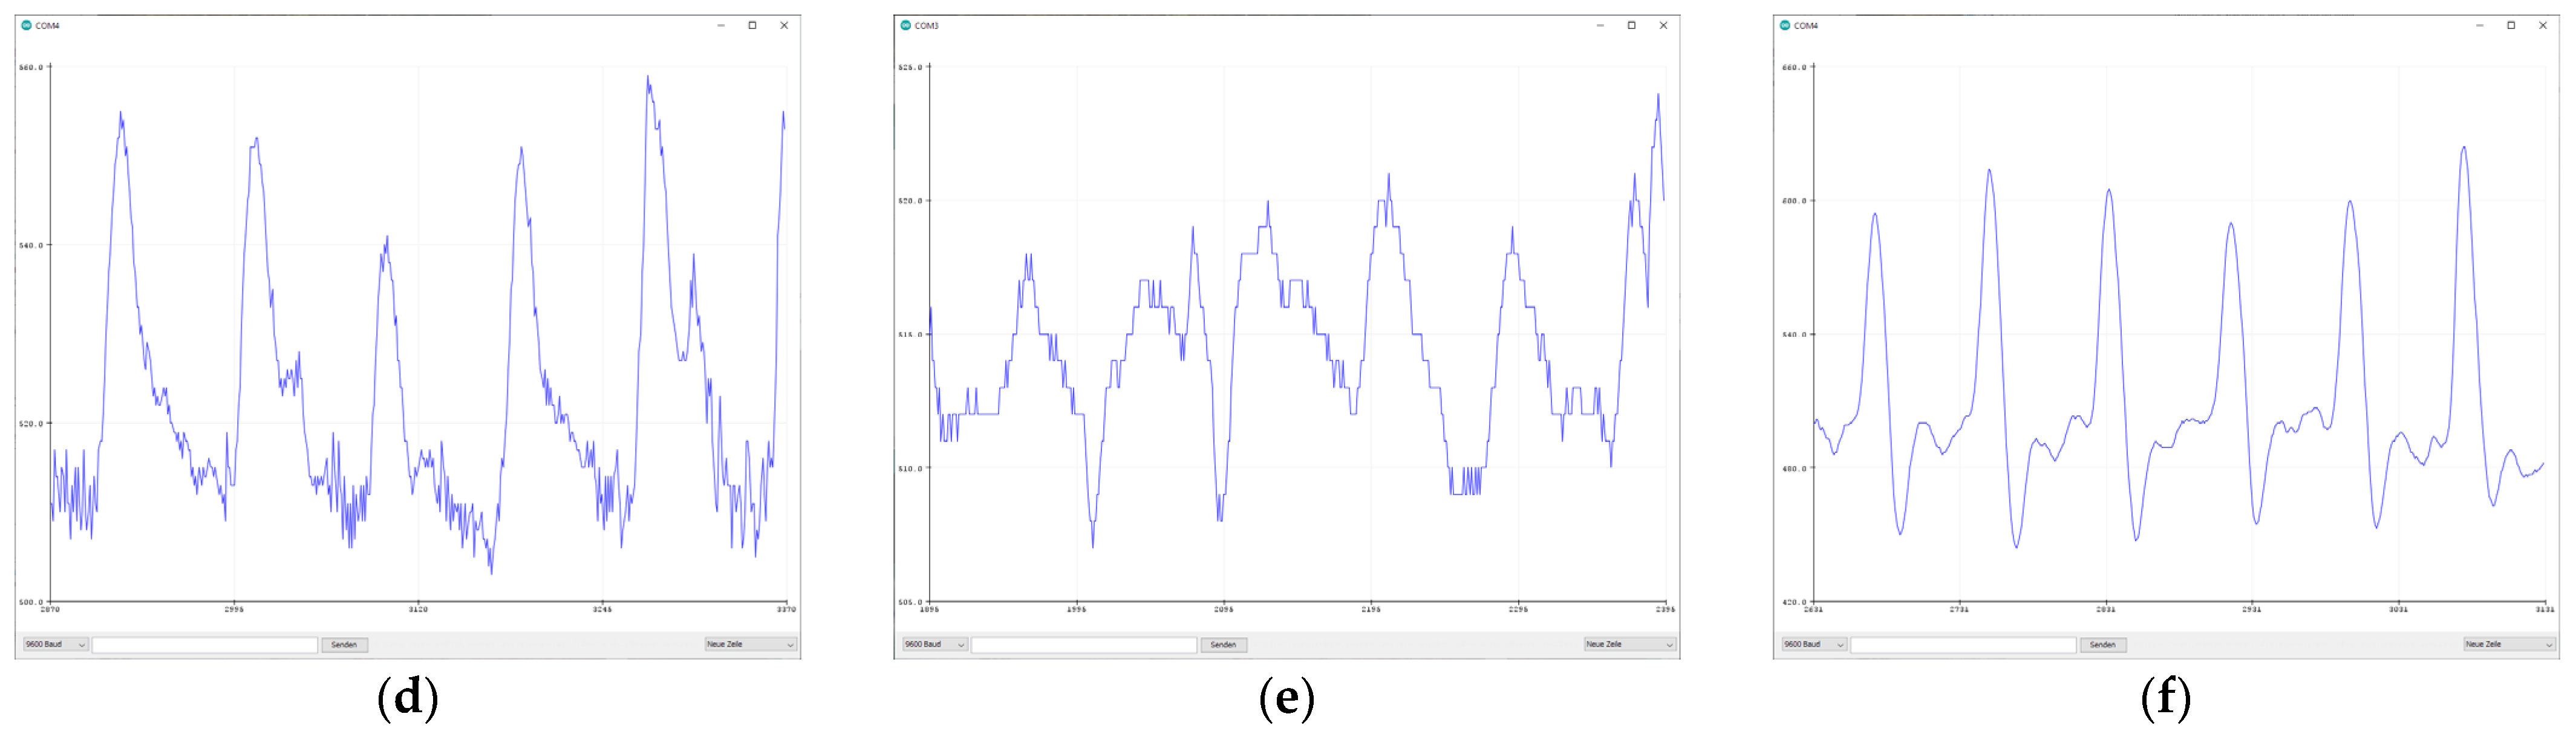
3.3. Hard- and Software Development

The hardware suggested for textile integration consists of the four parts depicted in Figure 5. The heart rate sensor (upper part in Figure 5a) emits green light and measures the reflection from the skin by a photodiode, which is transferred into an analog voltage signal. The pulse signal (as visible in Figure 5b) thus shows the blood circulation since reflection is reduced with a higher amount of red hemoglobin, which absorbs the green light. The ESP8266 D1 mini (lower part of Figure 5a) reads the analog signal and transmits it by ESPNOW (without the necessity of a local Wi-Fi network) to a receiver. Another reason for using the ESP8266 D1 mini is its very low energy consumption. In the c state of the project, the signal is sent in defined time intervals together with the heart frequency measured from the raw pulse signal, as described below.
ESP32 serving as the receiver (Figure 5b, right part) first saves the transmitted sensor value in an array, sets the display to fully white, and then plots the graph together with the average heart frequency (Figure 5b, left part).
The code that was developed within the current project is based on mathematical criteria which must be fast, reliable, and repeatable. In order to determine the time between two heartbeats as accurately as possible, the time window in which these criteria are fulfilled must be very small. Currently, two criteria are used to detect a main chamber contraction. One is whether the analog signal S(t) exceeds a certain threshold α, which is further referred to as criterion C1. However, this condition can be fulfilled over a certain period of time, which makes it difficult to determine the heart rate accurately.
C 1 ( S ) = { t r u e               i f   S ( t ) > α f a l s e             i f   S ( t ) α
Another criterion would be the rate of change over time. By numerically deriving the signal value using a backward differencing scheme (BDS), it can be determined whether a rising edge is currently being measured. Currently, the BDS is first order, so only the signal value one time step before is needed. Similar to the first criterion, it is also checked whether the derivative exceeds a certain value β. The disadvantage of this criterion is that it may be fulfilled several times in the cycle of a heartbeat.
t S ( t ) = S ( t n ) S ( t n 1 ) Δ t
C 2 ( S ) = { t r u e               i f   t S ( t ) > β f a l s e             i f   t S ( t ) β
By combining the two criteria, the described disadvantages can be completely circumvented. If suitable values for α and β are selected, a reliable criterion is formulated. Equation (4) shows the combination of the presented criteria in the form as it is implemented in the code.
C 1 2 ( S ) = { t r u e               i f     S ( t ) > α   t S ( t ) > β f a l s e             i f     S ( t ) α     t S ( t ) β
Figure 6 illustrates schematically the previously described properties and problems of the individual criteria and time windows. When looking at Cycle1, one can see the large time window in which the criterion C1 would have detected a heartbeat. This is sufficient for pure pulse detection, but too inaccurate for the determination of the time between subsequent heartbeats. In Cycle2, the criterion C2 was applied. As can be seen, the rate of change within a cycle is very high in the three areas. That is, it is difficult to distinguish between the contraction of the atrium [∙], the contraction of the main chamber [:], or the relaxation of the entire myocardium [⋮]. Cycle3 finally shows the combination of the two criteria and that both criteria complement each other well for their strengths. The time window was significantly reduced, and multiple detection was also excluded.
Now that a reliable method for detecting a heartbeat has been implemented, the time between two beats must be determined. For this, two more variables are needed first. One is the time ∆tloop which determines the delay between the individual measurements. In addition, a counter nloop is needed, which counts the number of loops between two heartbeats. The time between the heartbeats ∆tHB and the beats per minute (BPM) can now be calculated:
Δ t H B = n l o o p   · Δ t l o o p
B P M = 60 Δ t H B
The following flowchart (Figure 7) simplifies the basic idea of calculating beats per minute. If no heartbeat is detected, the counter is increased by one in each loop. When a heartbeat is detected, the quantities are calculated based on the counter and the counter is set back to zero. To the original condition C1∧2, the condition for the counter nloop was added additionally.
The resulting BPM signal is not forwarded to the receiver unit unfiltered, but averaged for the time being. The goal is an average value over a series of measurement data. Especially in this case, one would like to calculate BPMmean. To avoid unnecessary operations inside loop conditions, instead of the BPM value, the average ΔtHB will be calculated first. If the mean value of the time between two heartbeats is determined, the corresponding BPMmean can be calculated once before sending the information to the receiver unit. The span over which the average is taken is nsamples. So, a list of ΔtHB values containing nsamples elements is needed. This list is created as an array ΔtHB,Arr where the individual elements of the array can be addressed and used with the help of their indices. In this case, we decided to add the new elements at the end of the list. So, when adding a new element at the end, the first element is “pushed out” by the second one. For example, if ΔtHB,Arr[nsamples] is selected, the most recent value is always returned. If ΔtHB,Arr [1] is selected, this returns the oldest value.
Δ t H B , A r r = ( Δ t H B , 1 ,   ,   Δ t H B ,   n s a m p l e s )
As mentioned before, when adding a new ΔtHB value, the oldest one at the beginning of the list falls out. This gives the mean value the characteristic of a running mean over the measured values. The calculation can now be carried out using the following expression:
B P M m e a n = 60 · ( 1 n s a m p l e s i = 1 n s a m p l e s Δ t H B , A r r [ i ] ) 1
This procedure is illustrated by an extended flowchart (Figure 8), which was supplemented by the averaging and the construction and sending of the data package. In the first loop after the ΔtHB calculation, the populating of the array can be observed. The first value in the array takes the value of the second one, the second one takes the value of the third one, etc., until the penultimate element. Then, the last element is assigned the currently calculated ΔtHB value. If the list is completely populated, the sum is calculated over this array and within the calculation of BPMmean it is divided by the number of samples.
This code version was tested and found to work well for healthy probands, while the detection of cardiac arrhythmia necessitates further development, as described in Section 4.
The full code for the sensor unit is given in Appendix A, while the code for the receiver unit is provided in Appendix B.

4. Future Developments

In the next development stages, the operation of the sensor unit with battery is to be prepared. On the hardware side, this will be achieved by an even more compact ESP and a suitable battery for the sensor unit, and on the software side by restructuring the program flow chart. As described above, all data are currently sent continuously to the receiver unit. This would mean unnecessarily high energy consumption in battery mode.
Nevertheless, the balance between detecting emergency events and low energy consumption must be defined, possibly in different ways for different patients. Especially, the definition of “sleep” for the sensor unit must be defined. If sleep means the D1 mini is still analyzing and recording the signal from the sensor itself, it is easy to code a criterion for the special disease, which can be detected from the signal of an optical pulse-sensor and trigger a “SendAlarm” function to alert the medical staff. Energy saving is achieved by not sending the data to the receiver unit via ESP-Now continuously, only when a specific irregularity is detected. Additionally, the D1 mini has a large onboard storage, which is unused for now. For example, this storage can be used to save signal history and timestamps until they are retrieved.
While all sensors and microcontrollers were undamaged by different temperatures and detergents during the first ten washing cycles, and only mechanical damage of the connection lines occurred, which must be avoided in future developments, it is nevertheless necessary to develop a suitable encapsulation so that especially no heavy damages occur in case of a battery forgotten to be taken out of the equipment before washing.
When measuring and sending continuously in the moment, in the case of an arrhythmia, the algorithm would filter out the measured value, because it would be classified as implausible. Extending the algorithm with the ability to distill medical information from the signal is another point for future development. Especially cardiac arrhythmia can be detected by the time between two heartbeats, and if the time is greater than a defined variable, it can trigger an alarm, for example. The greatest advantage of the newly developed algorithm is the precise detection of heartbeats and, consequently, the time between two heartbeats, without skipping a single one. This is the reason why very precise timing is so important and why this was one of the first steps in the project.
On the programming side, the following sequence is intended:
  • Put the sensor it into an energy saving mode;
  • Wake up the receiver unit wirelessly;
  • Acquire data over a certain period of time;
  • Send data to the receiver unit;
  • Return to the energy saving mode.
Another advantage is that multiple sensor units can thus be managed and queried via a central station.
One criticism of the current method would be the accuracy of calculating the time between two heartbeats. If the tasks in the loop in which the counter is counted between two heartbeats take too much time, this distorts the calculated time between two heartbeats, which in the recent tests provided a negligible error of less than 0.1%. Essentially, the clock frequency of the chip or on-board timers in general should be used.
The aspect of data protection and security should also be mentioned. Compliance with security standards when sending and receiving sensitive data still has to be implemented.
In the future, the individual functionalities are to be made available in the form of a library and further functions, such as heart rate variability and maxima/minima, are to be added.

5. Conclusions

A recent project showed that washing optical pulse sensors from different companies as well as microcontroller ATtiny85 in a common household washing machine for ten cycles did not damage any of them, suggesting their integration into smart clothes for pulse monitoring. Using an ESP8266 D1 mini as a transmitter and an ESP32 with 1.8″ display as a receiver, a stand-alone pulse measuring system was set up and equipped with an improved code for Arduino and ESP. These tests and developments serve as the base for a fully textile-integrated pulse measurement with mobile data storage and depiction.

Author Contributions

Conceptualization, N.R. and A.E.; methodology, all authors; software, N.R.; validation, N.R. and A.E.; investigation, all authors; writing—original draft preparation, N.R. and A.E.; writing—review and editing, K.T. and G.E.; visualization, N.R. and A.E. All authors have read and agreed to the published version of the manuscript.

Funding

This research was partly funded by the German Federal Ministry of Education and Research (BMBF), grant number 13GW0202C.

Institutional Review Board Statement

Not applicable.

Informed Consent Statement

Informed consent was obtained from all subjects involved in the study.

Data Availability Statement

All data are included in the paper and the Appendix A and Appendix B. The original sketches are available from https://github.com/NiclasRichter/PulseSensorTextileTechnologies (accessed on 26 February 2023).

Conflicts of Interest

The authors declare no conflict of interest. The funders had no role in the design of the study; in the collection, analyses, or interpretation of data; in the writing of the manuscript; or in the decision to publish the results.

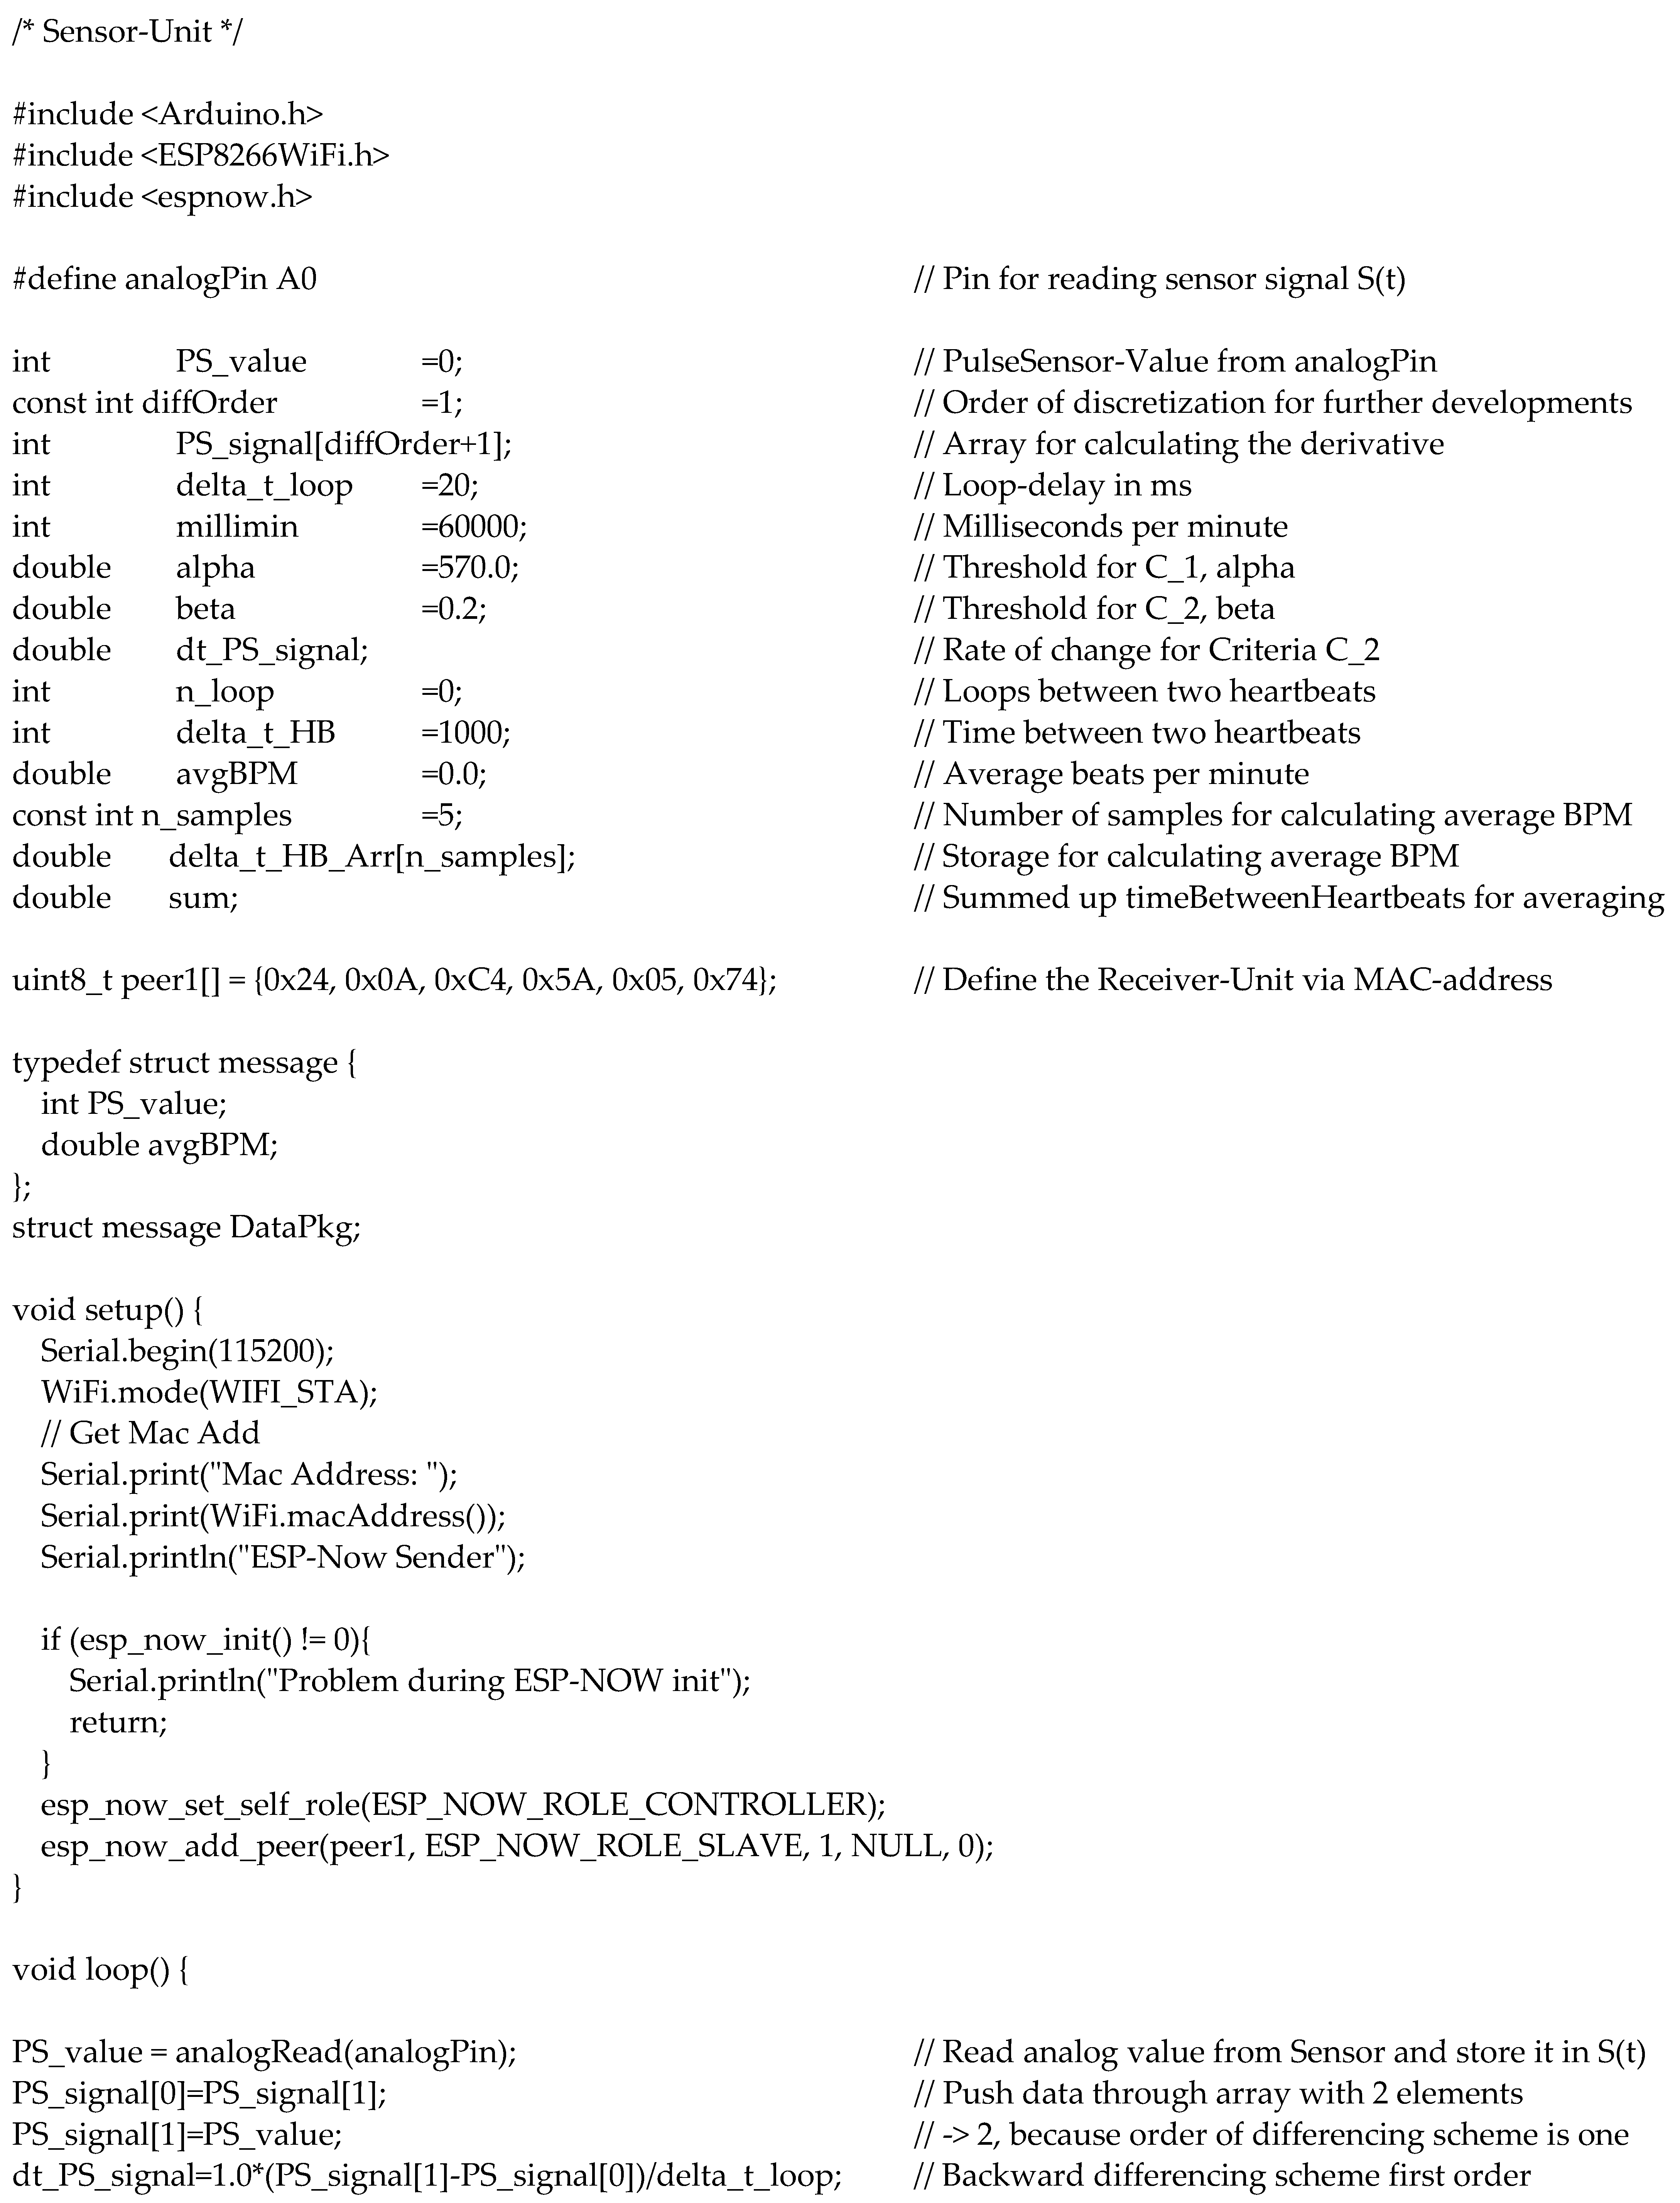
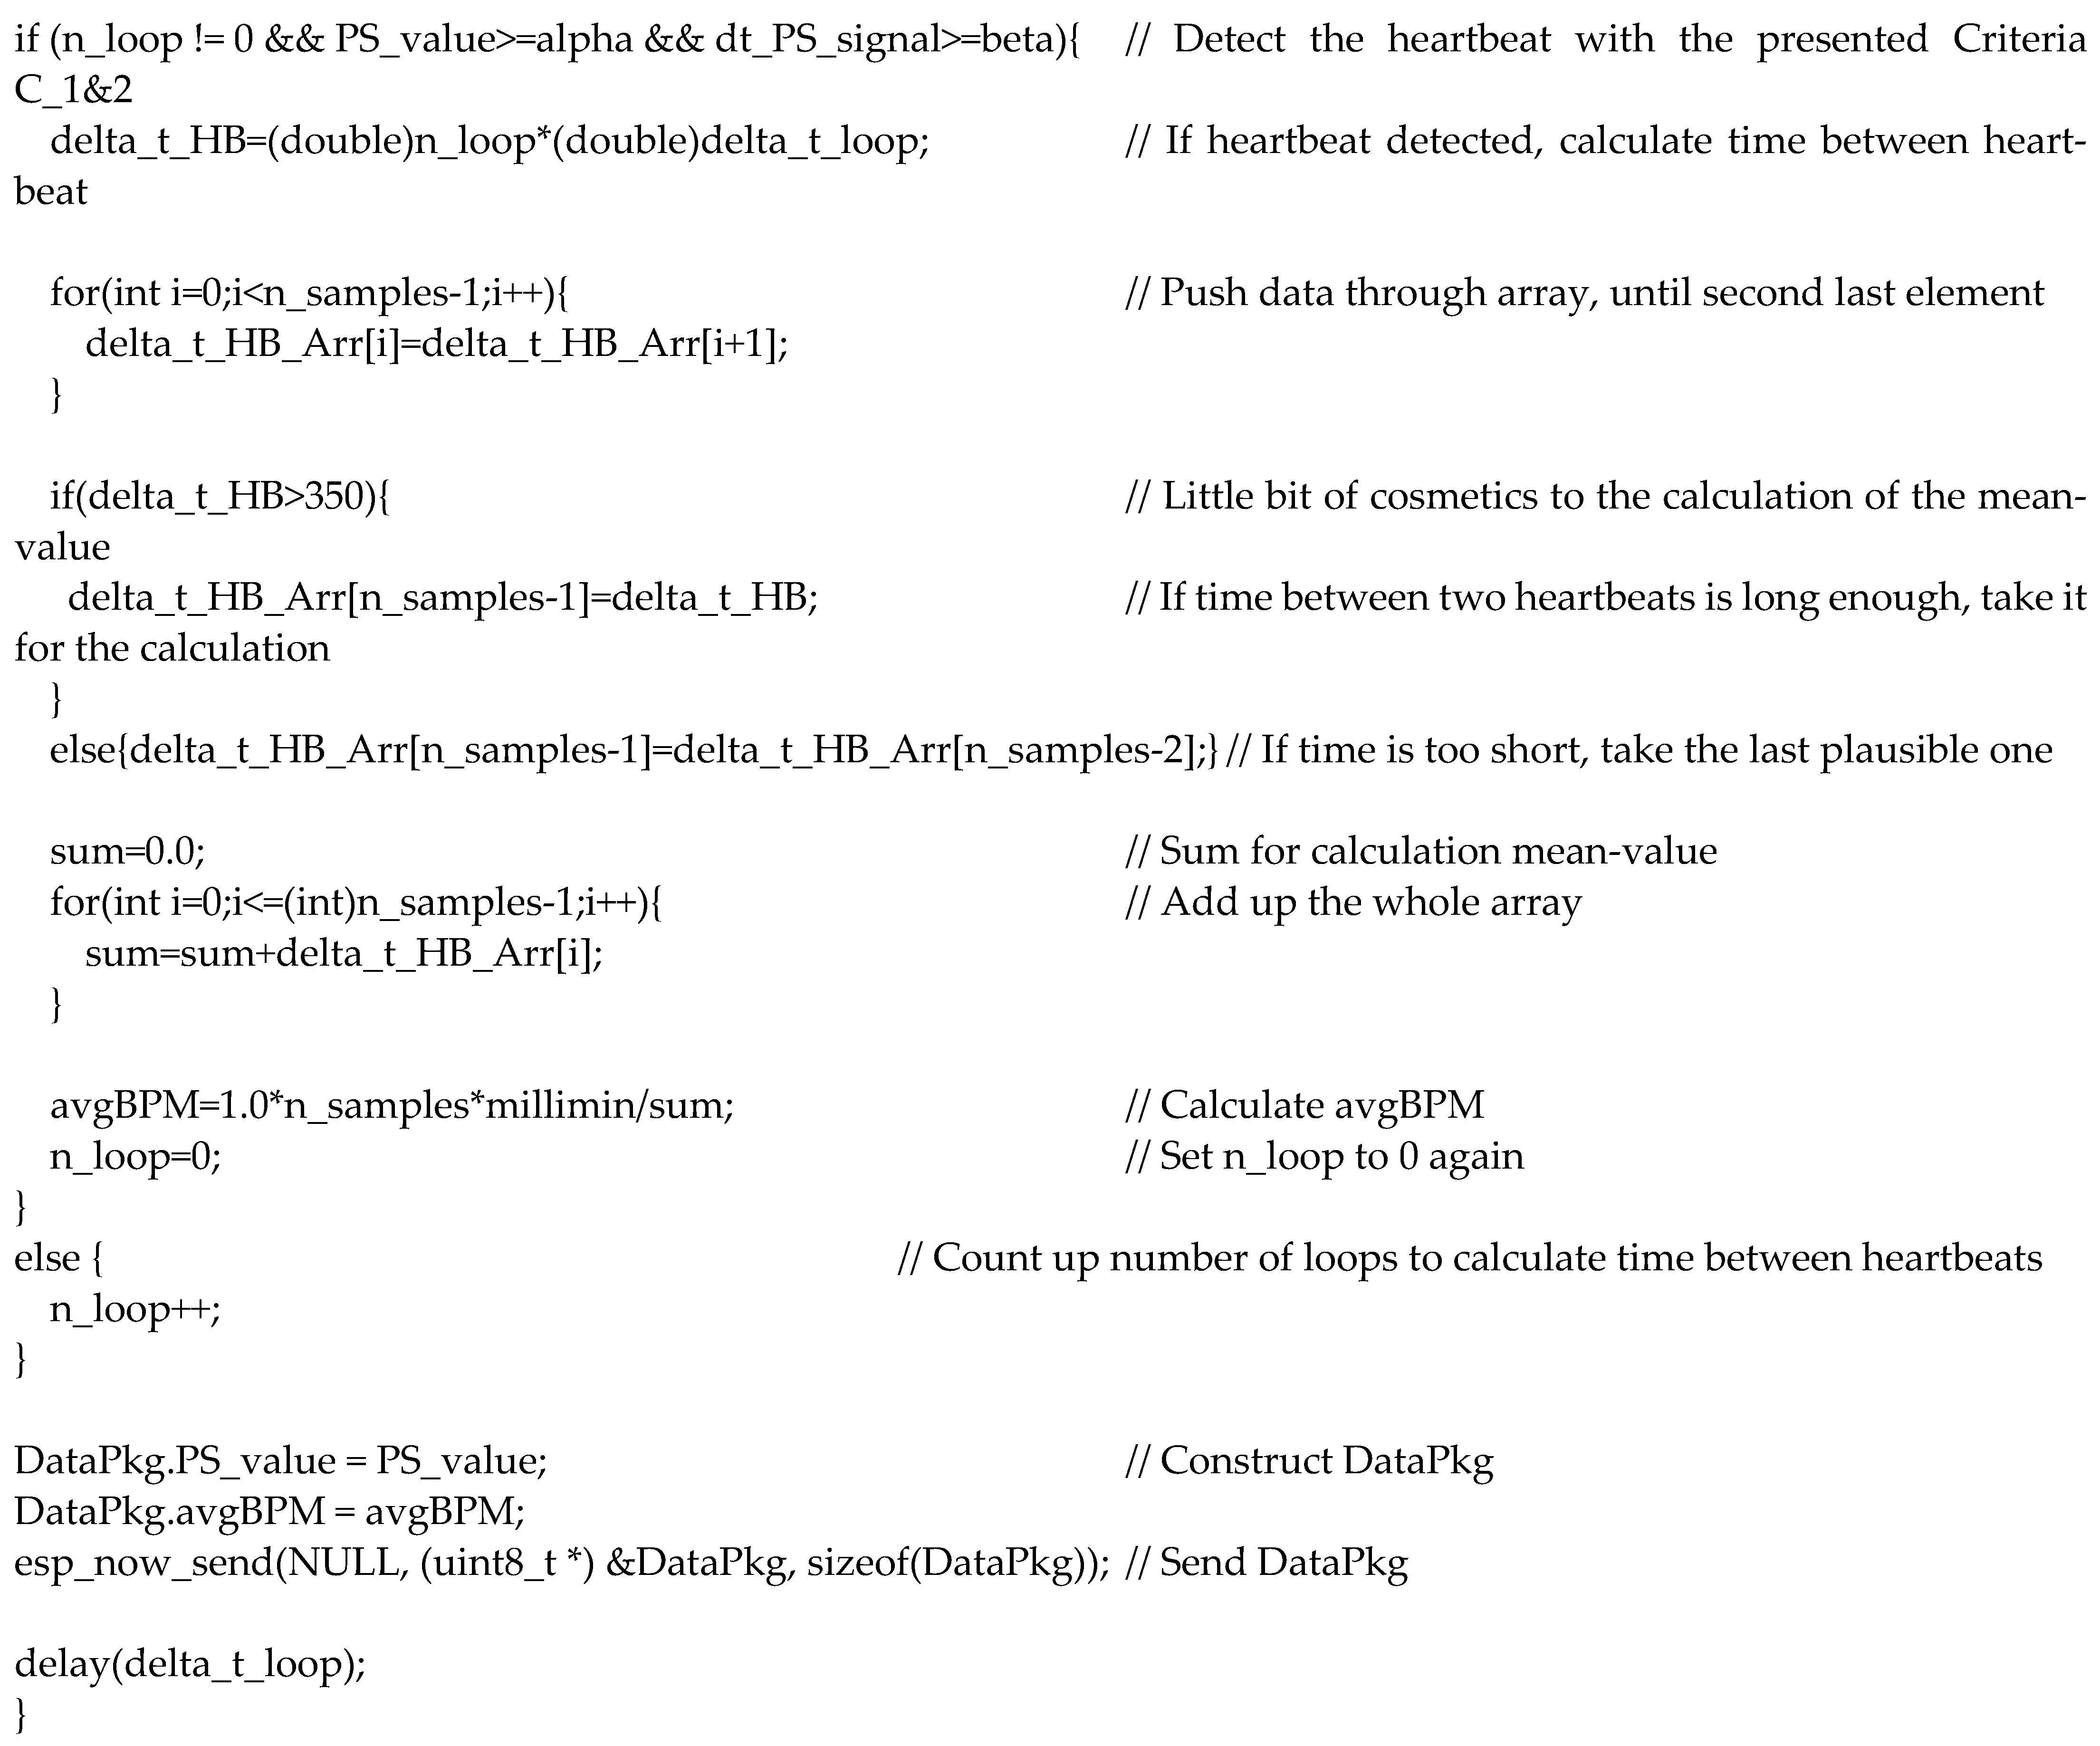
Appendix A. Code for the Sensor Unit

Electronics 12 01521 g0a1Electronics 12 01521 g0a2

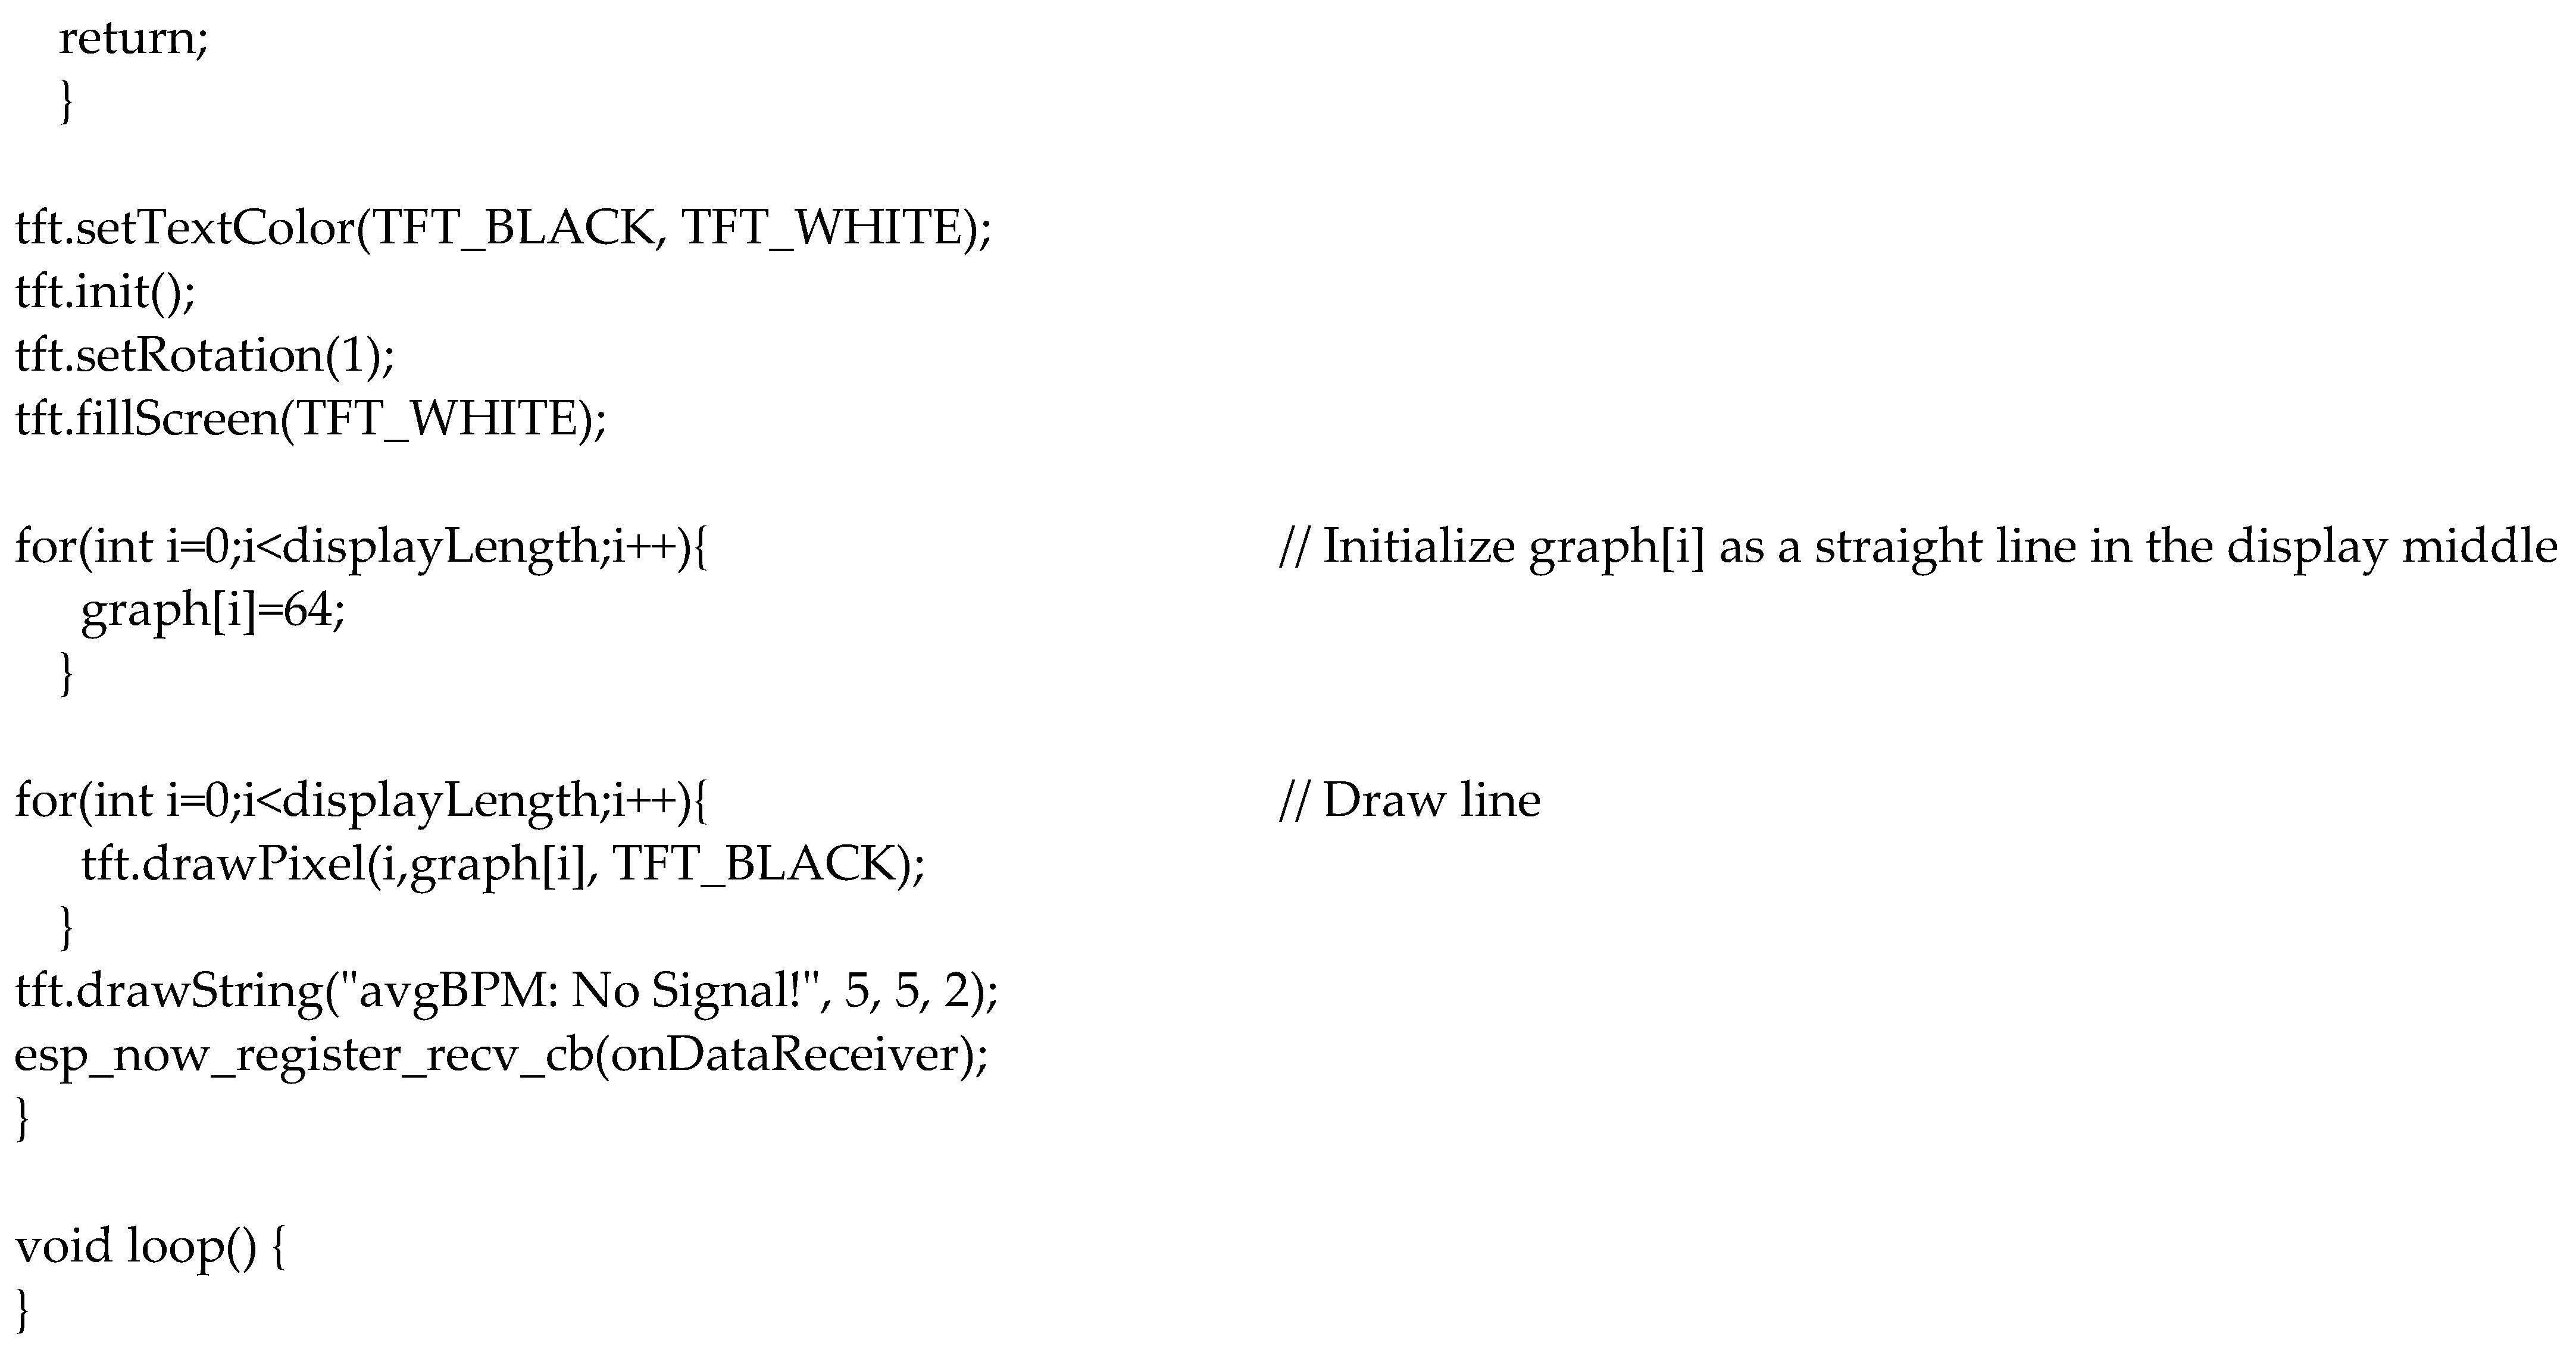
Appendix B. Code for the Receiver Unit

Electronics 12 01521 g0a3Electronics 12 01521 g0a4

References

  1. Ritchie, H.; Roser, M. Causes of Death. Our World in Data. 2018. Available online: https://ourworldindata.org/causes-of-death (accessed on 7 January 2022).
  2. Ahmad, F.B.; Anderson, R.N. The leading causes of death in the US for 2020. JAMA 2021, 325, 1829–1830. [Google Scholar] [CrossRef] [PubMed]
  3. Aumann, S.; Trummer, S.; Brücken, A.; Ehrmann, A.; Büsgen, A. Conceptual design of a sensory shirt for fire-fighters. Text. Res. J. 2014, 84, 1661–1665. [Google Scholar] [CrossRef]
  4. Trummer, S.; Ehrmann, A.; Büsgen, A. Development of underwear with integrated 12 channel ECG for men and women. AUTEX Res. J. 2017, 17, 344–349. [Google Scholar] [CrossRef]
  5. An, X.; Stylios, G.K. A hybrid textile electrode for electrocardiogram (ECG) measurement and motion tracking. Materials 2018, 11, 1887. [Google Scholar] [CrossRef] [PubMed] [Green Version]
  6. Matsouka, D.; Vassiliadis, S.; Tao, X.; Koncar, V.; Bahadir, S.K.; Kalaoglu, F.; Jevsnik, S. Electrical connection issues on wearable electronics. IOP Conf. Ser. Mater. Sci. Eng. 2018, 459, 012017. [Google Scholar] [CrossRef]
  7. Acar, G.; Ozturk, O.; Golparvar, A.J.; Elboshra, T.A.; Böhringer, K.; Yapici, M.K. Wearable and Flexible Textile Electrodes for Biopotential Signal Monitoring: A review. Electronics 2019, 8, 479. [Google Scholar] [CrossRef] [Green Version]
  8. Nigusse, A.B.; Malengier, B.; Mengistie, D.A.; Tseghai, G.B.; van Langenhove, L. Development of Washable Silver Printed Textile Electrodes for Long-Term ECG Monitoring. Sensors 2020, 20, 6233. [Google Scholar] [CrossRef]
  9. Euler, L.; Guo, L.; Persson, N.-K. Textile Electrodes: Influence of Knitting Construction and Pressure on the Contact Impedance. Sensors 2021, 21, 1578. [Google Scholar] [CrossRef]
  10. Uz Zaman, S.; Tao, X.Y.; Cochrane, C.; Koncar, V. Smart E-Textile Systems: A Review for Healthcare Applications. Electronics 2022, 11, 99. [Google Scholar] [CrossRef]
  11. Wang, J.Y.; Liu, K.W.; Sun, Q.Z.; Ni, X.L.; Ai, F.; Wang, S.M.; Yan, Z.J.; Liu, D.M. Diaphragm-based optical fiber sensor for pulse wave monitoring and cardiovascular diseases diagnosis. J. Biophotonics 2019, 12, e201900084. [Google Scholar] [CrossRef]
  12. Tanima; Saini, I.; Saini, B.S. Physiological Characteristics Classification by Optical Pulse Sensor using Arterial Pulse Waves. In Proceedings of the 2020 2nd International Conference on Innovative Mechanisms for Industry Applications (ICIMIA), Bangalore, India, 5–7 March 2020; pp. 676–679. [Google Scholar]
  13. Singh, M.; Li, J.K.; Sigel, G.H.; Amory, D. Fiber optic pulse sensor for noninvasive cardiovascular applications. In Proceedings of the Sixteenth Annual Northeast Conference on Bioengineering, State College, PA, USA, 26–27 March 1990; pp. 103–104. [Google Scholar]
  14. Henning, M.R.; Gerdt, D.W.; Spraggins, T.A. Using a fiber-optic pulse sensor in magnetic resonance imaging. Proc. SPIE 1991, 1420, 34–40. [Google Scholar] [CrossRef]
  15. Alian, A.A.; Sheeley, K.H. Photoplethysmography. Best Pract. Res. Clin. Anaesthesiol. 2014, 28, 395–406. [Google Scholar] [CrossRef] [PubMed]
  16. Mark, J.B. Atlas of Cardiovascular Monitoring; Churchill Livingstone Inc.: New York, NY, USA, 1998. [Google Scholar]
  17. Milner, Q.J.W.; Mathews, G.R. An assessment of the accuracy of pulse oximeters. Anaesthesia 2012, 67, 396–401. [Google Scholar] [CrossRef]
  18. Kim, J.H.; Kim, N.Y.; Kwon, M.J.; Lee, J.H. Attachable Pulse Sensors Integrated with Inorganic Optoelectronic Devices for Monitoring Heart Rates at Various Body Locations. ACS Appl. Mater. Interfaces 2017, 9, 25700–25705. [Google Scholar] [CrossRef]
  19. Bachmann, A.; Klebsattel, C.; Schankin, A.; Riedel, T.; Beigl, M.; Reichert, M.; Santangelo, P.; Ebner-Priemer, U. Leveraging smartwatches for unobtrusive mobile ambulatory mood assessment. In UbiComp/ISWC′15 Adjunct, Proceedings of the 2015 ACM International Joint Conference on Pervasive and Ubiquitous Computing, Osaka, Japan, 7–11 September 2015; ACM: New York, NY, USA, 2015. [Google Scholar]
  20. Lee, Y.J.; Shin, H.G.; Choi, H.J.; Kim, C.S. Can pulse check by the photoplethysmography sensor on a smart watch replace carotid artery palpation during cardiopulmonary resuscitation in cardiac arrest patients? A prospective observational diagnostic accuracy study. BMJ Open 2019, 9, e023627. [Google Scholar] [CrossRef] [PubMed] [Green Version]
  21. Ehrmann, G.; Blachowicz, T.; Homburg, S.V.; Ehrmann, A. Measuring biosignals with single circuit boards. Bioengineering 2022, 9, 84. [Google Scholar] [CrossRef] [PubMed]
  22. Ehrmann, G.; Ehrmann, A. Suitability of common single circuit boards for sensing and actuating in smart textiles. Commun. Dev. Assem. Text. Prod. 2020, 1, 170–179. [Google Scholar] [CrossRef]
  23. Oldfrey, B.; Jackson, R.; Smitham, P.; Miodownik, M. A deep learning approach to non-linearity in wearable stretch sensors. Front. Robot. AI 2019, 6, 27. [Google Scholar] [CrossRef] [Green Version]
  24. Nuramdhani, I.; Jose, M.; Samyn, P.; Adriaensens, P.; Malengier, B.; Deferme, W.; de Mey, G.; van Langenhove, L. Charge-discharge characteristics of textile energy storage devices having different PEDOT:PSS ratios and conductive yarns configuration. Polymers 2019, 11, 345. [Google Scholar] [CrossRef] [Green Version]
  25. Li, E.; Lin, X.Y.; Seet, B.-C.; Joseph, F.; Neville, J. Low profile and low cost textile smart mat for step pressure sensing and position mapping. In Proceedings of the IEEE Instrumentation and Measurement Technology Conference 2019, Auckland, New Zealand, 20–23 May 2019; pp. 1564–1568. [Google Scholar]
  26. Anbalgan, A.; Sundarsingh, E.F.; Ramalingam, V.S. Design and experimental evaluation of a novel on-body textile antenna for unicast applications. Microw. Opt. Technol. Lett. 2020, 62, 789–799. [Google Scholar] [CrossRef]
  27. Pulsesensor.com. Available online: https://pulsesensor.com/ (accessed on 25 February 2023).
  28. Tuvshinbayar, K.; Ehrmann, G.; Ehrmann, A. 50/60 Hz Power Grid Noise as a Skin Contact Measure of Textile ECG Electrodes. Textiles 2022, 2, 265–274. [Google Scholar] [CrossRef]
Figure 1. The effect of cardiac arrhythmia (PVCs) on the photoplethysmographic (PPG) waveform. From [15], copyright (2014), with permission from Elsevier.
Electronics 12 01521 g001
Figure 2. Samples for washing tests.
Electronics 12 01521 g002
Figure 3. Pulse measurements of (a) proband A, left little finger (y-scale 200–1000); (b) proband A, left little finger, measured on the next day (400–720); (c) proband B, left little finger (450–650).
Electronics 12 01521 g003
Figure 4. Pulse measurements of proband B, left little finger, with a sensor from (a) Berrybase (y-scale 501–513); (b) Iduino (490–540); (c) Iduino (508–520); (d) Keyestudio (500–560); (e) Joy-it (505–525); (f) Joy-it (420–660).
Electronics 12 01521 g004aElectronics 12 01521 g004b
Figure 5. Hardware for textile-integrated pulse measurement: (a) pulse sensor and ESP8266 D1 mini to be embedded in the medical clothes, PSU = power supply unit; (b) ESP32 and 1.8″ display receiving and depicting the measured data outside the garment.
Electronics 12 01521 g005
Figure 6. Schematic representation of pulse detection criteria.
Electronics 12 01521 g006
Figure 7. Flowchart of beats per minute (BPM) calculation. The other parameters are described in the main text.
Electronics 12 01521 g007
Figure 8. Flowchart of the average beats per minute (BPM) calculation.
Electronics 12 01521 g008
Table 1. Washing parameters.
Washing Cycle No.Temperature/°CSoftenerSpin Cycle/min−1
160Yes1200
240Yes1200
330No 600
460Yes1200
530No900
640Yes1200
740Yes1200
840Yes1200
930No900
1060Yes1200
Table 2. Sensor washing tests. “-” indicates detached connector cables, “ok” means that a pulse signal could be measured. Connector cables were originally attached at Keyestudio, Joy-it and Iduino sensors, while multi-pin connectors were soldered to Berrybase sensors.
Washing Cycle No.SensorSample Number
12345678910
1Keyestudiookok---
1Joy-itokokokokok
1Iduino ok-okokok
1Berrybase okokokokok
2Keyestudiook----
2Joy-it-okok-ok
2Iduino ok-okokok
2Berrybase okokokokok
3Keyestudiook----
3Joy-it-okok-ok
3Iduino --okokok
3Berrybase okokokokok
4Keyestudiook----
4Joy-it-ok---
4Iduino --ok--
4Berrybase okokokokok
5Keyestudiook----
5Joy-it-ok---
5Iduino -----
5Berrybase okokokokok
6Keyestudiook----
6Joy-it-ok---
6Iduino -----
6Berrybase okokokokok
7Keyestudiook----
7Joy-it-----
7Iduino -----
7Berrybase okokokokok
8Keyestudio-----
8Joy-it-----
8Iduino -----
8Berrybase okokokokok
9Keyestudio-----
9Joy-it-----
9Iduino -----
9Berrybase okokokokok
10Keyestudio-----
10Joy-it-----
10Iduino -----
10Berrybase okokokokok
Disclaimer/Publisher’s Note: The statements, opinions and data contained in all publications are solely those of the individual author(s) and contributor(s) and not of MDPI and/or the editor(s). MDPI and/or the editor(s) disclaim responsibility for any injury to people or property resulting from any ideas, methods, instructions or products referred to in the content.

