Article

Pixel-Level Degradation for Text Image Super-Resolution and Recognition

1
School of Information and Electronic Engineering, Zhejiang University of Science and Technology, Hangzhou 310023, China
2
Ningbo Sea Fresh Information Technology Co., Ningbo 315500, China
*
Author to whom correspondence should be addressed.
Electronics 2023, 12(21), 4546; https://doi.org/10.3390/electronics12214546
Submission received: 20 September 2023 / Revised: 26 October 2023 / Accepted: 3 November 2023 / Published: 5 November 2023
(This article belongs to the Special Issue Deep Learning in Image Processing and Pattern Recognition)

Abstract

:
In the realm of image reconstruction, deep learning-based super-resolution (SR) has established itself as a prevalent technique, particularly in the domain of text image restoration. This study aims to address notable deficiencies in existing research, including constraints imposed by restricted datasets and challenges related to model generalization. Specifically, the goal is to enhance the super-resolution network’s reconstruction of scene text image super-resolution and utilize the generated degenerate dataset to alleviate issues associated with poor generalization due to the sparse scene text image super-resolution dataset. The methodology employed begins with the degradation of images from the MJSynth dataset, using a stochastic degradation process to create eight distinct degraded versions. Subsequently, a blank image is constructed, preserving identical dimensions to the low-resolution image, with each pixel sourced randomly from the corresponding points across the eight degraded images. Following several iterations of training via Finetune, the LR-HR method is applied to the TextZoom dataset. The pivotal metric for assessment is optical character recognition (OCR) accuracy, recognized for its fundamental role in gauging the pragmatic effectiveness of this approach. The experimental findings reveal a notable enhancement in OCR accuracy when compared to the TBSRN model, yielding improvements of 2.4%, 2.3%, and 4.8% on the TextZoom dataset. This innovative approach, founded on pixel-level degradation, not only exhibits commendable generalization capabilities but also demonstrates resilience in confronting the intricate challenges inherent to text image super-resolution.

1. Introduction

Scene text recognition (STR) involves the process of converting images of text, such as from books, newspapers, and other sources taken in natural scenes with less than ideal lighting and focus, into digital text sequences. With the ubiquity of smartphones and similar devices, the internet has been inundated with such scene text images. However, largely due to hardware limitations and network bandwidth constraints, a significant portion of these images exist in low resolution. This low clarity presents a considerable challenge for text recognition.
While modern optical character recognition models exhibit impressive accuracy rates on high-resolution (HR) text images [1,2], they still grapple with low accuracy when it comes to low-resolution (LR) images. To ameliorate this, many in the research community have turned their focus towards applying super-resolution techniques to these low-resolution scene text images.
Several researchers have proffered diverse methodologies for text image super-resolution. Dong [3] proposed a method that synergizes deep learning with traditional sparse-coding-based super-resolution techniques. He applied the SRCNN network to scene text images and employed an end-to-end training approach, effectively enhancing the super-resolution results and overall quality. Wang et al. [4] took a multi-pronged approach: they not only introduced the TextZoom dataset but also floated the TSRN network. This network ingeniously integrates Spatial Transformer Networks and Bi-directional LSTM (BLSTM) mechanisms, facilitating a more refined extraction of sequence information and superior low-level reconstruction. Building on TSRN’s foundations, Chen et al. [5] unveiled the TBSRN network. Their novel approach, centered on a text-sensitive loss, ensures that the network’s focus remains predominantly on the text rather than any irrelevant background. TSRGAN [6] employs a cutting-edge generative adversarial network, introduces a triple-attention mechanism to enhance the network’s representation ability, and employs traditional wavelet loss to reconstruct sharper character edges. TATT [7] chooses the textual a priori semantic information, which is a large amount of workload but with a better yield, to assist the network for training, and utilizes a global attention mechanism to semantically steer the text prior to the text reconstruction process. These pioneering methods have undeniably introduced innovative paradigms and achieved commendable outcomes in text image super-resolution. However, challenges persist. Among them are the limited generalization capabilities of models and the constraints of having only a handful of training datasets, which hampers the robustness of these systems. These challenges highlight the need for continued optimization and refinement in the field.
In the realms of text image processing research and application, one recurring limitation stems from the paucity of suitable datasets and the intricacies of labeling. This constraint not only restricts the depth of research but also impedes the widespread adoption of super-resolution techniques. Existing datasets, such as SVT [8], CTW [9], and CUTE80 [10], have been primarily tailored for scene text recognition, rendering them valuable for their intended purposes. However, their emphasis on recognition, as opposed to super-resolution, presents a unique challenge. The absence of dedicated super-resolution datasets not only hampers algorithm generalization and transferability but also curtails their real-world practicality.
To address the dataset challenge, certain approaches strive to bolster model generalization [11], often by instructing deep denoising networks in image content reconstruction. Nevertheless, it is worth noting that the primary cause of text image degradation transcends mere noise. Therefore, these methods may exhibit limited efficacy in resolving scene-specific degradation issues. In a bid to surmount these constraints and bridge the dataset gap, synthetic datasets have emerged as a viable solution. Image degradation stands as a widely adopted synthetic method, simulating real-world text image degradation scenarios, including scenarios involving images captured out of focus or under electromagnetic influence, achieved through the introduction of blurring kernels and noise manipulation.
Nonetheless, prior endeavors in this domain have frequently relied on double or triple downsampling, or intricate blur kernels, to generate degraded images [12,13,14,15]. While these strategies provide versatility, they may not faithfully replicate real-world text image degradation. Such deviations can encumber the model’s capacity to discern specific degraded image features, ultimately affecting the efficacy of super-resolution algorithms. Consequently, the accurate simulation of real-world degradation scenarios has arisen as a pressing challenge in the realm of super-resolution research. Conquering this challenge is pivotal for advancing the field and ensuring the practical applicability of super-resolution techniques across diverse text image processing applications.
In response to the aforementioned challenges, an advanced pixel-level degradation process is introduced in this study, encompassing blur, noise, and stochastic strategies. This approach micro-targets degradation to each pixel, amplifying the scope of image degradation. It aims to empower the model to holistically comprehend and enhance its super-resolution reconstruction capabilities for text images. Preliminary results indicate that datasets refined through this advanced degradation process considerably bolster the model’s super-resolution capabilities, attesting to the efficacy and robustness of the degradation procedure. Comparative experiments demonstrate that training and testing using the advanced degradation process substantively boost model performance. Notably, in managing real-world low-resolution text images, the restoration detail and recognition rates markedly surpass those of the contemporary TBSRN model.
The paper is structured as follows: Section 2 elaborates on the fundamental principles of degradation and transfer learning. In Section 3, the network’s architecture is comprehensively explained. Section 4 offers visualizations and numerical comparisons of the approach’s results, showcasing its viability. Lastly, Section 5 provides a concise summary of the entire paper and draws conclusions.

2. Theoretical Foundations

2.1. Noise

2.1.1. Gaussian Noise

Gaussian noise is a prevalent random interference encountered in digital signal and image processing, typically originating from imaging tools and transmission pathways. Such interference compromises image clarity, necessitating denoising interventions. Its applications span areas like image denoising, enhancement, and restoration. This study harnesses a three-dimensional Gaussian noise model with zero mean, allowing manual modulation of noise intensity by adjusting the standard deviation, symbolized by the covariance matrix Σ. It is worth highlighting that the generalized Gaussian noise model can morph into additive Gaussian white noise and grayscale Gaussian noise, though these are extreme cases. Additive Gaussian white noise is characterized by its independent components, each obeying Gaussian distribution principles, leading to its alternative name: Gaussian white noise. Its probability density function follows a normal distribution, with statistical features including zero mean and constant variance. Grayscale Gaussian noise parallels the additive Gaussian white noise in its statistical attributes, maintaining zero mean and uniform variance. Its power spectral density remains constant across frequencies, affecting only pixel grayscale values without altering their hues. Acknowledging the diverse and unpredictable nature of degradation, varying noise intensities are incorporated in the study. Noise levels are uniformly sampled within the range {1/255, 2/255, …, 5/255}, generating samples under three scenarios with respective probabilities of 0.4, 0.4, and 0.2. The probability density function of Gaussian noise can be represented as follows:
p ( z ) = 1 2 π σ exp { ( z μ ) 2 / 2 σ 2 } .
where ‘exp’ denotes the exponential function based on the natural constant e; ‘z’ is the grayscale image value; ‘μ’ signifies the expected value of z; and ‘σ’ stands for the standard deviation of z.

2.1.2. JPEG Compression Noise

JPEG, short for Joint Photographic Experts Group, is an image compression standard tailored specifically for compressing natural, real-world full-color or grayscale imagery. Its primary objective is to minimize data redundancy in images, facilitating efficient data storage or transmission. The JPEG compression mechanism can introduce various types of noise, among which quantization noise and encoding noise are most prevalent. Quantization noise emerges due to errors in the quantization process post the DCT (discrete cosine transform) phase in JPEG compression. High-frequency components within images tend to be more susceptible to these quantization inaccuracies, leading to image distortions and the appearance of noise. Encoding noise, on the other hand, arises when quantized coefficients undergo encoding. To conserve the data stream, the encoding phase employs compression techniques such as Huffman coding and run-length encoding. While these methods manage to reduce the bitrate without compromising image integrity, they can inadvertently add some noise.
Recognizing that low-resolution text images in real-world settings often undergo significant compression, this study sets the image compression quality factor range between [20, 65]. This choice mirrors actual degradation conditions and accentuates the randomness of degradation. Moreover, it introduces pronounced artifacts, expanding the degradation spectrum. The fundamental equation of the JPEG compression method can be depicted as follows:
F i , j = round ( f i , j Q i , j ) ,
x ( i , j ) = 1 4 u = 0 7 v = 0 7 C ( u ) C ( v ) f u , v cos ( ( 2 i + 1 ) u π 16 ) cos ( ( 2 j + 1 ) v π 16 ) .
In Equation (2), f i , j represents the coefficients after the discrete cosine transformation; ‘round’ denotes the rounding function, rounding computational outcomes to the nearest integer; Q i , j signifies elements within the quantization matrix; and F i , j designates the coefficients post-quantization. In Equation (3), C ( u ) and C ( v ) represent transformation coefficients; for instances when u = 0 or v = 0, both C ( u ) and C ( v ) equate to 1 / 2 , otherwise, they are set to 1; x ( i , j ) stands for pixel values of the decompressed image.

2.2. Gaussian Blur

Gaussian blurring serves as a technique in image processing, employing convolution and Gaussian kernels to perform its function. It is particularly effective at reducing high-frequency noise within images and softening finer details, contributing to a smoother and more natural appearance. Isotropic Gaussian blurring is among the most straightforward methods in this category, leveraging Gaussian filters to create a weighted average of each pixel value in conjunction with its neighbors based on a Gaussian distribution. This results in effective image smoothing. However, this approach treats details in all directions equivalently, potentially leading to loss of nuances along certain orientations. To mitigate this limitation, anisotropic Gaussian blurring is developed. It accounts for variations in image details across different directions, using an asymmetrical Gaussian filter to apply a directionally weighted average to each pixel and its surrounding pixels. This allows for better preservation of image detail and texture.
Traditional SISR (Single-Image Super-Resolution) often employs isotropic Gaussian kernels with standard deviations as its primary blurring mechanism, though there is substantial room for improvement in terms of mimicking degradation. For a more realistic simulation of natural degradation processes, this study incorporates both isotropic and anisotropic Gaussian blurring kernels. As for the selection of kernel sizes, this study randomly samples within a range of {9 × 9, 12 × 12, … 36 × 36}, while the rotation angles for isotropic Gaussian kernels are randomly sampled from the interval [0, π]. The equations representing isotropic and anisotropic Gaussian blurring are as follows:
G ( x , y , σ ) = 1 2 π σ 2 e x 2 + y 2 2 σ 2 ,
In Equation (4), x and y denote the spatial coordinates of the Gaussian blurring kernel, and σ signifies its standard deviation.
G ( x , y , σ x , σ y ) = 1 2 π σ x σ y e 1 2 ( x 2 σ x 2 + y 2 σ y 2 ) .
Equation (5) specifies x and y as the spatial coordinates, while σx and σy represent the standard deviations of the Gaussian kernel along the x and y axes, respectively.

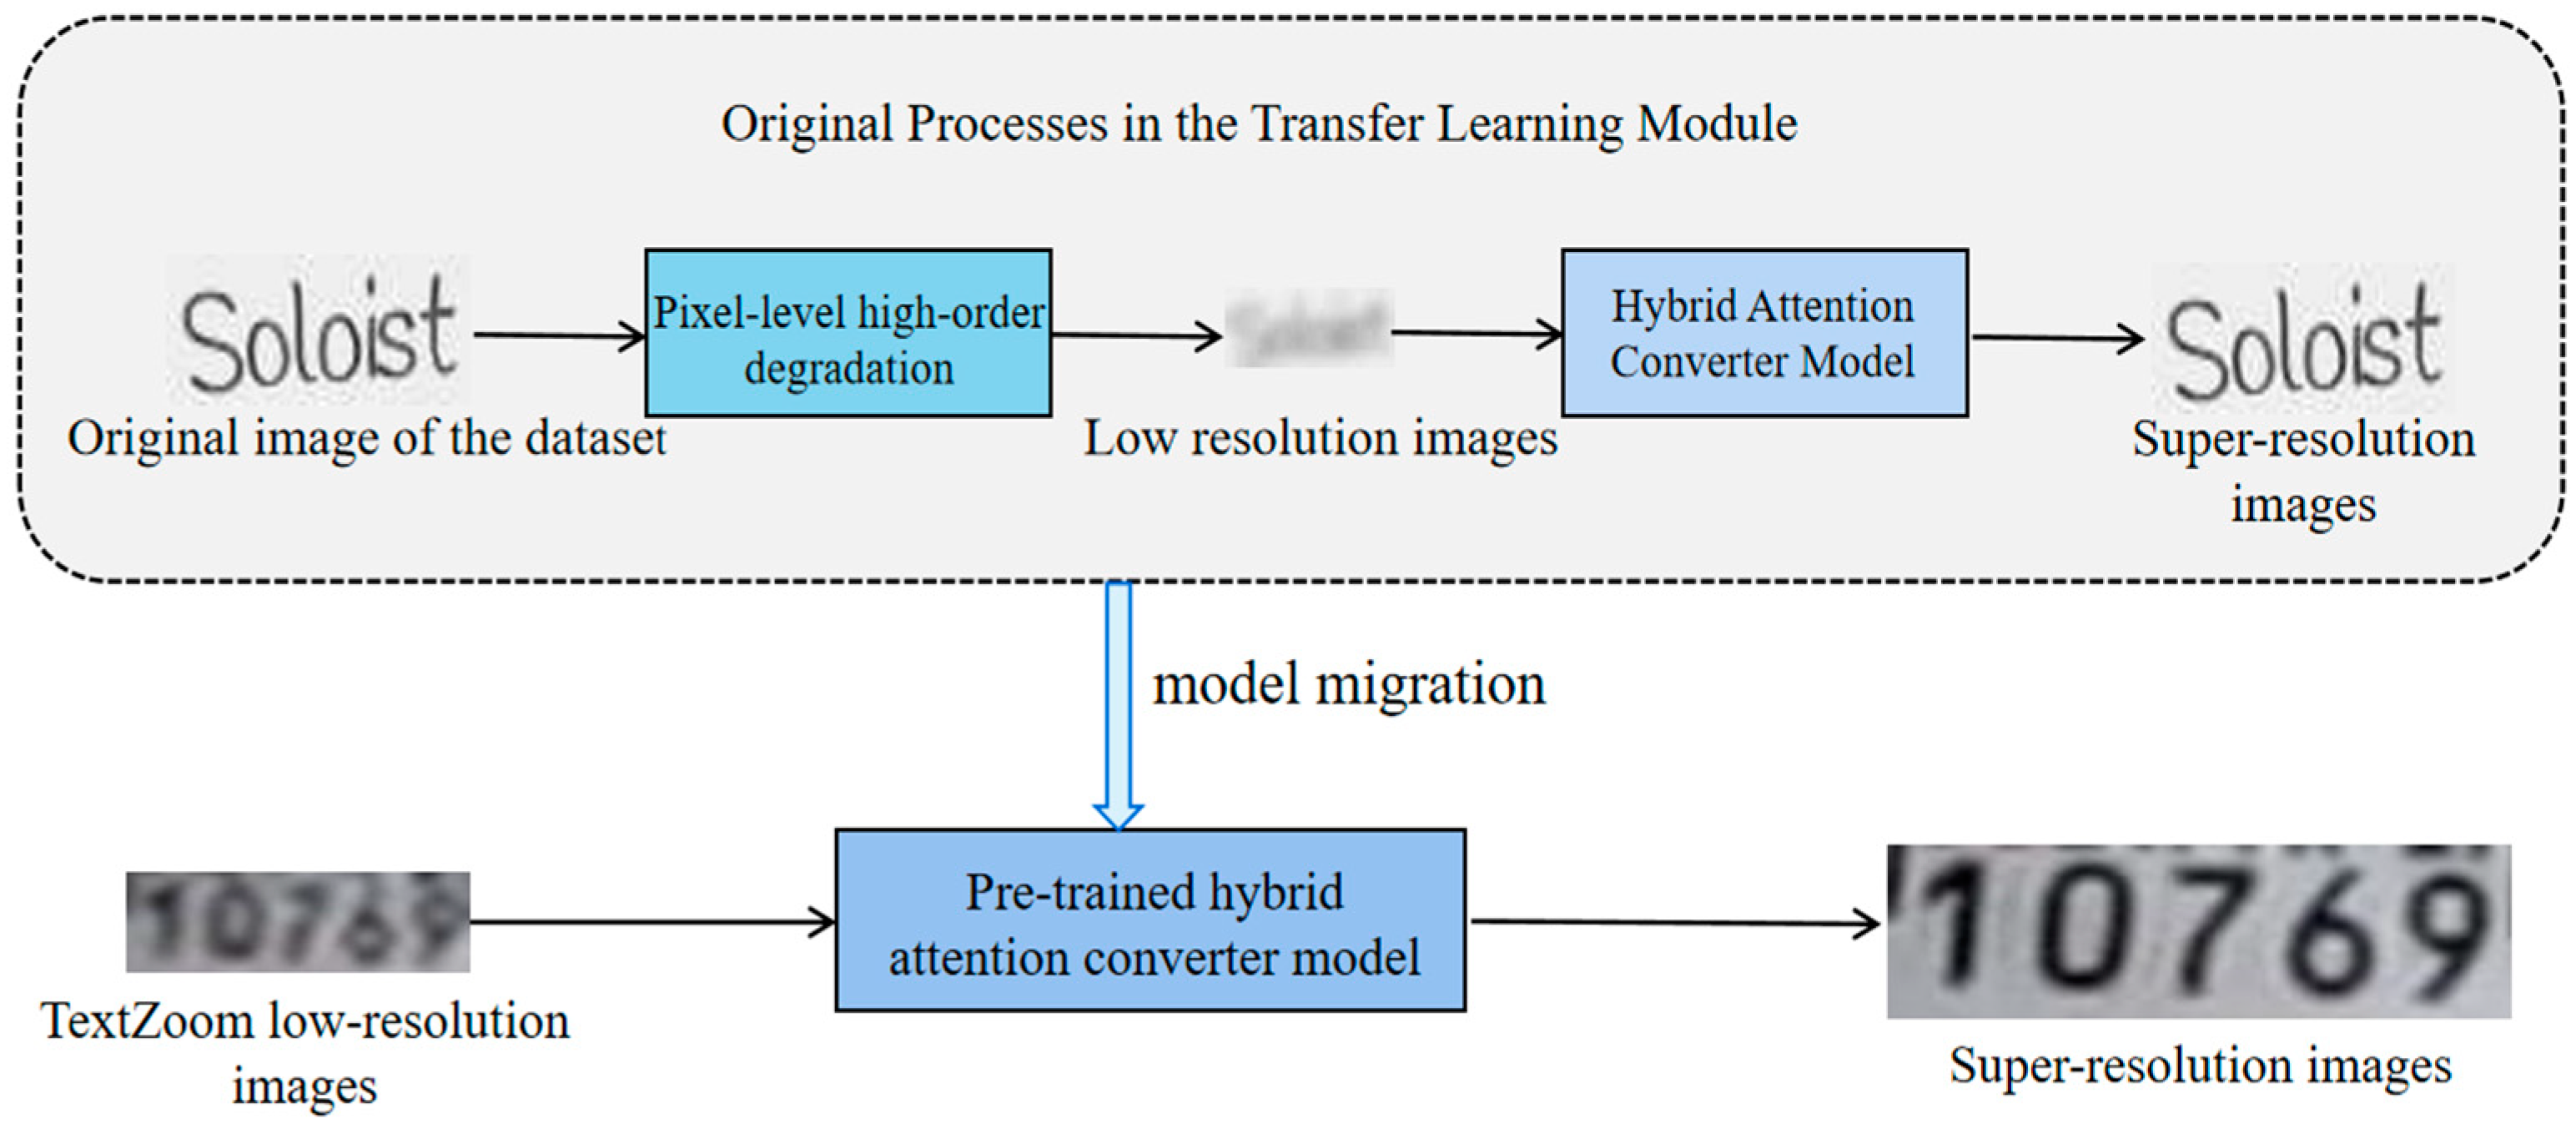
2.3. Transfer Learning

Transfer learning is a widely acknowledged technique across numerous machine learning domains, most notably in computer vision and natural language processing. The core essence lies in harnessing the parameters of a sufficiently trained model and integrating them into a fresh model, expediting the learning process of the latter. This tactic can not only accelerate the learning pace but also enhance the generalization capabilities of the new model. This is especially advantageous when computational resources are scarce, optimizing the training efficiency. The “pretrain-finetune” method represents a popular form of transfer learning, and it can be dissected further into several subcategories.
Li and colleagues [16] devised a strategy that utilizes an L2 regularization loss to manage the finetuning phase. By ensuring the model parameters across both stages are closely aligned, it prevents potential overfitting during the fine-tuning period. The L2 regularization loss can be depicted as:
Ω w = α 2 w w 0 2 2 ,
In Equation (6), w embodies the parameter vector encompassing all network parameters designed for the target task. α is a regularization factor that dictates the intensity of the penalty term, while w0 signifies the parameter vector of the pretrained model on the source problem.
On the other hand, Jang et al. [16] introduced a weighted feature matching loss, articulated as:
L w f m m , n θ | x , w m , n = 1 H W c w c m , n i , j r θ T θ n x c , i , j S m x c , i , j 2 .
Equation (7) outlines H × W as the spatial dimensions of S m ( x ) and r θ ( T θ n ( x ) ) . w c m , n represents the non-negative weight of channel c, with c w c m , n = 1. r θ stands as a linear transformation parameter; T θ n ( x ) represents the intermediate feature map of the n-th layer in the target network, while S m ( x ) denotes the intermediate feature mapping of the m-th layer in the pre-trained source network. This particular loss accentuates channels based on their utility in the target task.
Through the aforementioned loss functions, models can autonomously enact the rules of knowledge transfer, accommodating the discrepancies in architecture and tasks between the source and target, eliminating the necessity for manual transfer adjustments. Ultimately, by discerning the weight of each feature and the corresponding weights of source and target layers, one can achieve selective transfer of the pretrained model.

3. Methods

The overall process of text image super-resolution based on pixel-level degradation can be visualized as depicted in Figure 1. Initially, raw images from the input dataset undergo high-order pixel degradation to produce corresponding low-resolution images. The aim here is to emulate the image quality typically found in real-world scenarios. These images are then passed through a super-resolution network for training, designed to capture high-frequency details and augment image resolution. Later, the low-resolution images from the TextZoom dataset are fed into the trained super-resolution network for fine-tuning, enhancing the model’s performance in practical applications. The outcome is a refined super-resolution image. The primary components of this method include the super-resolution network module and the pixel-level high-order degradation module.

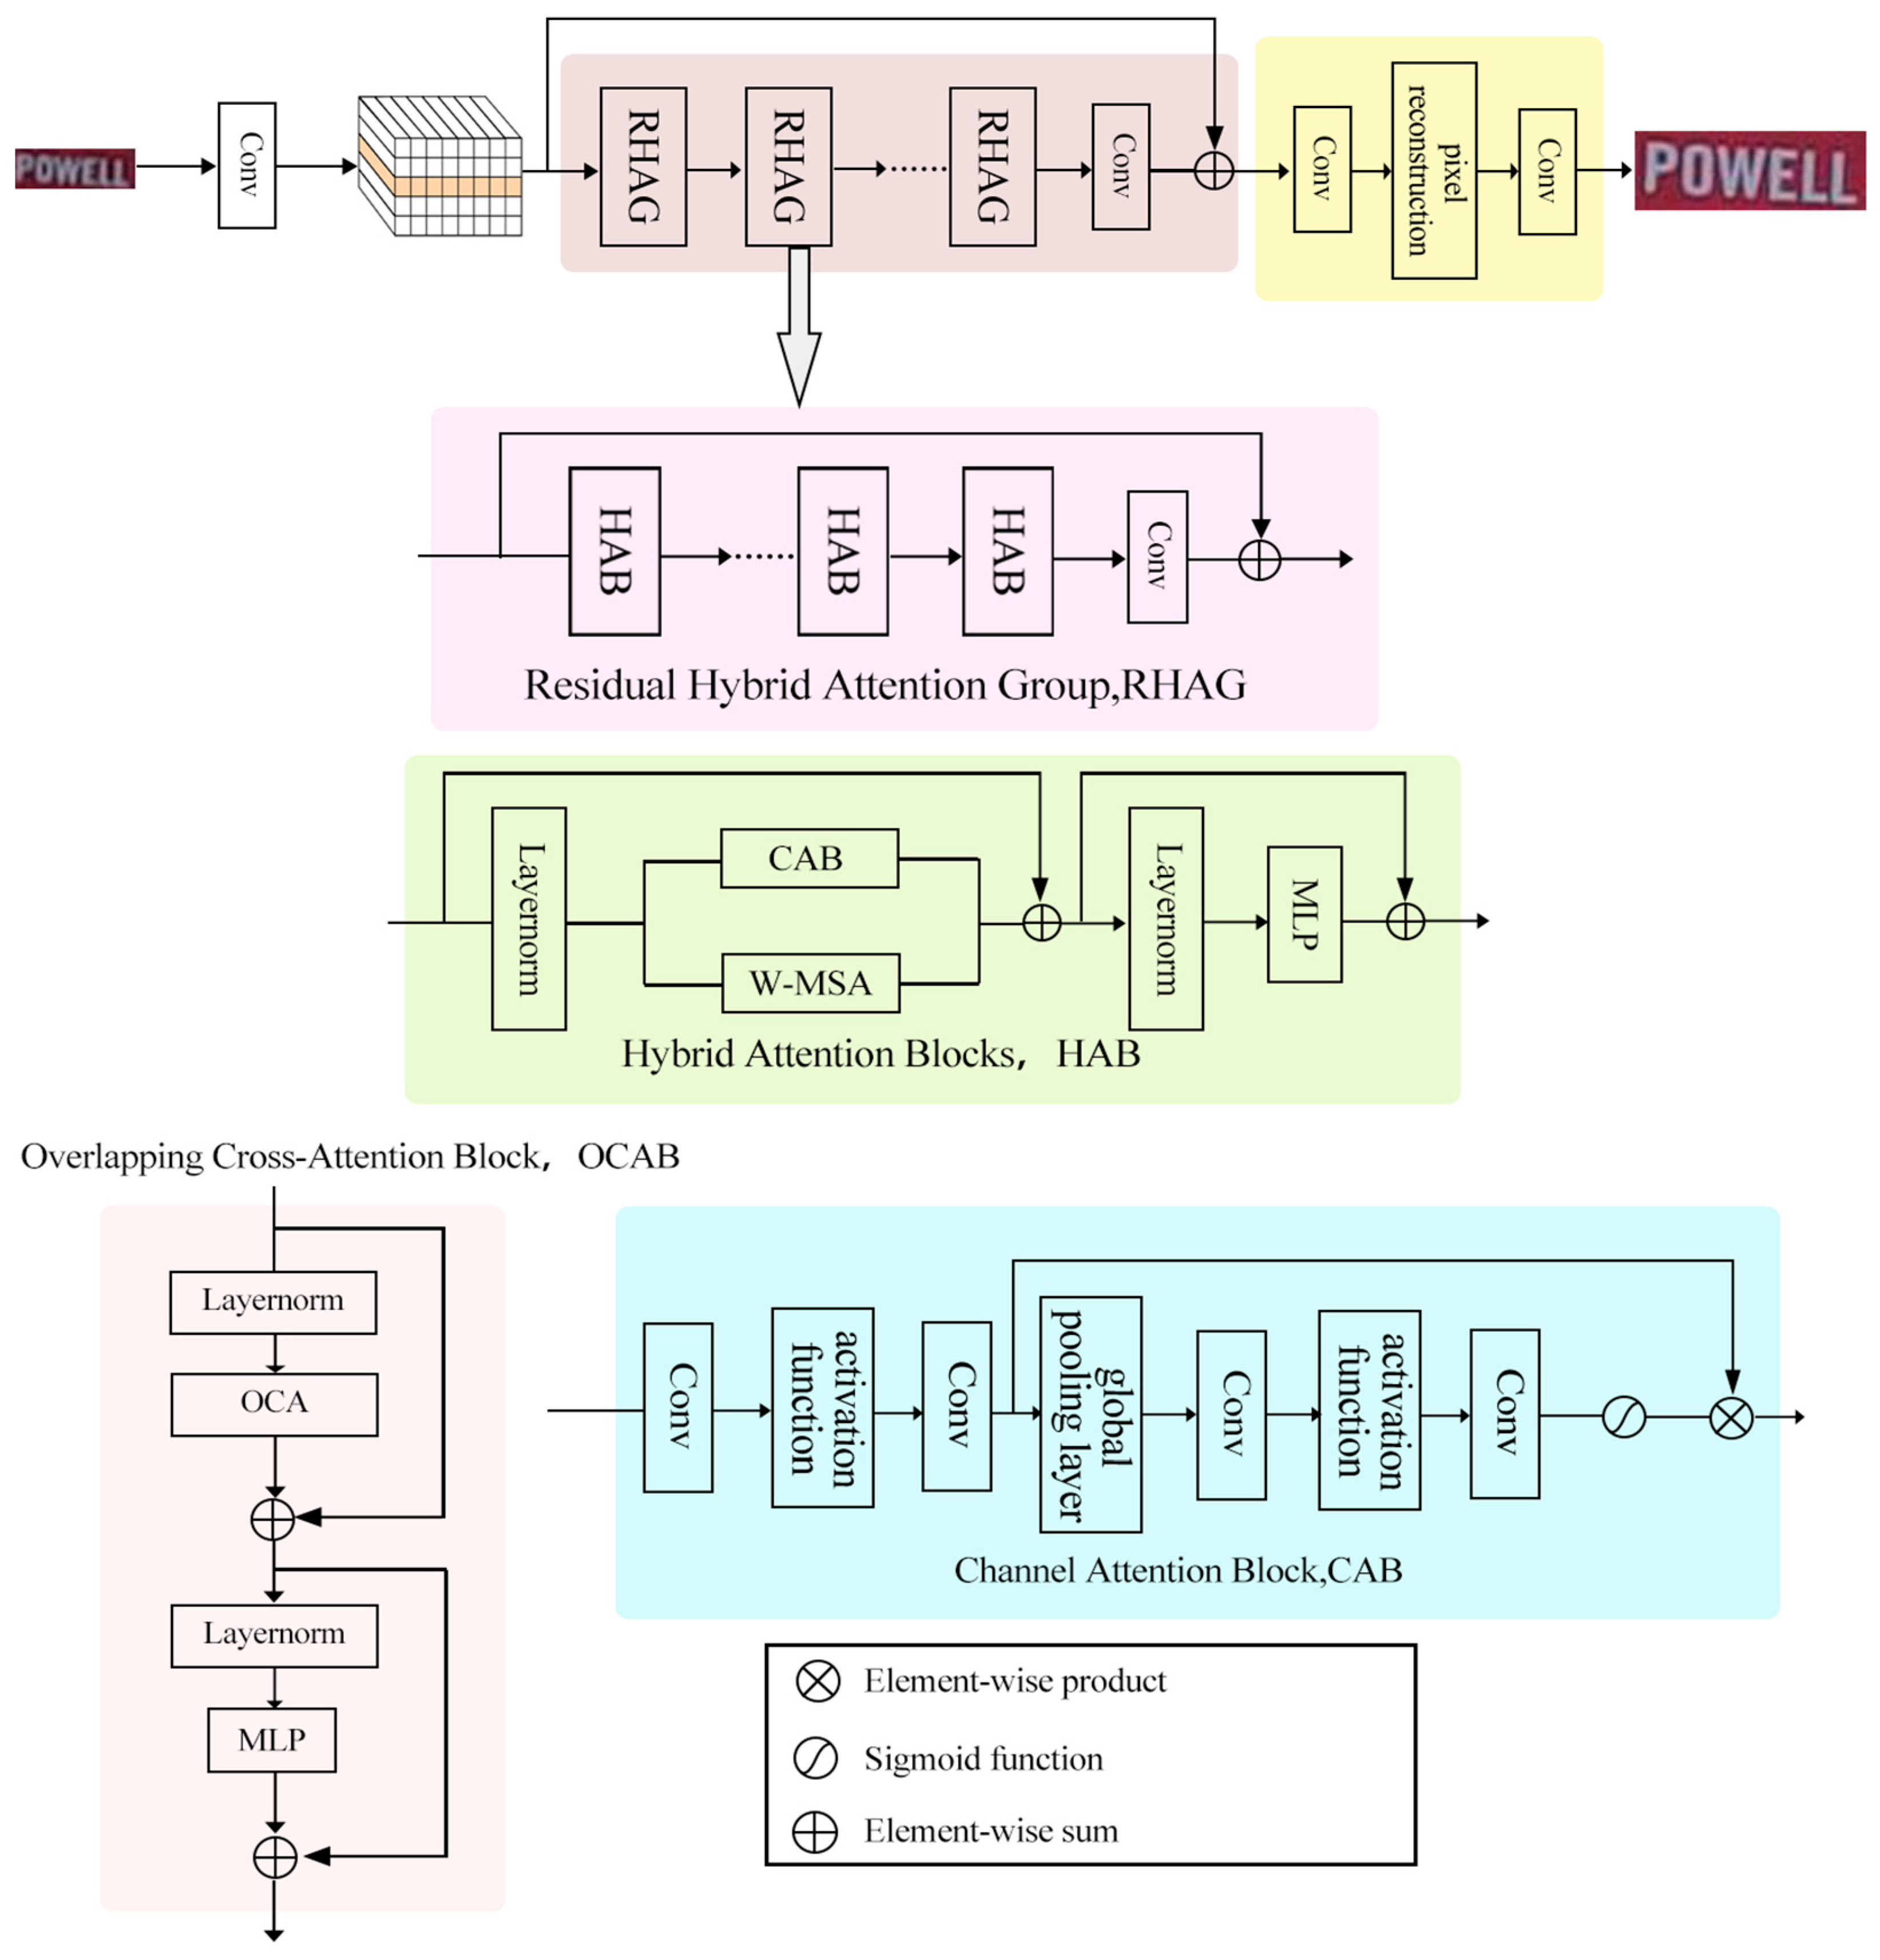
3.1. Super Resolution Network Module

The super-resolution network module employs the Hybrid Attention Transformer (HAT) network [17], as visualized in Figure 2. The network mainly consists of a shallow feature extraction layer, a deep feature extraction layer, and an image reconstruction layer.
The deep feature extraction layer is composed of N Residual Hybrid Attention Groups (RHAG) and a convolutional layer. The addition of an extra convolutional layer at the conclusion of the deep feature extraction layer serves a pivotal role. This strategic placement enhances the amalgamation of deep feature information, yielding more comprehensive and representative feature maps. It introduces non-linearity, empowering the model to capture intricate patterns and relationships within the features. This, in turn, bolsters its ability to recognize and restore intricate text details during super-resolution. For any given low-resolution image, PLR, an initial convolution layer named CSF extracts its shallow features F1:
F 1 = C SF ( P LR ) ,
This shallow feature is subsequently passed into the deep feature extraction layer CDF yielding the deep feature F2:
F 2 = C DF ( F 1 ) .
In the final step, these deep features are summed element-wise with the initial shallow-level features and processed in the image reconstruction layer to generate the final super-resolution image.
Within the deep feature extraction layer, the Residual Hybrid Attention Group comprises M Hybrid Attention Blocks (HAB) and an Overlapping Cross-Attention Block (OCAB). Inside the HAB, incoming feature maps undergo a series of transformations. They initially traverse a Layer Normalization (LN) layer, ensuring input stability for subsequent computations. Parallel operations unfold within the Channel Attention Block (CAB) and the Window-based Multi-Head Self-Attention (W-MSA) module. The CAB captures global information by computing channel attention weights, facilitating the extraction of structured features within the image. Concurrently, the W-MSA divides the image into non-overlapping windows and executes self-attention operations within each window, effectively capturing local dependencies. The resultant outputs from both branches are combined element-wise with the initial feature maps, augmenting their representational capacity. Subsequently, another normalization layer and a Multi-Layer Perceptron (MLP) layer further refine the features before conveying them for subsequent processing. This computation sequence can be represented as:
F m = LN ( F l ) ,
F n = W - MSA ( F m ) + α CAB ( F m ) + F l ,
Y = MLP ( LN ( F n ) ) + F n .
Equation (10) signifies that Fm denotes intermediary features while Fl is the incoming feature map. In Equation (11), Fn represents intermediary features, and α is a minor constant. Equation (12) illustrates that Y indicates the HAB’s output and MLP corresponds to the Multi-Layer Perceptron module. The OCAB, on the other hand, incorporates the Overlapping Cross-Attention (OCA) layer along with an additional MLP layer. This particular design choice facilitates cross-window connections, thereby enhancing self-attention mechanisms within each window. The OCA layer partitions windows into larger sizes while maintaining a consistent step size, allowing for overlapping regions in windows that would otherwise remain non-overlapping. This innovation encourages key/value computation from more extensive fields and reinforces interactions between features in neighboring windows. Through the integration of these advanced mechanisms, the deep feature extraction layer achieves a delicate equilibrium between capturing global context and preserving local intricacies. This, in turn, significantly augments the model’s capacity to restore intricate details in text images during the super-resolution process. The actions of the Residual Hybrid Attention Group, facilitated by the modules mentioned earlier, can be summarized as:
F i 1 , j = C HAB i , j ( F i 1 , j 1 ) , j = 1 , 2 , M   ,
F i = C conv i ( C OCAB i ( F i 1 , M ) ) + F i 1 .
Equation (13) elaborates that Fi−1,0 represents the input features of the i-th RHAG, with CHAB symbolizing the Hybrid Attention Block. In Equation (14), Fi−1,j is the j-th output feature of the j-th Hybrid Attention Block within the i-th Residual Hybrid Attention Group.

3.2. Pixel-Level High-Order Degradation Module

In an effort to simulate intricate real-world degradation while also taking into account the shooting scenario of low-resolution images, this study employed a combination of Gaussian noise, Joint Photographic Experts Group (JPEG) noise, and Gaussian blur kernel to establish the overall degradation process. Figure 3 showcases the results generated after the implementation of a pixel-level high-order degradation module. The magnified image in the center represents the final degraded image, while the surrounding eight images represent eight different low-resolution images produced from a single high-resolution image using a randomized degradation approach. Initially, an isotropic or anisotropic Gaussian blur kernel was selected via a random strategy to blur the image, followed by the addition of either standard Gaussian noise, grayscale Gaussian noise, or Additive white Gaussian noise (AWGN). Subsequently, JPEG noise was incorporated to simulate noise introduced during network transmission.
A random strategy was employed to expand the degradation space, determining the degree of degradation via random number generation. Diverging from conventional degradation techniques, this study extended the degradation of an entire image to individual pixels. A blank image of the same size as the original low-resolution image was first generated, into which pixels degraded at random were then populated, further enhancing the degradation space and achieving pixel-level high-order degradation. The corresponding formula can be expressed as follows:
P i , j = A 1 ( i , j ) , A 2 ( i , j ) , A 3 ( i , j ) , , A 8 ( i , j ) .
In Equation (15), P(i,j) denotes the pixel located at the i-th row and j-th column in P, composed of corresponding pixels from randomly chosen images A1, A2, …, A8. From both a performance and computational speed perspective, utilizing the eight degraded images to populate pixels was deemed an optimal choice.

4. Results

4.1. Datasets

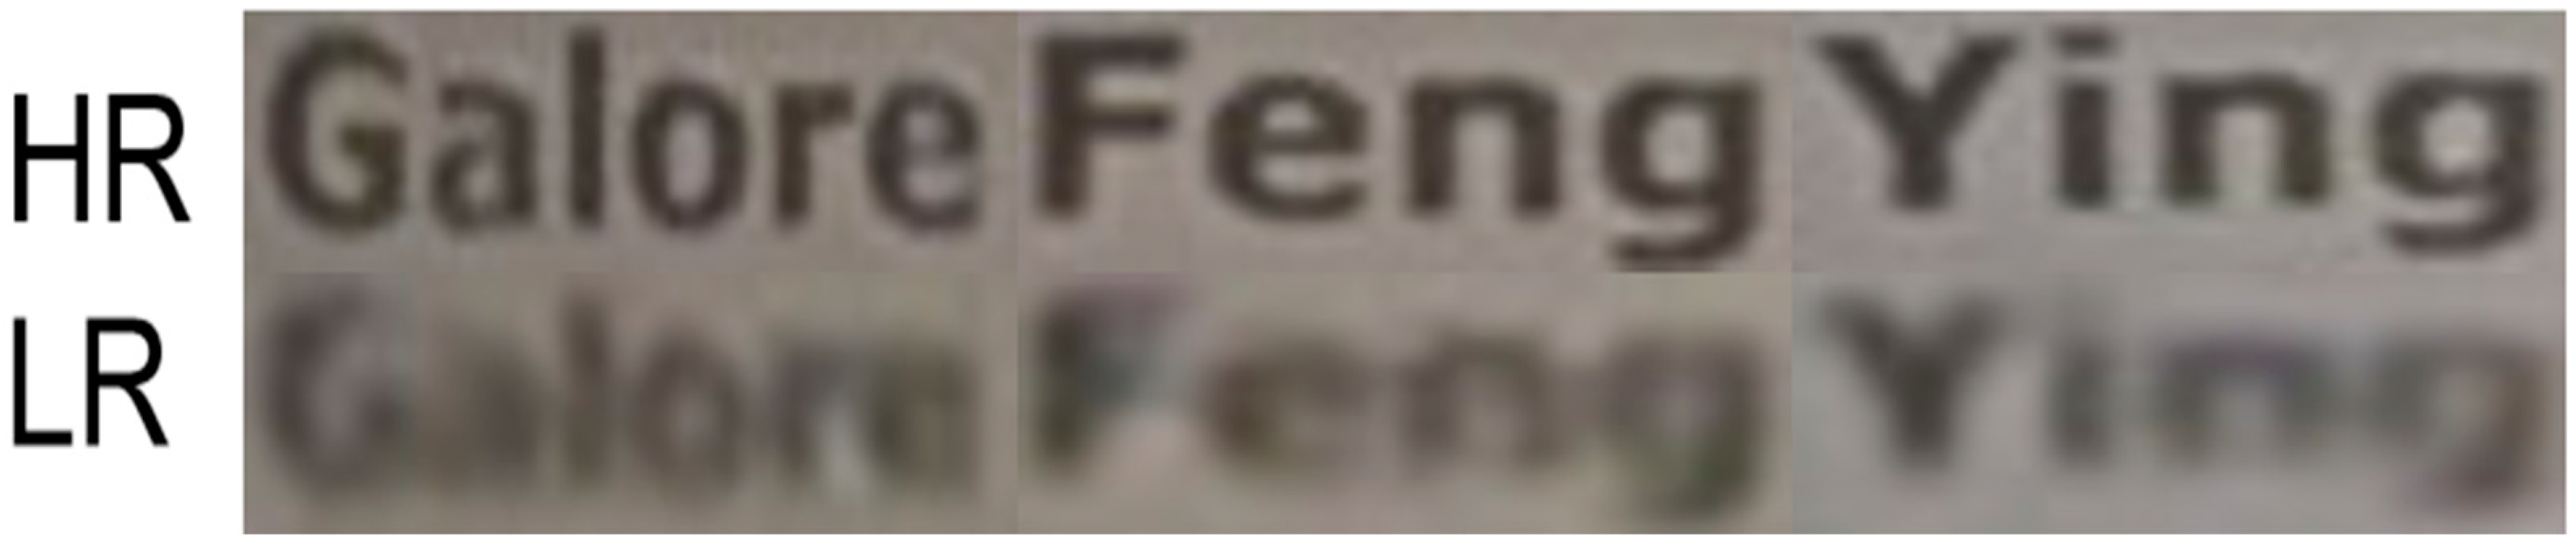
4.1.1. TextZoom Dataset

The TextZoom dataset stands out as the inaugural dataset focusing on real-world text super-resolution, encompassing a series of paired scene text data. Traditional super-resolution methods, which typically employ simple bicubic interpolation or blur kernel for generating low-resolution images, fall short when applied to scene text, given its arbitrary shapes, varying backgrounds, and distinct lighting conditions. To address this more challenging issue, the TextZoom dataset incorporates LR-HR image pairs captured with digital cameras, sourced from RealSR [18] and SR-RAW [19]. It comprises 17,367 LR-HR image pairs for training. The test set is divided into three categories. The categorization is based on the insight that “the smaller the focal length, the blurrier the image is at the same height”. In consideration of the recognition accuracy of the low-resolution images, the test set comprises 1619 image pairs cropped from RealSR, classified as belonging to the ‘easy’ difficulty category. These images are characterized by focal lengths greater than 100 mm, and notably, the recognition rate of low-resolution images from RealSR, under the ASTER recognition model, surpasses that of SR-RAW. A ‘medium’ difficulty category includes 1411 pairs of low-resolution images with focal lengths exceeding 50 mm. Finally, 1343 pairs of low-resolution images featuring focal lengths less than 50 mm are categorized as ‘hard’ difficulty. During experiments, LR image resolutions were adjusted to 16 × 64 pixels, while HR images were adjusted to 32 × 128 pixels. Figure 4, Figure 5 and Figure 6, respectively, present samples from the TextZoom dataset spanning the simple, medium, and difficult subsets. As evident, while the simple difficulty LR images can be discerned with ease, those of high difficulty are profoundly blurred.

4.1.2. MJSynth Dataset

Introduced by Jaderberg et al. [20], the MJSynth dataset encompasses 9 million images and 90,000 English words. The dataset’s creation involved a meticulous and deliberate process, ensuring its suitability for a broad array of applications. Font selection within the dataset is marked by its dynamic nature, with each image being meticulously generated through random font selection from a pool of over 1400 fonts sourced from Google Fonts. This deliberate randomness in font selection significantly contributes to the dataset’s diversity and realism, guaranteeing that the text images portray an extensive array of font styles.
Furthermore, the MJSynth dataset is distinct in its blending of data from various sources. The dataset enriches its corpus by combining each image layer with random crops extracted from images featured in the training dataset of SVT. This blending process introduces a substantial degree of diversity into the dataset. The blending operations incorporate a range of alpha blend modes, including ‘normal’, ‘add’, ‘multiply’, ‘max’, and others, further amplifying the dataset’s complexity and richness.
Given its vast data volume and the relevance of its text content to the experiments, this study employs this dataset for model pre-training, aiming to enhance the model’s performance ceiling. Figure 7 exhibits a selection of images from the MJSynth dataset.

4.2. Implementation Details

Throughout the research, PyTorch served as the primary framework for method implementation. High-resolution images were resized to dimensions of 128 × 32 pixels, while the degraded low-resolution images were adjusted to 64 × 16 pixels. All experiments were conducted on a NVIDIA GeForce RTX 3090 GPU equipped with 24 GB of memory. The Adam optimizer was employed for model training, with a batch size set to 16.
Model training utilized the Adam optimizer with a batch size of 16. The training procedure was divided into two distinct phases. In the initial phase, the training dataset comprise the extensive MJSynth dataset, which consists of 9 million images. Low-resolution images were generated using the pixel-level degradation process introduced in this research. Subsequently, the test dataset encompassed the three challenging test sets from the TextZoom dataset. In the second phase of training, the dataset comprised 17,367 images from the TextZoom training set. Importantly, no modifications were made to the low-resolution images during this stage. The test dataset remained consistent with the first phase evaluation.
When training on the MJSynth dataset, the learning rate was established at 1 × 10⁻⁴, while for fine-tuning using the TextZoom dataset, it was set at 7 × 10⁻⁴. For evaluating recognition accuracy, OCR models such as ASTER, MORAN, and CRNN were employed, assessed using the official Pytorch code released on GitHub. To ensure fairness, the study adhered to prior practices in text image super-resolution research, converting all uppercase letters to lowercase. Experimental outcomes were gauged using OCR recognition rates to evaluate the model’s performance.
In the experiments of this paper, four Residual Hybrid Attention Groups (RHAGs) were utilized, each equipped with six Hybrid Attention Blocks (HABs). Furthermore, the local window size was set to 7, enabling the model to focus on nearby pixel regions for super-resolution. Additionally, a 4:1 ratio was maintained for the MLP hidden dimension to the embedding dimension, determining the model’s non-linear transformation capacity.

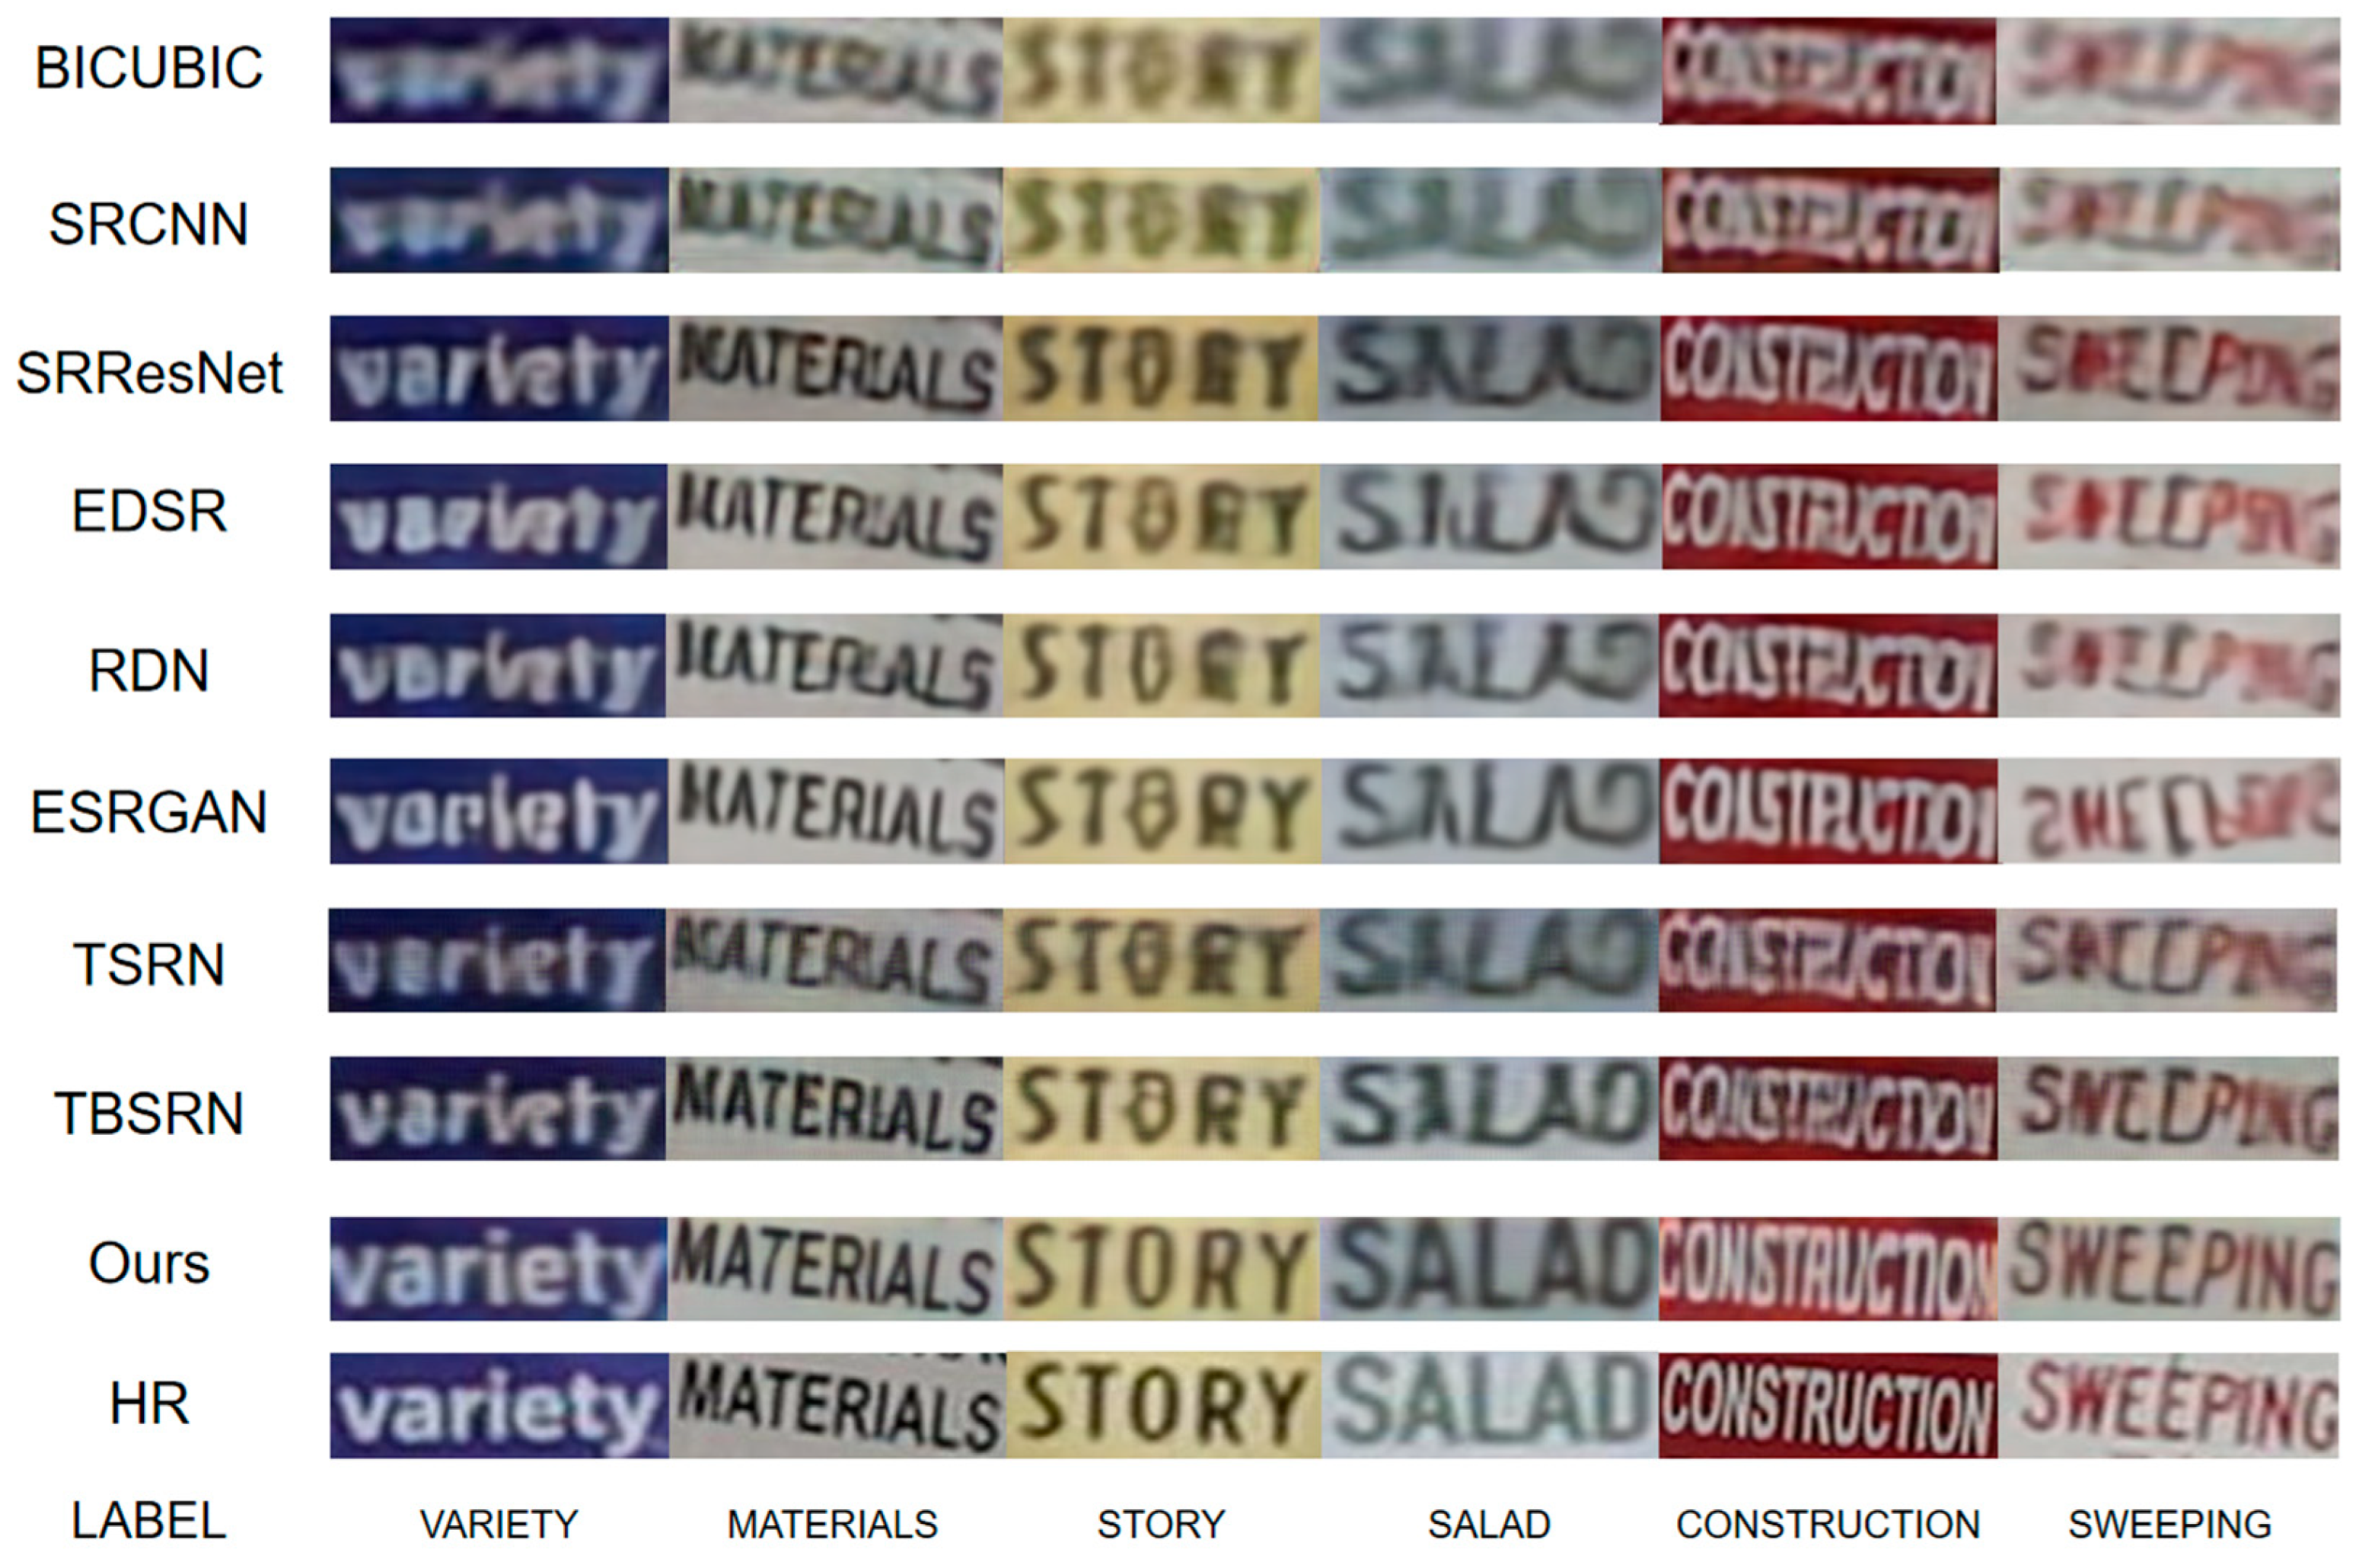
4.3. Experiment Result

In this section, the study delves into a comprehensive assessment of the text image super-resolution model based on pixel-level degradation processes on the TextZoom dataset. A meticulous comparison with prevailing super-resolution models is presented, encompassing EDSR [21], RDN [22], SRCNN, SRResNet [23], ESRGAN [24], TSRN, TSRGAN, and TBSRN. The results illustrate that the model proposed in this study outperforms others across all recognition rate metrics of various recognizers. It is pivotal to emphasize that the comparison was predominantly centered on recent models like TSRN, TSRGAN, and TBSRN, which are particularly tailored for text image super-resolution. Table 1 and Table 2 contrast the outcomes of the methodology with other techniques based on ASTER and MORAN recognition models. It is evident that, in the ASTER recognition model, the methodology’s recognition rates across simple, medium, and difficult levels reached 78.7%, 63.3%, and 45.5%, respectively. Compared to the current most proficient TBSRN technique, the proposed model enhances the average accuracy on ASTER by 2.4% and on MORAN by 2.3%. In terms of recognition rates of images with high difficulty, both ASTER and MORAN exhibited the most substantial growth at 3.9% and 4.2%, respectively, underscoring the significant advancements of the approach in super-resolving particularly blurred images.
Table 3 showcases a comparative analysis of the outcomes achieved by the proposed approach and other established methods when assessed with the CRNN recognition model. It is evident that the methodology achieves recognition accuracies of 62.7%, 55.0%, and 41.1% across the three defined levels of difficulty. When juxtaposed with the current state-of-the-art TBSRN method, the proposed approach exhibits an increment in recognition rate by 3.1%, 7.9%, and 5.8% across these difficulties, respectively. Notably, when drawing a comparison between contemporaneous models, the most pronounced improvement between our model and the TBSRN is evident in the medium difficulty level, underscoring our technique’s superior visual quality in text image super-resolution.
Table 4 and Table 5 depict the comparison of the proposed method with other models in terms of PSNR and SSIM values. Notably, the approach yields lower scores in these metrics. However, this discrepancy is explainable. It is imperative to emphasize that the unconventional approach, which results in a reduction in PSNR and SSIM scores, stems from the specific nuances of super-resolution in text image restoration and the subsequent improvements in recognition accuracy.
Beyond Pixel-Level Metrics: While PSNR and SSIM are valuable in various image processing tasks, they primarily operate at the pixel level. In tasks where fine details and specific content, such as text, are of paramount importance, these metrics might not comprehensively reflect the true super-resolution results. Text image restoration demands an exceptional level of detail and legibility, which goes beyond the scope of pixel-level assessments. The impact of super-resolution on character recognition, text clarity, and OCR accuracy is more effectively captured by a metric that assesses these higher-level qualities.
Evaluating Super-Resolution Results: Although PSNR and SSIM are widely recognized metrics in the super-resolution community, it is essential to acknowledge that they are not the ultimate authority on image quality. In practice, super-resolution results are often subjectively evaluated. Visual assessment by human observers remains a valuable approach to rank the visual reproduction effects of super-resolution result maps. This underscores the recognition that super-resolution quality is not solely determined by mathematical metrics but also by the perceptual experience.
Emphasizing Recognition Rate: In the context of scene text image super-resolution, where the legibility of characters and OCR performance are critical, the recognition rate stands out as a more reflective and practical performance metric. This is particularly pertinent when using the same pre-training OCR model. The recognition rate intuitively reflects the impact of character enhancement, making it an essential measure for assessing the real-world benefits of super-resolution in text image clarity and legibility. It is also aligned with the broader goal of super-resolution in facilitating downstream applications, where text recognition is often the ultimate objective.
In essence, the approach prioritizes the enhancement of text image legibility and character recognition, aligning with the practical applications of super-resolution in the domain of text image restoration. While PSNR and SSIM results may appear lower, the emphasis on recognition accuracy in this paper highlights the tangible and real-world applicability of the super-resolution technique. This reflects the commitment to optimizing text clarity and OCR performance, which is paramount in many text processing and analysis tasks.
To provide a more lucid comparative visualization of the super-resolution results across different models, Figure 8 delineates the enhanced super-resolution images from various models. For the purpose of offering improved clarity regarding finer details, Figure 9 displays an enlarged section of the model. Upon combining Figure 8 with Figure 9, it becomes evident that for the label “VARIETY”, TBSRN incorrectly restores the letter “i” as “v”. In the context of the “SWEEPING” label, TBSRN fails to recover the letter “E”, interpreting it as “C” instead. In stark contrast, the proposed super-resolution model impeccably reconstructs these characters. Observing the labels “STORY” and “CONSTRUCTION”, while other models manage a rudimentary contour restoration, their results are plagued with artifacts, elongated trailing distortions, and suboptimal reconstructions. This approach, on the other hand, delivers artifact-free and precise reconstructions, closely mirroring the original content. Thus, when juxtaposed with other text-focused super-resolution methodologies, the model not only evinces fewer artifacts and distortions but also maintains fidelity to the original content. To sum up, the proposed pixel-level degradation-based text image super-resolution technique holds promising potential for practical real-world applications in text image super-resolution.
When assessing the complexity of super-resolution models for text images, the number of parameters emerges as a crucial metric. It signifies the model’s capacity to capture intricate features and details while maintaining efficiency. Table 6 presents a comparison of the model utilized in this study with the number of parameters in other models. With 5.2 million parameters, the model effectively balances complexity and utility. Remarkably, it achieves the highest recognition rate among the compared models, highlighting its suitability for optical character recognition (OCR)-oriented tasks. This refined feature extraction capability positions the model as a compelling choice for enhancing the legibility of text images in practical applications, solidifying its prominence in the field.

4.4. Limitation

Although the method in this paper can effectively improve the recognition rate of scene text images, there remain areas that warrant further attention, particularly in addressing highly blurred images. While recognition rates have exhibited substantial improvements, conventional metrics like PSNR and SSIM may still suggest room for optimization.

5. Conclusions

This paper has presented a novel approach to text image super-resolution, which amalgamates pixel-level degradation techniques, transfer learning, and conventional degradation methods. The methodology has yielded substantial improvements in recognition rates, underscoring its practical applicability in enhancing text image clarity and legibility, particularly in OCR and text processing applications. Looking ahead, there is a compelling need to address the identified limitations, particularly in augmenting super-resolution efficacy for highly blurred images and optimizing performance across various contexts, including traditional quality metrics such as PSNR and SSIM. Moreover, extending the applicability of this approach to multi-language and multi-script scenarios holds significant promise.

Author Contributions

Conceptualization, X.Q., L.X. and S.Y.; methodology, L.X. and N.Y.; formal analysis, X.Q.; validation, N.Y. and R.L.; writing—original draft, X.Q. and L.X.; writing—review and editing S.Y. and R.L.; supervision, S.Y. and R.L.; funding acquisition, X.Q. and S.Y. All authors have read and agreed to the published version of the manuscript.

Funding

This work was supported by Scientific Research Fund of Zhejiang Provincial Education Department (No. Y202352263) and the National Natural Science Foundation of China (No. 61972357).

Data Availability Statement

Data available on request from the authors. Our code is available at https://github.com/syyang2022/PDTS (accessed on 1 November 2023).

Conflicts of Interest

The authors declare no conflict of interest.

References

  1. Long, S.; He, X.; Yao, C. Scene text detection and recognition: The deep learning era. Int. J. Comput. Vis. 2021, 129, 161–184. [Google Scholar] [CrossRef]
  2. Naiemi, F.; Ghods, V.; Khalesi, H. Scene text detection and recognition: A survey. Multimed. Tools Appl. 2022, 81, 20255–20290. [Google Scholar] [CrossRef]
  3. Dong, C.; Zhu, X.; Deng, Y.; Loy, C.C.; Qiao, Y. Boosting optical character recognition: A super-resolution approach. arXiv 2015, arXiv:1506.02211. [Google Scholar]
  4. Wang, W.; Xie, E.; Liu, X.; Wang, W.; Liang, D.; Shen, C.; Bai, X. Scene text image super-resolution in the wild. In Proceedings of the Computer Vision–ECCV 2020: 16th European Conference, Glasgow, UK, 23–28 August 2020; pp. 650–666, Part X 16. [Google Scholar]
  5. Chen, J.; Li, B.; Xue, X. Scene text telescope: Text-focused scene image super-resolution. In Proceedings of the IEEE/CVF Conference on Computer Vision and Pattern Recognition, Nashville, TN, USA, 20–25 June 2021; pp. 12026–12035. [Google Scholar]
  6. Fang, C.; Zhu, Y.; Liao, L.; Ling, X. TSRGAN: Real-world text image super-resolution based on adversarial learning and triplet attention. Neurocomputing 2021, 455, 88–96. [Google Scholar] [CrossRef]
  7. Ma, J.; Liang, Z.; Zhang, L. A text attention network for spatial deformation robust scene text image super-resolution. In Proceedings of the IEEE/CVF Conference on Computer Vision and Pattern Recognition, New Orleans, LA, USA, 18–24 June 2022; pp. 5911–5920. [Google Scholar]
  8. Wang, K.; Belongie, S. Word spotting in the wild. In Proceedings of the Computer Vision–ECCV 2010: 11th European Conference on Computer Vision, Heraklion, Crete, Greece, 5–11 September 2010; pp. 591–604, Part I 11. [Google Scholar]
  9. Yuan, T.-L.; Zhu, Z.; Xu, K.; Li, C.-J.; Mu, T.-J.; Hu, S.-M. A large chinese text dataset in the wild. J. Comput. Sci. Technol. 2019, 34, 509–521. [Google Scholar] [CrossRef]
  10. Risnumawan, A.; Shivakumara, P.; Chan, C.S.; Tan, C.L. A robust arbitrary text detection system for natural scene images. Expert Syst. Appl. 2014, 41, 8027–8048. [Google Scholar] [CrossRef]
  11. Chen, H.; Gu, J.; Liu, Y.; Magid, S.A.; Dong, C.; Wang, Q.; Pfister, H.; Zhu, L. Masked Image Training for Generalizable Deep Image Denoising. In Proceedings of the IEEE/CVF Conference on Computer Vision and Pattern Recognition, Vancouver, BC, Canada, 18–22 June 2023; pp. 1692–1703. [Google Scholar]
  12. Lan, R.; Sun, L.; Liu, Z.; Lu, H.; Pang, C.; Luo, X. MADNet: A fast and lightweight network for single-image super resolution. IEEE Trans. Cybern. 2020, 51, 1443–1453. [Google Scholar] [CrossRef] [PubMed]
  13. Ates, H.F.; Yildirim, S.; Gunturk, B.K. Deep learning-based blind image super-resolution with iterative kernel reconstruction and noise estimation. Comput. Vis. Image Underst. 2023, 233, 103718. [Google Scholar] [CrossRef]
  14. Wang, X.; Xie, L.; Dong, C.; Shan, Y. Real-esrgan: Training real-world blind super-resolution with pure synthetic data. In Proceedings of the IEEE/CVF International Conference on Computer Vision, Montreal, BC, Canada, 11–17 October 2021; pp. 1905–1914. [Google Scholar]
  15. Niu, A.; Zhu, Y.; Zhang, C.; Sun, J.; Wang, P.; Kweon, I.S.; Zhang, Y. Ms2net: Multi-scale and multi-stage feature fusion for blurred image super-resolution. IEEE Trans. Circuits Syst. Video Technol. 2022, 32, 5137–5150. [Google Scholar] [CrossRef]
  16. Xuhong, L.; Grandvalet, Y.; Davoine, F. Explicit inductive bias for transfer learning with convolutional networks. In Proceedings of the International Conference on Machine Learning, Stockholm, Sweden, 10–15 July 2018; pp. 2825–2834. [Google Scholar]
  17. Chen, X.; Wang, X.; Zhou, J.; Qiao, Y.; Dong, C. Activating more pixels in image super-resolution transformer. In Proceedings of the IEEE/CVF Conference on Computer Vision and Pattern Recognition, Vancouver, BC, Canada, 18–22 June 2023; pp. 22367–22377. [Google Scholar]
  18. Cai, J.; Zeng, H.; Yong, H.; Cao, Z.; Zhang, L. Toward real-world single image super-resolution: A new benchmark and a new model. In Proceedings of the IEEE/CVF International Conference on Computer Vision, Seoul, Republic of Korea, 27 October–2 November 2019; pp. 3086–3095. [Google Scholar]
  19. Zhang, X.; Chen, Q.; Ng, R.; Koltun, V. Zoom to learn, learn to zoom. In Proceedings of the IEEE/CVF Conference on Computer Vision and Pattern Recognition, Long Beach, CA, USA, 15–20 June 2019; pp. 3762–3770. [Google Scholar]
  20. Jaderberg, M.; Simonyan, K.; Vedaldi, A.; Zisserman, A. Synthetic data and artificial neural networks for natural scene text recognition. arXiv 2014, arXiv:1406.2227. [Google Scholar]
  21. Lim, B.; Son, S.; Kim, H.; Nah, S.; Mu Lee, K. Enhanced deep residual networks for single image super-resolution. In Proceedings of the IEEE Conference on Computer Vision and Pattern Recognition Workshops, Honolulu, HI, USA, 21–26 July 2017; pp. 136–144. [Google Scholar]
  22. Zhao, C.; Feng, S.; Zhao, B.N.; Ding, Z.; Wu, J.; Shen, F.; Shen, H.T. Scene text image super-resolution via parallelly contextual attention network. In Proceedings of the 29th ACM International Conference on Multimedia, Virtual Event, China, 20–24 October 2021; pp. 2908–2917. [Google Scholar]
  23. Ledig, C.; Theis, L.; Huszár, F.; Caballero, J.; Cunningham, A.; Acosta, A.; Aitken, A.; Tejani, A.; Totz, J.; Wang, Z. Photo-realistic single image super-resolution using a generative adversarial network. In Proceedings of the IEEE Conference on Computer Vision and Pattern Recognition, Honolulu, HI, USA, 21–26 July 2017; pp. 4681–4690. [Google Scholar]
  24. Wang, X.; Yu, K.; Wu, S.; Gu, J.; Liu, Y.; Dong, C.; Qiao, Y.; Change Loy, C. Esrgan: Enhanced super-resolution generative adversarial networks. In Proceedings of the European Conference on Computer Vision (ECCV) Workshops, Munich, Germany, 8–14 September 2018. [Google Scholar]
Figure 1. Overall process of text image super-resolution method.
Electronics 12 04546 g001
Figure 2. Hybrid Attention Transformer model diagram.
Electronics 12 04546 g002
Figure 3. Result graph generated after pixel-level degradation module based.
Electronics 12 04546 g003
Figure 4. Easy difficulty images in the TextZoom dataset.
Electronics 12 04546 g004
Figure 5. Medium difficulty images in the TextZoom dataset.
Electronics 12 04546 g005
Figure 6. Hard difficulty images in the TextZoom dataset.
Electronics 12 04546 g006
Figure 7. MJSynth dataset.
Electronics 12 04546 g007
Figure 8. Comparison of super-resolution images of each model after visualization.
Electronics 12 04546 g008
Figure 9. Comparison image with details enlarged.
Electronics 12 04546 g009
Table 1. Comparison of the results of this paper’s method with other methods on ASTER recognition.
BackboneEasy/%Medium/%Hard/%
BICUBIC64.742.431.2
SRCNN69.443.432.2
SRResNet69.647.634.3
EDSR72.348.334.3
RDN70.047.034.0
ESRGAN68.449.535.6
TSRN75.156.340.1
TSRGAN75.757.340.9
TBSRN75.759.941.6
Ours78.763.345.5
Table 2. Comparison of the results of this paper’s method with other methods on MORAN recognition.
BackboneEasy/%Medium/%Hard/%
BICUBIC60.637.930.8
SRCNN63.239.030.2
SRResNet60.742.932.6
EDSR63.645.432.2
RDN61.742.031.6
ESRGAN63.443.234.3
TSRN70.153.337.9
TSRGAN72.054.639.3
TBSRN74.157.040.8
Ours75.761.545.0
Table 3. Comparison of the results of this paper’s method with other methods on CRNN recognition.
BackboneEasy/%Medium/%Hard/%
BICUBIC36.421.121.1
SRCNN38.721.620.9
SRResNet39.727.622.7
EDSR42.729.324.1
RDN41.624.423.5
ESRGAN50.233.028.9
TSRN52.538.231.4
TSRGAN56.242.532.8
TBSRN59.647.135.3
Ours62.755.041.1
Table 4. Comparison of this paper’s method with other models in terms of PSNR values.
BackbonePSNR
EasyMediumHard
EDSR24.2618.6319.14
RDN22.2718.9519.70
LapSRN24.5818.8519.77
ESRGAN24.0119.6220.30
TSRN25.0718.8619.74
TSRGAN24.2219.1719.99
TBSRN23.8219.1719.68
Ours20.6418.8819.20
Table 5. Comparison of this paper’s method with other models in terms of SSIM values.
BackboneSSIM
EasyMediumHard
EDSR0.86330.64400.7108
RDN0.82490.64270.7113
LapSRN0.85560.64800.7087
ESRGAN0.84890.65690.7290
TSRN0.88970.66760.7302
TSRGAN0.87910.67700.7420
TBSRN0.86600.65330.7490
Ours0.80290.62920.6655
Table 6. Comparison of this paper’s method with other models in terms of the number of parameters.
BackboneSRCNNEDSRESRGANTSRNTBSRNOurs
Parameters1.8 M43 M16 M2.6 M3.2 M5.2 M
Disclaimer/Publisher’s Note: The statements, opinions and data contained in all publications are solely those of the individual author(s) and contributor(s) and not of MDPI and/or the editor(s). MDPI and/or the editor(s) disclaim responsibility for any injury to people or property resulting from any ideas, methods, instructions or products referred to in the content.

