1. Introduction
Phosphor in Glass (hereinafter referred to as PiG) is an all-inorganic composite fluorescent material sintered using phosphors and ceramic glass materials. It has high heat resistance, thermal conductivity, refractive index and light transmittance. It can effectively improve the excitation efficiency of phosphors while minimizing light attenuation [
1]. During the process of preparing LED crystals from fluorescent ceramic glass materials [
2], it is necessary to undergo high-temperature sintering, segmentation, dicing and other processes. These processes can lead to surface imperfections, including burns, holes, scratches, and defects like missing corners and deformation, all of which impact product yield [
3].
In the selection process of fluorescent glass LED crystals, artificial visual methods and scanning electron microscopy are mostly used. However, the artificial visual method will cause people to have health problems such as visual decline and mental fatigue during prolonged periods of work [
4]. At the same time, due to the limitations of human eye resolution, missed detection and false detection occur from time to time. Because scanning electron microscope [
5] is expensive, it is often impractical for batch use on the production line. In recent years, the vigorous development of machine vision inspection and continuous updating and optimization of deep learning algorithms have provided a new way for industrial inspection [
6].
Compared with traditional defect detection methods, defect detection based on deep learning trains the model through convolutional neural networks and uses the trained model to detect defects. This approach is more efficient compared to traditional methods, offering improved calculation speed and recognition accuracy [
7]. According to the model training method, it can be divided into two types: one-stage detection algorithms and two-stage detection algorithm [
8]. Among them, the two-stage algorithm first generates a series of candidate boxes from the model, and then classifies them through a subsequent classification network. Common methods include R-CNN [
9], Faster-RCNN [
10], Cascade RCNN [
11], etc. The network principle is mainly that a large number of Windows are generated in the first stage [
12]. Windows uses a binary classification method to distinguish foreground and background. In the second stage, the region of interest (ROI) for target detection is used to deduct features from the feature map extracted by the convolutional neural network, followed by classification, which is a different process compared to that of the first stage. The second stage of classification work is multi-target classification, which is used to distinguish the categories of different targets and to predict the position of an object through regression [
13]. While these methods greatly improve accuracy, they may suffer from lower detection rates. In contrast, single-stage algorithms such as SSD and YOLO [
14] series do not need to generate regional candidate boxes, and feature extraction based on regional regression in the network results in high positioning accuracy and detection speed.
Therefore, in order to smoothly realize the rapid detection of PiG defects, this paper selects the most mature YOLOv5s algorithm in the YOLO series to complete the defect detection task, streamlining and improving some modules of the algorithm. Firstly, the coordinate attention mechanism CA is introduced into the Backbone network, and the coordinate information is embedded on the basis of channel attention to improve the detection ability of small defect targets. Secondly, different scale information is fused into the Bidirectional Feature Pyramid Network (BiFPN) at the neck layer to obtain an output feature map with rich semantic information. At the same time, BiFPN adjusts the contribution of different scale input feature maps to the output by introducing weights to optimize the feature fusion effect. Finally, the GIOU_Loss function is replaced by the EIOU loss function, which solves the problem of a certain amount of ambiguity in the GIOU_Loss function and the imbalance of difficult and easy samples.
2. Methods and Materials
2.1. Introduction of YOLOv5 Principle
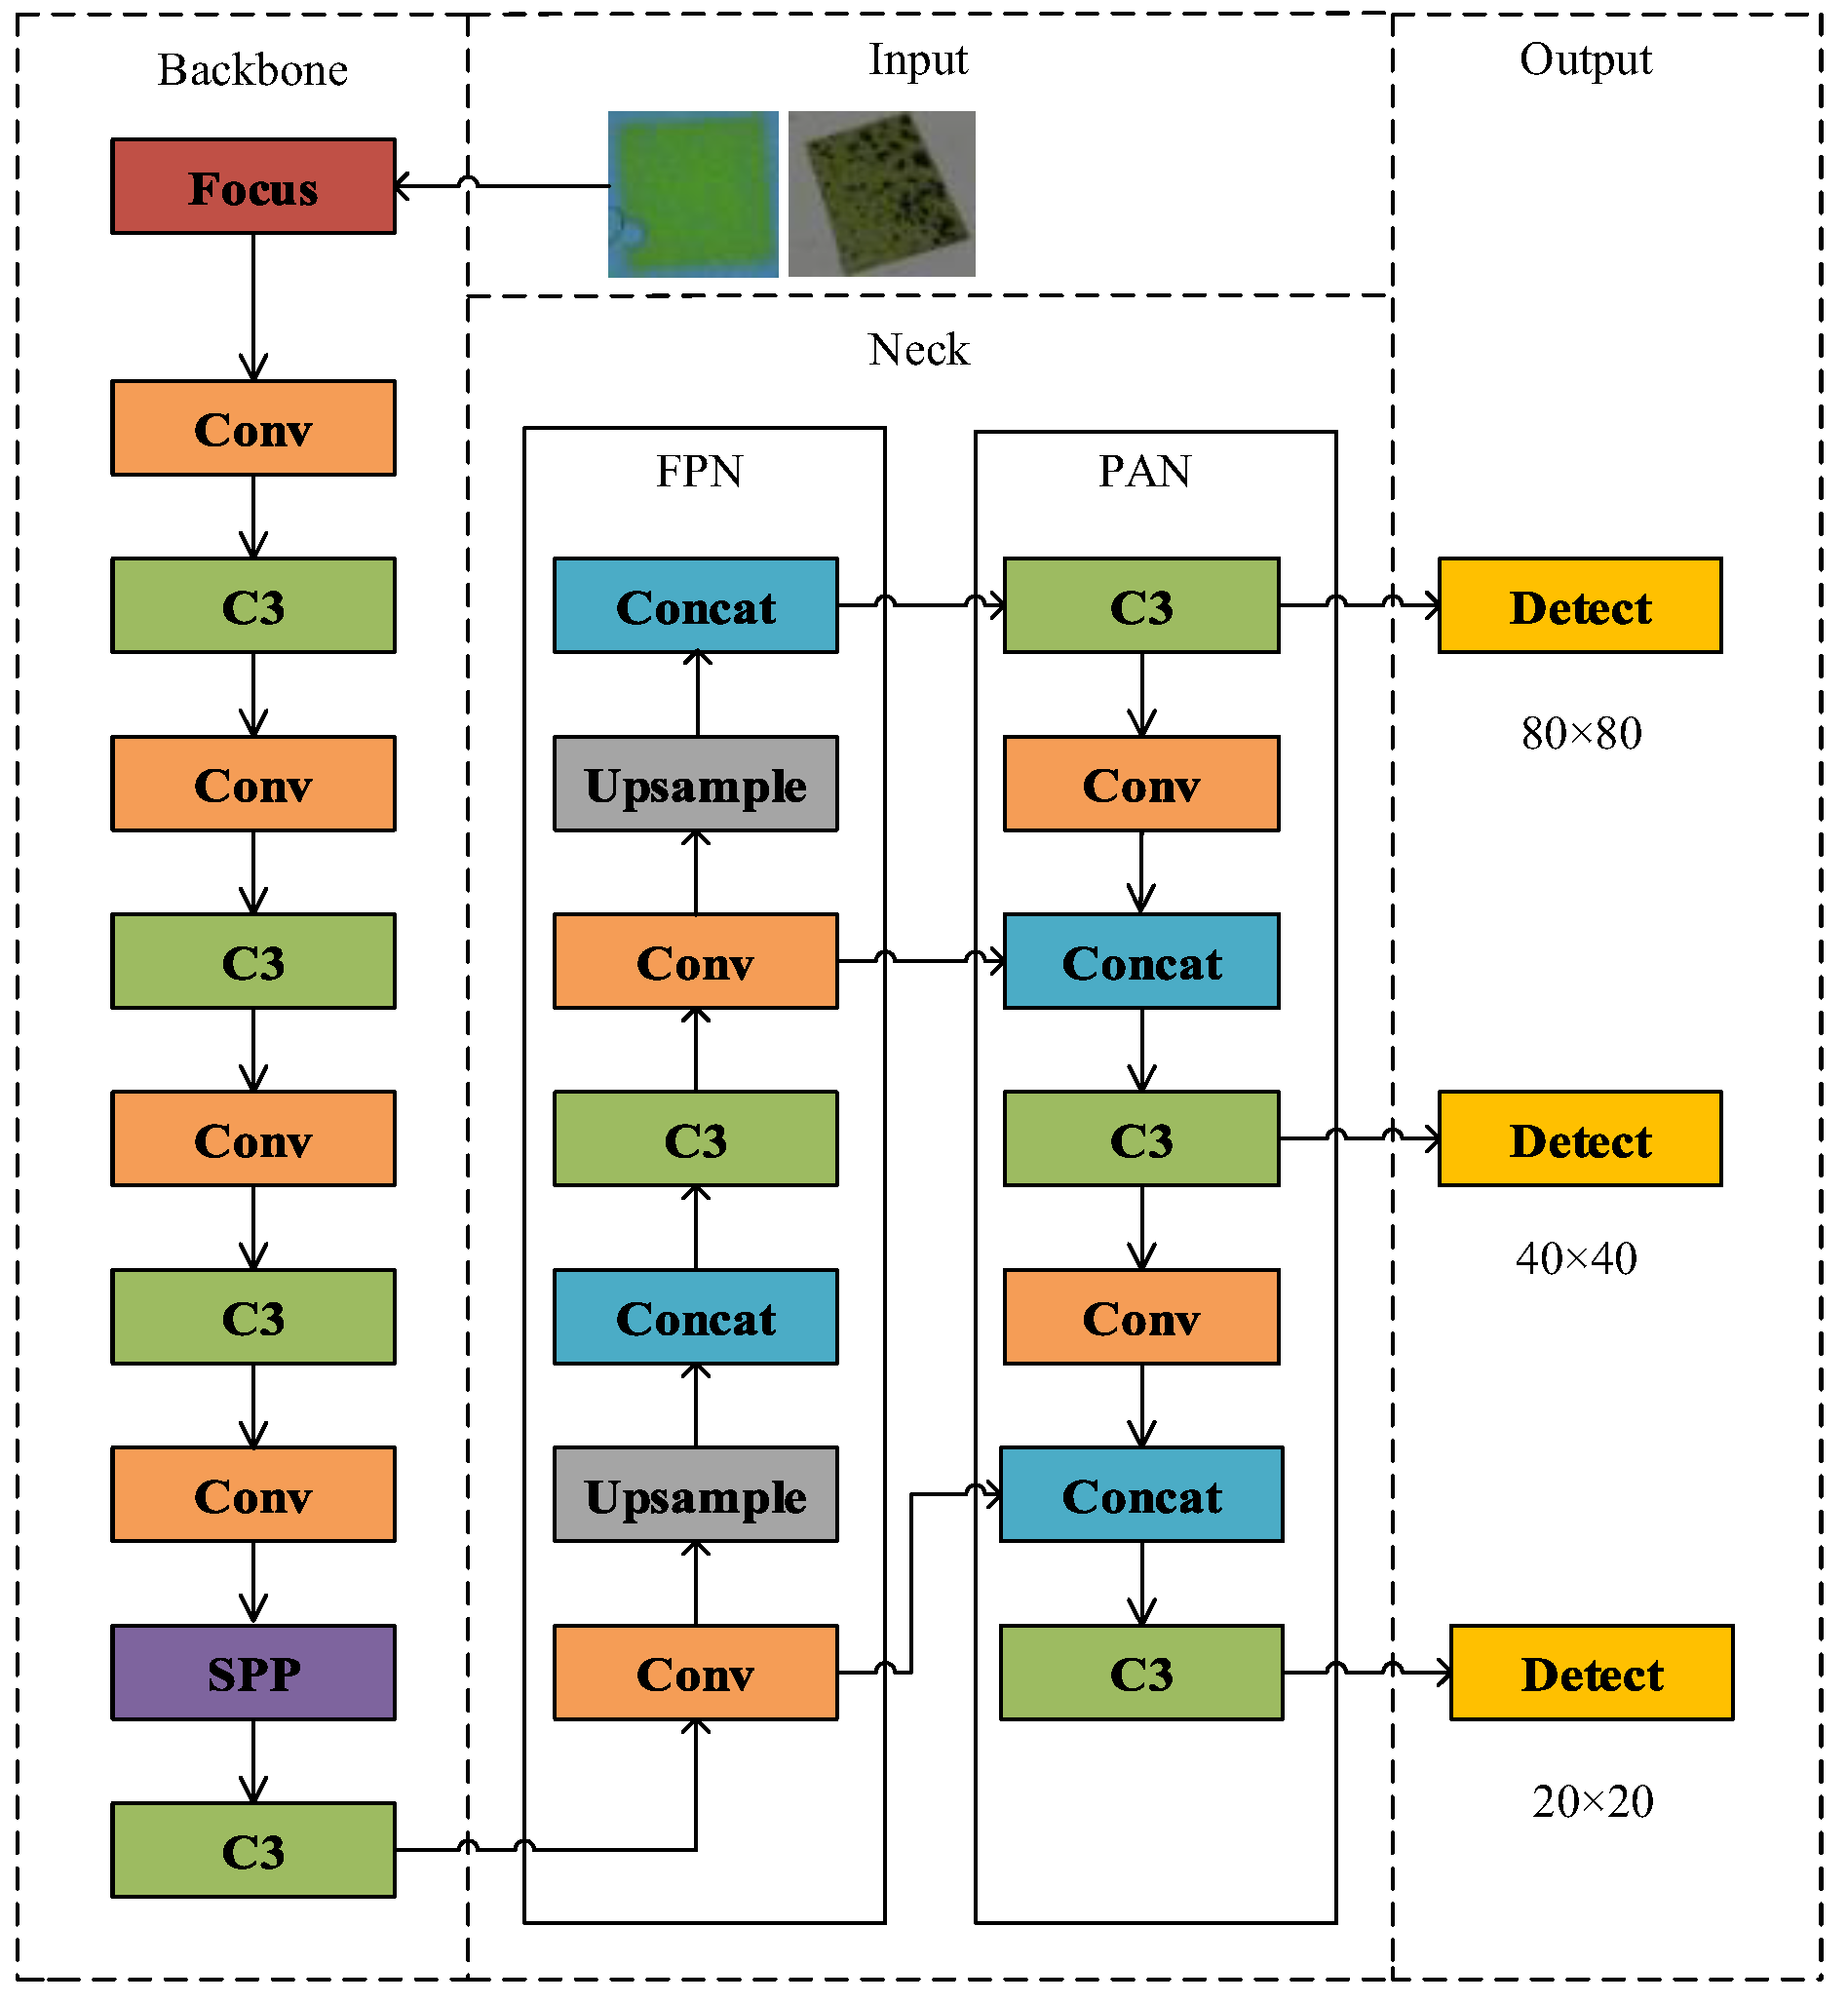
YOLOv5 consists of three parts: Backbone, Neck and YOLO head (illustrated in
Figure 1).
In the Backbone stage, various features are extracted, including the Focus, Conv, C3 and SPP modules. The Focus module reduces the amount of calculation and the number of network layers through slicing operations, thus improving the reasoning speed. Conv is a convolution module to extract features. The C3 module represents CSPNet, which splits the underlying feature map into two parts according to the channel information. One part passes through dense blocks and transition layers, while the other part is combined with the transmitted feature map. The SPP module is transmitted and fused downward through four different pooling layers.
In the Neck part of the network, features are fused and then transmitted to the output. The FPN structure constructs a high-level semantic feature map through a top-down approach, while the PAN adds a bottom-up route to complement and strengthen positioning information.
In the prediction layer, YOLOv5s uses the GIOU_Loss function as the loss function for bounding boxes. This effectively addresses issues where predicted boxes do not align precisely with actual boxes, leading to improved speed and accuracy of the prediction box regression. Finally, weighted non-maximum suppression is employed to enhance the recognition ability for multiple targets.
2.2. Adding Coordinate Attention
When the proportion of pixels in the image is small, the original YOLOv5 algorithm continuously extracts features through the convolutional layer, which is often prone to information loss, resulting in poor detection of small targets [
15].
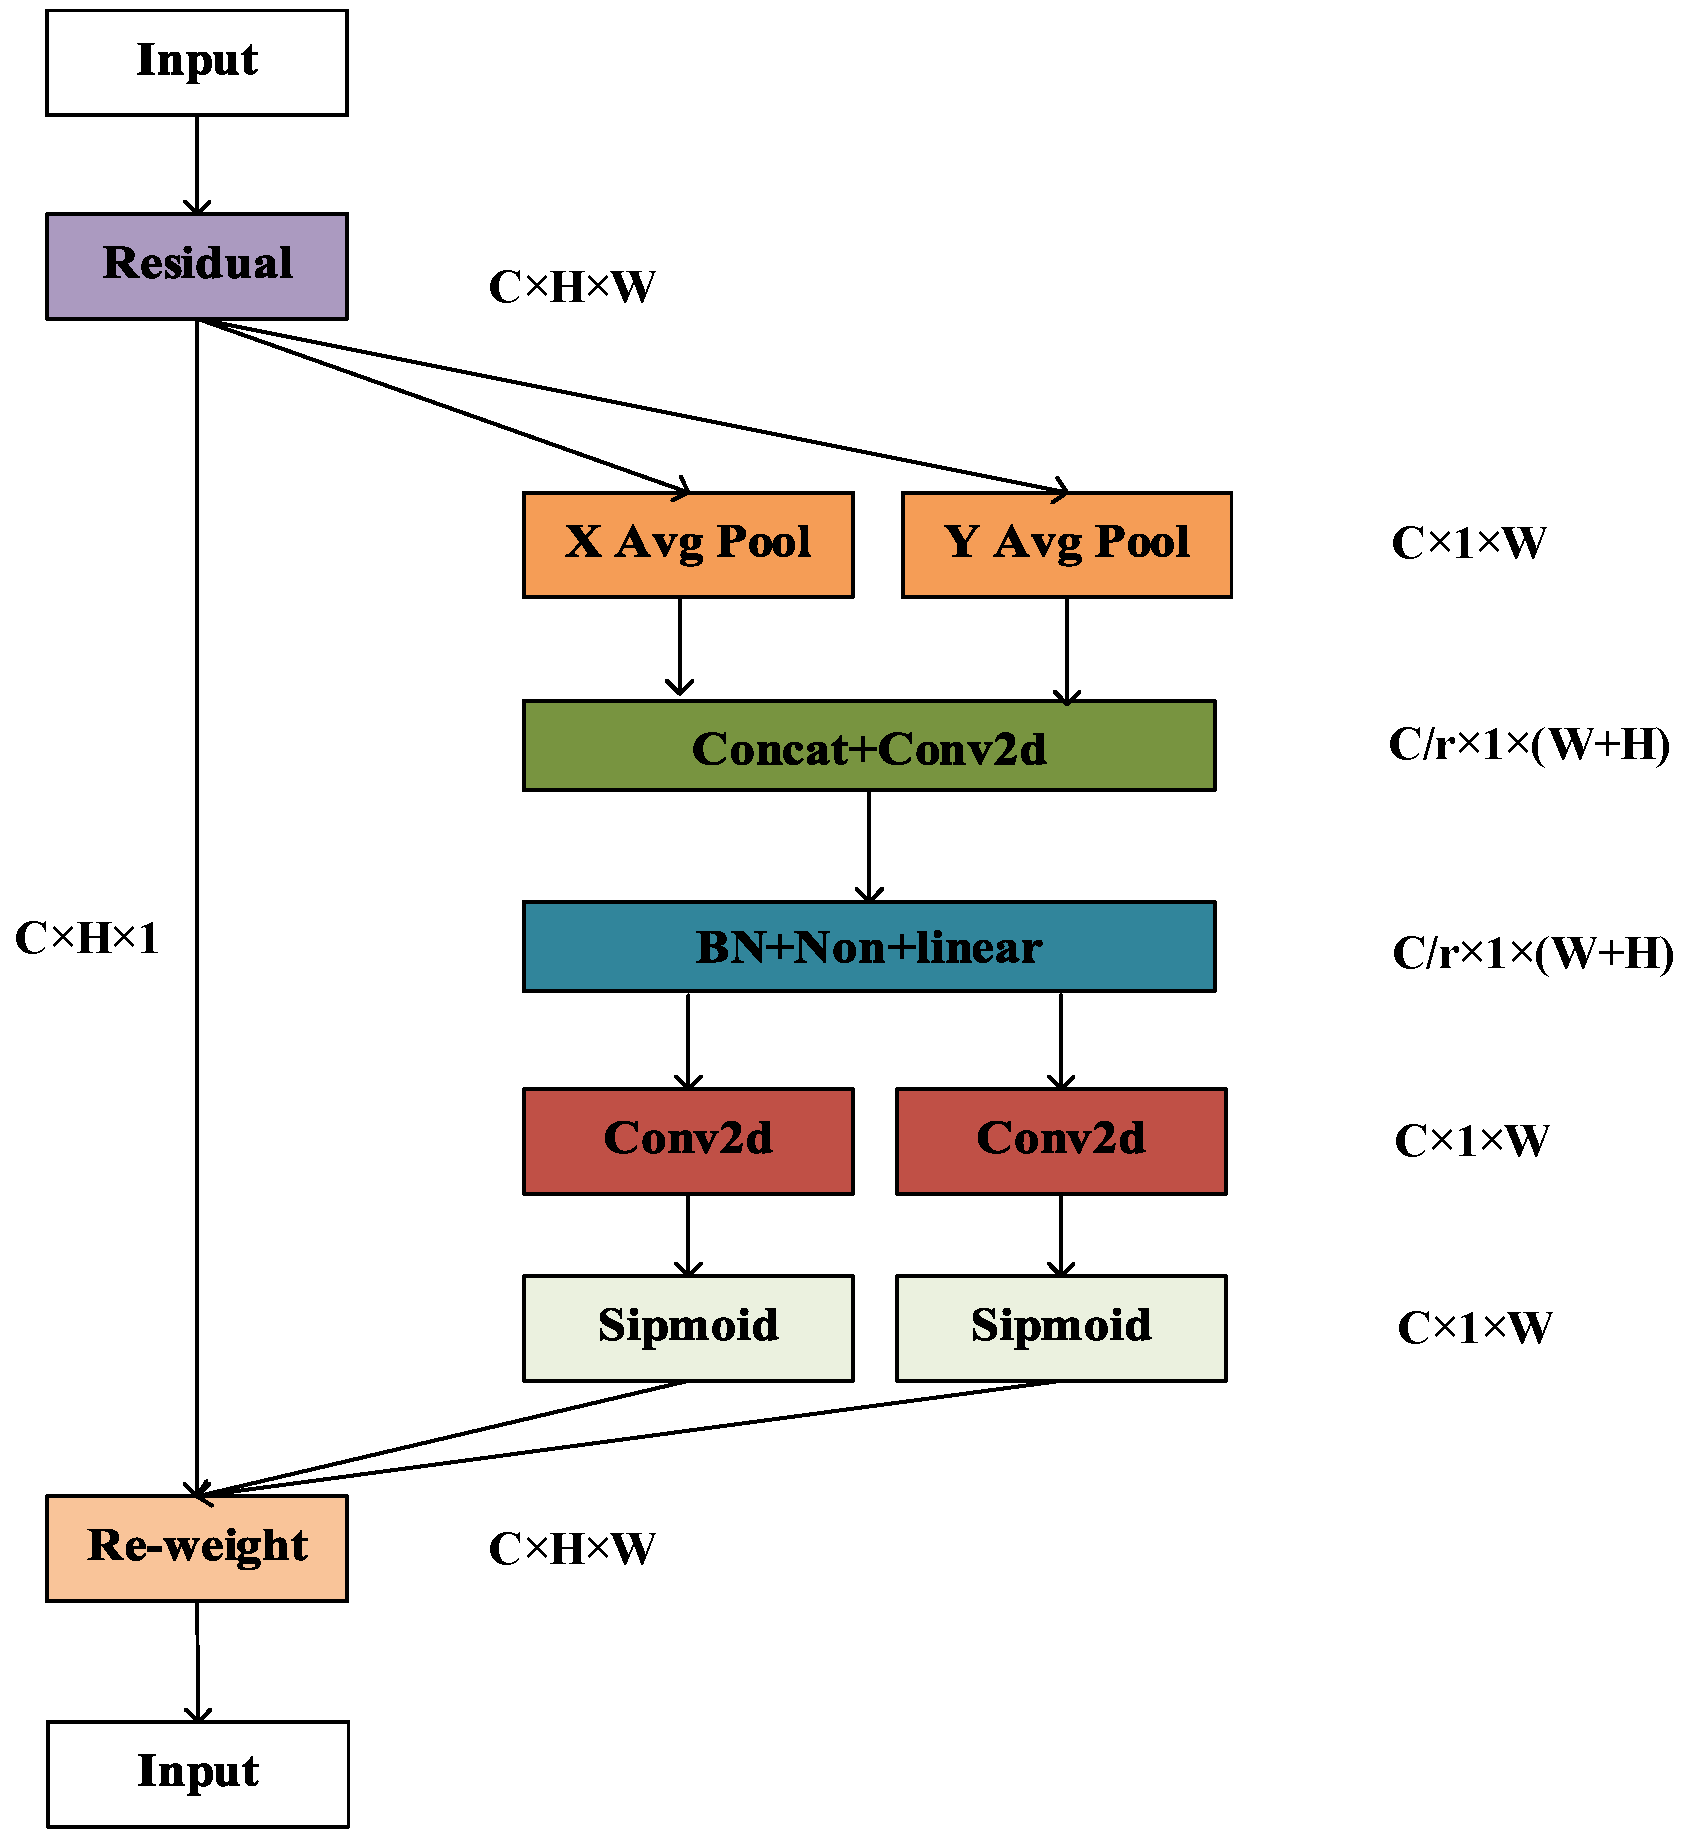
In order to solve the above problems, the Coordinate Attention (referred to as CA) is added to the network structure [
16]. CA not only captures information between channels but also embeds direction-related positional information within channel attention. This effectively mitigates the issue where the channel attention mechanism tends to overlook positional information. Moreover, CA can encode information over a larger area, enabling the network to detect small targets across a broader range [
17]. The structure of the CA module is shown in
Figure 2, where “Residual” represents the residual structure, and “X Avg Pool” and “Y Avg Pool” represent average pooling in the X and Y directions, respectively.
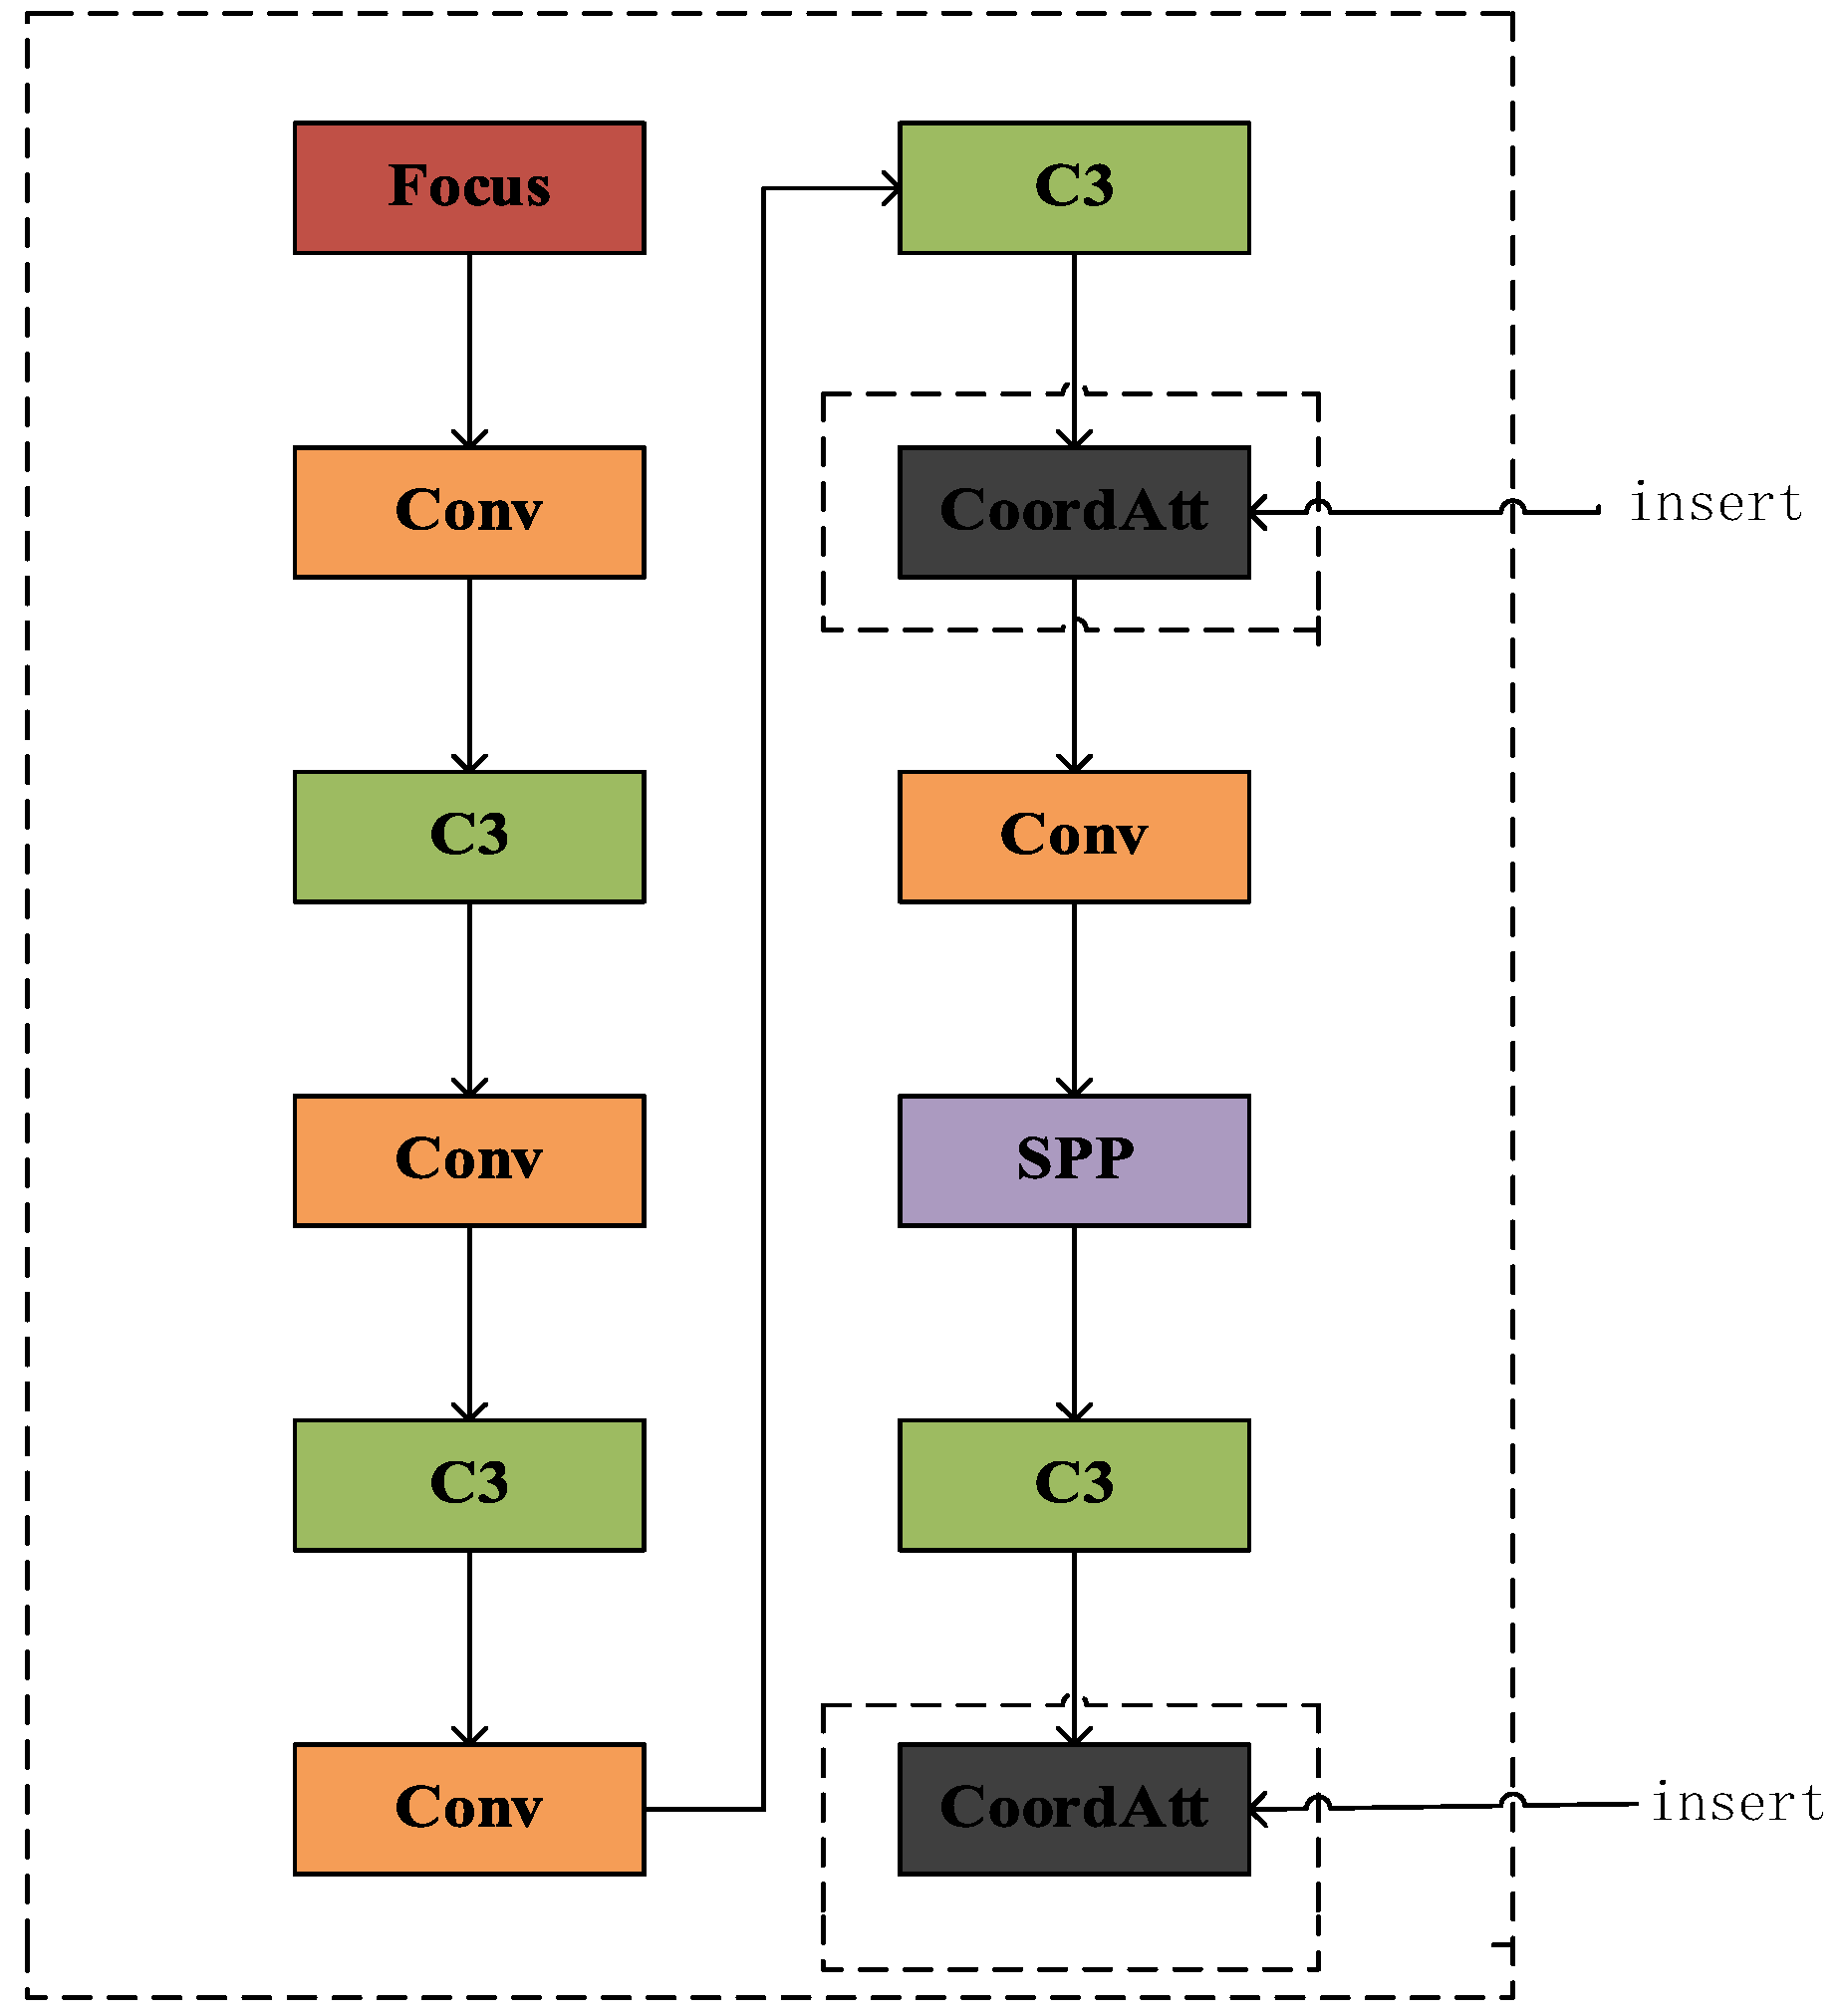
The improved algorithm accurately captures and classifies defects such as holes and black spots, which are common in the production process of ceramic phosphors. As shown in
Figure 3, the CA module is introduced into the backbone network to enhance the model’s ability to extract location information and feature expression.
2.3. Using A Bidirectional Feature Pyramid Network
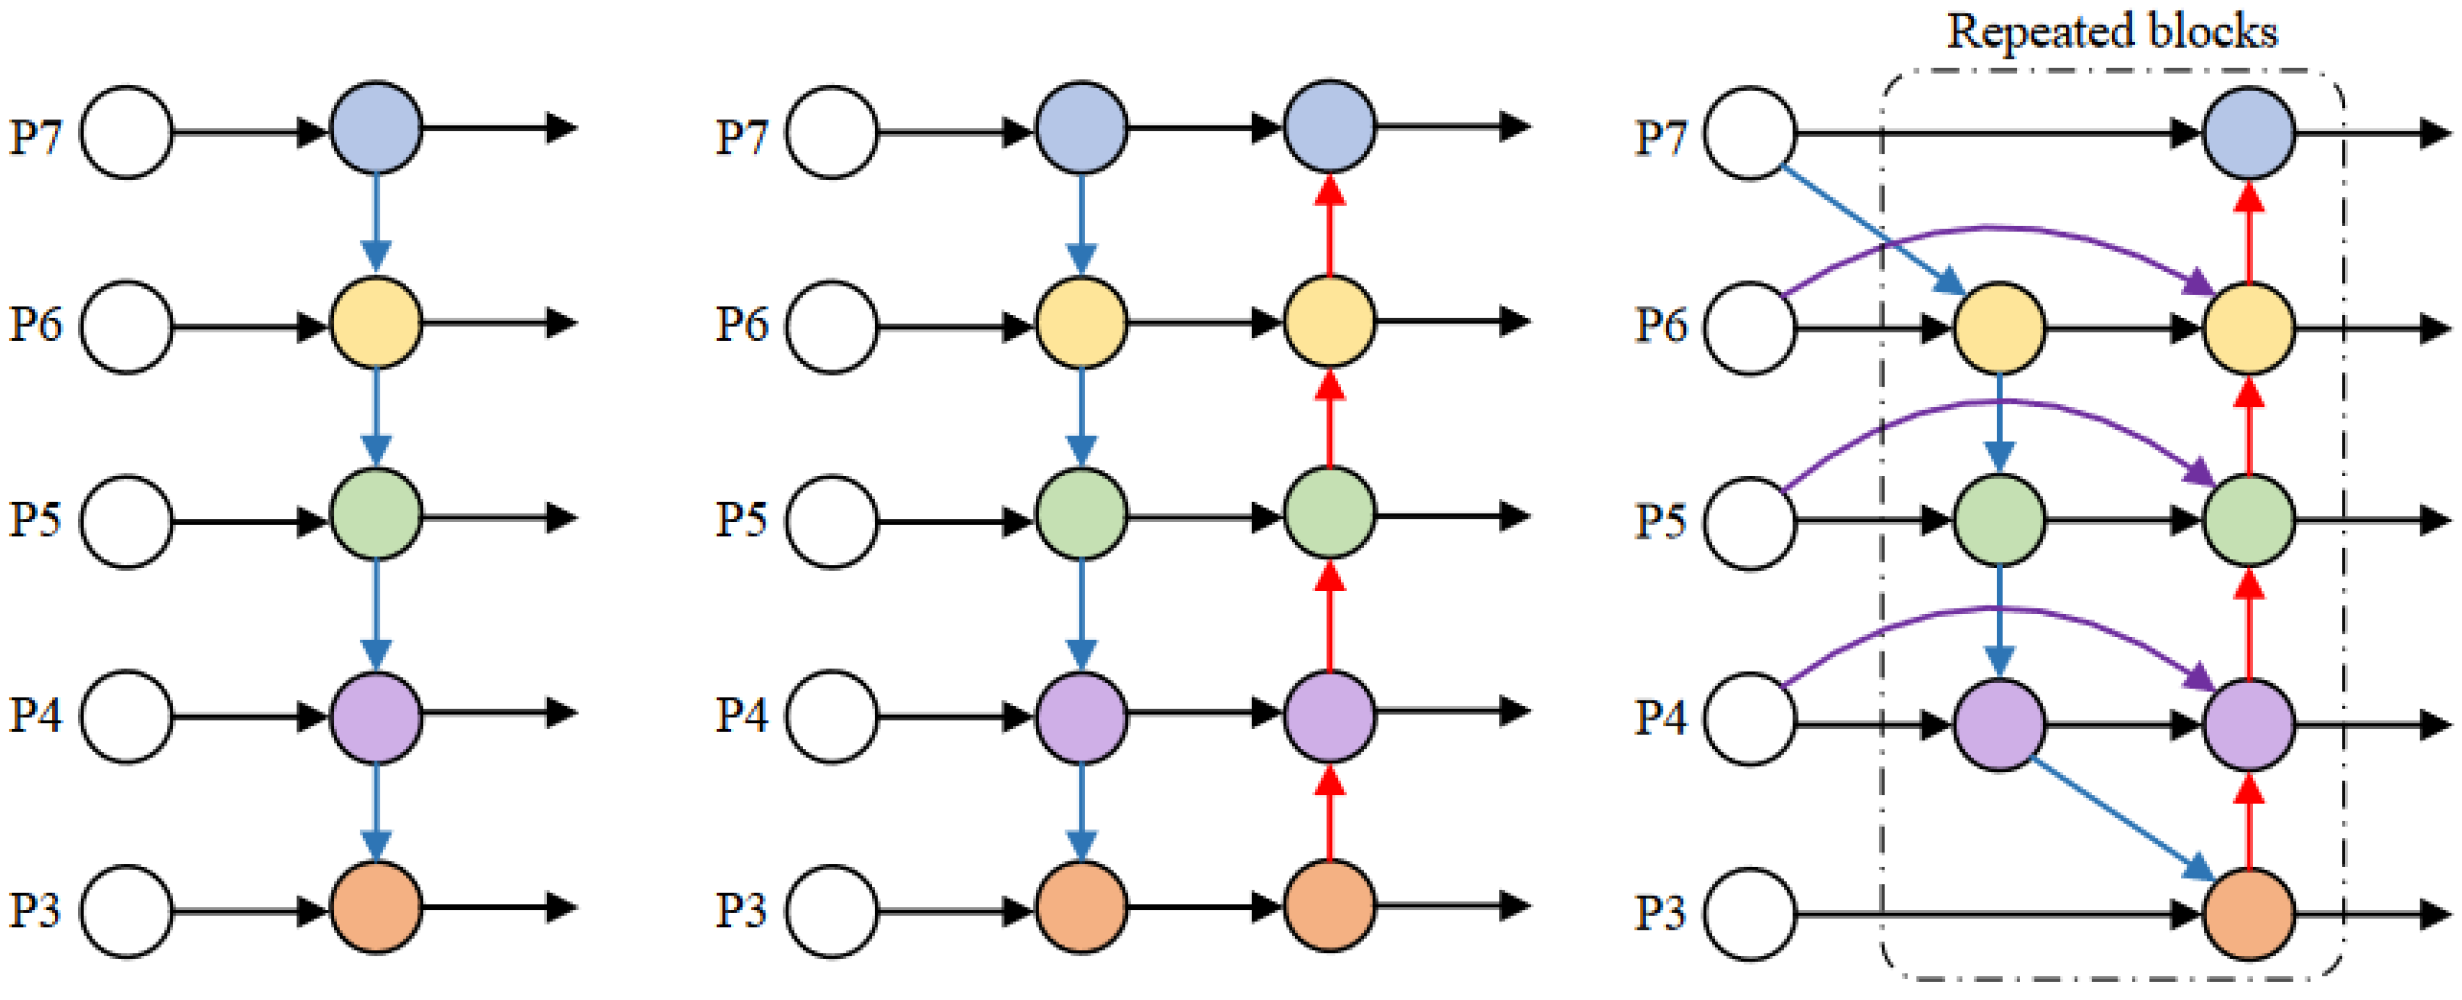
Based on the standard feature pyramid, BiFPN achieves the purpose of simplifying the feature network by deleting the intermediate nodes with only one output edge [
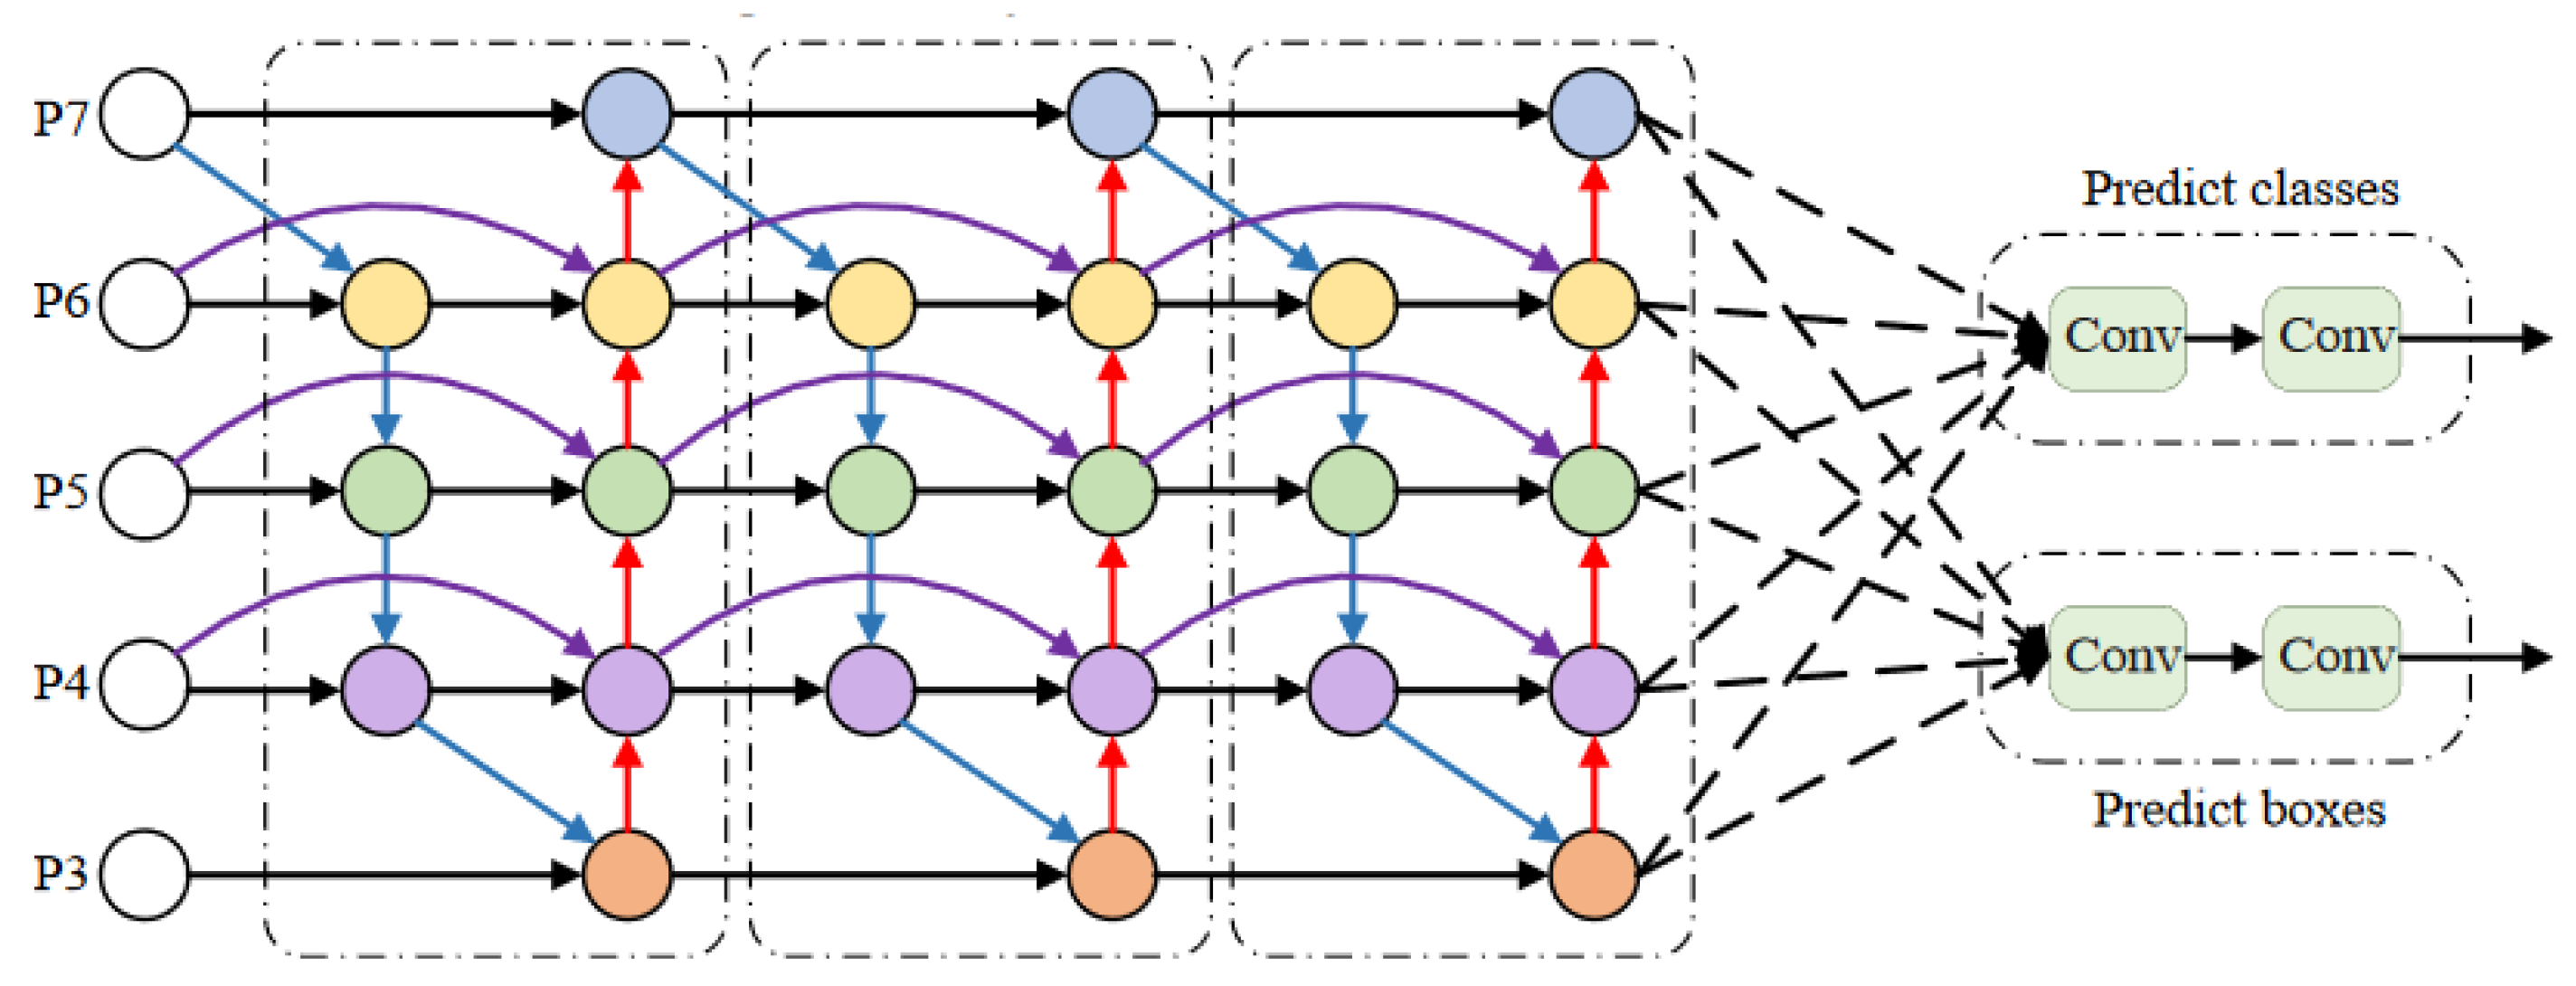
18]. At the same time, additional edges are added at the same level between the input and output nodes to fuse more features at a low cost. Finally, BiFPN processes each bidirectional path (top-down and bottom-up) as a single feature network layer and repeats the layer multiple times to achieve higher-level feature fusion. As shown in
Figure 4, P3–P7 in the figure represent different levels of fused features. The blue arrow represents a top-down path, the red arrow represents a bottom-up path, and the purple arrow represents adding other edges to the input and output nodes of the same level.
Since different input features have different resolutions, different weights should be attributed to the final output at each node performing feature fusion. Therefore, BiFPN introduces training weights to add additional weights to each input to adjust the contribution of different inputs to the output feature map. BiFPN uses fast normalized fusion to select weights, which directly divides the sum of all values by weights and normalizes the normalized weights to the range [0, 1]. The calculation formula is shown in Formula (1):
where
Ii represents the input characteristic, ε is a smaller value to avoid numerical instability; ω
i ≥ 0 is a small value that avoids numerical instability by applying ReLU after each ω
i to ensure that ε = 0.0001 [
19].
As shown in
Figure 5, the BiFPN network with repeated three layers is used as the improved method of the Neck part of the network in this paper. This adaptation enhances the network’s capacity to fuse different input features and improve feature extraction across various scales.
The improvements to the feature fusion structure in this paper are as follows: (1). Deepen the feature pyramid depth and increase detection head matching. The receptive field of the high-level feature map is larger, and the semantic information contained in it is richer. The fusion of low-level location feature information and high-level semantic information is more conducive to the identification and detection of small targets. (2). Delete unnecessary nodes and increase cross-layer connections. The nodes that do not participate in feature fusion contribute minimally to the feature network’s ability to integrate different features. The nodes with only one input edge in the network are deleted, which simplifies the feature fusion network and effectively reduces the amount of model calculation. For the feature map of the same size, two additional cross-layer connections are added, which can fuse more feature information and improve the network detection accuracy with a slight increase in computational complexity. (3). Incorporate weighted feature fusion. Introduce learnable weights to learn the importance of different input features, similar to the attention mechanism. This enables the model to reduce the weight of secondary features and focus on the learning of more important and key features.
2.4. Improvement of Positioning Loss Function
The function of the loss function is to measure the distance between the neural network prediction information and the expected information. The closer the prediction information is to the expected information, the smaller the loss function value is. The loss function of YOLOv5 training includes Location Loss(e
d), Classification Loss(e
s) and Confidence Loss(e
k), which define the total loss of the network (l):
where
ed is obtained by the GIOU loss, denoted by:
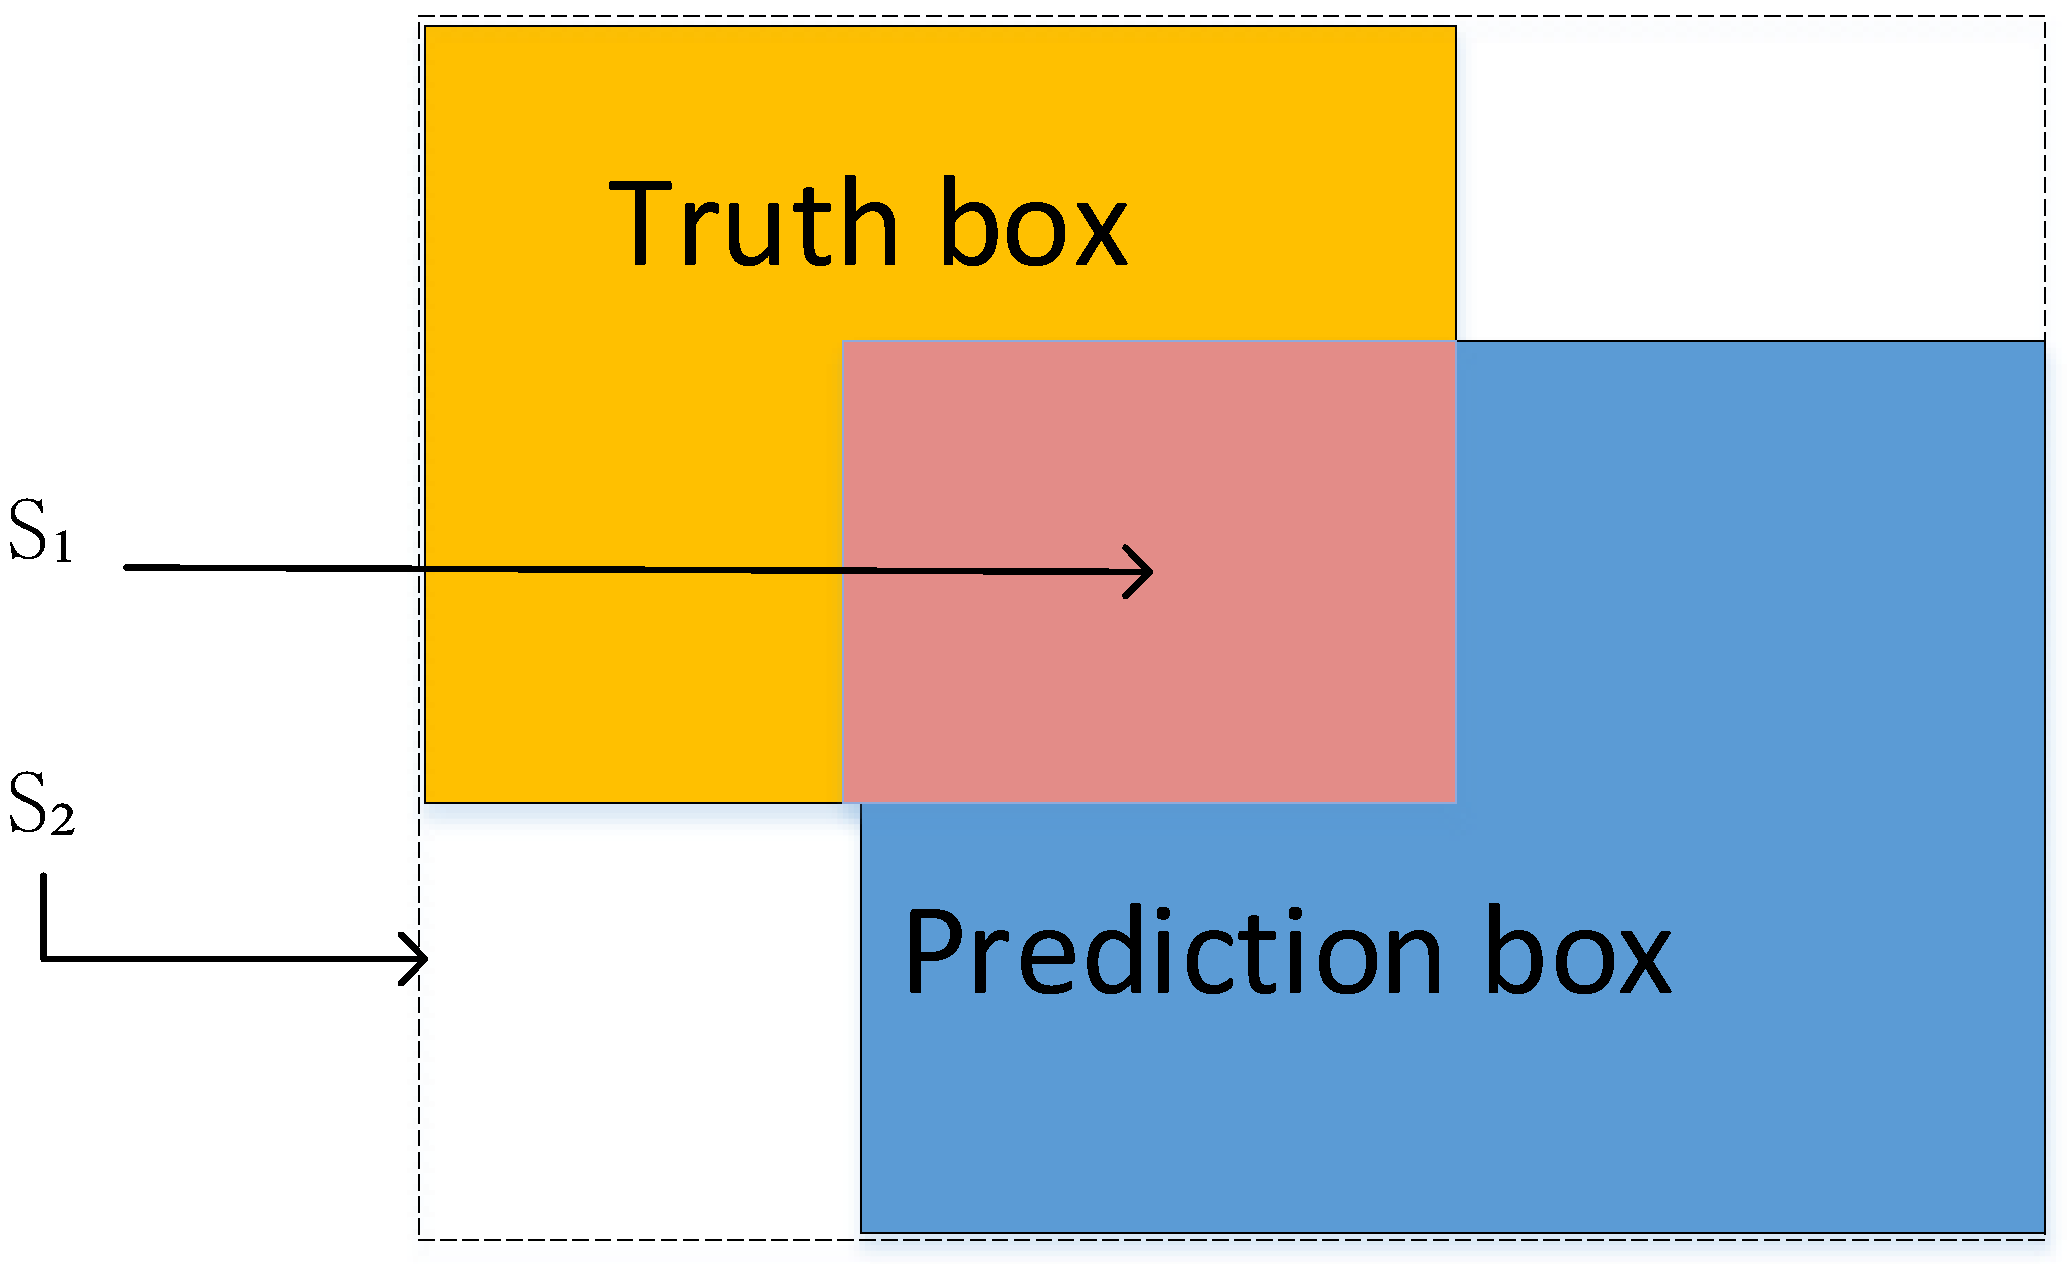
As shown in
Figure 6, IOU is the intersection ratio of the prediction box and the real box,
S1 refers to the overlapping area of the two boxes, and
S2 represents the minimum rectangular area of the prediction box and the real box.
The original Yolov5 algorithm solves the problem that the IOU value is 0 when the two boxes have no intersection area by introducing the GIOU_Loss function [
20]. However, when the aspect ratio of the two boxes is linear, there will be some ambiguity, so that the regression optimization cannot be continued. At the same time, this method does not consider the balance between difficult and easy samples. In order to solve these two problems, the EIOU loss function is introduced to split the influence factor of the aspect ratio from the CIOU function. It calculates the width and height of the prediction box and the real box are calculated, respectively. Based on the two losses of overlap area and center point distance of GIOU, EIOU changes the uniform penalty of aspect ratio to separate penalty, so that the difference between the width and height of the target box and the anchor box is minimized, and the convergence speed of the loss function and the regression accuracy of the prediction box are improved [
21].
The EIOU_Loss principle is shown in Formula (4), where C
W and C
K represent the width and height of the minimum circumscribed rectangle of the prediction box and the real box.
EIOU_Loss, SIOU_Loss and AlphaIOU_Loss are all improved versions of IOU, which are used to calculate late the overlap between the detection box and the real box. Their differences are mainly reflected in the calculation methods and optimization objectives. In this paper, EIOU_Loss is selected according to the characteristics of the material itself. The optimization goal of EIOU_Loss is to maximize the overlap between the prediction box and the real box, and to consider the influence of angle differences. Subsequently, the superiority of its improvement is demonstrated through experimental data.
2.5. Causes of Defects
With the continuous optimization of material properties, the luminous efficiency of PiG-based white LED has been able to meet the requirements of general lighting boasting excellent heat and moisture resistance. This solid foundation enables PiG material to replace the organic resin-based fluorescent conversion layer in traditional white LEDs. However, the application of PiG materials in the field of white LEDs is still constrained by the following three key scientific issues.
2.5.1. Poor Luminescence Performance
The luminescent properties of PiG materials are derived from the incorporation of commercial LED phosphors. However, the structural integrity of these phosphors is easily destroyed by the heat treatment and the formation of glass melt during the preparation process. Consequently, PiG materials cannot completely retain the initial luminescent properties of the phosphors. In addition, when a variety of phosphors are randomly dispersed in the same glass matrix, reabsorption occurs between the phosphors due to spectral overlap. This leads to a decrease in the luminous efficiency and color purity of PiG.
2.5.2. Low Transparency
The transparency of PiG materials is related to the scattering of light at the phosphor/glass interface. The scattering of light through PiG material, caused by scattering sources such as commercial LED phosphor grains and residual holes, conforms to Mie scattering. Based on the Van de Hulst approximation theory, the closer the refractive index of the glass matrix is to that of the scattering source, the lower the light scattering efficiency becomes. In fact, the poor transparency of the material caused by refractive index mismatch and holes significantly reduces the luminous efficiency of PiG-based white LED devices.
2.5.3. Mechanical Strength and Mass Production
The thickness of the fluorescent layer is usually controlled at a few hundred microns when high-efficiency white light emission is achieved in LED devices. However, how to ensure the mechanical strength of PiG materials and mass production in practical applications is a problem that needs to be continuously explored. Coating the fluorescent layer on the surface of the transparent glass substrate to convert it into a single functional layer can effectively solve the above problems. However, research in this area is rare.
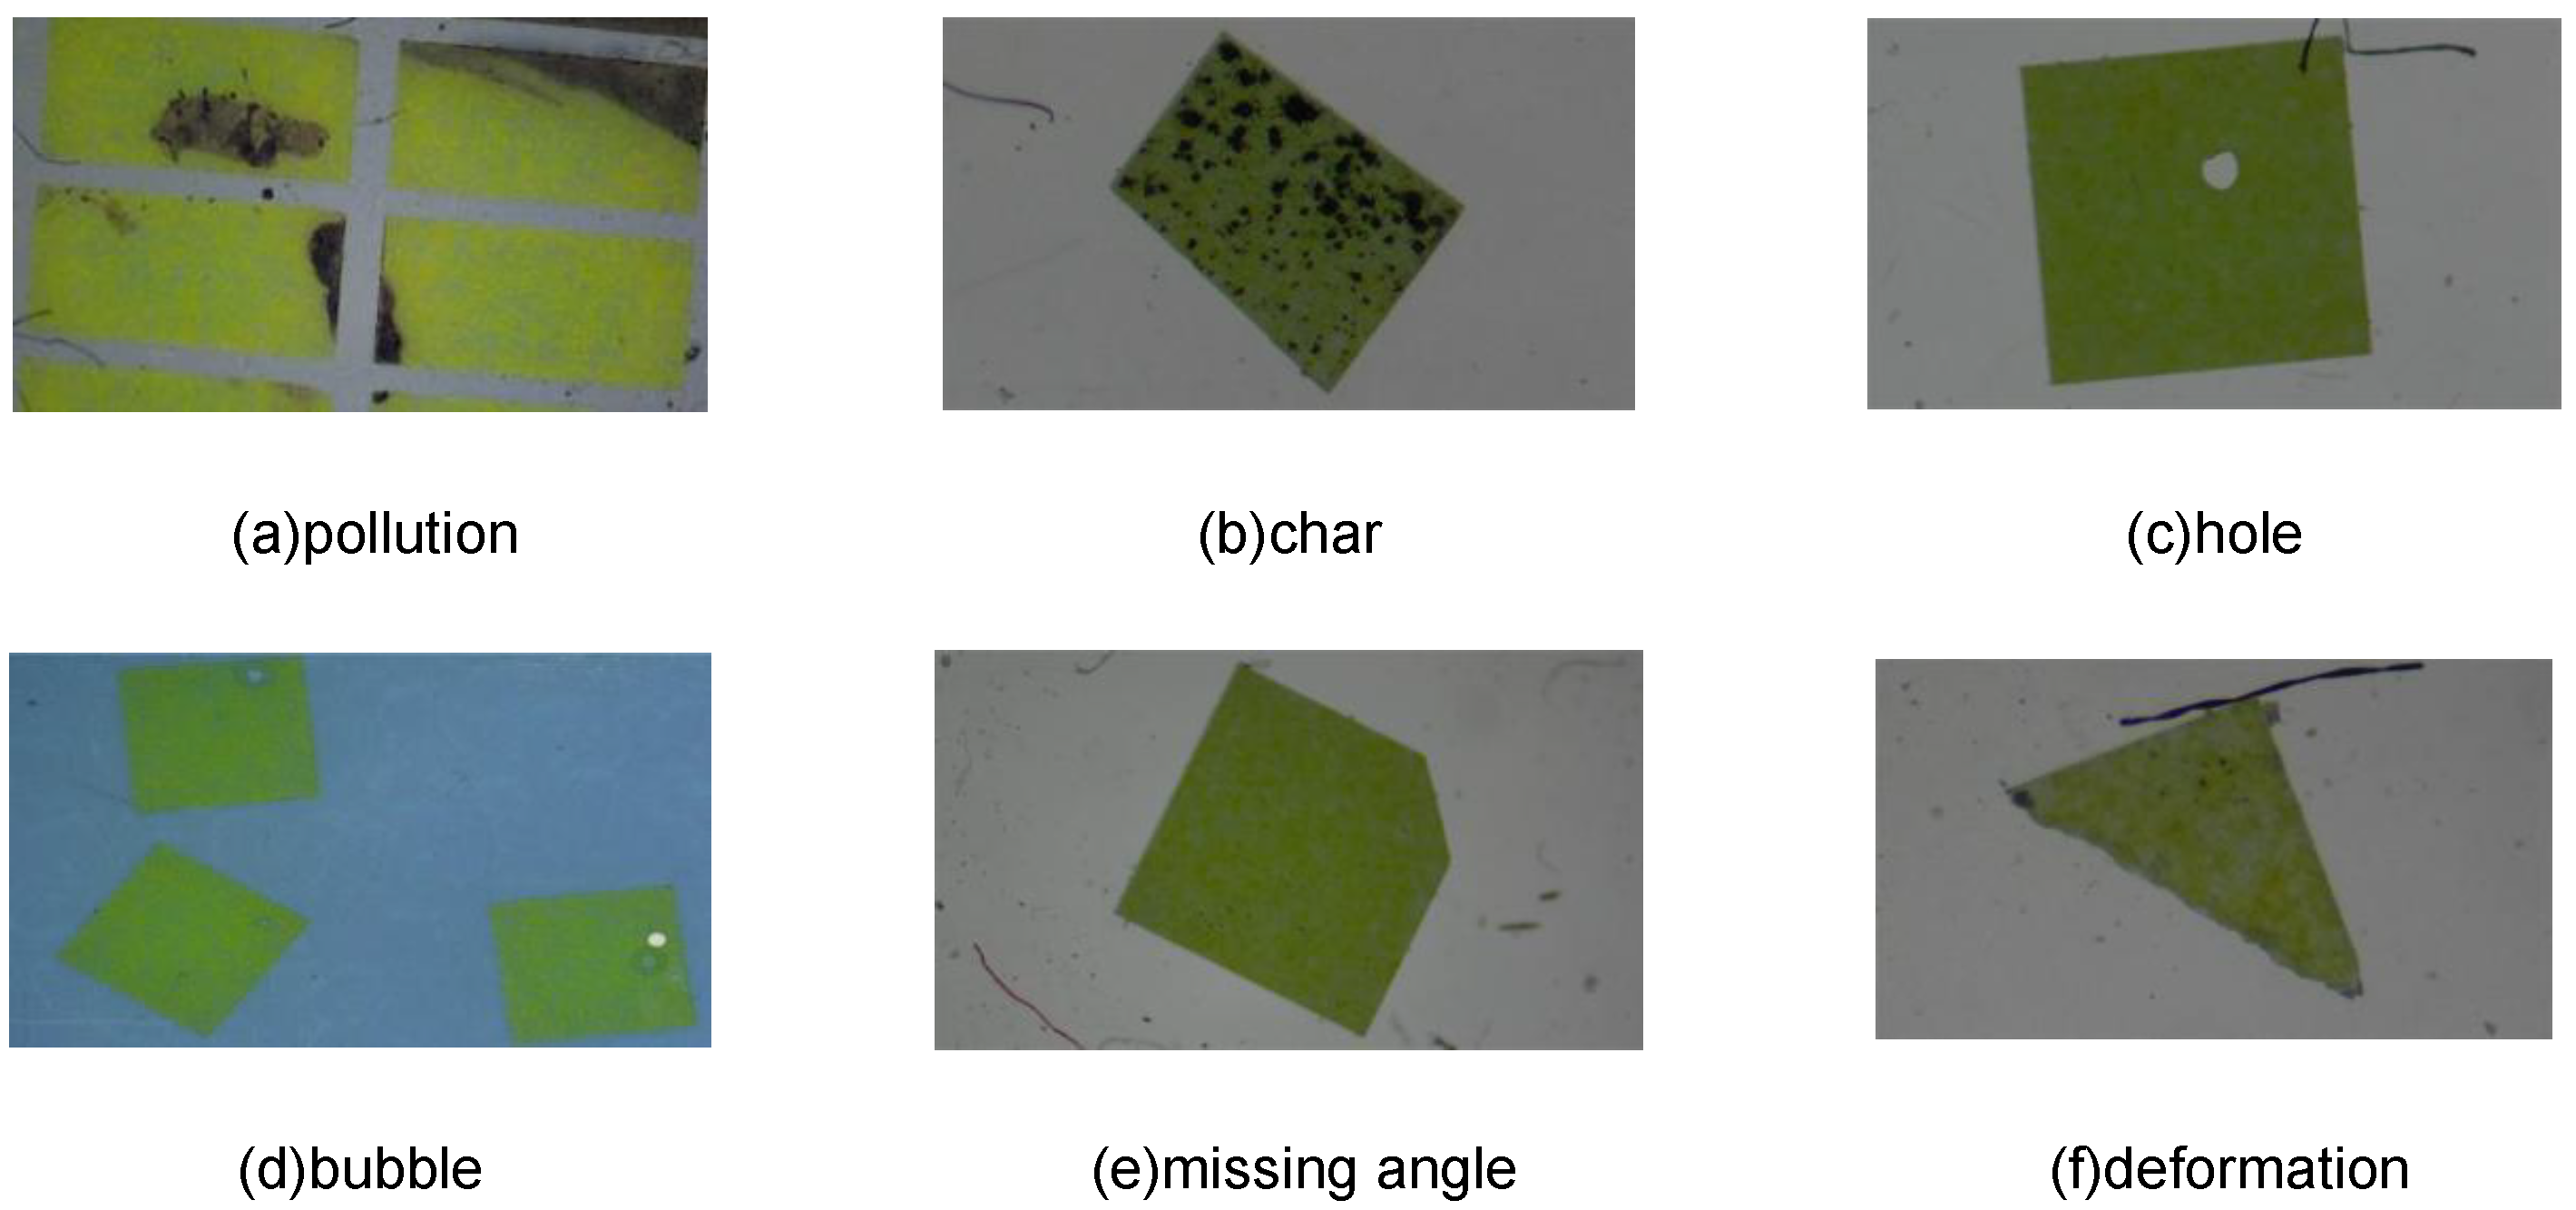
There are six main defects caused by the above reasons. By categorizing the types of defect detection, the defects are classified into two types: surface damage and shape damage. Surface damage includes pollution, char, hole, bubble, and other types, while shape damage includes missing angles and deformation, among others. The annotation software LabelImg 1.4.3 is used to annotate the data, classifying defects into two categories: surface damage and shape damage.
Figure 7a–d depict common surface damage, while
Figure 7e,f depict common shape damage. The following are all defects of the original sample.
2.6. Dataset Acquisition
In this paper, the data collection method for the fluorescent ceramic glass material dataset is collected by enterprise supplies. A high-definition CCD microscope, GP-530H of Kunshan High-quality Precision Instrument Co., Ltd, was produced in Kunshan City, Jiangsu Province, China. It is used for shooting. The camera magnification offers a magnification of 50 times, an object distance is 110 mm, and a shooting image resolution of 1920 × 1080. A vertical illumination scheme is adopted. The annular light source is placed vertically relative to the horizontal plane. The color temperature of light is 7000 k, which is white light illumination. The advantages of this scheme are uniform illumination, large illumination area and vertical light.
A total of 1000 defect samples, each sized 1920 × 1080, were obtained using electron microscopy. In order to meet the training requirements of deep learning, it is necessary to enhance the data. The above fault samples are flipped, cropped, translated and so on. A total of 3000 pictures are obtained and divided into training set and test set according to the ratio of 4:1 to establish PiG dataset. The dataset of surface defects is 1800, and the dataset of shape defects is 1200.
3. Results
3.1. Experimental Environment Settings
This experiment uses the deep learning platform of the cloud server, and the Linux operating system. The GPU graphics card model is NVIDIA Container Toolkit with 64 GB of memory. The deep learning framework employed is Pytorch 1.11.0, and the coding environment runs on Ubuntu 18.04 using Python 3.9. The CUDA version used is 11.3.
The experimental setting is basically based on the official recommended parameter setting of YOLOv5s, using adaptive anchors and mosaic data enhancement. The input image size is set to 640 × 640, the initialization learning rate is 0.01, the weight attenuation is set to 0.05, and the maximum number of iterations is set to 32, maximizing the memory usage of GPU devices. The maximum number of iterations for training is 200, and the validation dataset is evaluated after each epoch.
3.2. Experimental Evaluation Index
The model size, Prediction (P), Recall (R), mean Average Precision (mAP), and the number of frames per second (FPS) are used to evaluate the model. The model size can reflect the lightweight degree of the model. The accuracy represents the number of objects detected by the object detection system, while the recall rate signifies the probability of correctly detecting real objects. The mAP measures the model’s recognition accuracy, and FPS represents the number of frames that can be detected per second. A higher FPS value indicates faster detection speed. The calculation process for P, R, mAP is shown in Formulas (5)–(7):
In these formulas, TP represents the number of positive samples determined, FP represents the number of samples that should be negative but judged to be positive, FN represents the number of samples that should be positive but judged to be negative, AP represents the average accuracy of each category, and N is the number of classifications.
3.3. Experimental Result Analysis
In order to verify the feature extraction ability of the CA module, the current mainstream attention mechanism is added to the network, and the other parts remain unchanged. A comparative experiment is performed using the self-made dataset. The results are shown in
Table 1.
Through analysis, it can be seen that when the detection speed is almost the same, the accuracy rate increases the most after adding the CA module, making it the most suitable for this dataset.
In order to test the effectiveness of the improved algorithm, ablation experiments were performed on the basis of the original algorithm. The same hyperparameters and training strategies were used in each group of experiments. The experimental results are shown in
Table 2.
Experiment 1 is the original algorithm. Experiment 2 only optimizes BiFPN. The results show that the accuracy and speed are slightly improved. In experiment 3, only the CA module was added on the basis of the first experiment resulting in a significant improvement in detection accuracy. However, this improvement came at the cost of reduced detection speed. Experiment 4 optimizes the loss function only on the basis of experiment 1, solving the issue of ambiguity in the original GIOU_Loss function, resulting in increased speed. Experiments 5, 6 and 7 adopt two kinds of optimization, demonstrating greater improvements in detection accuracy. Finally, all parts are improved in Experiment 8. Compared with the original algorithm, mAP is increased by 13.25%, while FPS is only decreased by 1.63%, which meets the requirements of industrial detection speed and greatly improves the accuracy.
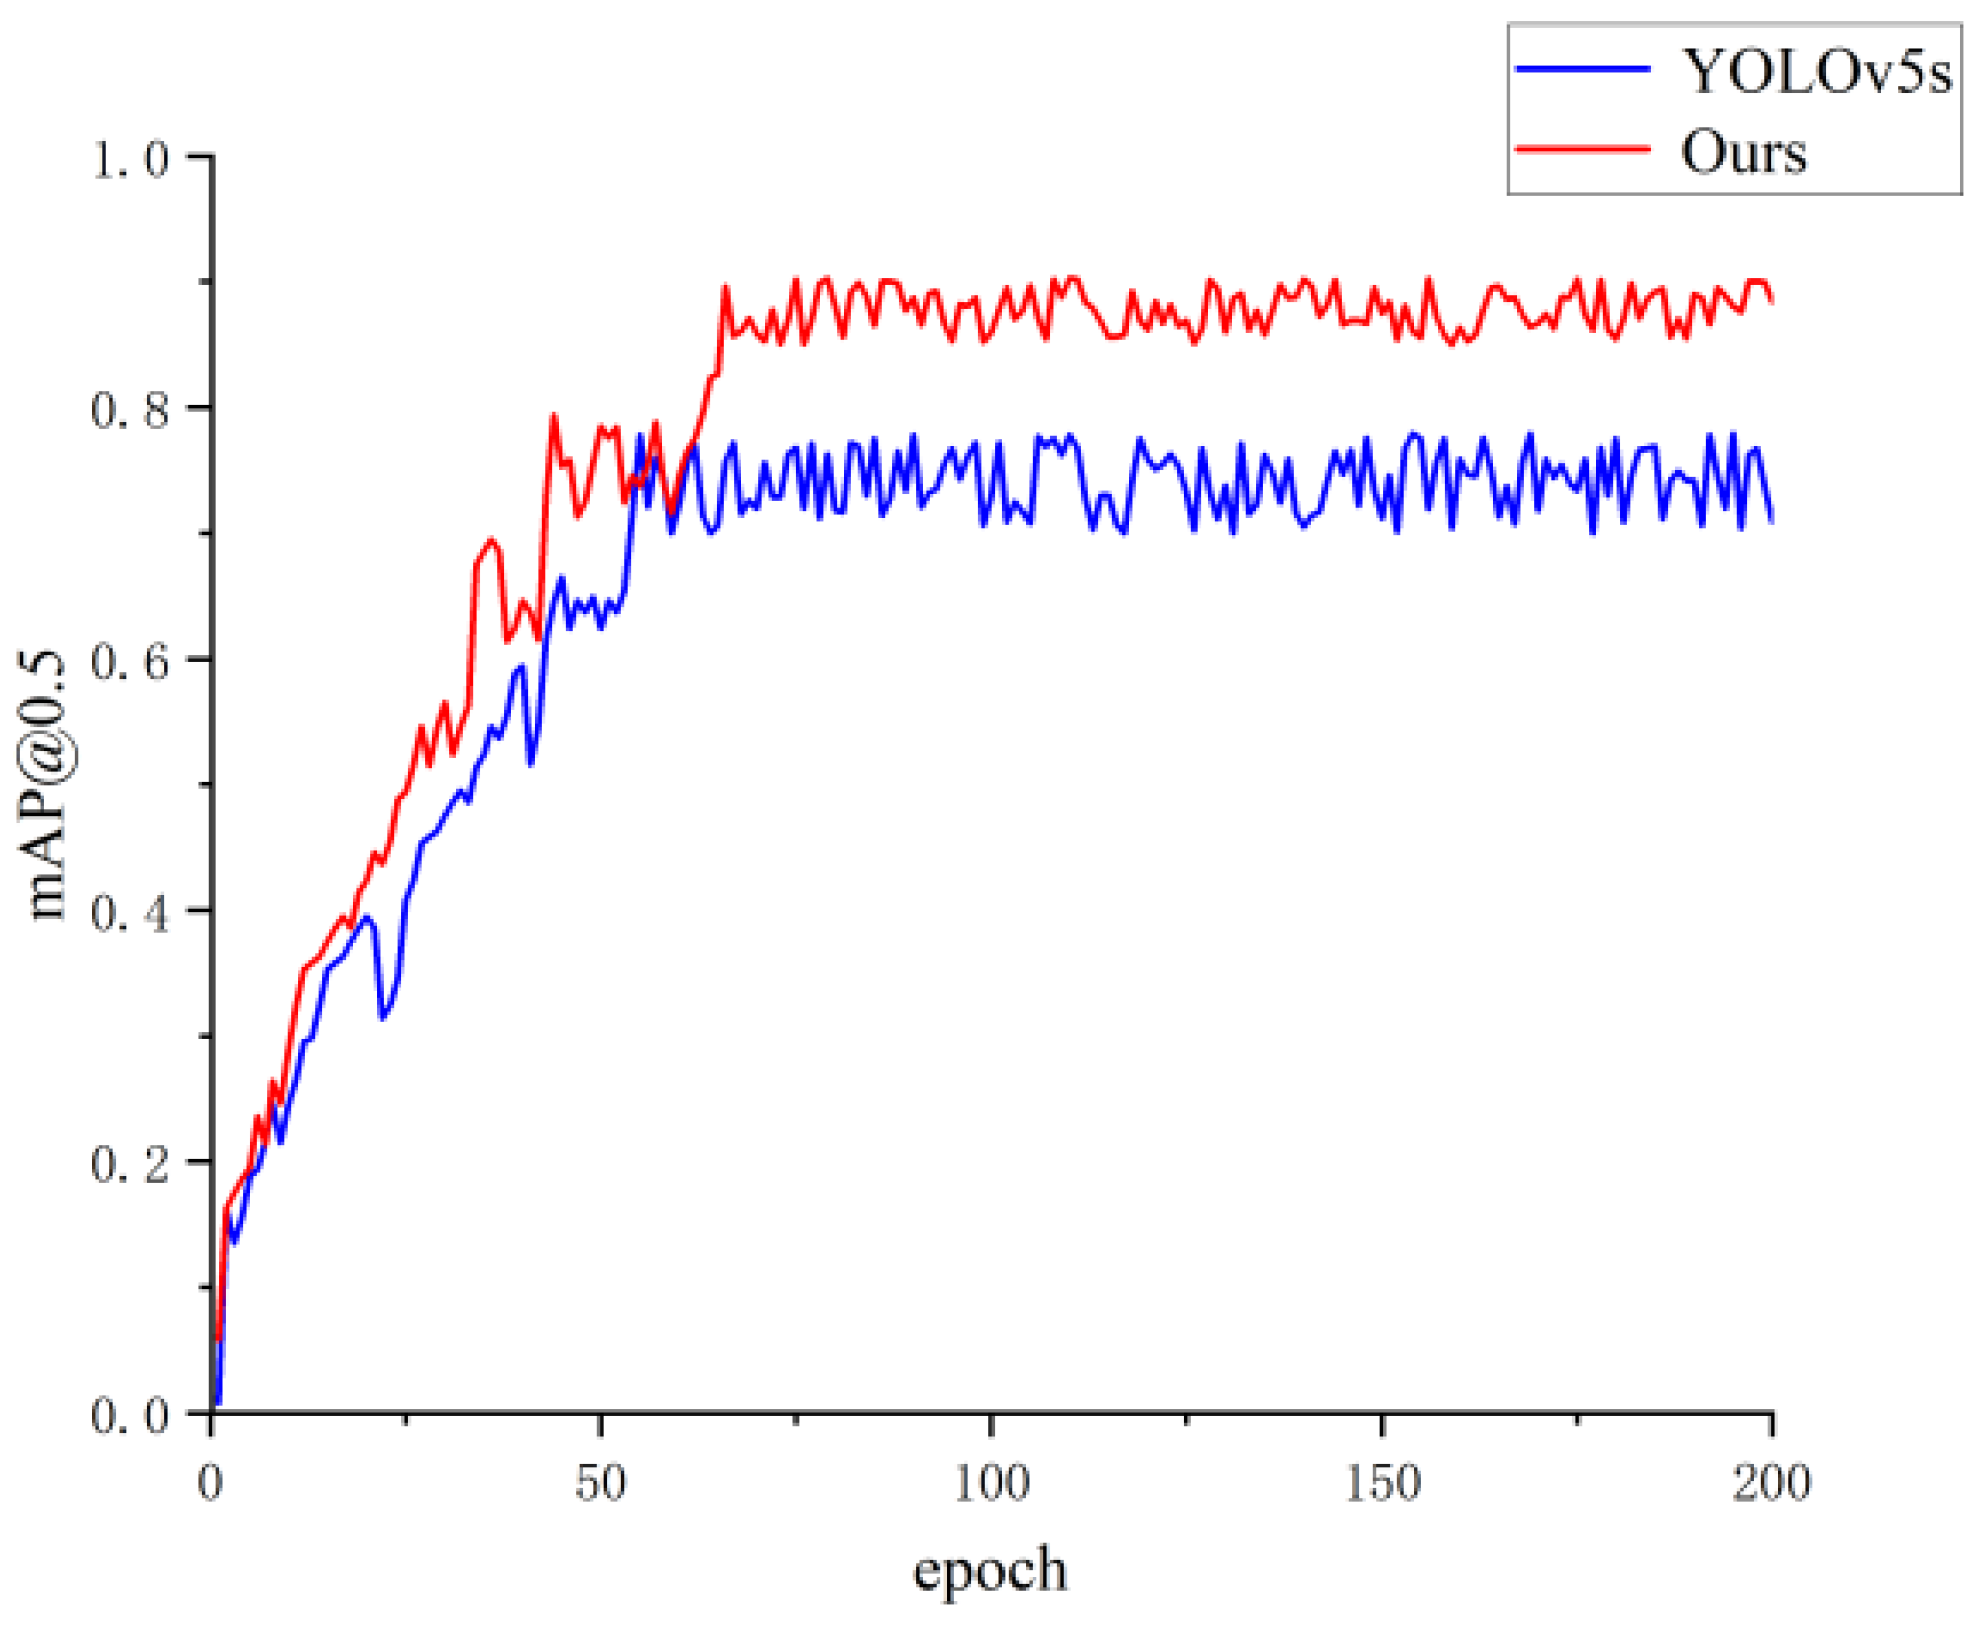
In the case of setting the same training parameters, the improved YOLOv5s defect detection model and the original YOLOv5s model were trained for 200 rounds. The training results were saved once after each round of training, resulting in 200 saved training results. The obtained mAP change curve is shown in
Figure 8 (the red curve represents the improved model, and the blue curve represents the original model). It can be seen from
Figure 8 illustrates that the mAP value of the improved detection model is greatly improved compared with the original YOLOv5 model. The final mAP value is the best mAP value in 200 rounds of training.
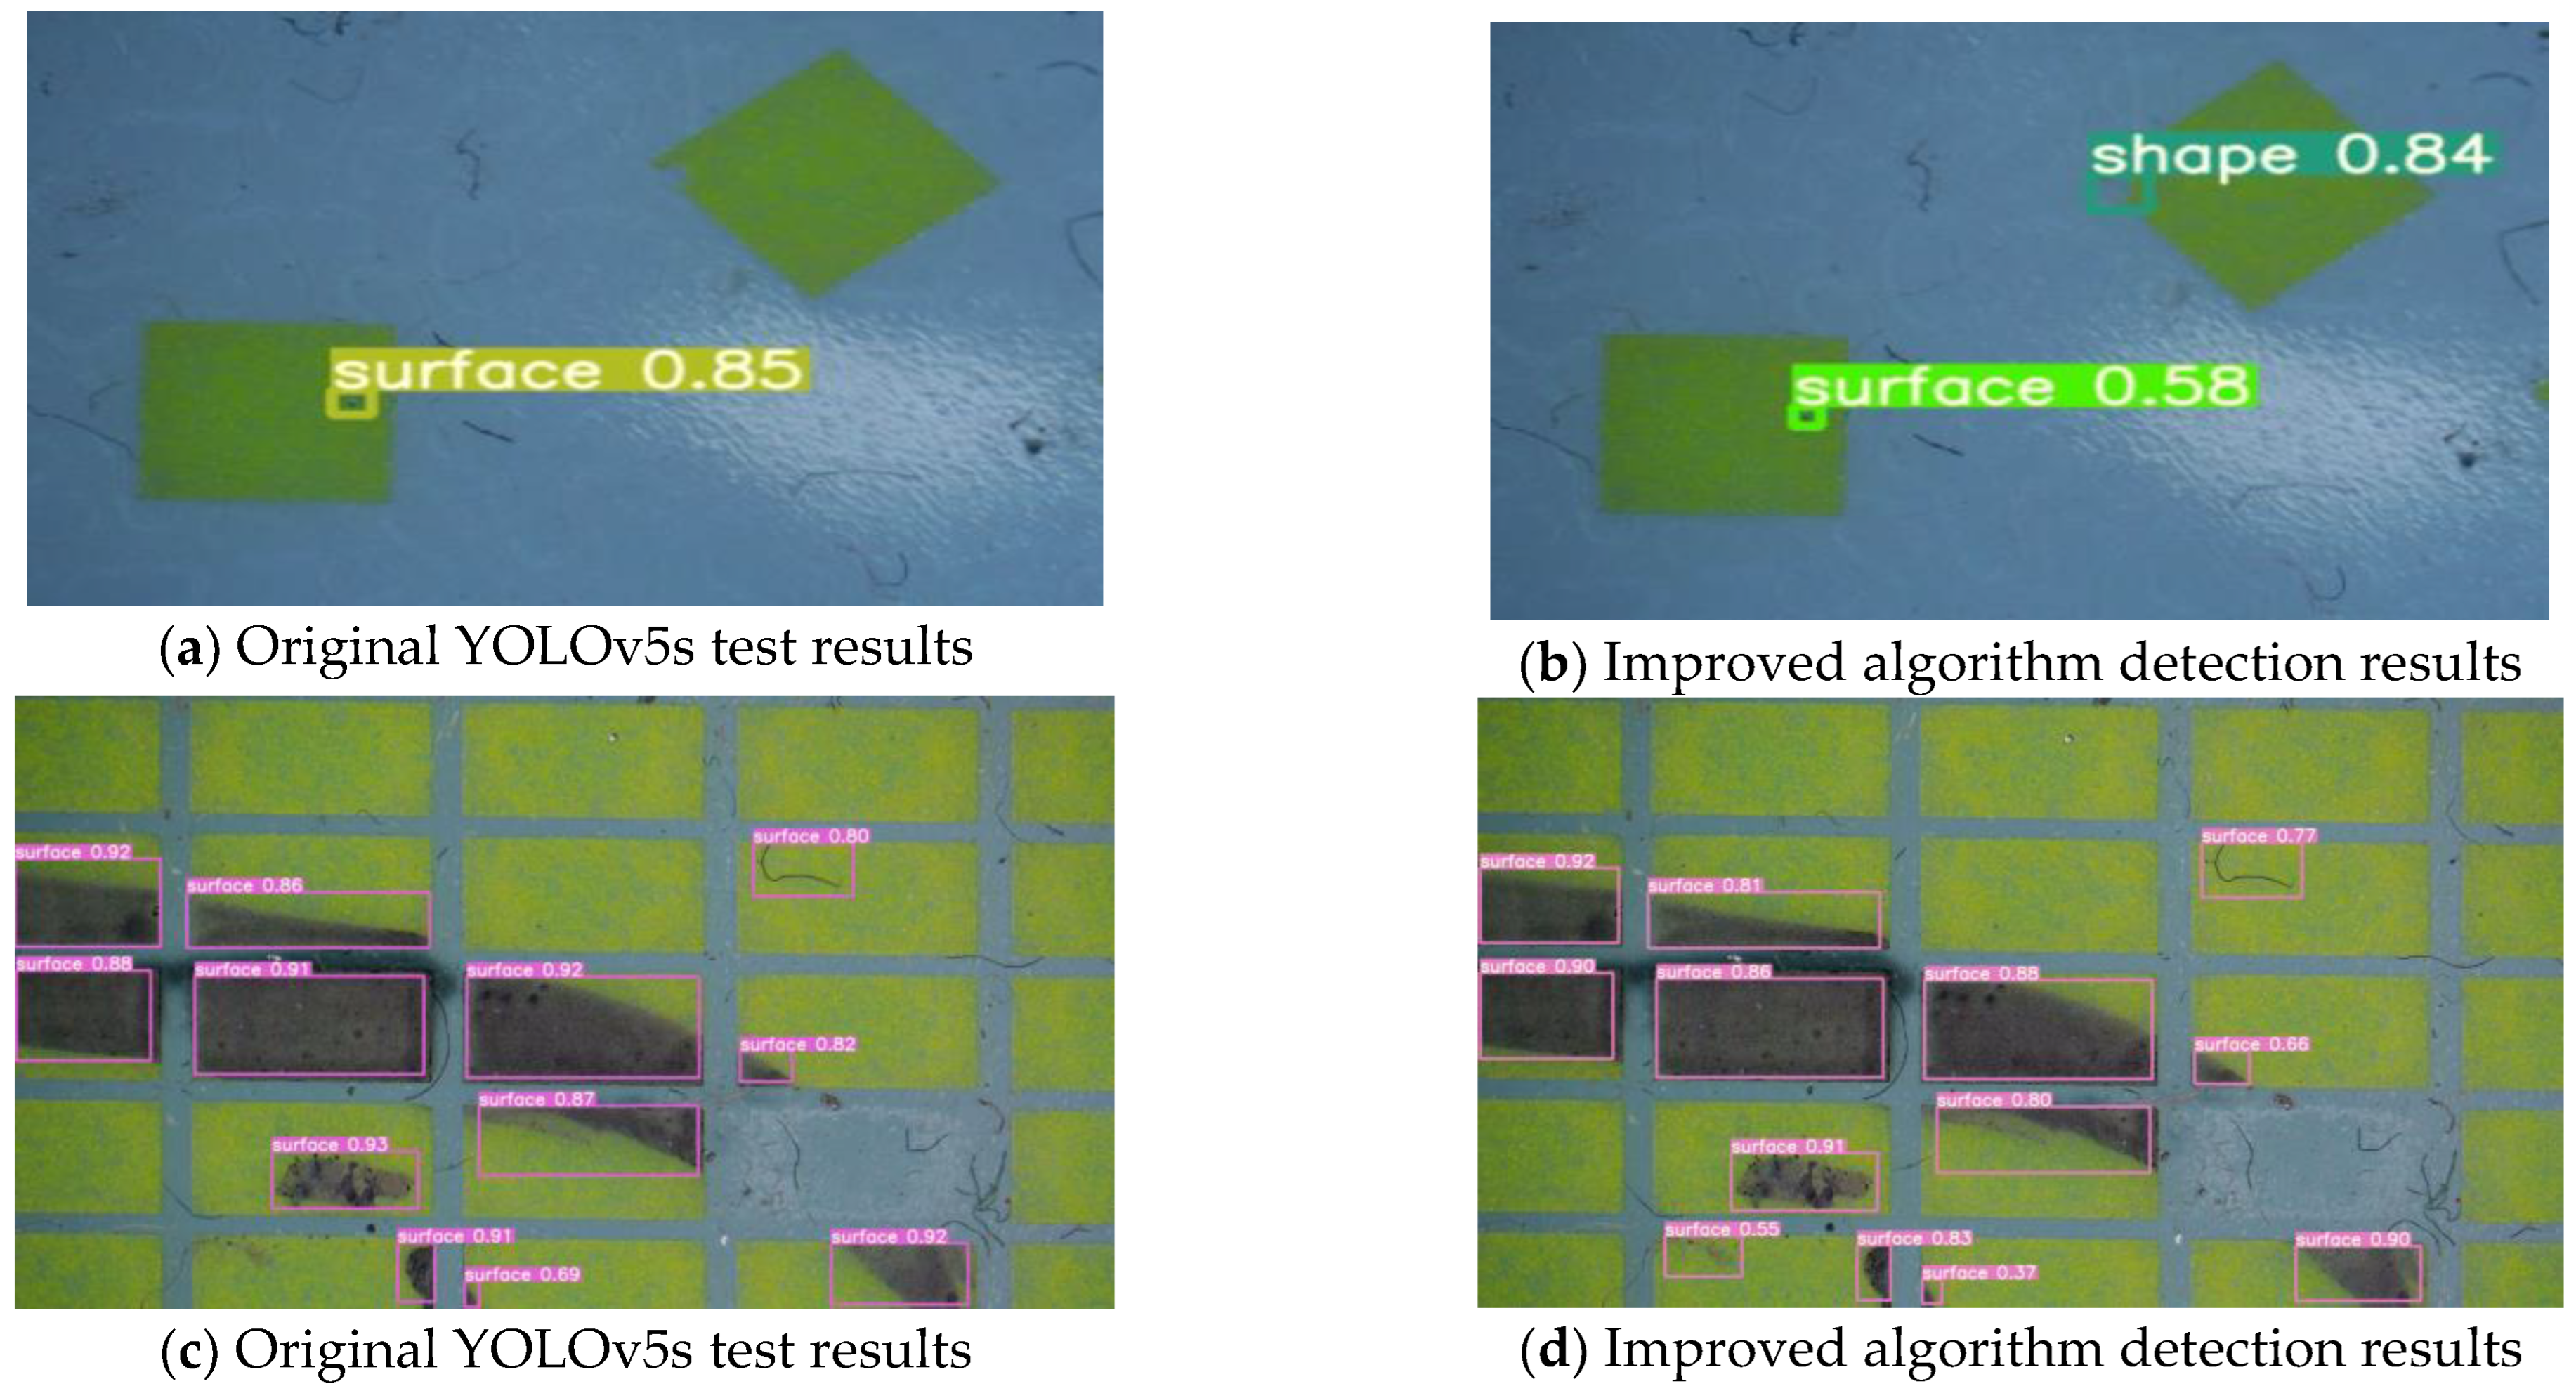
In order to verify the performance of the algorithm in practical applications, both the algorithm and the original YOLOv5s algorithm are used to detect the defects in the captured images. The detection results are shown in
Figure 9.
It can be seen from the processing results in
Figure 9 that in the first group of pictures, the PiG materials are disorderly arranged, and both algorithms detect the fluorescent bodies with surface damage. However, the original algorithm misses the detection of fluorescent bodies with shape defects, while the improved algorithm is more in line with the actual size of the defects. In the second group of images, for the pollution that is not obvious in the lower left corner, the original algorithm has missed detection. On the other hand, the improved algorithm enhances the detection of small target defects and less obvious target defects. Despite the differences in the two scene targets, the improved algorithm exhibits strong robustness.
In order to further verify the performance of the model in the same type of algorithm, the popular single-stage algorithm and the two-stage algorithm in the field of the deep learning are used to detect defects in the same dataset under the same parameters. The detection results are compared with the results of the improved algorithm. The comparison algorithms include the classical Faster-RCNN, SSD algorithm, YOLOv3, YOLOv5 and lightweight algorithms such as YOLOv4-tiny and YOLOv5-mobileNet. The comparison results are shown in
Table 3.
It can be seen from
Table 3 that the improved YOLOv5 algorithm is obviously superior to other algorithms in detection accuracy. Compared with the lightweight algorithms YOLOv4-tiny and YOLOv5-mobileNet with faster detection speed, mAP is 14.71% and 19.42% higher, respectively. For the defect detection of PiG, the improved YOLOv5 algorithm is superior to other models in comprehensive performance and meets the actual industrial production needs. compared to YOLOv7s, the improved algorithm achieves nearly the same mAP but with a slight increase in FPS, making it more suitable for the current dataset.
4. Discussion
In this chapter, the original algorithm has been improved in three aspects.
Firstly, by adding CA coordinate attention mechanism, the detection accuracy of small defects in fluorophore is enhanced. Secondly, the introduction of weights in the BiFPN feature fusion process optimizes the fusion of feature maps from different scales, reducing the loss of feature information in the convolution process, and improving the detection accuracy. Lastly, by introducing the EIOU_Loss function, the model is more focused on the influence of the prediction box with higher coincidence degree, and the accuracy of defect detection is improved again.
5. Conclusions
This paper proposes a defect method for YOLOv5s fluorescent ceramic glass material, focusing on enhancing loss functions and spatial attention mechanisms. By adding the spatial attention mechanism module CA, the detection layer obtains more semantic information and location information. By improving the feature fusion network BiFPN to optimize the feature fusion effect, the loss of feature information in the convolution process is reduced and the detection accuracy is improved. By replacing the loss function, the loss converges faster, and the model training time is reduced. The experimental results show that compared with the original YOLOv5s algorithm, the improved algorithm improves mAP by 12.35%, and the improvement effect is extremely obvious. Additionally, the algorithm exhibits enhanced performance in detecting small targets and demonstrates robustness in complex scene recognition.


