Article

Design of Generalized Enhanced Static Segment Multiplier with Minimum Mean Square Error for Uniform and Nonuniform Input Distributions

Department of Electrical Engineering and Information Technology, University of Naples Federico II, 80125 Naples, Italy
*
Author to whom correspondence should be addressed.
Electronics 2023, 12(2), 446; https://doi.org/10.3390/electronics12020446
Submission received: 20 December 2022 / Revised: 10 January 2023 / Accepted: 12 January 2023 / Published: 15 January 2023
(This article belongs to the Special Issue Feature Papers in Circuit and Signal Processing)

Abstract

:
In this paper, we analyze the performances of an Enhanced Static Segment Multiplier (ESSM) when the inputs have both uniform and non-uniform distribution. The enhanced segmentation divides the multiplicands into a lower, a middle, and an upper segment. While the middle segment is placed at the center of the inputs in other implementations, we seek the optimal position able to minimize the approximation error. To this aim, two design parameters are exploited: m, defining the size and the accuracy of the multiplier, and q, defining the position of the middle segment for further accuracy tuning. A hardware implementation is proposed for our generalized ESSM (gESSM), and an analytical model is described, able to find m and q which minimize the mean square approximation error. With uniform inputs, the error slightly improves by increasing q, whereas a large error decrease is observed by properly choosing q when the inputs are half-normal (with a NoEB up to 18.5 bits for a 16-bit multiplier). Implementation results in 28 nm CMOS technology are also satisfactory, with area and power reductions up to 71% and 83%. We report image and audio processing applications, showing that gESSM is a suitable candidate in applications with non-uniform inputs.

1. Introduction

The reduction of power consumption in DSP algorithms is a primary concern for the feasible realization of electronic systems and calls for the adoption of suitable design strategies. Convolution, dot product, and correlation are well diffused operations in applications ranging from telecommunication to image and audio processing, and make the design critical due to the extensive employment of adders and multipliers. As an example, IoT and mobile devices, which implement deep learning and machine learning algorithms, demand quantization techniques, down-sampling, and arithmetic approximations to reduce the hardware complexity [1,2,3]. In telecommunication, the suppression of noise in transceivers, necessary for improving the receiver sensitivity, requires cancellation methods based on adaptive filtering [4,5,6]. The huge number of multipliers, used for adaptation, increases the power consumption and demands specific techniques aimed to reduce area and power while preserving the quality of results [7,8,9,10,11]. Low-power designs are also required for audio applications [12] in which banks of filters realize operations as equalization and denoising.
Since multipliers are responsible for large power consumption in DSP algorithms, hardware-efficient designs are required for achieving acceptable performances. As the nature of many DSP algorithms is error tolerant (as adaptive filtering or image and audio processing), the Approximate Computing paradigm constitutes a valuable means of improving the hardware performances of multipliers, providing a way to approximate the design at the cost of a tolerable accuracy loss. Approximations can be introduced in the partial product generation stage, in the partial product matrix (PPM) compression step, or in the final carry propagate adder of the multiplier. Since the PPM compression stage is rich in half-adders and full-adders, the approximation of the compression circuit can lead to a significant hardware improvement. In [13], the authors involve AND and OR gates to merge the partial product generation stage with the compression step, while [14] deletes some rows from the PPM at design time. In [15] a recursive approach is proposed, in which the multiplier is decomposed into small approximate units. The paper [16] shows a compression scheme in which OR gates substitute half-adders and full-adders, whereas [17] improves this technique by compensating the mean approximation error. In [18], fast counters encode the partial products by following a stacking approach, whereas the works [19,20,21,22,23,24] analyze multipliers with approximate 4–2 compressors. In these papers, the full-adders required for the realization of the exact compressor are substituted by simple logic at the cost of an error in the computation, and the carry chain between compressors is broken in order to optimize the critical path and to moderate the glitch propagation. In [20], the authors propose three compressors with different levels of accuracy, while [21] designs an error recovery module to improve the quality of results. The paper [22] shows a statistical approach for ordering the partial products in approximate 4–2 compressors, and analyzes the performances when different compressors are employed in the same multiplier. In [23], compressors with positive and negative mean error are interleaved in order to minimize the approximation effects, whereas [24] prefers NAND and NOR gates to AND and OR gates for achieving high speed performances.
The fixed-width technique is a further approach able to reduce the power, providing a way to discard some columns of the PPM [25,26]. In this case, properly weighing the partial products in the truncated PPM reduces the approximation error of the multiplier [26].
Different from the previous works, the segmentation method reduces the bit-width of the multiplicands with the aim to downsize the multiplier. The papers [27,28] describe a dynamic segment method (DSM) in which the segment is selected starting from the leading one bit of the multiplicand. While [27] adds a ‘1’ bit at the least significant position of the segment for accuracy recovery, ref. [28] revises the multiplication as a multiply-and-add operation and applies operand truncation for further simplification. On the contrary, the paper [29] proposes a static segment method (SSM), which reduces the complexity of the selection mechanism by choosing between two fixed m-bit segments, with n/2 ≤ m < n and n that is the number of bits of the inputs. At the same time, an Enhanced SSM multiplier (ESSM) is also proposed in [29], which allows for selecting between three fixed portions of the inputs: the m most significant bits (MSBs), the m least significant bits (LSBs), and the m central bits of the inputs. The paper [30] improves the accuracy of the SSM multipliers by reducing the maximum approximation error, whereas in [31] the authors propose a hybrid approach in which a static stage is cascaded to a dynamic stage. In these cases, error metric results reveal satisfactory accuracy when the inputs have uniform distribution, along with acceptable power improvements with respect to the exact and the DSM multipliers. At the same time, these works do not offer an analysis with non-uniform distributed input signals; in addition, the work [29] does not show a detailed analysis of the hardware implementation of the ESSM multiplier.
In this paper, we analyze the performances of the ESSM multiplier as a function of the input stochastic distribution and propose a novel implementation able to minimize the mean square approximation error. Indeed, the statistical properties of a signal affect the probability of assuming values in a range, giving high probability ranges and low probability ranges. Starting from this observation, our idea is to properly place the central segment (named middle segment in the following) in order to minimize the segmentation error in the high probability ranges. To this aim, two design parameters are exploited: m, which defines the size of the multiplier, and q, which defines the position of the middle segment. For the error analysis, we consider inputs with uniform and non-uniform distribution, taking into consideration half-normal signals for demonstration in this last case, and also describe an analytical model able to find the optimal position qopt that minimizes the multiplier error in a mean square sense.
Simulation results match with the theoretical analysis, exhibiting accuracy performances dependent on the input stochastic distribution and on the choice of m and q. Best error metrics are achieved with the middle segment placed toward the MSBs if the inputs are uniform, and with middle segment placed at the center of the inputs if the distribution is half-normal. Electrical analyses also show remarkable hardware improvements if compared with the exact multiplier, whereas only an acceptable degradation is registered with respect to the SSM multipliers. Assessments of image and audio processing applications confirm these trends, showing performances that depend on the position of the middle segment.
The paper is organized as follows: Section 2 shows the static segment method, also describing the correction technique of [30] and the enhanced segmentation presented in [29]. Then, Section 3 describes the hardware structure of the proposed gESSM, along with the analytical model used to minimize the mean square value of the approximation error. Section 4 shows the results in terms of error metrics, electrical performances, and applications in image and audio processing. A comparison with the state-of-the-art is also proposed. Section 5 further compares the multipliers finding the pareto-optimal implementations, and Section 6 concludes the paper.

2. Static Segment Method

2.1. Static Segment Multiplier and Correction Technique

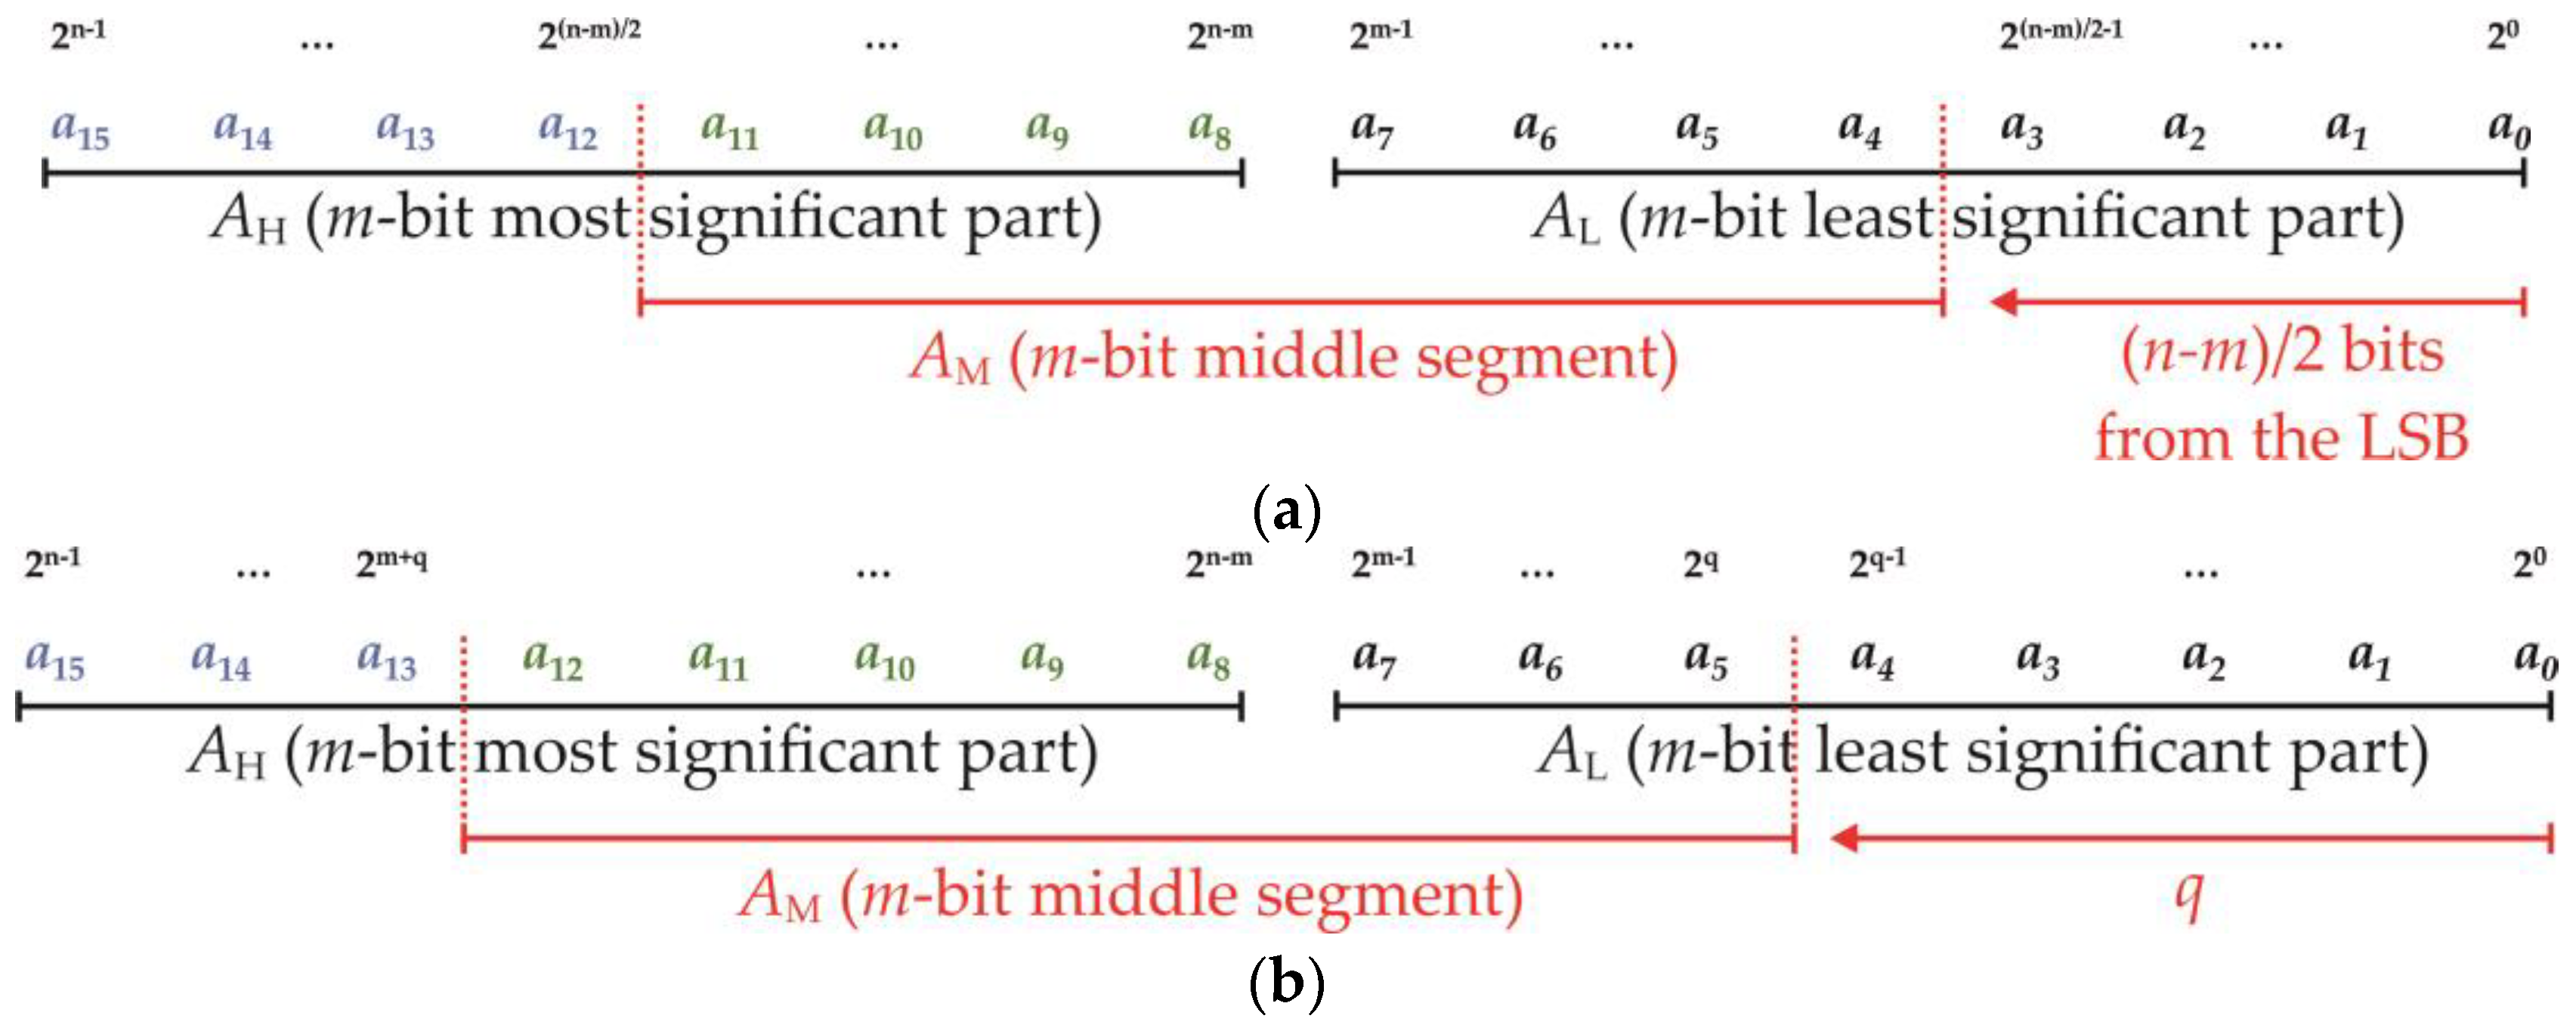
The SSM technique shown in [29] provides for selecting m-bit segments from the multiplicands, with n/2 ≤ m < n, in order to employ a smaller m × m multiplier instead of a nxn multiplier. As shown in Figure 1 for the unsigned signal A, if the nm MSBs (i.e., a15, a14, ..., a10) are low the least significant m bits of the input are chosen, forming the segment AL. On the contrary, if any bit of the n-m MSBs is high the most significant m bits are selected, forming the segment AH. It is worth noting that the segmentation introduces an error when AH is chosen since the bits belonging to eA are truncated (i.e., a5, a4, …, a0 in Figure 1). In addition, m is the only parameter able to define the accuracy and the size of the multiplier.
Then, defining αA as the OR between the nm MSBs of A, the segmented input Assm is
A s s m = { A L   i f   α A = 0 A H   i f   α A = 1
A similar expression holds also for the input B and the corresponding segment Bssm.
Then, the segmented multiplication is
γ s s m = ( A s s m · 2 S H a , s s m ) · ( B s s m · 2 S H b , s s m ) = ( A s s m · B s s m ) · 2 S H s s m
with SHa,ssm, SHb,ssm that are
S H a , s s m = { 0                           i f   α A = 0 n m       i f   α A = 1 S H b , s s m = { 0                           i f   α B = 0 n m       i f   α B = 1
and SH = SHa,ssm + SHb,ssm, defining the left-shift used to express the result on 2·n bits:
S H s s m = { 0                                                                                         i f   α A = 0   ,   α B = 0 n m         i f   α A = 0   ,   α B = 1   o r   i f   α A = 1   ,   α B = 0 2 · ( n m )                                                             i f   α A = 1   ,   α B = 1
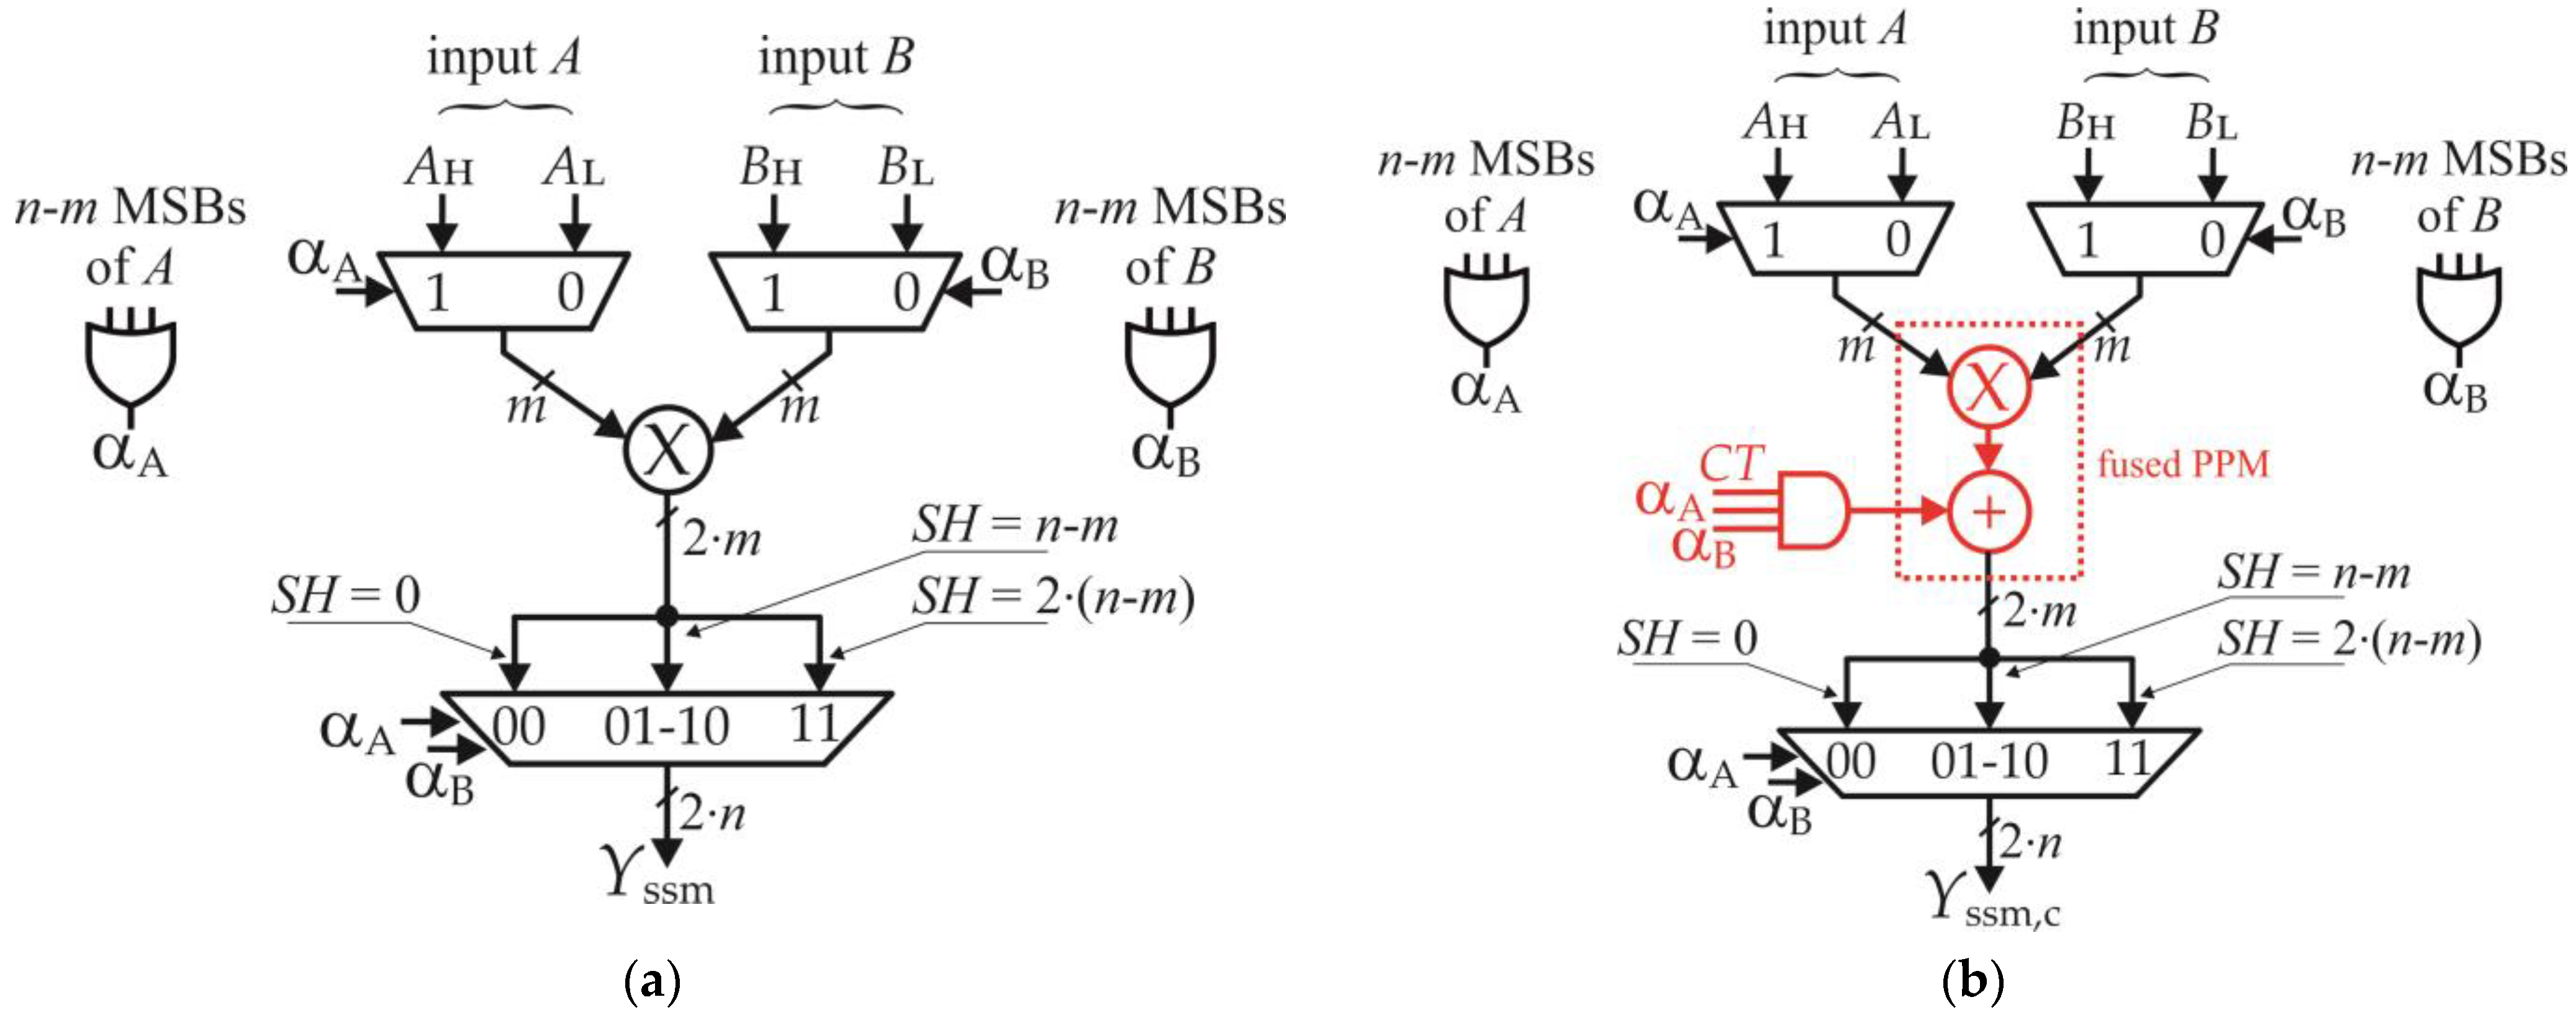
Figure 2a depicts the hardware implementation of the SSM multiplier. The multiplexers on A and B apply the segmentation choosing between the most significant and least significant portions of the inputs, whereas two OR gates compute the selection flags αA and αB. After the m × m multiplier, a further multiplexer realizes the left-shift described in (4).
The accuracy of the SSM multiplier is improved in [30] by minimizing the approximation error in the case αA = 1, αB = 1 (i.e., when both inputs are truncated). Here, the authors estimate the committed error as
C T = 2 2 n 2 m · k = 0 m 1 c t k 2 k
with
C t k = ( a k + n m b n m 1 ) O R ( b k + n m a n m 1 )
and add CT to the approximate product for compensation:
γ s s m , c = ( A s s m · B s s m + C T ) · 2 S H
As detailed in [30], using two or three terms of the summation (5) sufficiently improves the accuracy.
Figure 2b shows the implementation of the corrected SSM multiplier (named cSSM in the following). The correction term CT is combined with the product Assm·Bssm if αA = 1 and αB = 1 (see the AND gate highlighted in red). It is also worth noting that the correction technique has a minimum impact on the hardware performances since a fused PPM is employed for realizing the (7).

2.2. Enhanced SSM Multiplier

The ESSM multiplier described in [29] allows for selecting between three segments of the input, each one having m bits (see Figure 3a). In this implementation, the middle segment AM is placed at the center of the signal (i.e., (nm)/2 bits on the left with respect to the LSB, see the figure). As the position of AM is fixed, m is again the only design parameter which defines the accuracy and the size of the multiplier.
In this case, two control flags are required for the selection, named αAH and αAM in the following. Therefore, defining αAH as the OR of the first (nm)/2 MSBs of A (i.e., a15, a14, …, a12, highlighted in blue in Figure 3a), and αAM as the OR of the remaining (nm)/2 MSBs (i.e., a11, a10, …, a8, highlighted in green in Figure 3a), the segment Aessm is computed as
A e s s m = { A L                                   i f   ( α A H , α A M ) = ( 0 , 0 ) A M                                 i f   ( α A H , α A M ) = ( 0 , 1 ) A H i f   ( α A H , α A M ) = ( 1 , 0 )   o r   ( 1 , 1 )
A similar expression holds also for the segment Bessm, with the flags αBH, αBM that handle the segmentation.
Therefore, the approximate product is
γ e s s m = ( A e s s m · 2 S H a , e s s m ) · ( B e s s m · 2 S H b , e s s m ) = ( A e s s m · B e s s m ) · 2 S H e s s m
with SHa,essm, SHb,essm that are
S H a , e s s m = { 0 i f ( α A H , α A M ) = ( 0 , 0 ) ( n m ) / 2 i f ( α A H , α A M ) = ( 0 , 1 ) n m i f ( α A H , α A M ) = ( 1 , 0 )   o r   ( 1 , 1 ) S H b , e s s m = { 0 i f ( α B H , α B M ) = ( 0 , 0 ) ( n m ) / 2 i f ( α B H , α B M ) = ( 0 , 1 ) n m i f ( α B H , α B M ) = ( 1 , 0 )   o r   ( 1 , 1 )
and SHessm defined in Table 1.
As shown in the table, the left-shift SHessm ranges between five possible values, thus requiring a 5 × 1 multiplexer to extend the result on 2·n bits.

3. Proposed Generalized ESSM Multiplier

3.1. Hardware Implementation

With the aim to improve the accuracy of the multiplier presented in the previous section, we generalize the ESSM method by placing AM in any possible position between the LSB and the MSB. With reference to Figure 3a, let us suppose A to be in the range [212, 213) with high probability, which means that the bit a12 is high and the bits a15, a14, a13 are low with high probability. The segmentation scheme of Figure 3a mostly chooses the segment AH, approximating the input with resolution 28, whereas AM, able to offer a finer accuracy, is less used. In order to improve the performances, we can choose a segmentation scheme as in Figure 3b, allocating the middle segment in order to collect the bits a12, a11, …, a5. In this way, the selection mechanism mostly chooses AM allowing a finer resolution (that is 25 instead of 28) with beneficial effects on the overall accuracy. As a consequence, choosing the position of AM in dependance on the input statistical properties allows us to optimize the accuracy of the multiplier.
As shown in Figure 3b, the parameter q defines the position of AM with respect the LSB of the input (in this example q = 5). Therefore, two parameters are used for the design: m, which defines the accuracy and the size of the multiplier, and q, which improves the accuracy of the segmentation. Please note also that q defines the resolution of AM, which is 2q (see Figure 3b).
By noting that AM and AL overlap if q = 0, and that AM and AH overlap if q = nm, we choose q in the range [1, nm – 1] to select three distinct segments. In addition, if q = (nm)/2 we get the ESSM multiplier presented in [29].
The selection flag αAH is computed by OR-ing the first n – (m + q) MSBs of A (i.e., a15, a14, a13 in Figure 3b, depicted in blue), whereas αAM is computed by OR-ing the remaining q MSBs (i.e., a12, a11, …, a8 in Figure 3b, depicted in green). Then, the segmented inputs Aessm, Bessm are computed as in (8), with the following expressions for SHa,essm, SHb,ssm:
S H a , e s s m = { 0   i f   ( α A H , α A M ) = ( 0 , 0 ) q i f   ( α A H , α A M ) = ( 0 , 1 ) n m i f   ( α A H , α A M ) = ( 1 , 0 )   o r   ( 1 , 1 ) S H b , e s s m = { 0       i f   ( α B H , α B M ) = ( 0 , 0 ) q i f   ( α B H , α B M ) = ( 0 , 1 ) n m i f   ( α B H , α B M ) = ( 1 , 0 )   o r   ( 1 , 1 )
Likewise, the approximate product is computed as in (9) with the final left-shift SHessm defined in Table 2. Now, SHessm ranges between six possible values, thus calling for a 6 × 1 multiplexing scheme.
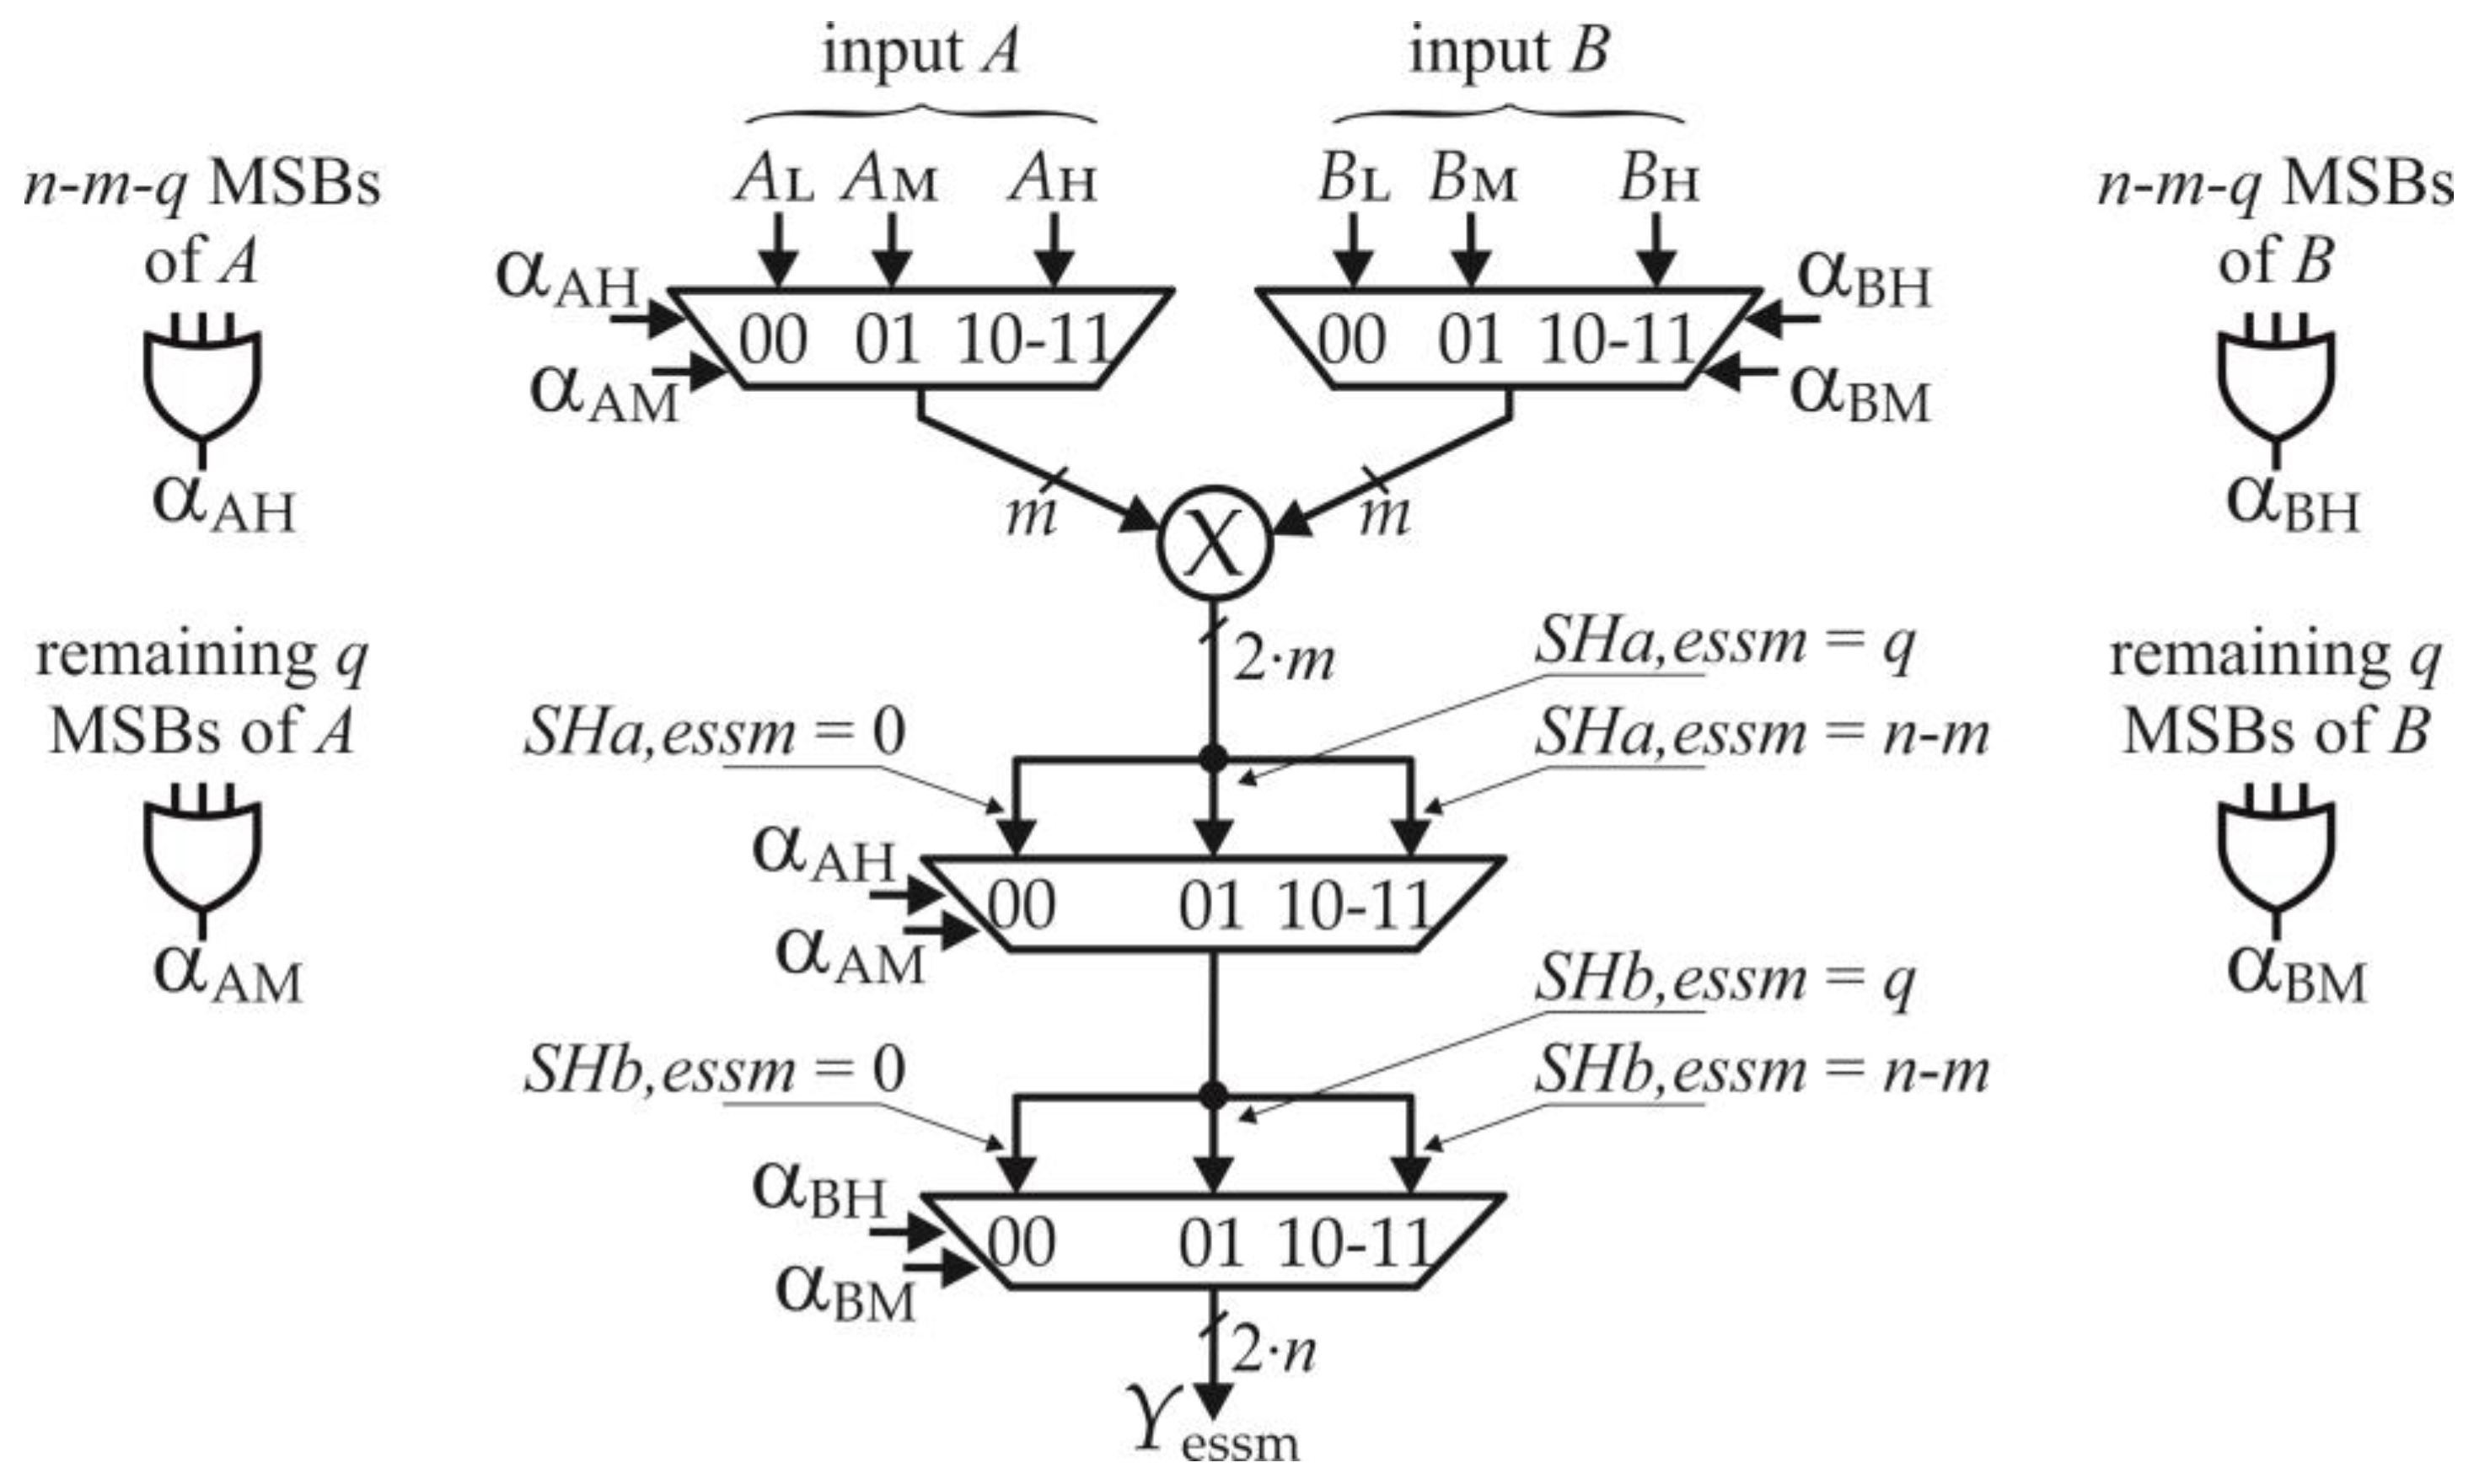
Figure 4 depicts the hardware implementation of the generalized ESSM multiplier (named gESSM in the following). The 3 × 1 multiplexers allow for selecting between the most significant, the middle, and the least significant part of the inputs, whereas a small m × m multiplier computes the approximate product. The left-shift is realized by cascading two 3 × 1 multiplexers, where the first multiplexer applies the shift SHa,essm due to the flags αAH, αAM, and the second one applies the shift SHb,essm due to αBH, αBM. It is worth noting that this approach prevents the usage of large multiplexers with beneficial effects on the hardware performances of the multiplier.

3.2. Minimization of the Mean Square Approximation Error

In this paragraph, we find m and q in order to minimize the mean square approximation error at the output of the multiplier under the hypothesis of both uniform and non-uniform distributed input signals. In the following, we consider inputs with half-normal distribution in the non-uniform case, whose probability density function is as follows:
f ( A ) = 2 σ π · e A 2 2 σ 2     f o r   A 0
where σ, being the standard deviation of the underlying normal variable, is also related to the standard deviation of A.
Before proceeding, let us assume A and B to be independent, and let us re-write equation (8) as follows with the help of Figure 3b:
A e s s m = { A L i f   A < 2 m A M i f   2 m A < 2 m + q A H i f   2 m + q A < 2 n 1
where the conditions A < 2m, 2mA < 2m+q, and 2m+qA < 2n−1 recall the conditions (αAH, αAM) = 00, (αAH, αAM) = 01 and (αAH, αAM) = 10 or 11, respectively. Defining Aessm = Aessm·2SHa,essm and Bessm = Bessm·2SHb,essm, we can write the exact inputs as follows:
A = A e s s m + e A B = B e s s m + e B
with eA, eB that are the truncation errors due to the segmentation:
e A = { 0 i f   A < 2 m k = 0 q 1 a k 2 k i f   2 m A < 2 m + q k = 0 n m 1 a k 2 k i f   2 m + q A 2 n 1 e B { 0 i f   B < 2 m k = 0 q 1 b k 2 k i f   2 m B < 2 m + q k = 0 n m 1 b k 2 k i f   2 m + q B 2 n 1
In (15) we assume bits ak, bk to be independent from A and B, respectively, and to be uniform random variables with probability ½ of being ‘1’.
Using (14), the exact product is:
γ = A · B = ( A e s s m + e A ) · ( B e s s m + e B )                     = A e s s m · B e s s m + A e s s m · e B + B e s s m · e A + e A · e B
Since the gESSM computes only the term Aessm·Bessm, the segmentation error is:
e e s s m = A e s s m · e B + B e s s m · e A + e A · e B
Re-writing (14) as Aessm = AeA, Bessm = BeB and substituting in (17), we find:
e e s s m = A · e A + B · e B e A · e B
Neglecting the small term eA·eB for the sake of simplicity, we compute the mean square approximation error by squaring (18) and by using the expectation operator:
E [ e e s s m 2 ] = E [ A 2 ] · E [ e B 2 ] + E [ B 2 ] · E [ e A 2 ] + 2 · E [ A · e A ] · E [ A · e B ]
Since A and B have the same distribution, we have E[A2] = E[B2], as well as E[e2A] = E[e2B] and E[A·e2A] = E[B·e2B] for the previous hypothesis. Therefore, Equation (19) becomes
E [ e e s s m 2 ] = 2 · E [ A 2 ] · E [ e A 2 ] + 2 · E [ A · e A ] 2
As the computation of E[A·eA]2 is not straightforward, we can exploit the Cauchy–Schwarz inequality E[A·eA]2E[A2E[e2A] to find the upper limit of E[e2essm]:
E [ e e s s m 2 ] 4 · E [ A 2 ] · E [ e A 2 ]
Here, E[A2] depends on the statistic of the input signal, whereas E[e2A], which is the mean square value of the approximation error committed on A, depends on m and q. Then, as suggested by the above inequalities, minimizing the upper limit (i.e., minimizing E[e2A]) minimizes the overall mean square approximation error of the multiplier.
Starting from (15), we can write E[e2A] as follows:
E [ e A 2 ] = E [ ( k = 0 q 1 a k 2 k ) 2 ] · P ( A M ) + E [ ( k = 0 n m 1 a k 2 k ) 2 ] · P ( A H )
with P(AM) and P(AH) that are the probability of having A in the ranges [2m, 2m+q) and [2m+q, 2n − 1], respectively. Table 3 collets the expressions of P(AM) and P(AH) for the uniform and the half-normal cases, where erf(·) represents the so-called error function (details on the computation are reported in Appendix A for the half-normal case).
We underline that the presence of P(AM) and P(AH) in (22) highlights the relation between the approximation error and the stochastic distribution of the inputs.
Solving the expectations in (22), we find the following expression for E[e2A] (refer to Appendix B for details):
        E [ e A 2 ] = [ 1 6 ( 4 q 1 ) + 1 4 2 1 ( 2 q 1 1 ) 1 6 ( 4 q 1 1 ) ] · P ( A M )                        + [ 1 6 ( 4 n m 1 ) + 1 4 2 n m ( 2 n m 1 1 ) 1 6 ( 4 n m 1 1 ) ] · P ( A H )
with P(AM) and P(AH) that also depend on m and q (see Table 3).
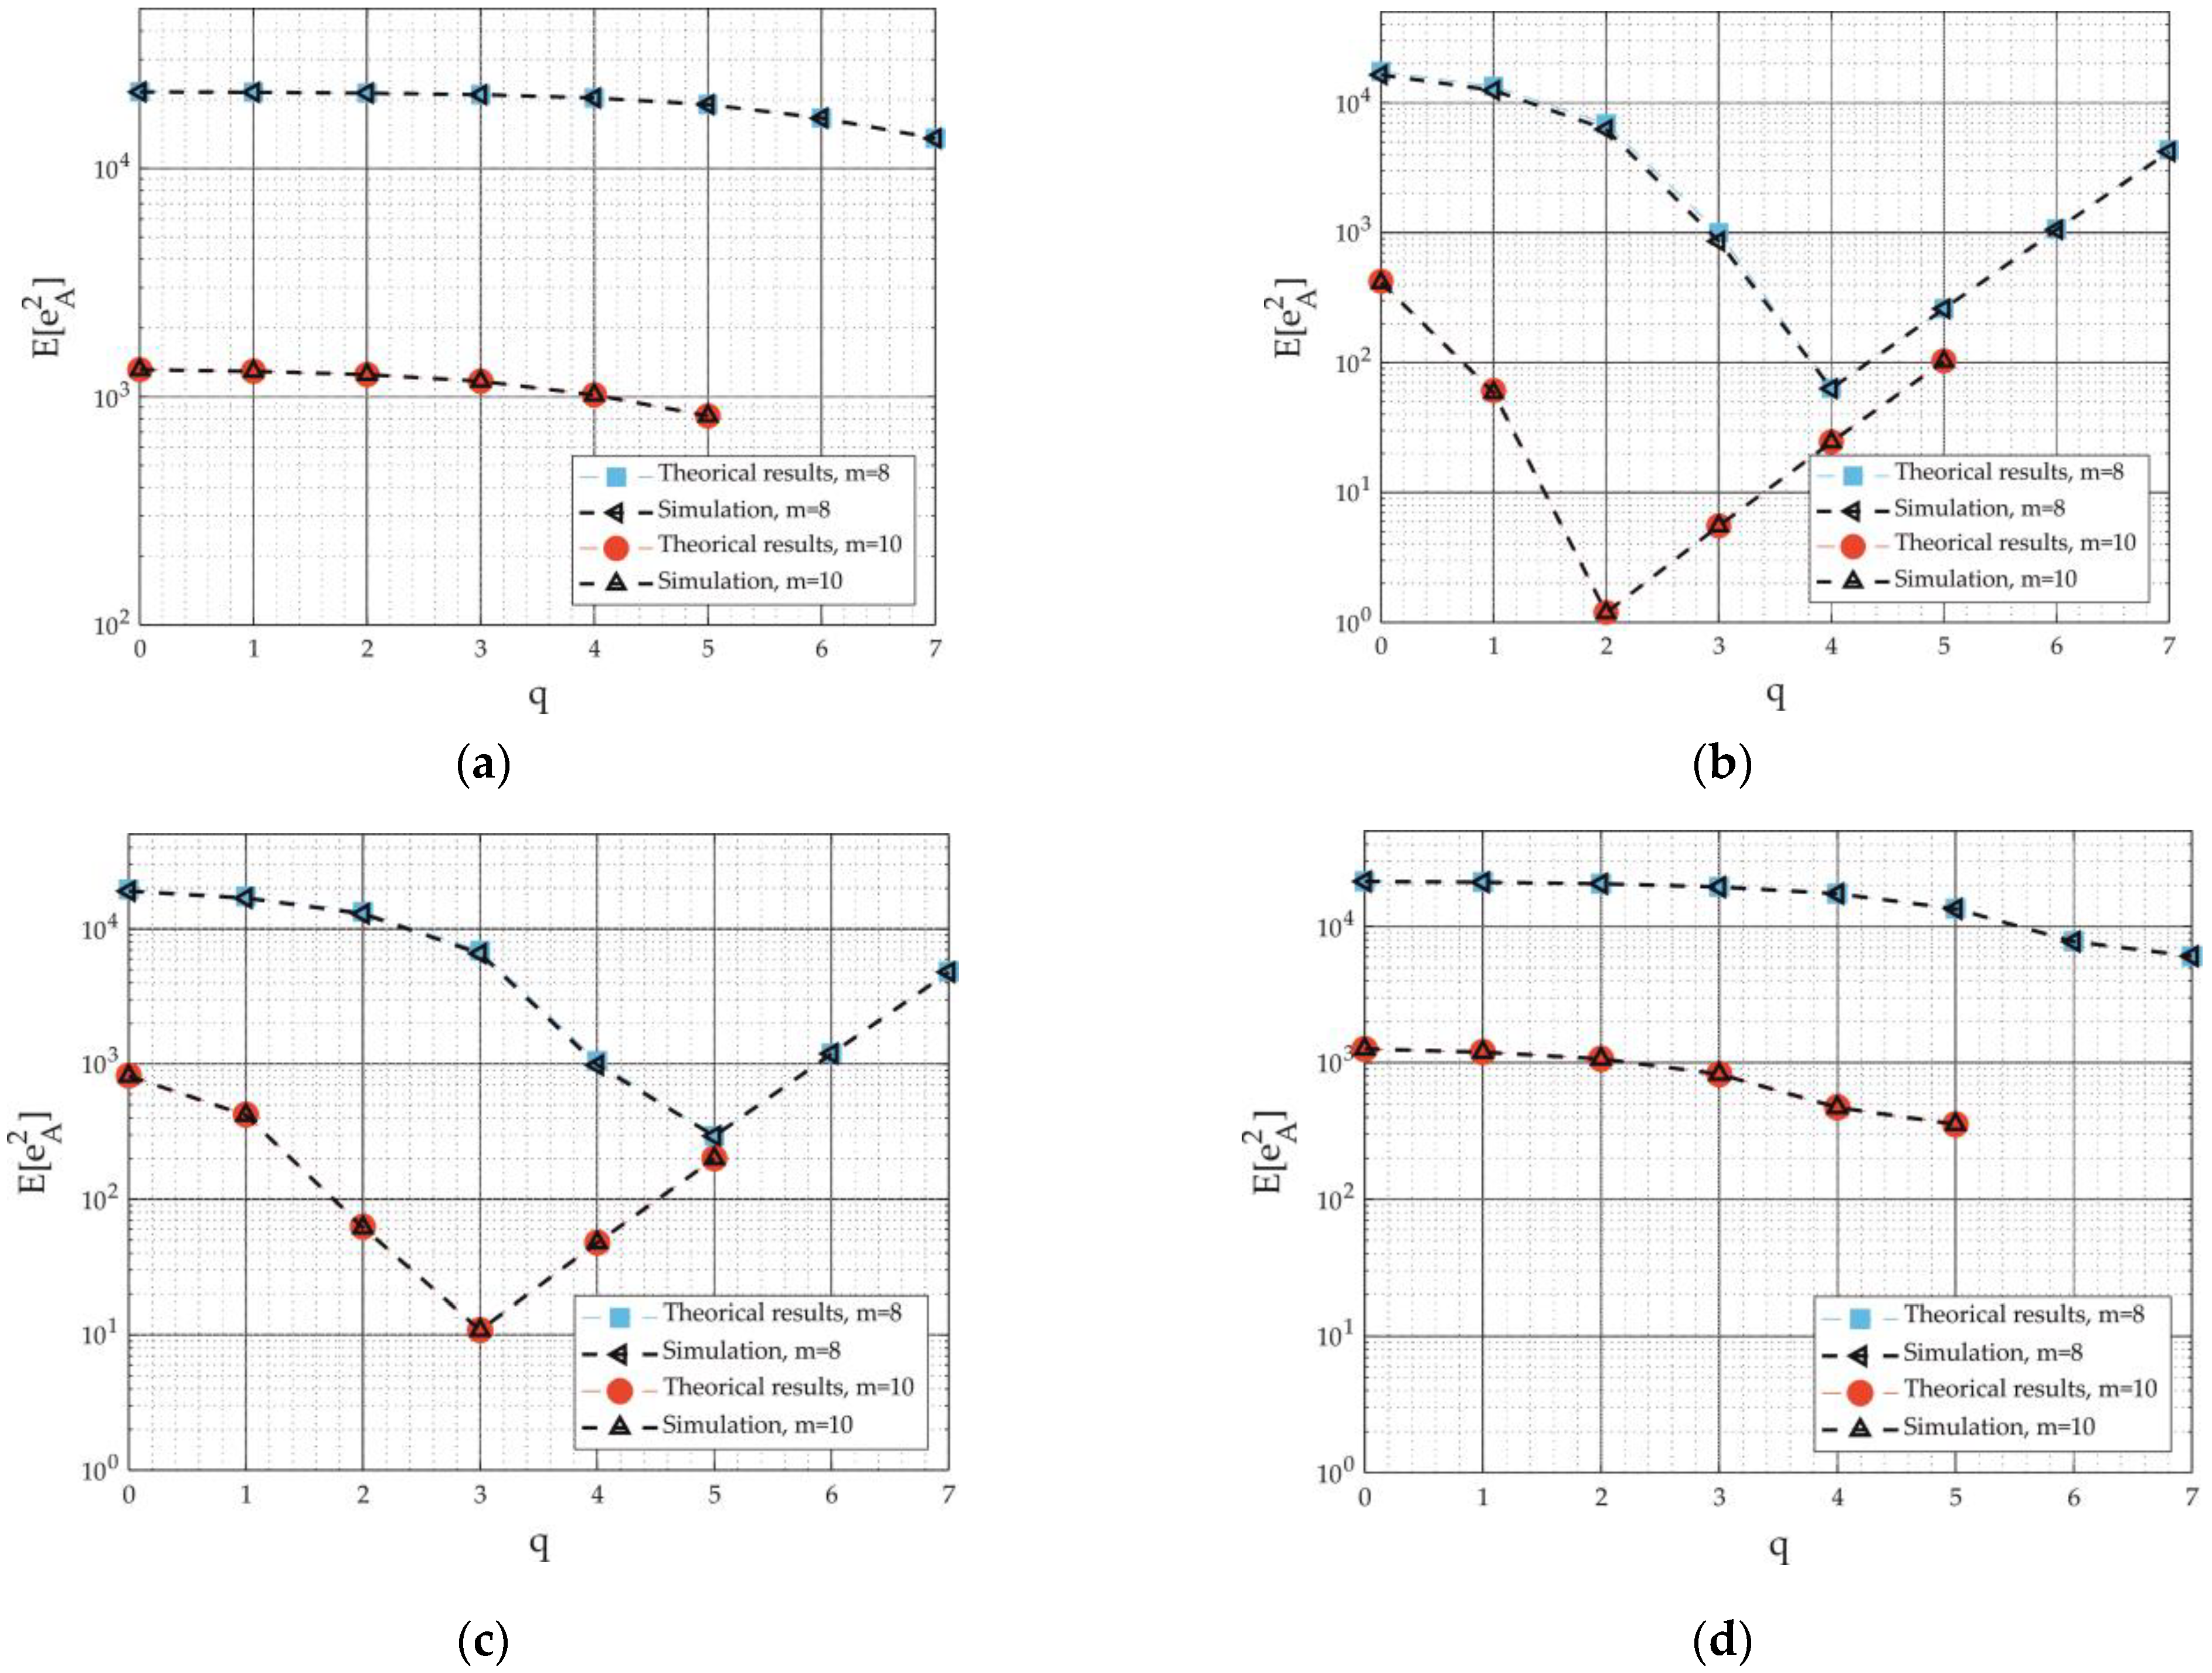
The behavior of E[e2A] with respect to m and q is shown in Figure 5, compared to the simulation results. In this study, the input A is an n = 16 bits integer signal with uniform distribution in Figure 5a, and half-normal distribution with σ = 1024, 2048, and 16,384 in Figure 5b–d. We achieve the simulation results by segmenting 106 input samples of A and by computing the mean square value of the approximation error.
As shown, the theoretical results perfectly match with the simulations. For fixed m, increasing q decreases E[e2A] in the uniform case. Therefore, the optimal point qopt, able to minimize E[e2A], is the maximum value of q (that is qopt = nm − 1). On the other hand, E[e2A] shows minima in Figure 5b,c, with optimal points in qopt = 4, m = 8 and qopt = 2, m = 10 for σ=1024, and qopt = 5, m = 8 and qopt = 3, m = 10 for σ = 2048. When σ becomes large, E[e2A] again decreases with q, making q = nm − 1 the best choice.
In conclusion, a proper selection of q is of paramount importance for optimizing the accuracy of the multiplier, leading to placing the middle segment in any position between the LSB and the MSB of A (in contrast with [29] which always fixes the middle segment at the center of the input). In addition, the statistical properties of the input signals strongly affect the optimal value of q, as demonstrated by the results of Figure 5.

4. Results

4.1. Assessment of Accuracy

We study the accuracy of the gESSM by exploiting the error metrics commonly used in the literature. To this end, let us define the approximation error E = YYapprx and the Error Distance ED = |E|, with Y and Yapprx that are the exact and the approximate product. Naming avg(·) and Ymax the average operator and the maximum value of Y, respectively, with Ymax= (2n − 1)2, we define the Normalized Mean Error Distance as NMED = avg(ED)/Ymax, the Mean Relative Error Distance as avg(ED/Y), and the Number of Effective Bits as NoEB = 2·n − log2(1 − Erms), with Erms being the root mean square value of E.
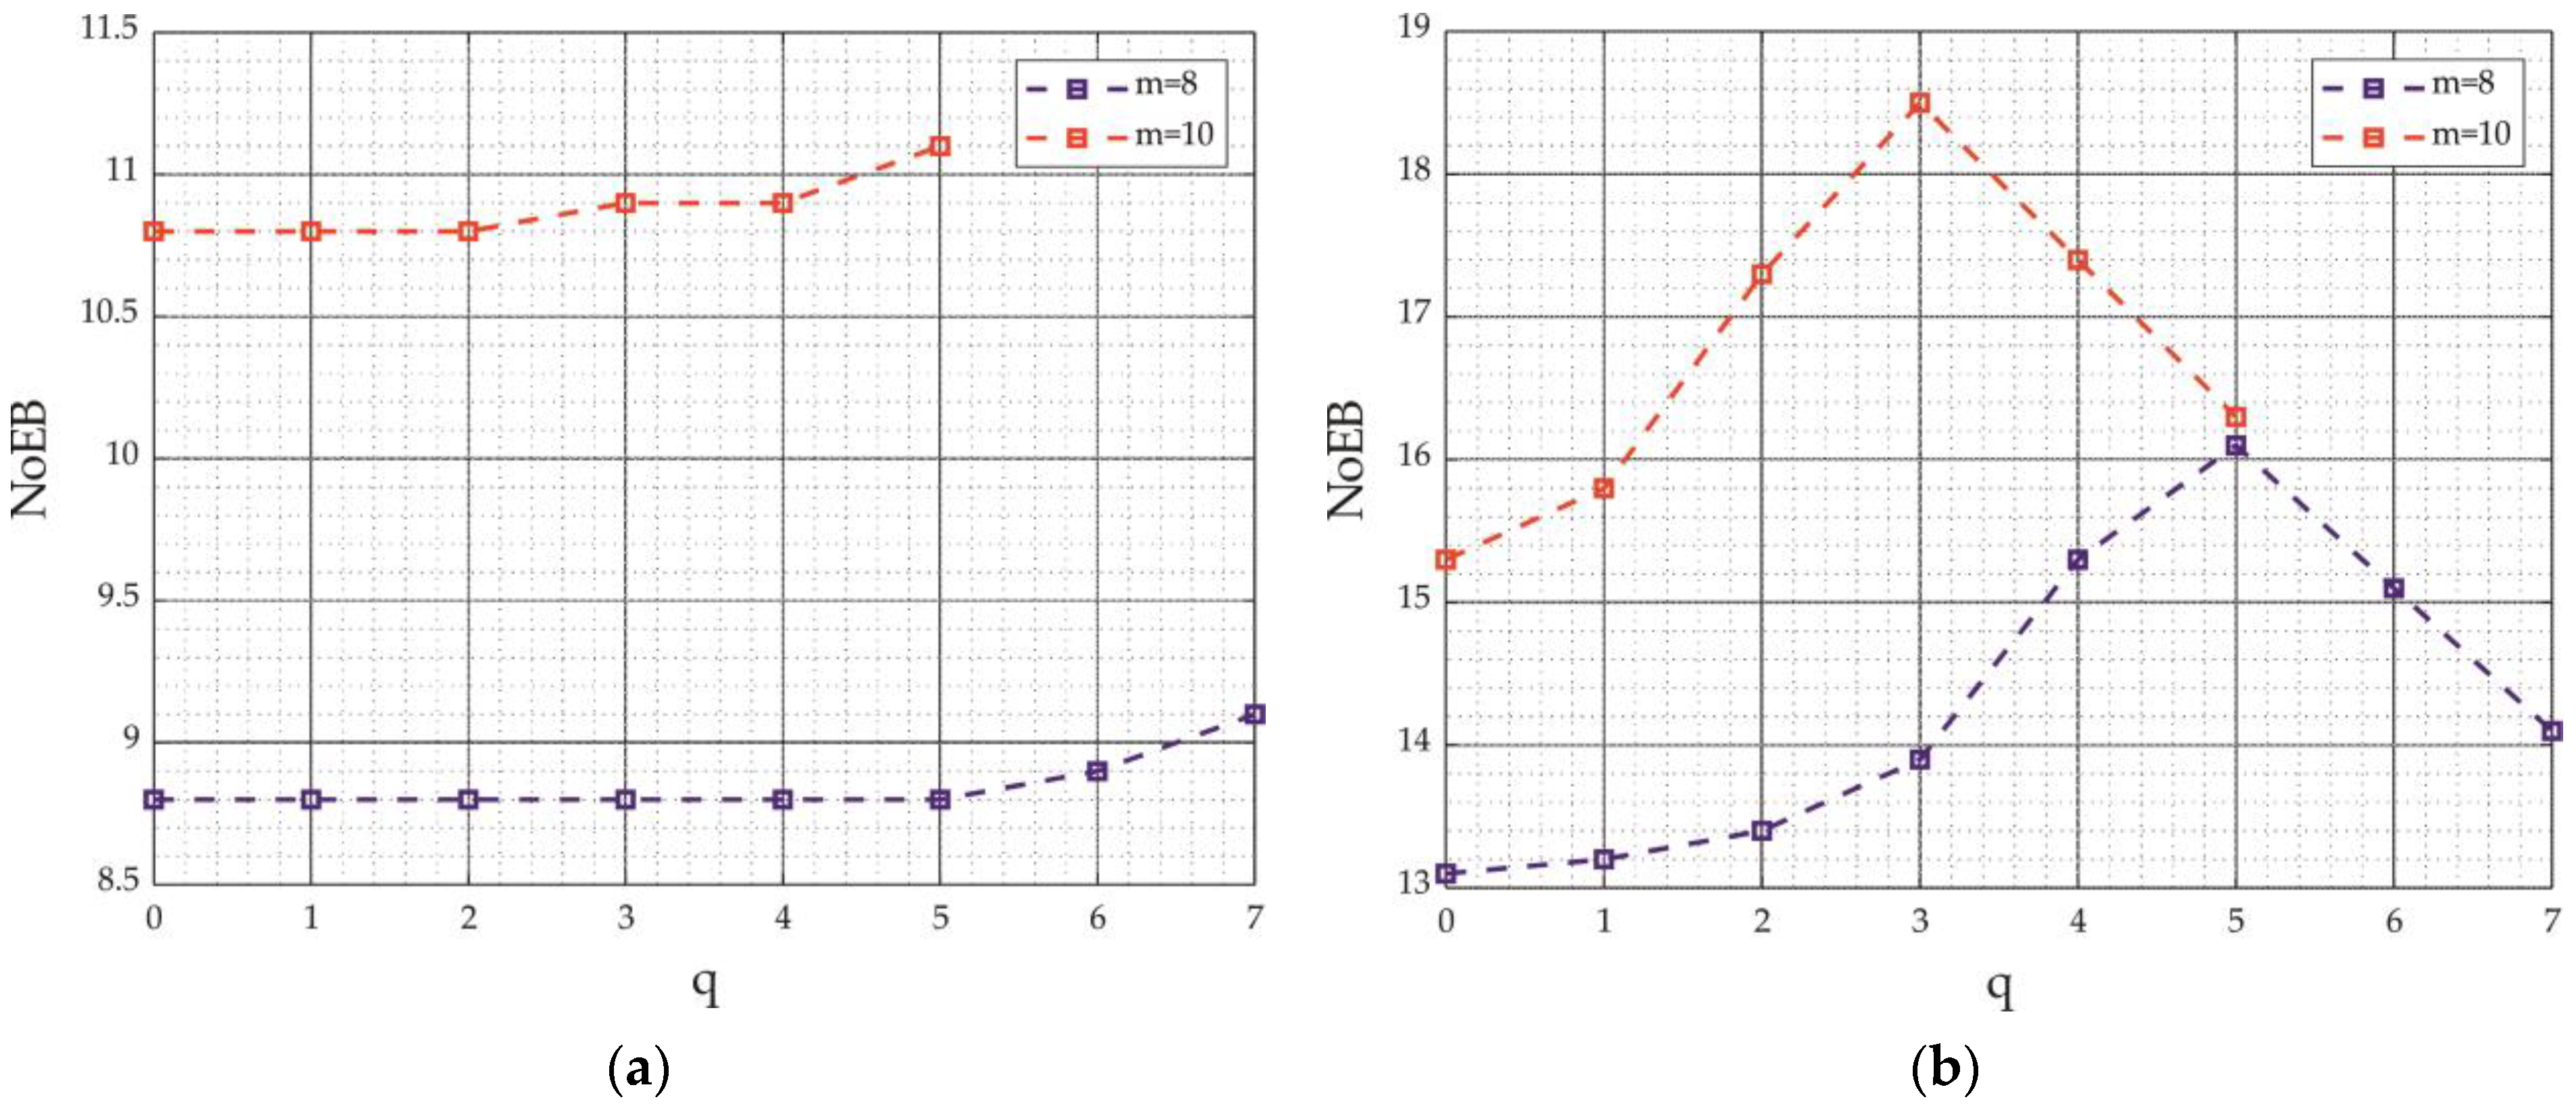
Figure 6 depicts the NoEB as a function of q for m = 8, 10. Please note that the cases q = 4, m = 8 and q = 3, m = 10 give the ESSM described in [29], and that for q = 0 we obtain the performances of the SSM multiplier. In this analysis, the error performances are computed by multiplying 106 input samples, expressed on n = 16 bits, considering both uniform and half-normal distribution with σ = 2048 for the sake of demonstration. As shown in Figure 6a, the NoEB slowly improves with q, achieving the best result for qopt = nm − 1. On the other hand, the NoEB reaches the peak value with qopt = 5, m = 8 and qopt = 3, m = 10, respectively, when the inputs are half-normal. These results are in agreement with the analysis of the previous section, since the NoEB reflects the behavior of the overall mean square approximation error. In addition, this study confirms that the input statistical properties affect the quality of results, and that positioning AM in the middle (as in [29]) generally does not achieve the best accuracy.
For the sake of comparison, we also analyze the performances of SSM [29], of cSSM [30] (with three corrective terms), and of segmented multipliers described in [27,28,31]. The multipliers [13,16,19] are also investigated, which exploit approximate compression. The works [27,28] employ a dynamic segmentation, whereas [31] employs a hybrid technique by cascading a static stage and a dynamic stage. In [27] (named DRUM in the following), the parameter k defines the bit-width of the selected segment, whereas [28] (named TOSAM in the following) exploits a multiply-and-add operation for realizing the product. Here, h bits of the multiplicands are truncated, and t = h + 4 bits of the addends are discarded for hardware simplification. In [31] (named HSM) the static stage selects p-bit segments, whereas the dynamic one chooses (p/2)-bit segments. In [16] (referred as Qiqieh in the following), the parameter L defines the number of rows compressed by an OR gate, whereas [19] (referred to as AHMA in the following) compresses the PPM with approximate 4–2 compressors. We highlight that the HDL code of [27,30] is available on [32,33], respectively.
Table 4 collects the error metrics of the investigated multipliers when the inputs are uniform and half-normal (with σ = 2048), respectively. For the gESSM, we consider the points q = 5 and q = 7 for m = 8, and q = 3 and q = 5 for m = 10, which achieved best performances in the previous analysis. Please note that only the case q = 3, m = 10 places AM at the center of the inputs as in [29].
In the uniform case, the performances of the gESSM are very close to the SSM multiplier, with NoEB of about 9 and 11 bits with m = 8 and m = 10, and NMED, MRED in the ranges [3 × 10⁻⁴, 2 × 10⁻³], [2 × 10⁻³, 1.2 × 10⁻²], respectively. A modest improvement is registered only in the cases q = 7, m = 8 and q = 5, m = 10, as expected from the previous considerations, with a NoEB increase of 0.3 bits. Among the segmented multipliers, cSSM offers best accuracy in the uniform case, with NoEB improvement of 1.4 bits with respect to SSM, and NMED, MRED in the order of 10−4 and 2 × 10⁻³ (see the case m = 10). The other implementations exhibit lower performances in general, with NoEB limited between 5.5 and 9.5 bits. Only Qiqieh L = 2, using approximate compression technique, is able to approach a NoEB of 11 bits and NMED, MRED comparable to SSM, cSSM, and gESSM.
On the other hand, the accuracy of the gESSM strongly improves with respect to the SSM when the inputs are half-normal, exhibiting a NoEB increase up to 3 bits with q = 5, m = 8, and up to 3.2 bits with q = 3, m = 10. The NMED also improves, achieving values in the order of 10−5 with q = 5, m = 8, and 10−6 with q = 3, m = 10. Conversely, the cSSM multiplier does not show improvements, with performances very close to the SSM. Among the other implementations, DRUM is the only one able to offer an accuracy close to the gESSM multiplier, with NoEB up to 17.7 bits in the case k = 8.

4.2. Hardware Implementation Results

We synthesize the investigated multipliers in TSMC 28 nm CMOS technology using 0.9V standard voltage library, in Cadence Genus, exploiting a physical flow in order to improve the accuracy of the estimation of power consumption. For all the circuits, a clock period of 500ps is considered, whereas the power consumption is computed by simulating the post-synthesis netlist with 105 input samples, with both uniform and half-normal distribution (σ = 2048) at a toggle rate of 1GHz. In the simulation, Standard Delay Format and Toggle Count Format files are used for the annotation of the path delays and of the switching activity. At the same time, we also assess the minimum delay by synthesizing each multiplier at the maximum frequency able to allow a positive slack.
Results are collected in Table 5. As shown, the gESSM multipliers allow a reduction of area up to 71.4% with q = 7, m = 8, and in the range 47%/50% with m = 10. The SSM and cSSM multipliers offer superior reductions (up to 76% and 75%, respectively), whereas best results are achieved with DRUM k = 6 and HSM p = 4 (reduction of 84% and 86%, respectively). We also express the complexity of the circuits in terms of equivalent NAND count, considering as reference a two-input NAND gate with drive strength 2x and area of 0.63µm2. Also in this case, the gESSM exhibits remarkable improvements with respect to the exact multiplier and an acceptable worsening with respect to SSM and cSSM.
The gESSM reduces the minimum delay up to 12.8% with respect to the exact implementation. On the other hand, the SSM and cSSM produce faster results due to the simpler segmentation algorithm. The minimum delay of DRUM and HSM increases with k and p, respectively, up to +8.6%, whereas best performances are achieved with Qiqieh, Kulkarni, and AHMA (with reductions up to 38%).
In the case of uniform distributed inputs, the gESSM multipliers show remarkable power savings, ranging between 53.7% and 78.1%. On the other hand, the implementations SSM and cSSM are able to obtain more than 83% of power reduction with m = 8. DRUM k = 4 and HSM p = 8 achieve best performances, with improvements in the order of −90%.
When the input is half-normal, the power saving of gESSM is of 71% and 27% in the optimal points q = 5, m = 8, and q = 3, m = 10, and is larger than 83% in the case q = 7, m = 8. SSM and cSSM continue to exhibit high power reductions (around 88%/89% with m = 8), whereas power saving of DRUM k = 4 and HSM p = 8 reaches up 76.2% and 84%.
We underline that, despite the reduced power saving with half-normal distribution in the optimal points, the gESSM multipliers offer the best accuracy, showing superior error metrics if compared to the other implementations. Therefore, the loss of electrical performances is more than compensated by the reduced approximation error.

4.3. Image Processing Application

We study the performances of the investigated multipliers in image filtering applications. Named I(x,y) the pixel of the input image with coordinates x, y, the filtering operation realizes the relation
I f ( x , y ) = i = d d j = d d I ( x + i , y + j ) · h ( i + d + 1 , j + d + 1 )
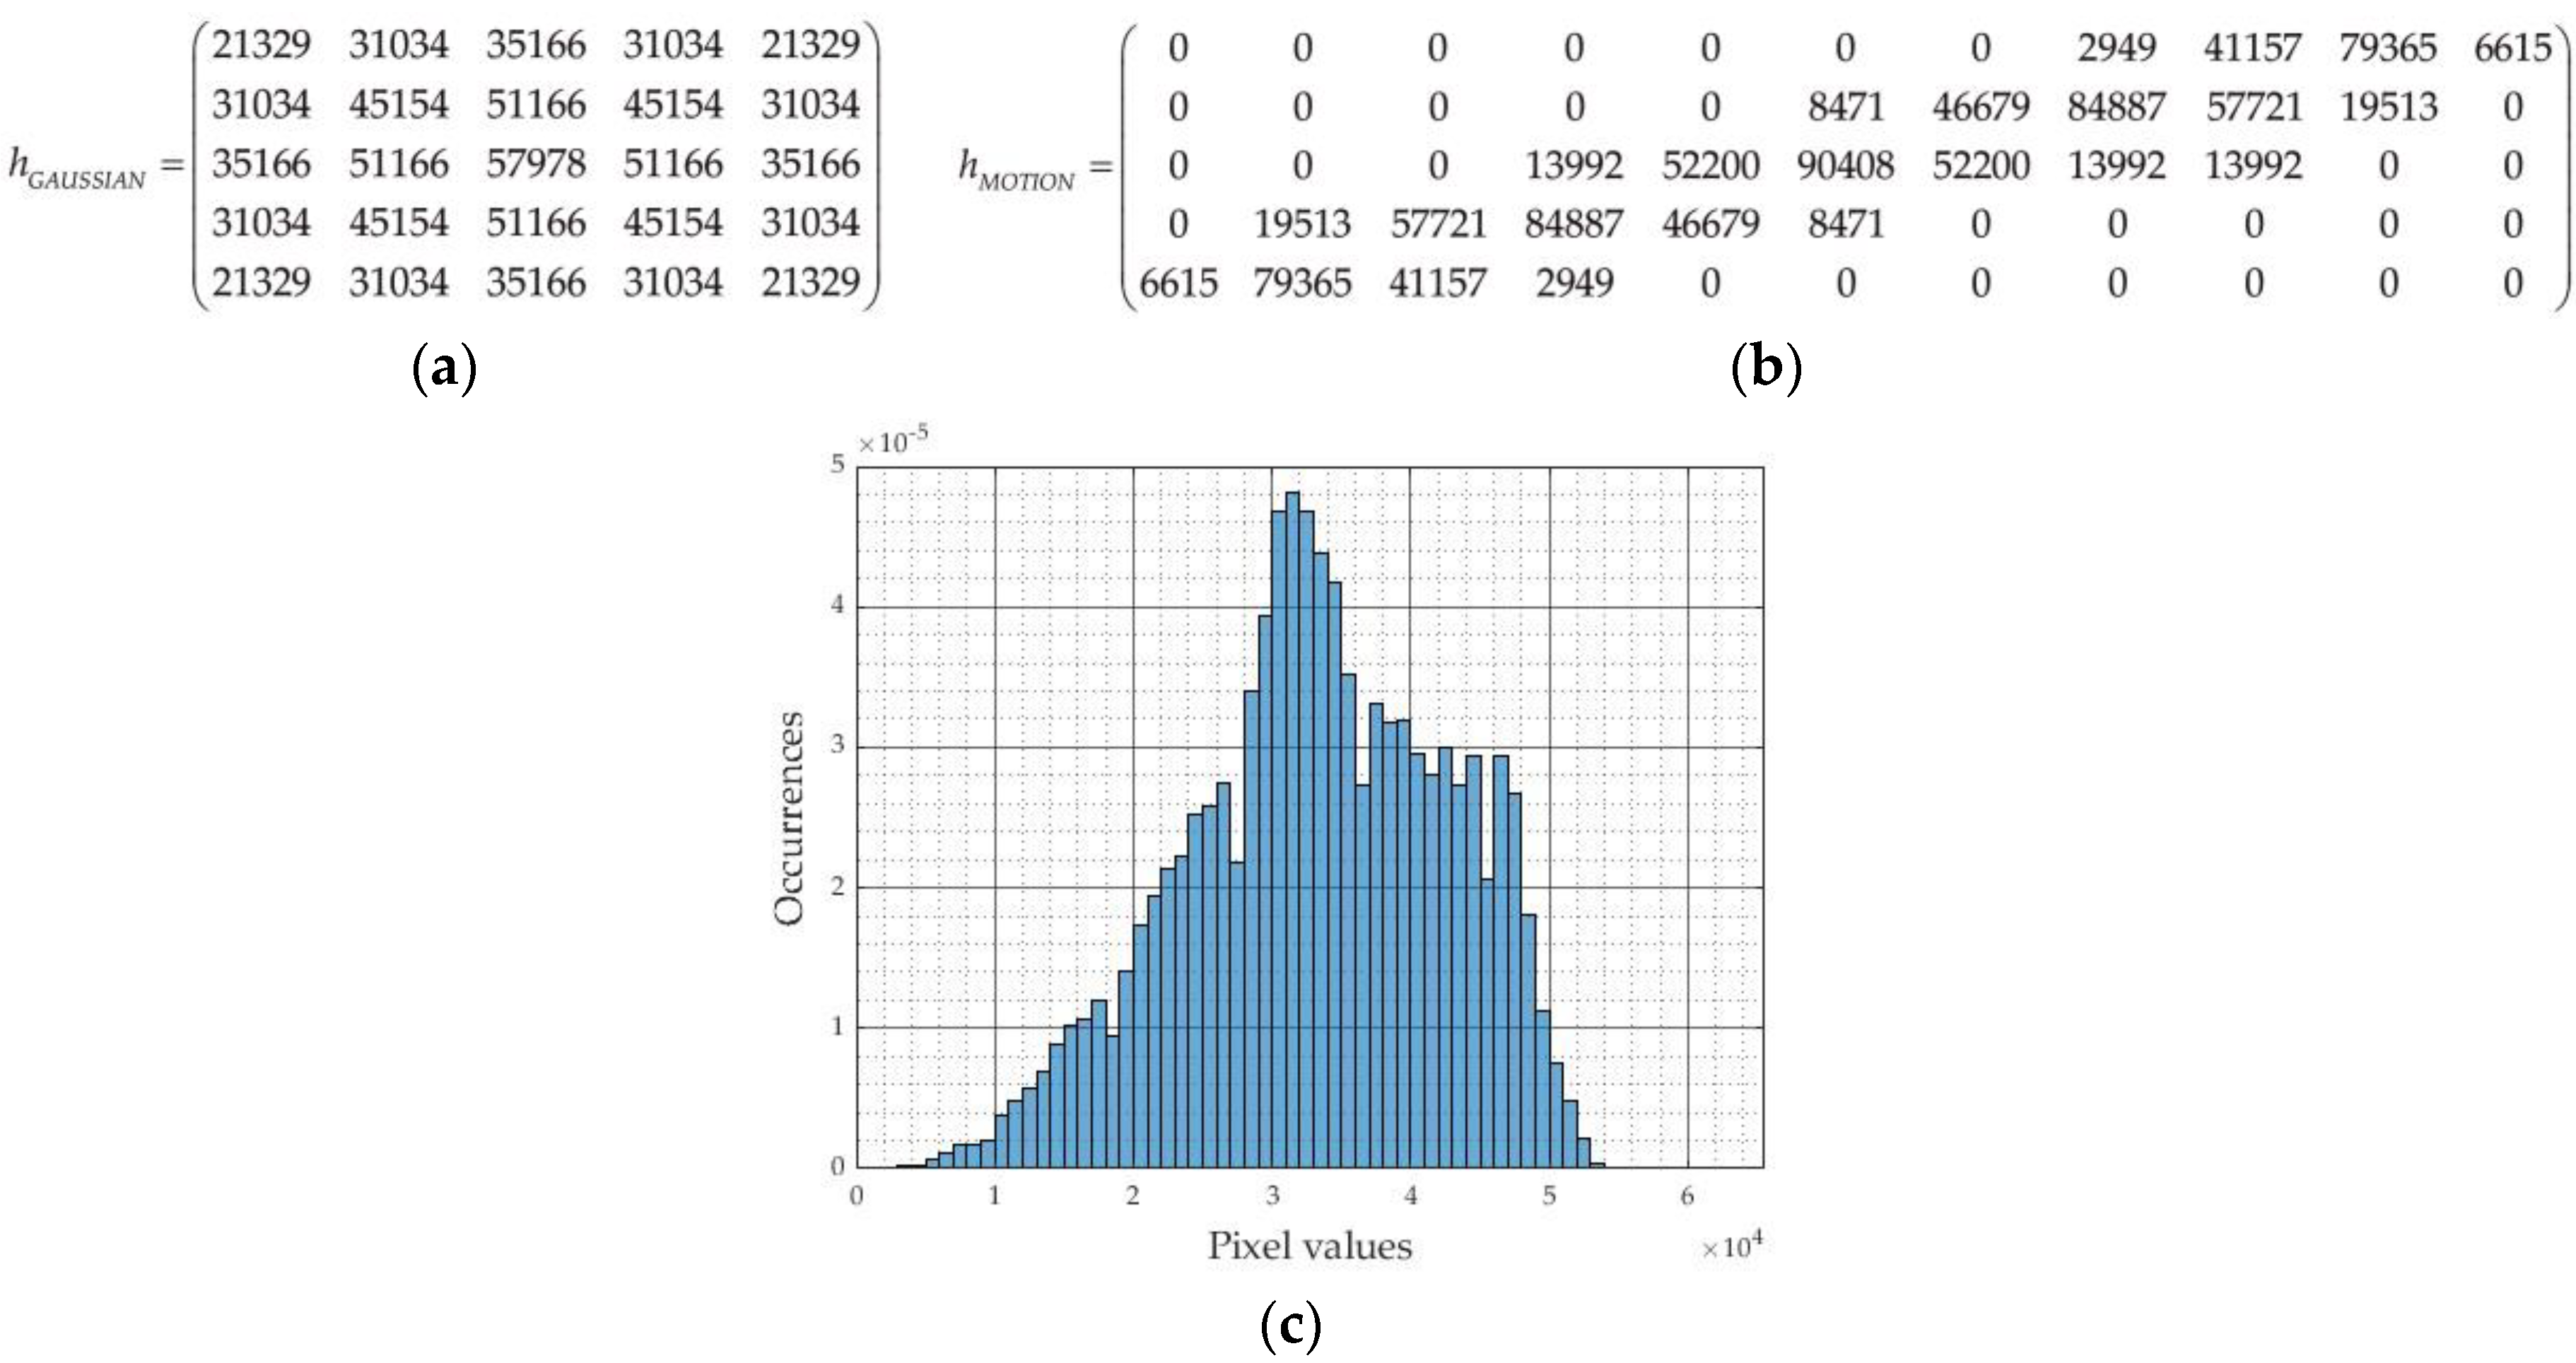
with If(x,y) which is the pixel of the output image, and with h which is the kernel matrix. In our case, we consider a 5 × 5 gaussian kernel, hGAUSSIAN, used for smoothing operations, and a 5 × 11 motion kernel, hMOTION, able to approximate the linear motion of a camera. Figure 7a,b report the coefficients of hGAUSSIAN and hMOTION, expressed as integer numbers on n = 16 bits.
For our analysis, we process three test images, Lena, Cameraman, and Mandrill, whose pixel values are represented on n = 16 bits. For the sake of demonstration, Figure 7c depicts the histogram of occurrences for Mandrill, showing that the probability of assuming values in [0, 2n − 1] is almost spread across the whole range. We assess the performances by exploiting the Mean Structural Similarity Index (SSIM), able to measure the similarity between images, and the Peak Signal-to-Noise ratio (PSNR), expressed in dB, taking as reference the exact filtered image.
Table 6 collects the results, showing the average SSIM and PSNR obtained with the smoothing and the motion application. In addition, the overall average SSIM and PSNR are presented for facilitating the comparisons. All the multipliers allow for achieving SSIM very close to 1, with the static segmented implementations that exhibit best results. The PSNR of cSSM strongly increases if compared with SSM (up to about +14 dB on average in the case m = 10), whereas the improvement is more modest with the gESSM (up to +4.1dB with m = 8 and +6dB with m = 10 on average). Again, the performances of the gESSM depend on the statistical properties of the input image and on the choice of q.
The dynamic segmented multipliers exhibit large PSNR with TOSAM and DRUM (more than 60 dB), whereas performances are limited with HSM. Among multipliers with approximate compressors, only Qiqieh L = 2 is able to overcome 60dB of PSNR, whereas Kulkarni and AHMA show lower performances. Figure 8 offers the results obtained with the segmented multipliers for the Lena image. As shown, the results of gESSM are very close to the exact case (as demonstrated by the high values of SSIM and PSNR), whereas some degradations are registered with DRUM k = 4 and HSM p = 8.

4.4. Audio Application

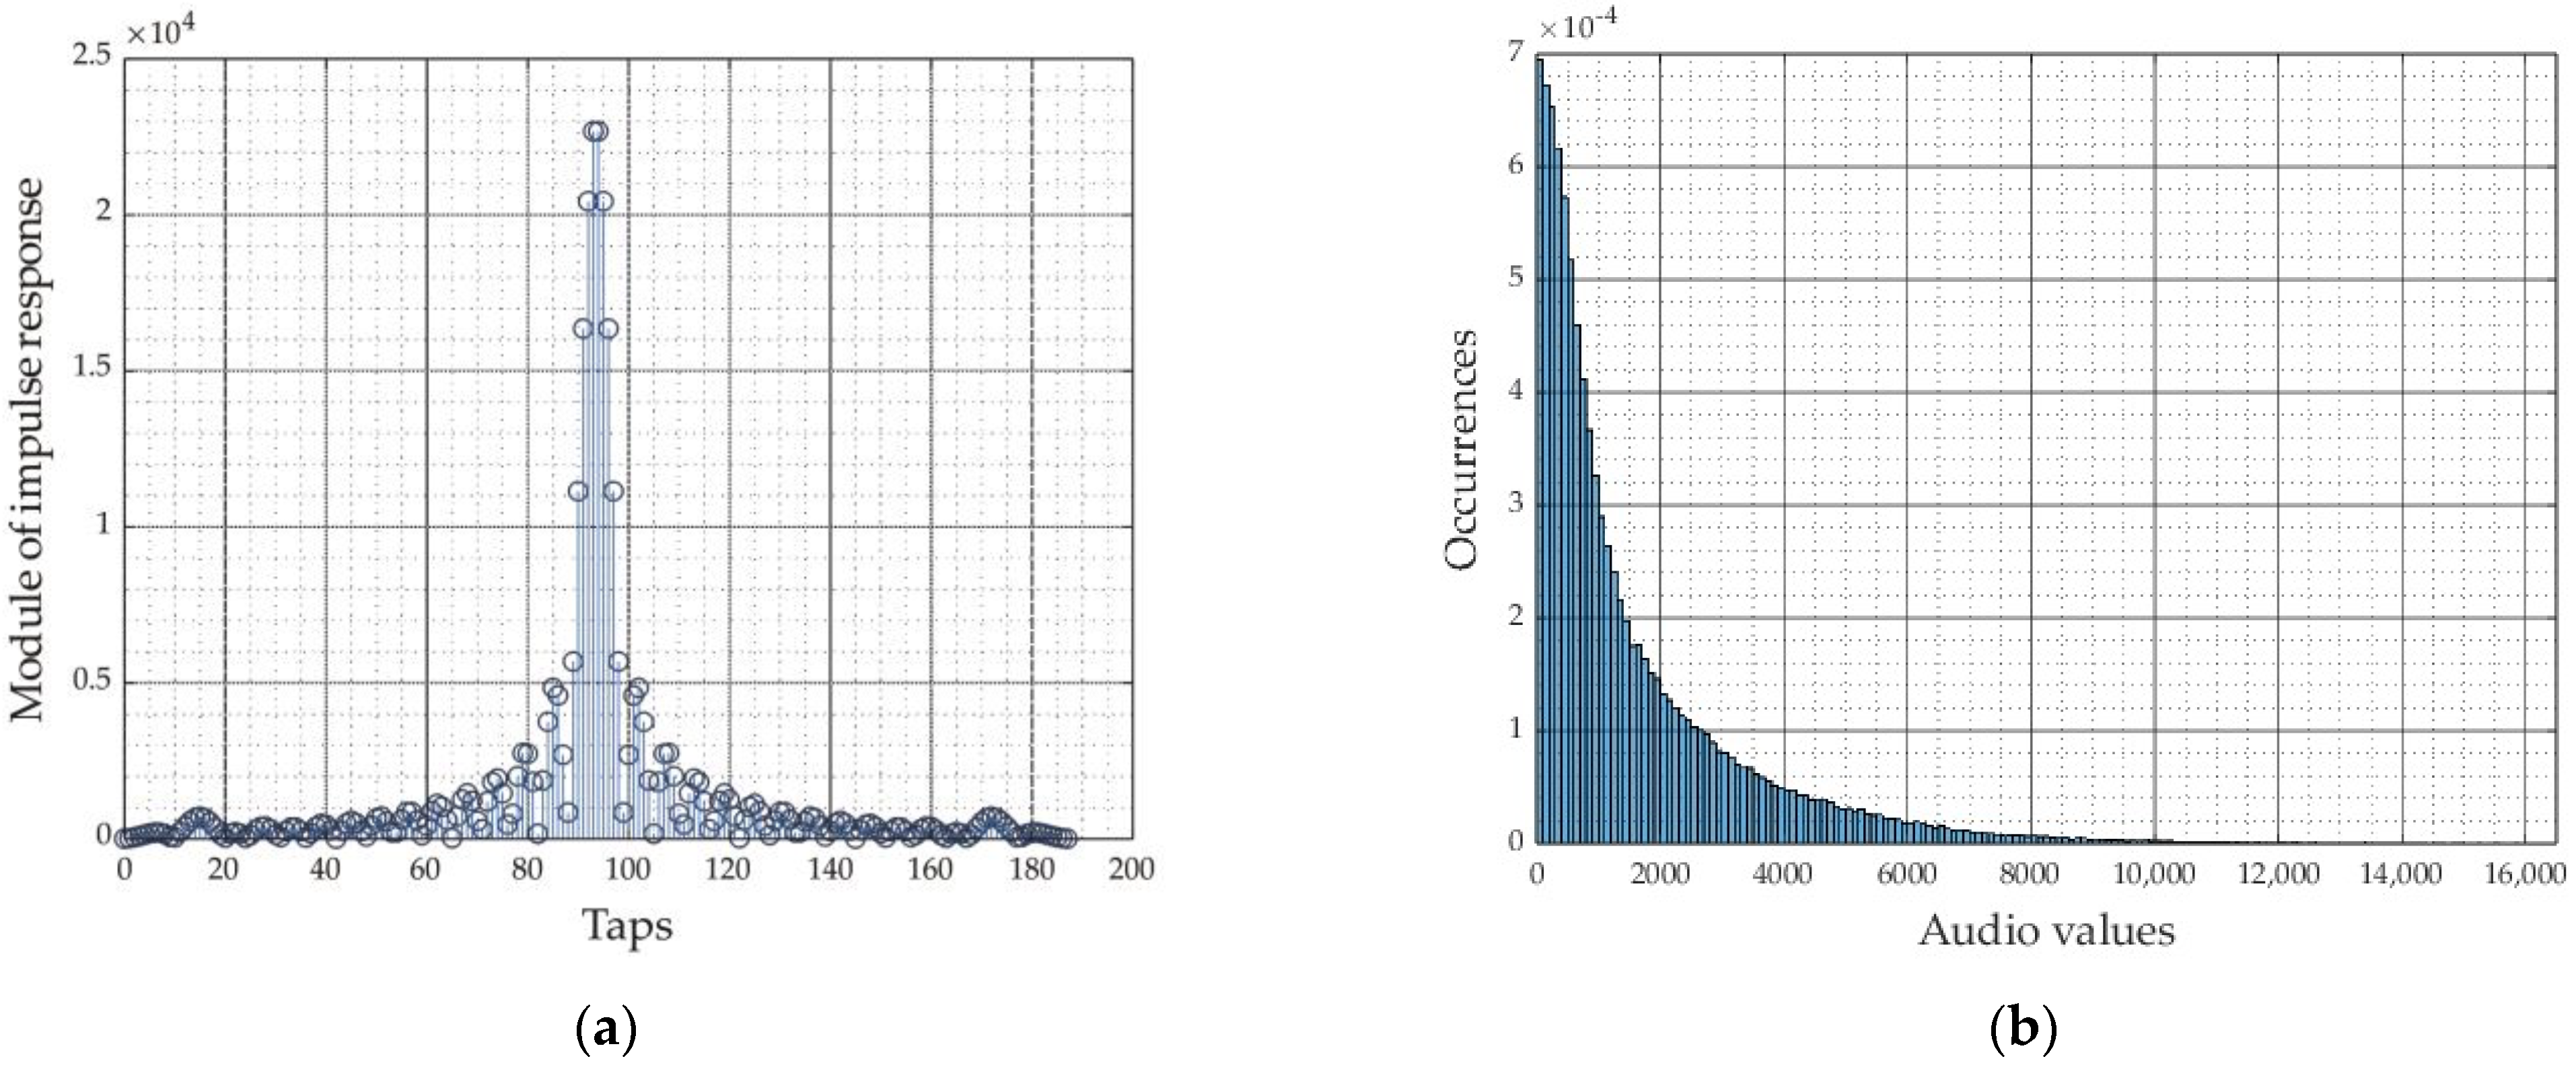
As a further example, we investigate the use of the proposed gESSM and the other multipliers for implementing an audio filter. Filtering is a well diffused operation in audio processing, able to realize frequency equalization and noise reduction. In this example, we elaborate the signal by considering a linear phase, low-pass, generalized Equiripple, 187-th order, finite impulse response (FIR) filter, with pass-band up to 0.1667 π rad/sample and stop-band from 0.1958 π rad/sample with attenuation of 85dB. The module of the impulse response is shown in Figure 9a with the taps represented as integer numbers expressed on n = 16 bits.
The audio signal used for this trial is p232_016.wav, from the library [34]. We also superimpose an external gaussian noise with variance of −30dB and quantize the resulting signal on n = 16 bits. The histogram of occurrences of the input signal, depicted in Figure 9b, highlights a close to half-normal distribution.
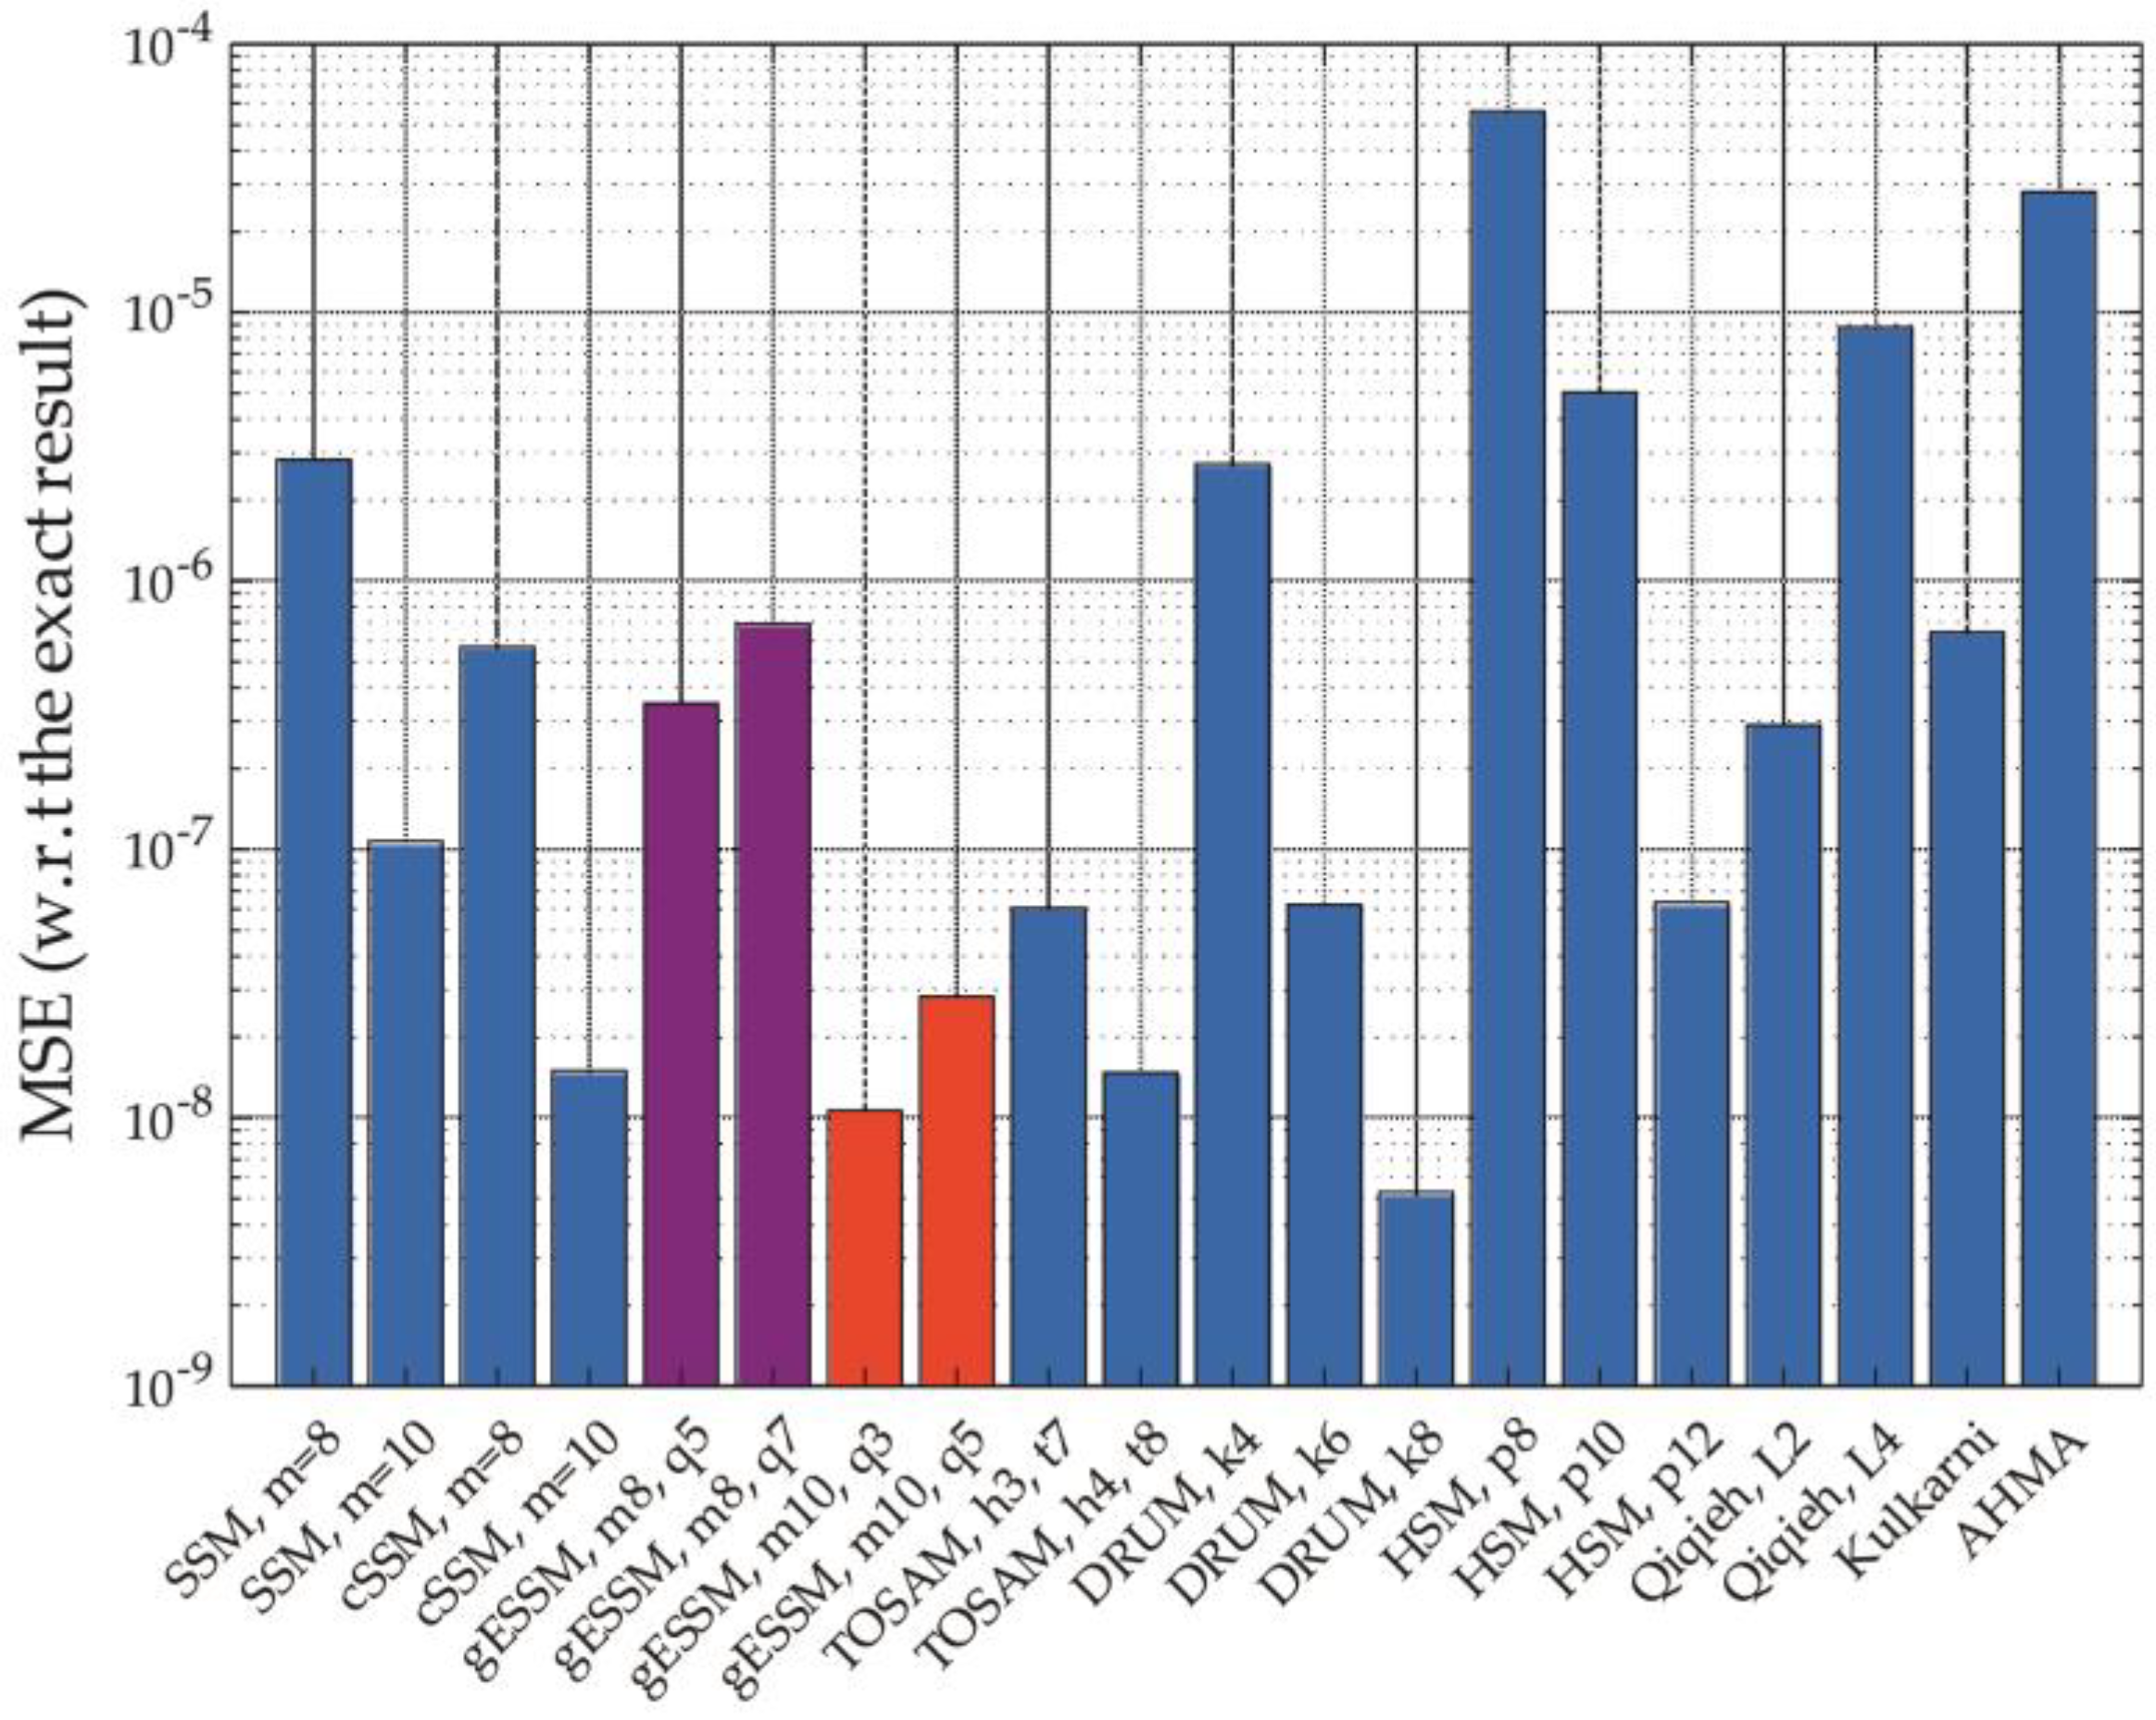
For the sake of comparison, we show the mean square error (MSE) between the approximate and the exact output for each multiplier. Therefore, the lower the MSE, the better the multiplier accuracy.
Figure 10 shows the performances, with multiplications revisited as sign-magnitude operations. The results for the gESSM multipliers are highlighted in violet (m = 8) and in red (m = 10). As shown, the accuracy of the gESSM again varies in dependence on q, with best performance achieved with q = 3, m = 10. In this application, gESSM overcomes cSSM both with m = 8 and m = 10, which offer a worse MSE. In general, the gESSM performs better than the other implementations, with the exception of DRUM k = 8, featuring the best accuracy in this case.

5. Discussion

As shown in the previous sections, the position of the middle segment AM affects the accuracy of the multiplier, achieving different results dependent on the statistical properties of the inputs. Indeed, the accuracy mainly depends (i) on the probability of A of assuming values in the ranges [2m, 2m+q) and [2m+q, 2n–1], and (ii) on the resolution of AM.
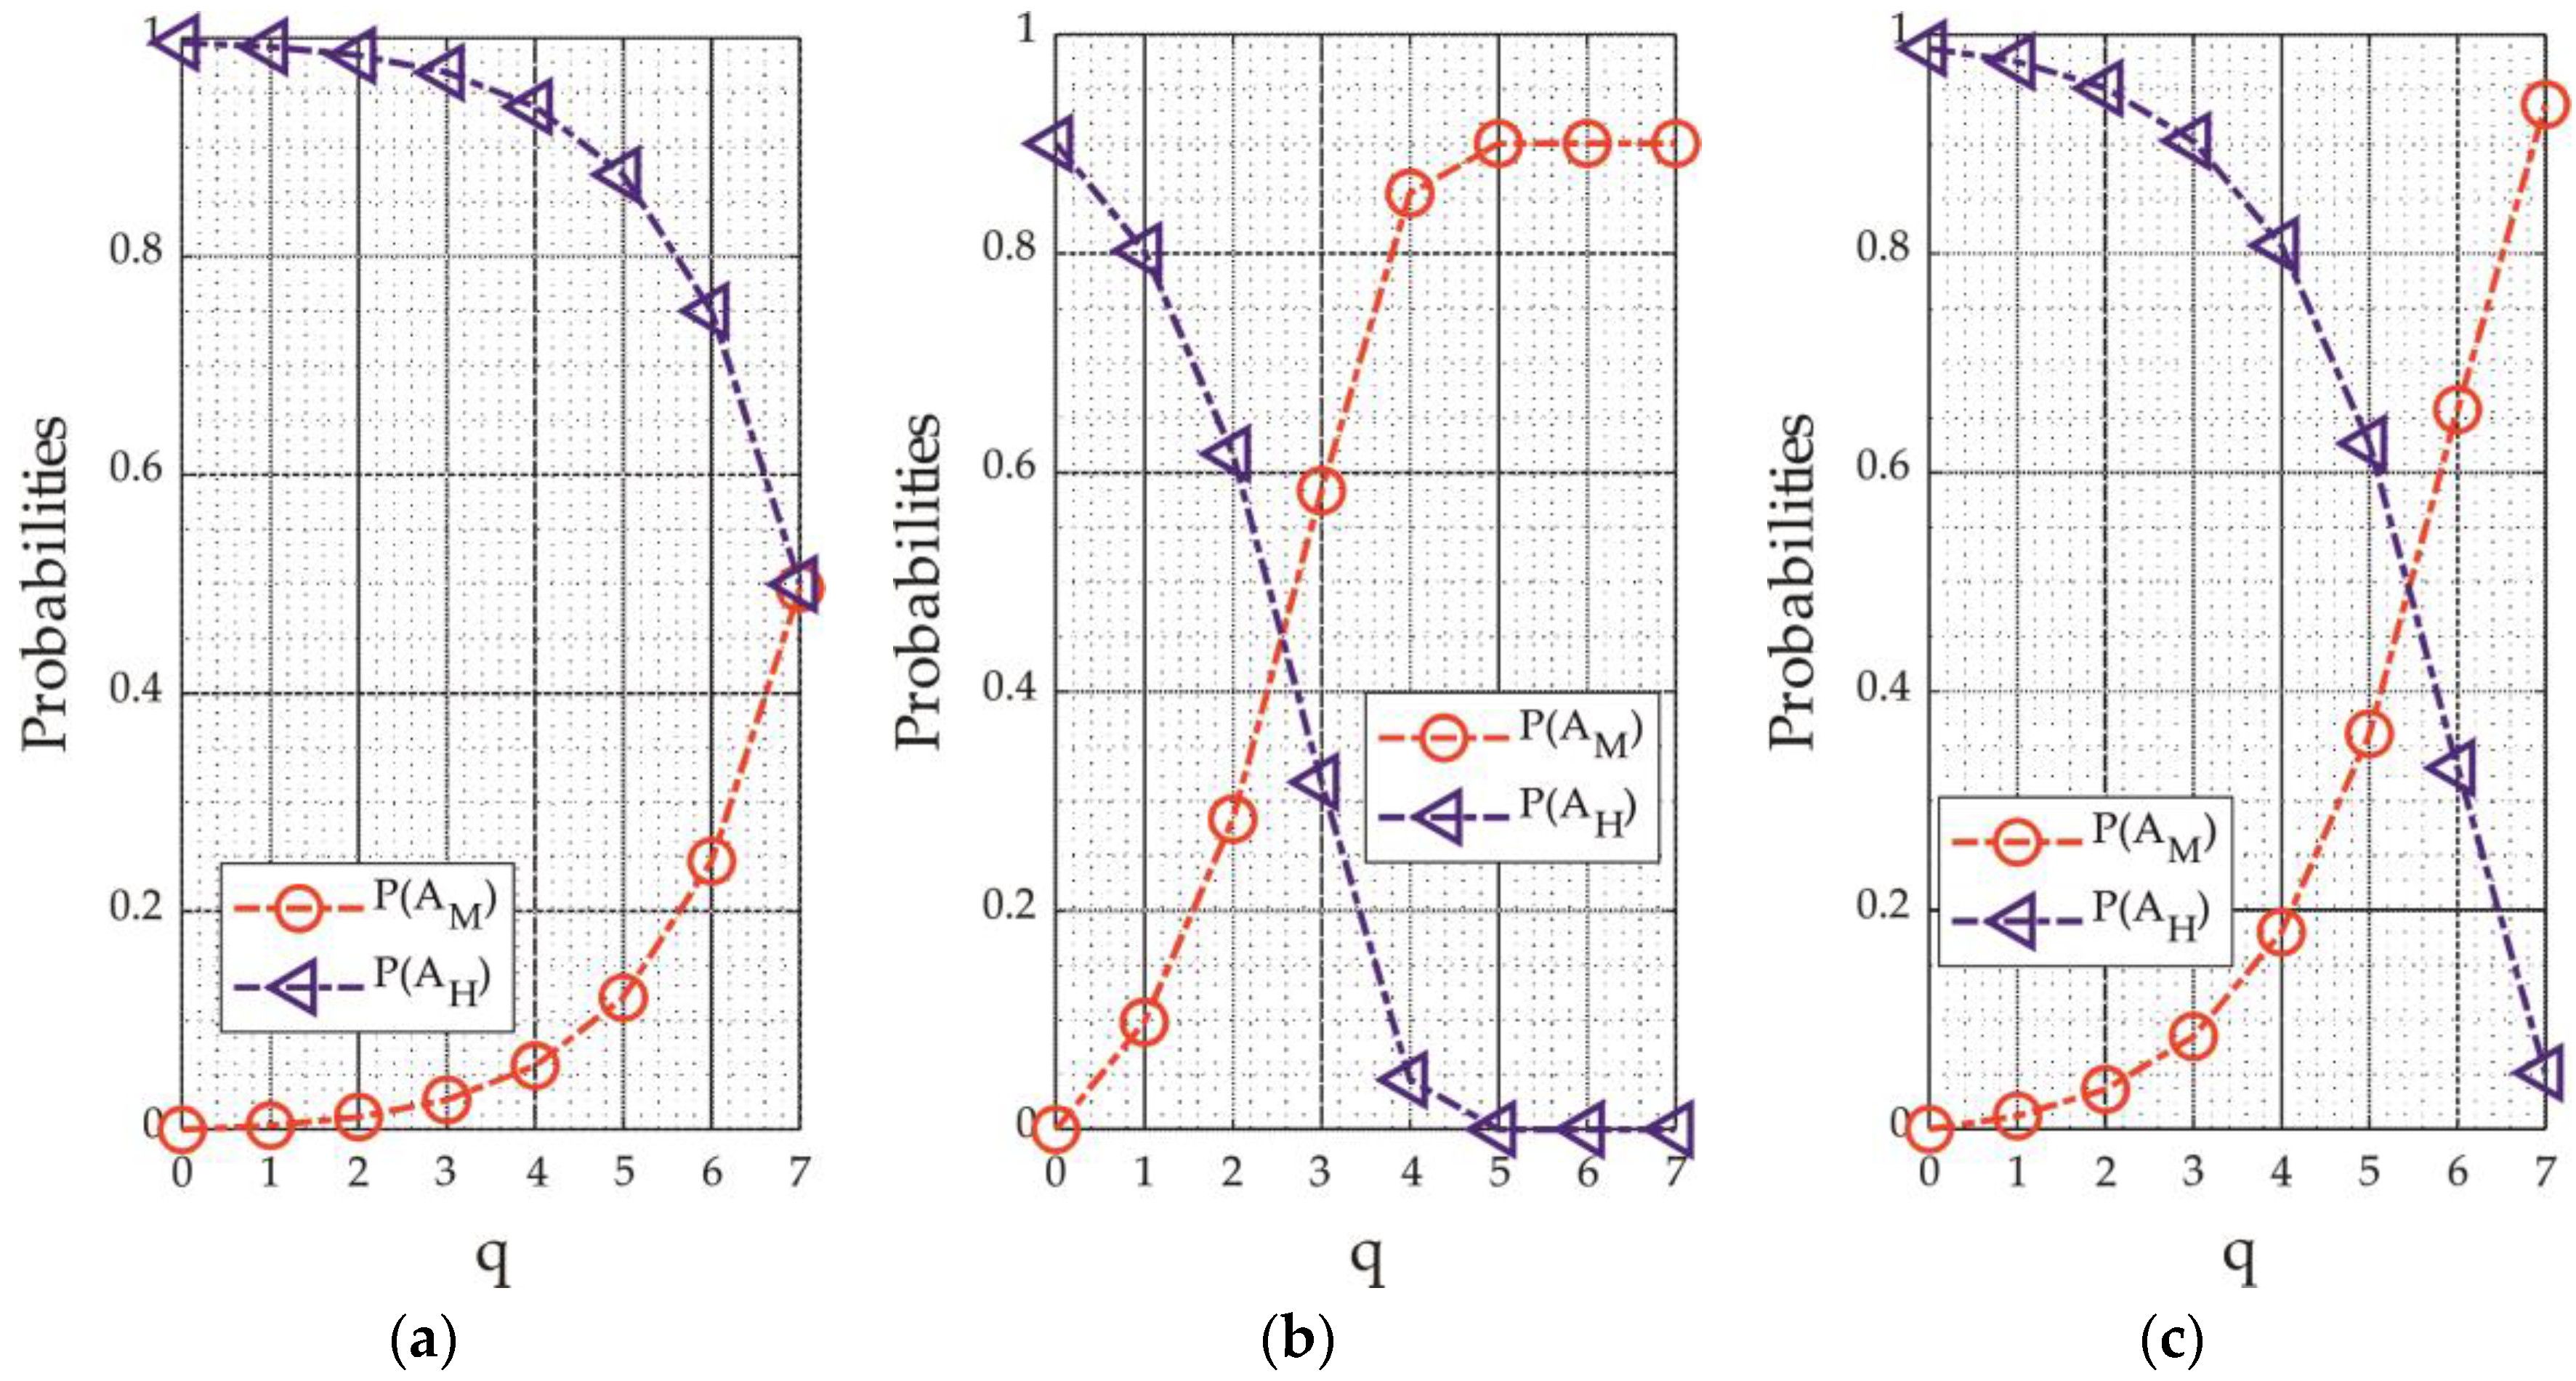
Figure 11 shows the behavior of P(AM) and P(AH) with respect to q for m = 8, in the uniform case and in the half-normal distribution with σ = 2048 and σ = 16,384. We remember that the analytical expressions of P(AM) and P(AH) are shown in Table 3.
In the uniform case (Figure 11a), P(AH) is very close to 1 for small values of q. Therefore, A is mainly approximated with AH, with negative effects on the multiplier accuracy. Increasing q, P(AM) increases, whereas P(AH) reduces. This improves the accuracy, since the probability of approximating A with AM grows up. When q = nm − 1, P(AM) equals P(AH). As a consequence, the segmentation fairly chooses between AM and AH, allowing the approximation error to minimize. Therefore, increasing q allows the error performances to improve with respect to the SSM multiplier. Nevertheless, cSSM exhibits better error results also considering the optimal gESSM, since the correction technique allows the approximation error to reduce when AH is chosen. These trends are almost confirmed in the image processing applications, where the kernels and the input images prefer the selection of the most significant segments.
At the same time, the power consumption strongly reduces both with gESSM and with cSSM and SSM, whereas lower improvements are registered with the other DSM multipliers. This is mostly due to the employment of leading one detector and encoders, used to perform the dynamic segmentation. On the other hand, the power saving of gESSM is slightly weaker than SSM and cSSM due to the different selection mechanism.
The hardware performances of Qiqieh, Kulkarni, and AHMA also show interesting results, due to the reduced complexity of the PPM compression stage, but at the cost of an important loss of the quality of results.
When the distribution is half-normal, the overall mean square error presents a minimum for small values of σ. Indeed, with reference to the case σ = 2048 in Figure 11b, P(AM) increases up to q = 5 and is constant for q > 5. On the other hand, for large values of q, the resolution of AM worsens. This leads to q = 5 as the optimum point since P(AM) is maximized with AM that offers the best possible accuracy. Furthermore, Figure 5 of Section 3.2 shows also that the position of the optimal point depends on the standard deviation of the inputs: the higher σ, the higher qopt. This is explained in Figure 11c for the case σ = 16,384, where P(AM) reaches the peak value only for q = nm − 1, thus moving ahead the optimal point.
With reference to the case σ = 2048, the accuracy of cSSM is very close to SSM since the probability of choosing AH is low and the correction term is practically unused. Conversely, the gESSM is able to improve the performances with a NoEB of 18.5 bits, also overcoming the other implementations. This scenario is confirmed by the audio processing analysis. In this application, the gESSM performs better than the cSSM, achieving a MSE of about 10−8. From an electrical point of view, the power reduction offered by gESSM is remarkable when m = 8, and decreases if m = 10. Conversely, SSM and cSSM again exhibit reductions up to 89.2% and 88.1%, but at the cost of limited accuracy performances.
In order to assess the multipliers considering both the error features and the electrical performances, we show the plot of the power saving with respect to the NMED and the MRED for uniform and half-normal inputs (with σ = 2048) in Figure 12. As shown, the cSSM multipliers are on the pareto front when the inputs are uniform, offering large power saving with a high quality of results. On the contrary, when the input is half-normal, the proposed gESSM with q = 5, m = 8 and q = 3, m = 10 define the pareto front for NMED in the range [9 × 10⁻⁶, 5 × 10⁻⁵], and MRED in the range [2 × 10⁻², 10−1], offering the best trade-off between accuracy and power consumption. Therefore, the gESSM results in the best choice when the inputs have a non-uniform distribution.

6. Conclusions

In this paper, we have analyzed the performances of the ESSM multiplier as a function of the position of the middle segment and of the statistical properties of the input signals. While the standard implementation of the ESSM places the middle segment at the center of the input, we have moved the middle segment from the LSB to the MSB in order to find the configuration best able to minimize the mean square approximation error. To this aim, two design parameters were exploited: m, defining the accuracy and the size of the multiplier, and q, defining the position of the middle segments for further error tuning. We have described the hardware implementation of the proposed gESSM, and we have analytically demonstrated the possibility of choosing q for minimizing the overall approximation error in a mean square sense.
The error metrics reveal a strong dependence on q and on the statistical properties of the input signals. When the inputs are uniform, the best accuracy is achieved when q reaches the maximum value, whereas minimum points arise in the half-normal case (with σ = 2048). The gESSM is not able to overcome cSSM with uniform distribution, but exhibits best results with half-normal inputs (achieving NoEB of 18.5 bits). These trends are also confirmed in image and audio applications, giving best results in audio filtering. The electrical performances also exhibit satisfactory results, with power reductions up to 78% and 83% in the uniform and half-normal cases, respectively.
From the comparison of the error metrics and the power saving of Figure 12, the gESSM results in the best choice when the input signal is non-uniform, offering the best trade-off between power and accuracy.

Author Contributions

Conceptualization, G.D.M., G.S. and A.G.M.S.; methodology, G.D.M. and G.S.; software, G.D.M. and G.S.; validation, G.D.M., G.S. and A.G.M.S.; formal analysis, G.D.M., G.S. and A.G.M.S.; investigation, G.D.M., G.S. and A.G.M.S.; data curation, G.D.M. and G.S.; writing—original draft preparation, G.D.M., G.S., A.G.M.S. and D.D.C.; writing—review and editing, A.G.M.S. and D.D.C.; visualization, G.D.M. and G.S.; supervision, A.G.M.S. and D.D.C.; project administration, A.G.M.S. and D.D.C. All authors have read and agreed to the published version of the manuscript.

Funding

This research received no external funding.

Data Availability Statement

The Verilog code is available on GitHub at https://github.com/GenDiMeo/gESSM, accessed on 16 February 2020.

Conflicts of Interest

The authors declare no conflict of interest.

Appendix A

Let consider the normal random variable A′ with zero mean and standard deviation σ. The half-normal random variable A is obtained by computing the absolute value of A′, i.e., A = |A′|.
In order to compute P(AM) and P(AH), let us consider the probability of having A in the range [0, a]:
P ( 0 A a ) = 0 a f ( A ) d a = e r f ( a σ 2 )
where f(A) is the pdf of A (see (12)), and erf(·) is the error function.
Therefore, observing that P(AM) = P(0 ≤ A ≤ 2m+q) − P(0 ≤ A ≤ 2m) and P(AH) = P(0 ≤ A ≤ 2n−1)−P(0 ≤ A ≤ 2m+q), we obtain the results shown in Table 3.

Appendix B

In order to compute (23), let us concentrate on the first summation in (22), writing the following equality:
E [ ( k = 0 q 1 a k 2 k ) 2 ] = E [ k = 0 q 1 ( a k 2 k ) 2 ] + 2 k = 0 q 2 a k 2 k j = k + 1 q 1 a j 2 j
Exploiting the linearity of the expectation operator and the independence between the bits, we obtain
E [ ( k = 0 q 1 a k 2 k ) 2 ] = 1 2 · k = 0 q 1 2 2 k E [ 2 k = 0 q 2 a k 2 k j = k + 1 q 1 a j 2 j ] = 1 2 · k = 0 q 2 2 k j = k + 1 q 1 2 j
under the hypothesis E[ak] = 1/2.
Therefore, observing that
k = 0 q 1 r k = 1 r q 1 r j = k + 1 q 1 r k = j = 0 q 1 r j j = 0 k r j
with r that is a natural number, we have the following expressions after simple algebra:
E [ k = 0 q 1 ( a k 2 k ) 2 ] = 1 6 ( 4 q 1 ) E [ 2 k = 0 q 2 a k 2 k j = k + 1 q 1 a j 2 j ] = 1 4 2 q ( 2 q 1 1 ) 1 6 ( 4 q 1 1 )
Applying the same reasoning for the second summation, we obtain the (23).

References

  1. Spagnolo, F.; Perri, S.; Corsonello, P. Approximate Down-Sampling Strategy for Power-Constrained Intelligent Systems. IEEE Access 2022, 10, 7073–7081. [Google Scholar] [CrossRef]
  2. Vaverka, F.; Mrazek, V.; Vasicek, Z.; Sekanina, L. TFApprox: Towards a Fast Emulation of DNN Approximate Hardware Accelerators on GPU. In Proceedings of the 2020 Design, Automation & Test in Europe Conference & Exhibition (DATE), Grenoble, France, 9–13 March 2020; pp. 294–297. [Google Scholar] [CrossRef]
  3. Jacob, B.; Kligys, S.; Chen, B.; Zhu, M.; Tang, M.; Howard, A.; Adam, H.; Kalenichenko, D. Quantization and Training of Neural Networks for Efficient Integer-Arithmetic-Only Inference. In Proceedings of the 2018 IEEE/CVF Conference on Computer Vision and Pattern Recognition, Salt Lake City, UT, USA, 18–23 June 2018; pp. 2704–2713. [Google Scholar] [CrossRef] [Green Version]
  4. Montanari, D.; Castellano, G.; Kargaran, E.; Pini, G.; Tijani, S.; De Caro, D.; Strollo, A.G.M.; Manstretta, D.; Castello, R. An FDD Wireless Diversity Receiver With Transmitter Leakage Cancellation in Transmit and Receive Bands. IEEE J. Solid State Circuits 2018, 53, 1945–1959. [Google Scholar] [CrossRef]
  5. Kiayani, A.; Waheed, M.Z.; Antilla, L.; Abdelaziz, M.; Korpi, D.; Syrjala, V.; Kosunen, M.; Stadius, K.; Ryynamen, J.; Valkama, M. Adaptive Nonlinear RF Cancellation for Improved Isolation in Simultaneous Transmit–Receive Systems. IEEE Trans. Microw. Theory Tech. 2018, 66, 2299–2312. [Google Scholar] [CrossRef] [Green Version]
  6. Zhang, T.; Su, C.; Najafi, A.; Rudell, J.C. Wideband Dual-Injection Path Self-Interference Cancellation Architecture for Full-Duplex Transceivers. IEEE J. Solid State Circuits 2018, 53, 1563–1576. [Google Scholar] [CrossRef]
  7. Di Meo, G.; De Caro, D.; Saggese, G.; Napoli, E.; Petra, N.; Strollo, A.G.M. A Novel Module-Sign Low-Power Implementation for the DLMS Adaptive Filter With Low Steady-State Error. IEEE Trans. Circuits Syst. I Regul. Pap. 2022, 69, 297–308. [Google Scholar] [CrossRef]
  8. Meher, P.K.; Park, S.Y. Critical-Path Analysis and Low-Complexity Implementation of the LMS Adaptive Algorithm. IEEE Trans. Circuits Syst. I Regul. Pap. 2014, 61, 778–788. [Google Scholar] [CrossRef]
  9. Jiang, H.; Liu, L.; Jonker, P.P.; Elliott, D.G.; Lombardi, F.; Han, J. A High-Performance and Energy-Efficient FIR Adaptive Filter Using Approximate Distributed Arithmetic Circuits. IEEE Trans. Circuits Syst. I Regul. Pap. 2019, 66, 313–326. [Google Scholar] [CrossRef] [Green Version]
  10. Esposito, D.; Di Meo, G.; De Caro, D.; Strollo, A.G.M.; Napoli, E. Quality-Scalable Approximate LMS Filter. In Proceedings of the 2018 25th IEEE International Conference on Electronics, Circuits and Systems (ICECS), Bordeaux, France, 9–12 December 2018; pp. 849–852. [Google Scholar] [CrossRef]
  11. Di Meo, G.; De Caro, D.; Petra, N.; Strollo, A.G.M. A Novel Low-Power High-Precision Implementation for Sign–Magnitude DLMS Adaptive Filters. Electronics 2022, 11, 1007. [Google Scholar] [CrossRef]
  12. Bruschi, V.; Nobili, S.; Terenzi, A.; Cecchi, S. A Low-Complexity Linear-Phase Graphic Audio Equalizer Based on IFIR Filters. IEEE Signal Process. Lett. 2021, 28, 429–433. [Google Scholar] [CrossRef]
  13. Kulkarni, P.; Gupta, P.; Ercegovac, M. Trading Accuracy for Power with an Underdesigned Multiplier Architecture. In Proceedings of the 2011 24th Internatioal Conference on VLSI Design, Chennai, India, 2–7 January 2011; pp. 346–351. [Google Scholar] [CrossRef]
  14. Zervakis, G.; Tsoumanis, K.; Xydis, S.; Soudris, D.; Pekmestzi, K. Design-Efficient Approximate Multiplication Circuits Through Partial Product Perforation. IEEE Trans. Very Large Scale Integr. (VLSI) Syst. 2016, 24, 3105–3117. [Google Scholar] [CrossRef] [Green Version]
  15. Zacharelos, E.; Nunziata, I.; Saggese, G.; Strollo, A.G.M.; Napoli, E. Approximate Recursive Multipliers Using Low Power Building Blocks. IEEE Trans. Emerg. Top. Comput. 2022, 10, 1315–1330. [Google Scholar] [CrossRef]
  16. Qiqieh, I.; Shafik, R.; Tarawneh, G.; Sokolov, D.; Yakovlev, A. Energy-efficient approximate multiplier design using bit significance-driven logic compression. In Proceedings of the Design, Automation & Test in Europe Conference & Exhibition (DATE), Lausanne, Switzerland, 27–31 March 2017; pp. 7–12. [Google Scholar] [CrossRef] [Green Version]
  17. Esposito, D.; Strollo, A.G.M.; Alioto, M. Low-power approximate MAC unit. In Proceedings of the 2017 13th Conference on Ph.D. Research in Microelectronics and Electronics (PRIME), Giardini Naxos-Taormina, Italy, 12–15 June 2017; pp. 81–84. [Google Scholar] [CrossRef]
  18. Fritz, C.; Fam, A.T. Fast Binary Counters Based on Symmetric Stacking. IEEE Trans. Very Large Scale Integr. (VLSI) Syst. 2017, 25, 2971–2975. [Google Scholar] [CrossRef]
  19. Ahmadinejad, M.; Moaiyeri, M.H.; Sabetzadeh, F. Energy and area efficient imprecise compressors for approximate multiplication at nanoscale. Int. J. Electron. Commun. 2019, 110, 152859. [Google Scholar] [CrossRef]
  20. Yang, Z.; Han, J.; Lombardi, F. Approximate compressors for error-resilient multiplier design. In Proceedings of the 2015 IEEE International Symposium on Defect and Fault Tolerance in VLSI and Nanotechnology Systems (DFTS), Amherst, MA, USA, 12–14 October 2015; pp. 183–186. [Google Scholar] [CrossRef]
  21. Ha, M.; Lee, S. Multipliers With Approximate 4–2 Compressors and Error Recovery Modules. IEEE Embed. Syst. Lett. 2018, 10, 6–9. [Google Scholar] [CrossRef]
  22. Strollo, A.G.M.; Napoli, E.; De Caro, D.; Petra, N.; Meo, G.D. Comparison and Extension of Approximate 4-2 Compressors for Low-Power Approximate Multipliers. IEEE Trans. Circuits Syst. I Regul. Pap. 2020, 67, 3021–3034. [Google Scholar] [CrossRef]
  23. Park, G.; Kung, J.; Lee, Y. Design and Analysis of Approximate Compressors for Balanced Error Accumulation in MAC Operator. IEEE Trans. Circuits Syst. I Regul. Pap. 2021, 68, 2950–2961. [Google Scholar] [CrossRef]
  24. Kong, T.; Li, S. Design and Analysis of Approximate 4–2 Compressors for High-Accuracy Multipliers. IEEE Trans. Very Large Scale Integr. (VLSI) Syst. 2021, 29, 1771–1781. [Google Scholar] [CrossRef]
  25. Jou, J.M.; Kuang, S.R.; Chen, R.D. Design of low-error fixed-width multipliers for DSP applications. IEEE Trans. Circuits Syst. II Analog. Digit. Signal Process. 1999, 46, 836–842. [Google Scholar] [CrossRef] [Green Version]
  26. Petra, N.; De Caro, D.; Garofalo, V.; Napoli, E.; Strollo, A.G.M. Design of Fixed-Width Multipliers With Linear Compensation Function. IEEE Trans. Circuits Syst. I Regul. Pap. 2011, 58, 947–960. [Google Scholar] [CrossRef]
  27. Hashemi, S.; Bahar, R.I.; Reda, S. DRUM: A Dynamic Range Unbiased Multiplier for approximate applications. In Proceedings of the 2015 IEEE/ACM International Conference on Computer-Aided Design (ICCAD), Austin, TX, USA, 2–6 November 2015; pp. 418–425. [Google Scholar] [CrossRef]
  28. Vahdat, S.; Kamal, M.; Afzali-Kusha, A.; Pedram, M. TOSAM: An Energy-Efficient Truncation- and Rounding-Based Scalable Approximate Multiplier. IEEE Trans. Very Large Scale Integr. (VLSI) Syst. 2019, 27, 1161–1173. [Google Scholar] [CrossRef]
  29. Narayanamoorthy, S.; Moghaddam, H.A.; Liu, Z.; Park, T.; Kim, N.S. Energy-Efficient Approximate Multiplication for Digital Signal Processing and Classification Applications. IEEE Trans. Very Large Scale Integr. (VLSI) Syst. 2015, 23, 1180–1184. [Google Scholar] [CrossRef]
  30. Strollo, A.G.M.; Napoli, E.; De Caro, D.; Petra, N.; Saggese, G.; Di Meo, G. Approximate Multipliers Using Static Segmentation: Error Analysis and Improvements. IEEE Trans. Circuits Syst. I Regul. Pap. 2022, 69, 2449–2462. [Google Scholar] [CrossRef]
  31. Li, L.; Hammad, I.; El-Sankary, K. Dual segmentation approximate multiplier. Electron. Lett. 2021, 57, 718–720. [Google Scholar] [CrossRef]
  32. GitHub. Available online: https://github.com/scale-lab/DRUM (accessed on 18 April 2020).
  33. GitHub. Available online: https://github.com/astrollo/SSM (accessed on 16 February 2020).
  34. DataShare. Available online: https://datashare.ed.ac.uk/handle/10283/2791 (accessed on 21 August 2017).
Figure 1. Segmentation of the signal A with n = 16 bits and m = 10 bits.
Electronics 12 00446 g001
Figure 2. Approximate multiplier with (a) static segment method and (b) segmented multiplier with the correction technique of [30].
Electronics 12 00446 g002
Figure 3. Segmentation of the input A in the case n = 16 and m = 8 with (a) the ESSM method of [29] and (b) the proposed generalized ESSM method in the case q = 5.
Electronics 12 00446 g003
Figure 4. Block diagram of the proposed generalized ESSM multiplier.
Electronics 12 00446 g004
Figure 5. Mean square error on the input signal A as a function of m and q with (a) uniform distribution and half-normal distribution in the cases of (b) σ = 1024, (c) σ = 2048, and (d) σ = 16,384. In this example, A is an integer signal expressed on n = 16 bits.
Electronics 12 00446 g005
Figure 6. NoEB with respect to q for m = 8 and m = 10 for (a) uniform distributed inputs and for (b) half-normal distributed inputs (with σ = 2048). The number of bits of the inputs is n = 16.
Electronics 12 00446 g006
Figure 7. Kernel matrix for (a) the gaussian and (b) the motion filter. (c) Histogram of occurrences for the Mandrill image.
Electronics 12 00446 g007
Figure 8. Lena image filtered by means of segmented multipliers.
Electronics 12 00446 g008aElectronics 12 00446 g008b
Figure 9. (a) Module of the impulse response of the low-pass FIR filter and (b) histogram of occurrences of the audio signal.
Electronics 12 00446 g009
Figure 10. MSE between the approximate and the exact results. The MSE for gESSM m = 8 and m = 10 are highlighted in violet and red, respectively.
Electronics 12 00446 g010
Figure 11. P(AM) and P(AH) for (a) the uniform distribution and the half-normal distribution in the cases (b) σ = 2048 and (c) σ = 16,384.
Electronics 12 00446 g011
Figure 12. In the case of uniform distribution: (a) NMED vs. Power saving and (b) MRED vs. Power saving. In the case of half-normal distribution (σ = 2048): (c) NMED vs. Power saving and (d) MRED vs. Power saving.
Electronics 12 00446 g012
Table 1. Left-shift for the ESSM multiplier.
αAH, αAM, αBH, αBMSHessm
(0000)0
(0001), (0100)(nm)/2
(0010), (0011), (0101), (1000), (1100)n − m
(0110), (0111), (1001), (1101)(3/2)·(nm)
(1010), (1011), (1110), (1111)2·(nm)
Table 2. Left-shift for the generalized ESSM multiplier.
αAH, αAM, αBH, αBMSHessm
(0000)0
(0001), (0100)q
(0101)q
(0010), (0011), (1000), (1100)nm
(0110), (0111), (1001), (1101)nm + q
(1010), (1011), (1110), (1111)2·(nm)
Table 3. Probability of selecting AM and AH as a function of the input distribution.
Input Stochastic DistributionP(AM)P(AH)
Uniform 1 2 n 1 · ( 2 m + q 2 m ) 1 2 n 1 · ( 2 n 1 2 m + q )
Half-normal e r f ( 2 m + q σ 2 ) e r f ( 2 m σ 2 ) e r f ( 2 n 1 σ 2 ) e r f ( 2 m + q σ 2 )
Table 4. Error metrics of the investigated multipliers for n = 16 bits.
Multiplier Uniform DistributionHalf-Normal Distribution (σ = 2048)
NMEDMREDNoEBNMEDMREDNoEB
SSM [29]m = 81.93 ×·10−32.08 × 10−28.88.29 × 10−51.87 × 10−113.1
m = 104.73 × 10−43.99 × 10−310.81.46 × 10−51.96 × 10−215.3
cSSM [30]m = 86.70 × 10−49.49 × 10−310.28.28 × 10−51.87 × 10−113.1
m = 101.63 × 10−41.73 × 10−312.21.46 × 10−51.96 × 10−215.3
TOSAM [28]h = 32.69 × 10−31.05 × 10−27.86.24 × 10−69.98 × 10−316.4
h = 41.34 × 10−35.27 × 10−38.83.13 × 10−65.02 × 10−317.3
DRUM [27]k = 41.41 × 10−25.89 × 10−25.53.85 × 10−56.20 × 10−213.7
k = 63.51 × 10−31.46 × 10−27.59.53 × 10−61.52 × 10−215.7
k = 88.82 × 10−43.66 × 10−39.52.39 × 10−63.68 × 10−317.7
HSM [31]p = 81.47 × 10−21.03 × 10−15.53.53 × 10−47.05 × 10−111.0
p = 107.15 × 10−33.72 × 10−26.51.02 × 10−41.70 × 10−112.3
p = 123.51 × 10−31.56 × 10−27.59.76 × 10−63.92 × 10−215.7
Qiqieh [16]L = 22.43 × 10−42.88 × 10−311.01.90 × 10−53.27 × 10−214.0
L = 41.12 × 10−25.90 × 10−25.75.78 × 10−58.35 × 10−212.8
Kulkarni [13] 1.39 × 10−23.32 × 10−24.71.28 × 10−51.74 × 10−214.1
AHMA [19] 2.14 × 10−21.18 × 10−14.91.65 × 10−42.42 × 10−111.3
gESSMm = 8, q = 51.73 × 10−39.68 × 10−38.81.06 × 10−52.55 × 10−216.1
m = 8, q = 71.45 × 10−31.19 × 10−29.14.24 × 10−59.93 × 10−214.1
m = 10, q = 34.26 × 10−42.22 × 10−310.91.64 × 10−62.21 × 10−318.5
m = 10, q = 53.55 × 10−42.30 × 10−311.17.24 × 10−69.73 × 10−316.3
Table 5. Hardware implementation results of the investigated multipliers for n = 16 bits.
Multiplier Minimum Delay [ps]Area [µm2]Equivalent NAND CountPower @1GHz
(Uniform Input)
Power @1GHz
(Half-Normal Input)
Exact 336791.312561300.3721.8
SSM [29]m = 8272 (−19.0%)190.1 (−76.0%)302201.4 (−84.5%)77.6 (−89.2%)
m = 10313 (−6.8%)308.6 (−61.0%)490346.8 (−73.3%)281.8 (−61.0%)
cSSM [30]m = 8272 (−19.0%)197.4 (−75.0%)313214.7 (−83.5%)85.6 (−88.1%)
m = 10313 (−6.8%)352.3 (−55.5)559395.0 (−69.6%)358.6 (−50.3%)
TOSAM [28]h = 3311 (−7.4%)341.2 (−56.9%)542367.1 (−71.8%)394.5 (−45.3%)
h = 4335 (−0.3%)494.9 (−37.4%)786582.4 (−55.2%)613.5 (−15.0%)
DRUM [27]k = 4257 (−23.5%)126.5 (−84.0%)201155.9 (−88.0%)171.8 (−76.2%)
k = 6357 (+6.3%)241.9 (−69.4%)384389.1 (−70.1%)377.4 (−47.7%)
k = 8365 (+8.6%)414.3 (−47.6%)658691.1 (−46.9%)656.2 (−9.1%)
HSM [31]p = 8251 (−25.3%)112.9 (−85.7%)179137.3 (−89.4%)115.7 (−84.0%)
p = 10354 (+5.4%)204.8 (−74.1%)325306.3 (−76.4%)339.6 (−53.0%)
p = 12364 (+8.3%)347.1 (−56.1%)551538.2 (−58.6%)582.8 (−19.3%)
Qiqieh [16]L = 2262 (−22.0%)440.8 (−44.3%)700578.6 (−55.5%)330.9 (−54.2%)
L = 4218 (−35.1%)271.9 (−65.6%)432385.8 (−70.3%)241.6 (−66.5%)
Kulkarni [13] 289 (−14.0%)508.9 (−35.7%)808620.4 (−52.3%)364.7 (−49.5%)
AHMA [19] 208 (−38.1%)282.4 (−64.3%)448327.5 (−74.8%)252.1 (−65.1%)
gESSMm = 8, q = 5312 (−7.1%)235.6 (−70.2%)347289.9 (−77.7%)210.63 (−70.8%)
m = 8, q = 7293 (−12.8%)226.0 (−71.4%)359284.4 (−78.1%)122.20 (−83.1%)
m = 10, q = 3327 (−2.7%)393.4 (−50.3%)624510.9 (−60.7%)524.8 (−27.3%)
m = 10, q = 5329 (−2.1%)420.2 (−46.9%)667602.0 (−53.7%)494.6 (−31.5%)
Table 6. Accuracy performances of the investigated multipliers in image processing applications.
Multiplier Gaussian FilterMotion FilterAverage
SSIMPSNR (dB)SSIMPSNR (dB)SSIMPSNR (dB)
SSM [29]m = 81.00042.61.00042.71.00042.6
m = 101.00053.41.00055.21.00054.3
cSSM [30]m = 81.00058.41.00054.71.00056.5
m = 101.00068.51.00067.61.00068.0
TOSAM [28]h = 31.00048.80.99954.80.99951.8
h = 41.00063.91.00063.41.00063.7
DRUM [27]k = 40.98435.70.98037.90.98236.8
k = 60.99951.70.99948.90.99950.3
k = 81.00064.81.00062.81.00063.8
HSM [31]p = 80.98235.70.97836.00.98035.8
p = 100.99645.20.99445.70.99545.5
p = 120.99951.70.99948.90.99950.3
Qiqieh [16]L = 21.00063.91.00065.01.00064.5
L = 40.98232.00.98131.20.98131.6
Kulkarni [13] 0.99339.20.99742.60.99540.9
AHMA [19] 0.95025.30.94825.40.94925.4
gESSMm = 8, q = 51.00044.41.00045.51.00045.0
m = 8, q = 71.00047.11.00046.31.00046.7
m = 10, q = 31.00053.71.00057.41.00055.5
m = 10, q = 51.00060.01.00060.41.00060.2
Disclaimer/Publisher’s Note: The statements, opinions and data contained in all publications are solely those of the individual author(s) and contributor(s) and not of MDPI and/or the editor(s). MDPI and/or the editor(s) disclaim responsibility for any injury to people or property resulting from any ideas, methods, instructions or products referred to in the content.