1. Introduction
Nowadays, increasing urbanization and transformation of natural ecosystems result in frequent contact between humans and wild animals. The traditional approach in such cases cannot be applied—there is not enough light for RGB imaging. The development of thermal imaging technology and its wide availability has allowed people to survey and observe animals after dark. Most of the current research is in the field of wildlife taxation using drones, which allow a rough estimate of a species’ population [
1]. This technique reduces the problem to localization of animal silhouettes on images and then binary classification if the Region of Interest (RoI) is a true animal. Unmanned aerial vehicles are also used for other environmental research, such as precision agriculture [
2]. However, when estimating the range of occurrence and studying the spread of invasive species, this approach is too inaccurate: it suffers from low accuracy, high error rate, etc. The minimum altitude from which observations can be made so as not to frighten the animals is several tens of meters. This is too high for interspecies classification. It is too high for interspecies classification. Therefore, surveillance should be conducted from the ground. Moreover, recognizing objects in the images should be as autonomous as possible to reduce the work time of experts. This paper addresses the issue of automatic animal finding in images. The main goal is to compare existing methods to select the best one for further study of the above-mentioned issue. The development of an accurate method for classifying animals based on the analysis of thermal camera images is an extremely important issue in the field of animal observation and management of livestock populations. Vision systems capable of identifying animals are critical in enhancing the safe movement of autonomous vehicles, reducing the risk of collisions [
3].
There are two fundamental problems in automating object detection: locating potentially RoI regions, and transforming a multivariate tensor into a classifiable feature vector. Two approaches are considered in undiminished work. One of the most popular concepts related to finding potential areas containing objects is the sliding window approach relative to the image. However, this method is very time-consuming and computationally expensive. Images from a thermal imaging camera are monochromatic, significantly simplifying their semantic analysis based on more efficient algorithmic methods. After literature analysis and testing, it was decided to use the Falzenszwalb algorithm [
4] to search for regions of interest. Subsequently, the found regions were subjected to the operation of determining the Histogram of Oriented Gradients (HOG) [
5], which in the final stage made it possible to assign classes using a trained Support Vector Machine (SVM) [
6].
The problem of identifying and classifying animals using advanced algorithms has been addressed in many studies. The paper [
7] demonstrates the use of a pre-trained FasterRCNN + InceptionResNetV2 network to classify European mammals with a 94% detection accuracy and a 71% species classification accuracy. The authors [
8] conducted a comparative analysis of the pre-trained Faster R-CNN and RetinaNet models in the detection and classification of bear and deer. The mAP evaluation suggested that both models successfully learned to detect “boar” and “deer” with average precision exceeding 25%. The paper [
3] presents the comparison of three types of CNN (basic CNN, VGG16, HOG + CNN) and the machine learning classifiers based on thermal images and HOG transformation. Obtained results of accuracy indicate the most efficient technique for the detection of wild animals was a combination of HOG + CNN—91%. The study [
9] provides a novel method for classifying images under semi-supervised learning (SSL) or few-shot learning (FSL) conditions. The authors propose a solution based on using only the generator (decoder) network separately for each class that has shown to be effective for both SSL and FSL, which has shown improvements of 3.04% and 1.50% in terms of average accuracy relative to reference models.
The authors of [
10] present a WilDect-YOLO detection model for accurate real-time endangered wildlife detection, based on a YOLO v4. WilDect-YOLO integrates DenseNet blocks to improve preserving critical feature information and reuse to detect distinct eight different endangered wildlife species that provide superior and accurate detection under various complex and challenging environments. Evaluation has found that at a detection rate of 59.20 FPS, WilDect-YOLO achieved mAP, F1-score, and precision values of 96.89%, 97.87%, and 97.18%, respectively, in detecting various wildlife species. A real-time object detection model developed on the YOLOv4 algorithm was presented in paper [
11], which described detecting four different diseases in tomato plants under various challenging environments. At a detection rate of 70.19 FPS, the proposed model obtained a precision value of 90.33%, an F1-score of 93.64%, and a mean average precision (mAP) value of 96.29%.
The study [
12] presented a highly accurate K-complex detection system. Efficiency evaluation was performed using the deep transfer learning feature extraction model, and the result indicated consistently high values (i.e., up to 99.8% precision and 0.2% miss rate) over different testing scenarios.
A highly accurate K-complex detection system, based on a multiple convolutional neural network and YOLO v3 was described in the paper [
13]. The model performed consistently high precision (89.84–99.44%) and had a miss rate of (10.41–0.55%).
In parallel, the results obtained for popular architectures of convolutional neural networks were tested. In this context, a transfer learning approach was used—that is, for the previously trained YOLOv3 [
13] and Faster R-CNN [
14,
15] models, a tuning process was initiated to adapt the network parameters to a specific problem. The dataset on which the results were evaluated was created from scratch. The results of the two proposed approaches were compared based on mean Average Precision (mAP) for different Intersection over Union (IoU) coverage thresholds and sensitivity (Recall).
2. Materials and Methods
2.1. Dataset
It should be emphasized that the main problem in building effective detection models is a correctly labelled dataset. In the case of the present problem, no publicly available materials met the requirements. For this reason, a dataset containing thermal images of two families of animals was created: cervids (Cervidae), which included images of red deer (Cervus elaphus), European roe deer (Capreolus capreolus), and fallow deer (Dama dama), denoted hereafter as the “deer” class, and swine, which mainly included images of European wild boar (Sus scrofa), denoted hereafter as the “wild_boar” class.
A Pulsar Helion 2 XP50 PRO camera was used to create the dataset. Part of the data was obtained from private collections courtesy of Polish hunters. The LabelIMG program [
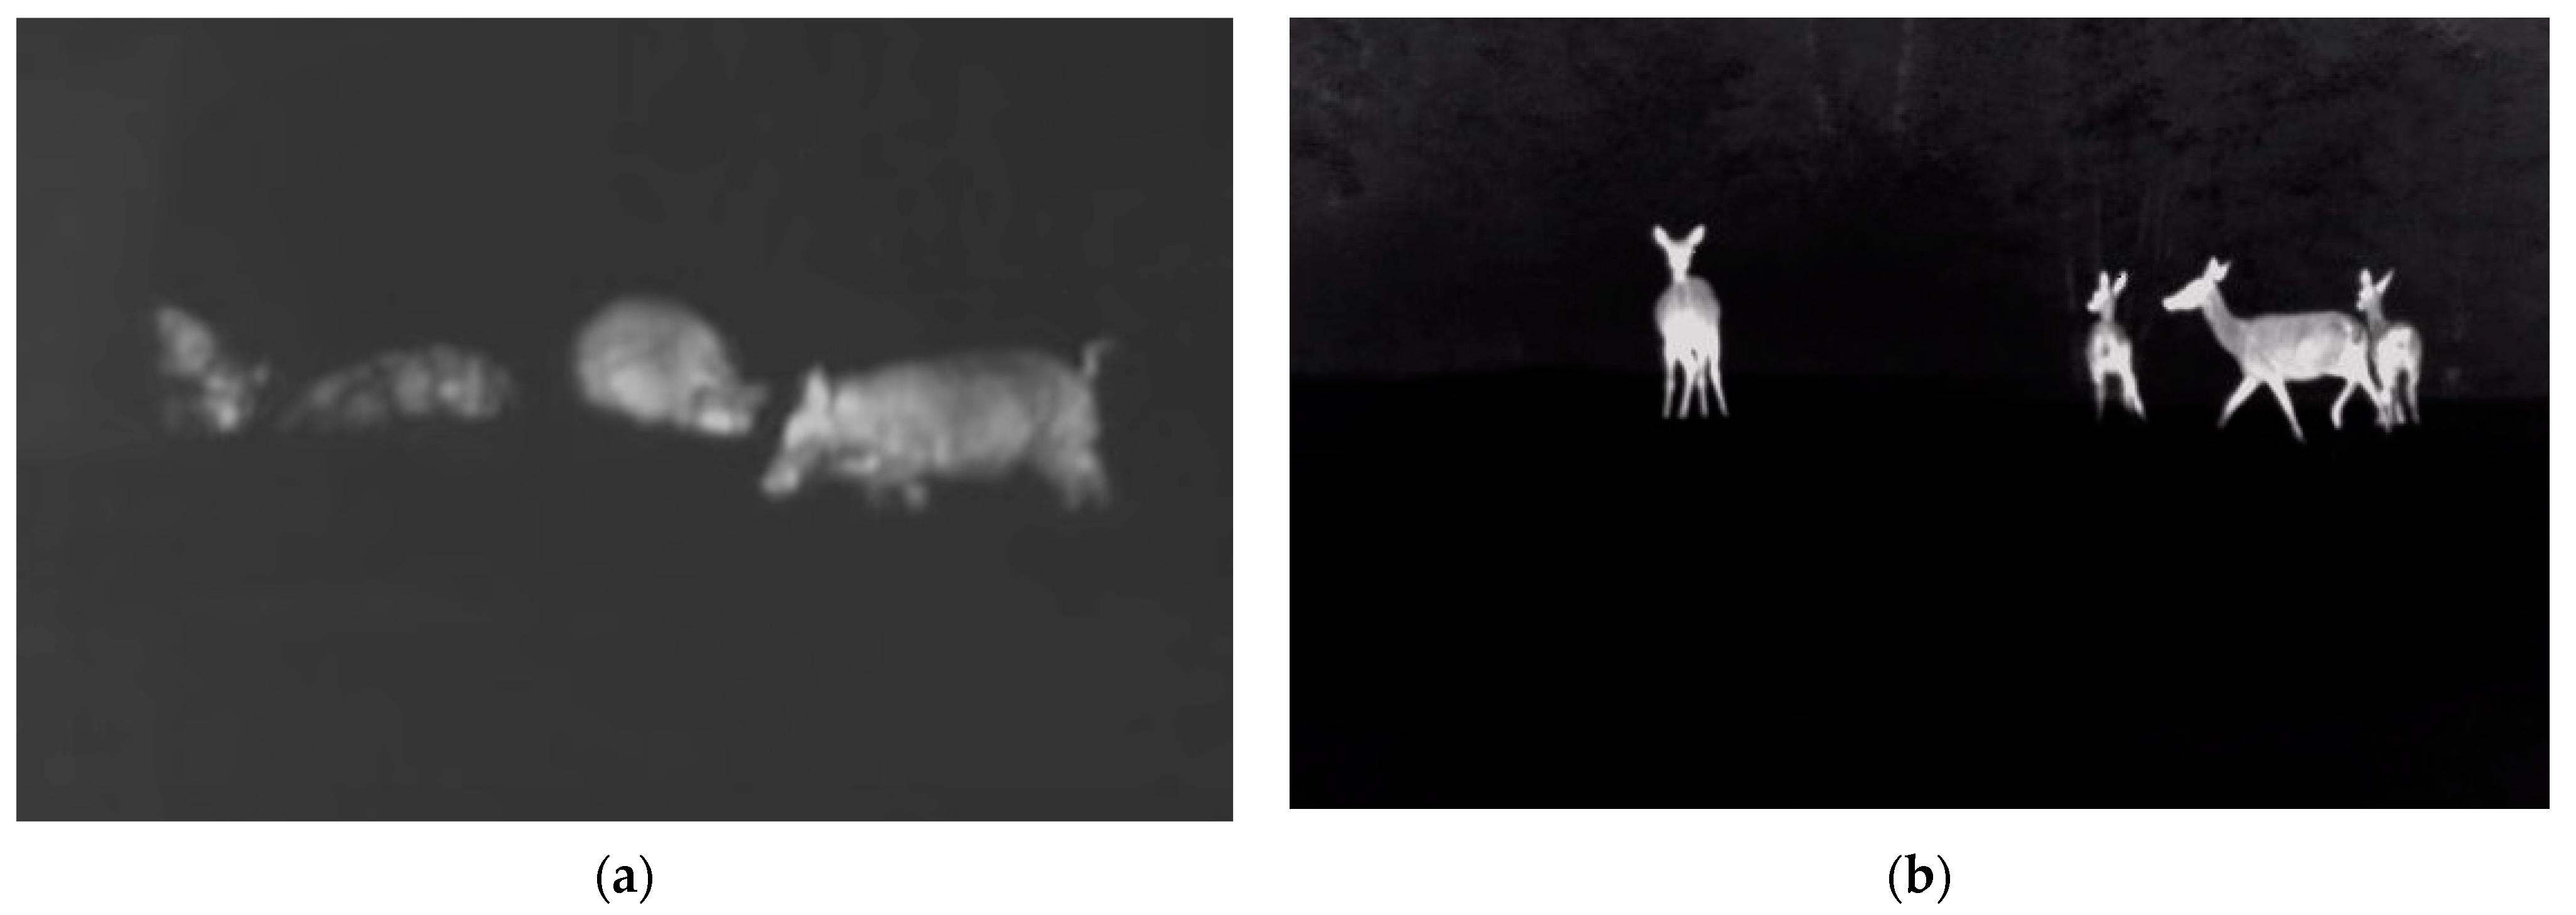
16], which generates xml files with bounding box parameters, was used to mark objects on the images. The results presented in this paper were obtained on a dataset of 400 monochrome images—250 containing objects from the “deer” class and 150 from the “wild_boar” class. Example images are shown in
Figure 1. Each image contained at least one instance of an object, but usually, there were few animals. It should be noted that all images included in the dataset contain instances for detection, although there was usually more than one. The “deer” category contained 332 subjects (different animals) in whole dataset, while “wild_boar” had 561. The dataset was split into a training part (85% of the images) with 6-fold cross-validation in the learning process. The remaining test part (15% of the images) was separated from the training process and served as the final performance value of the method.
2.2. HOG/SVM
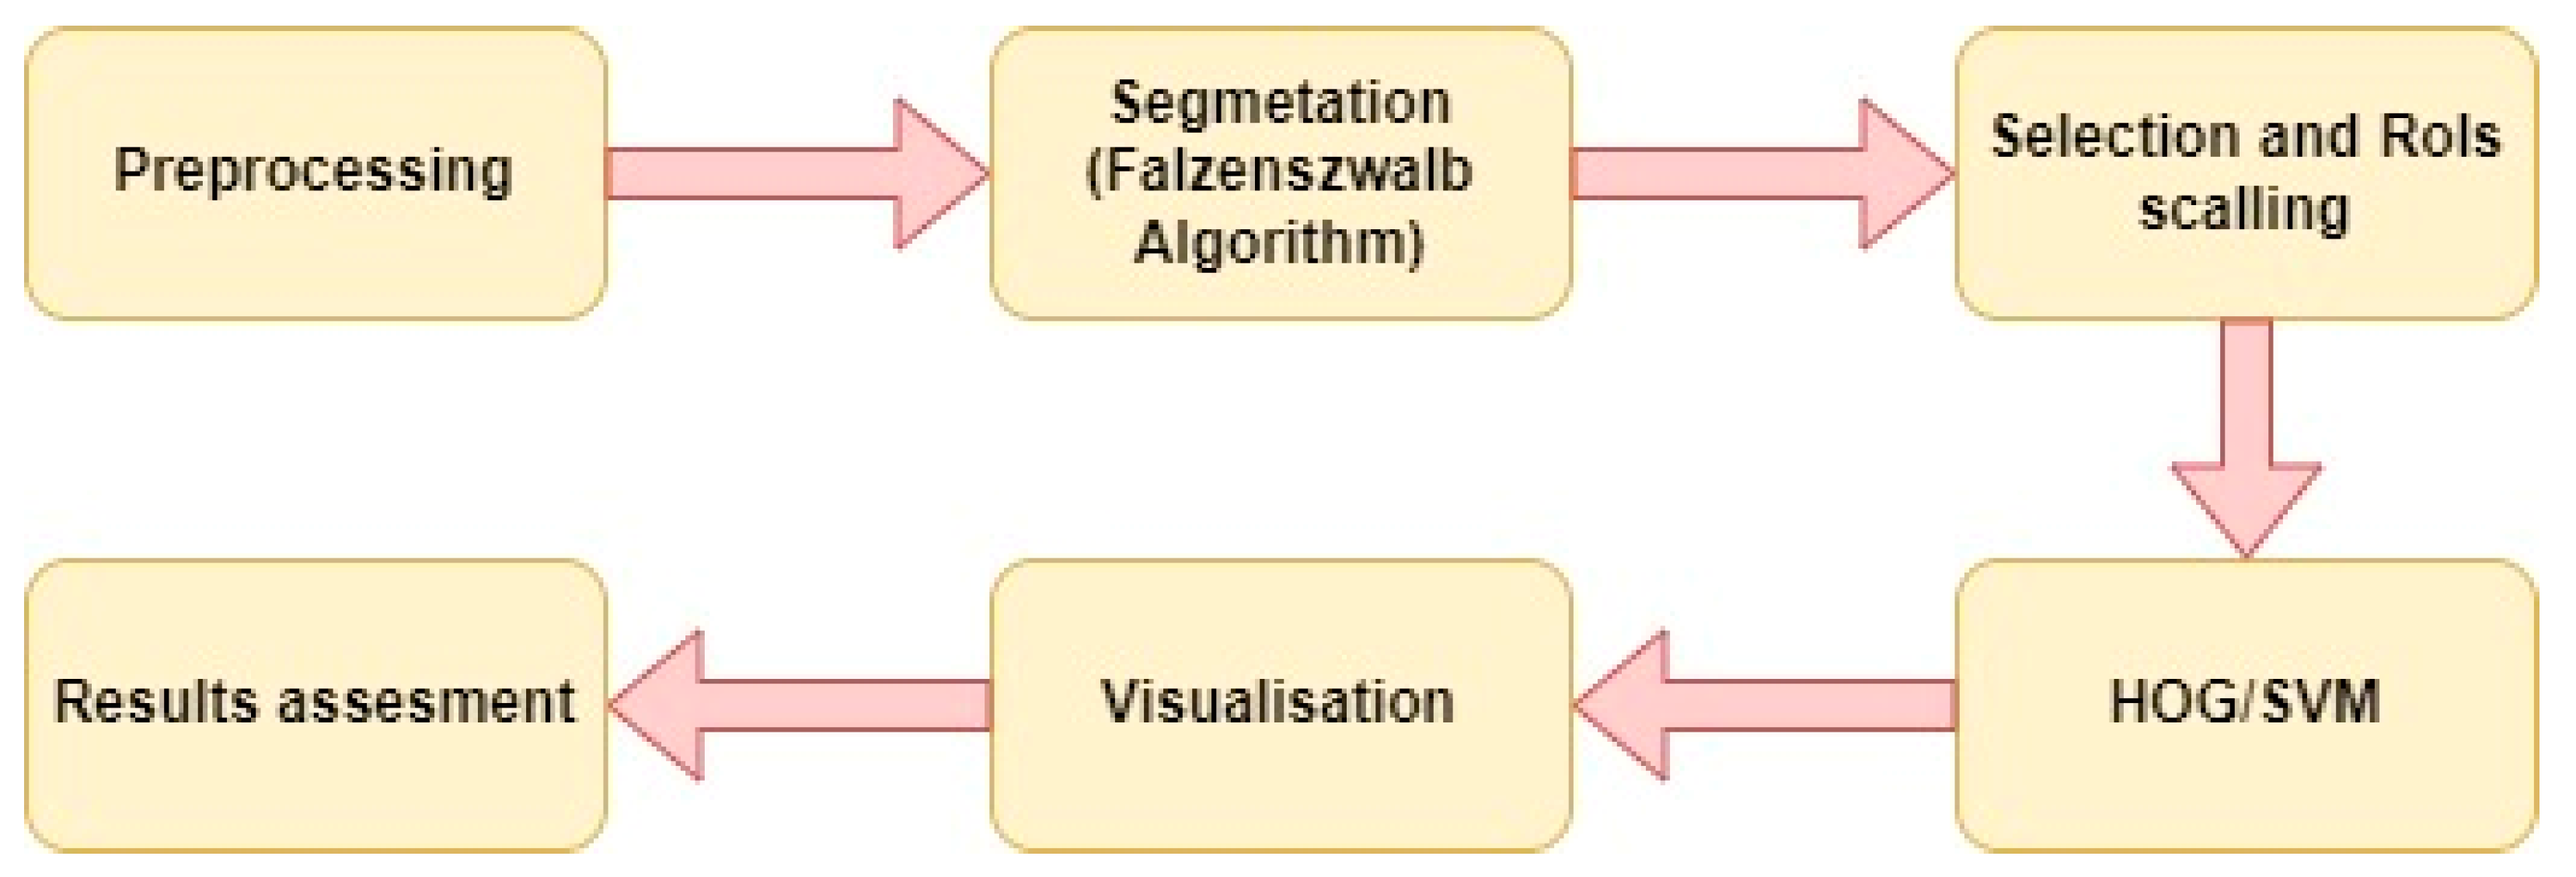
The flowchart in
Figure 2 shows the algorithm depicting the detection process using classical methods.
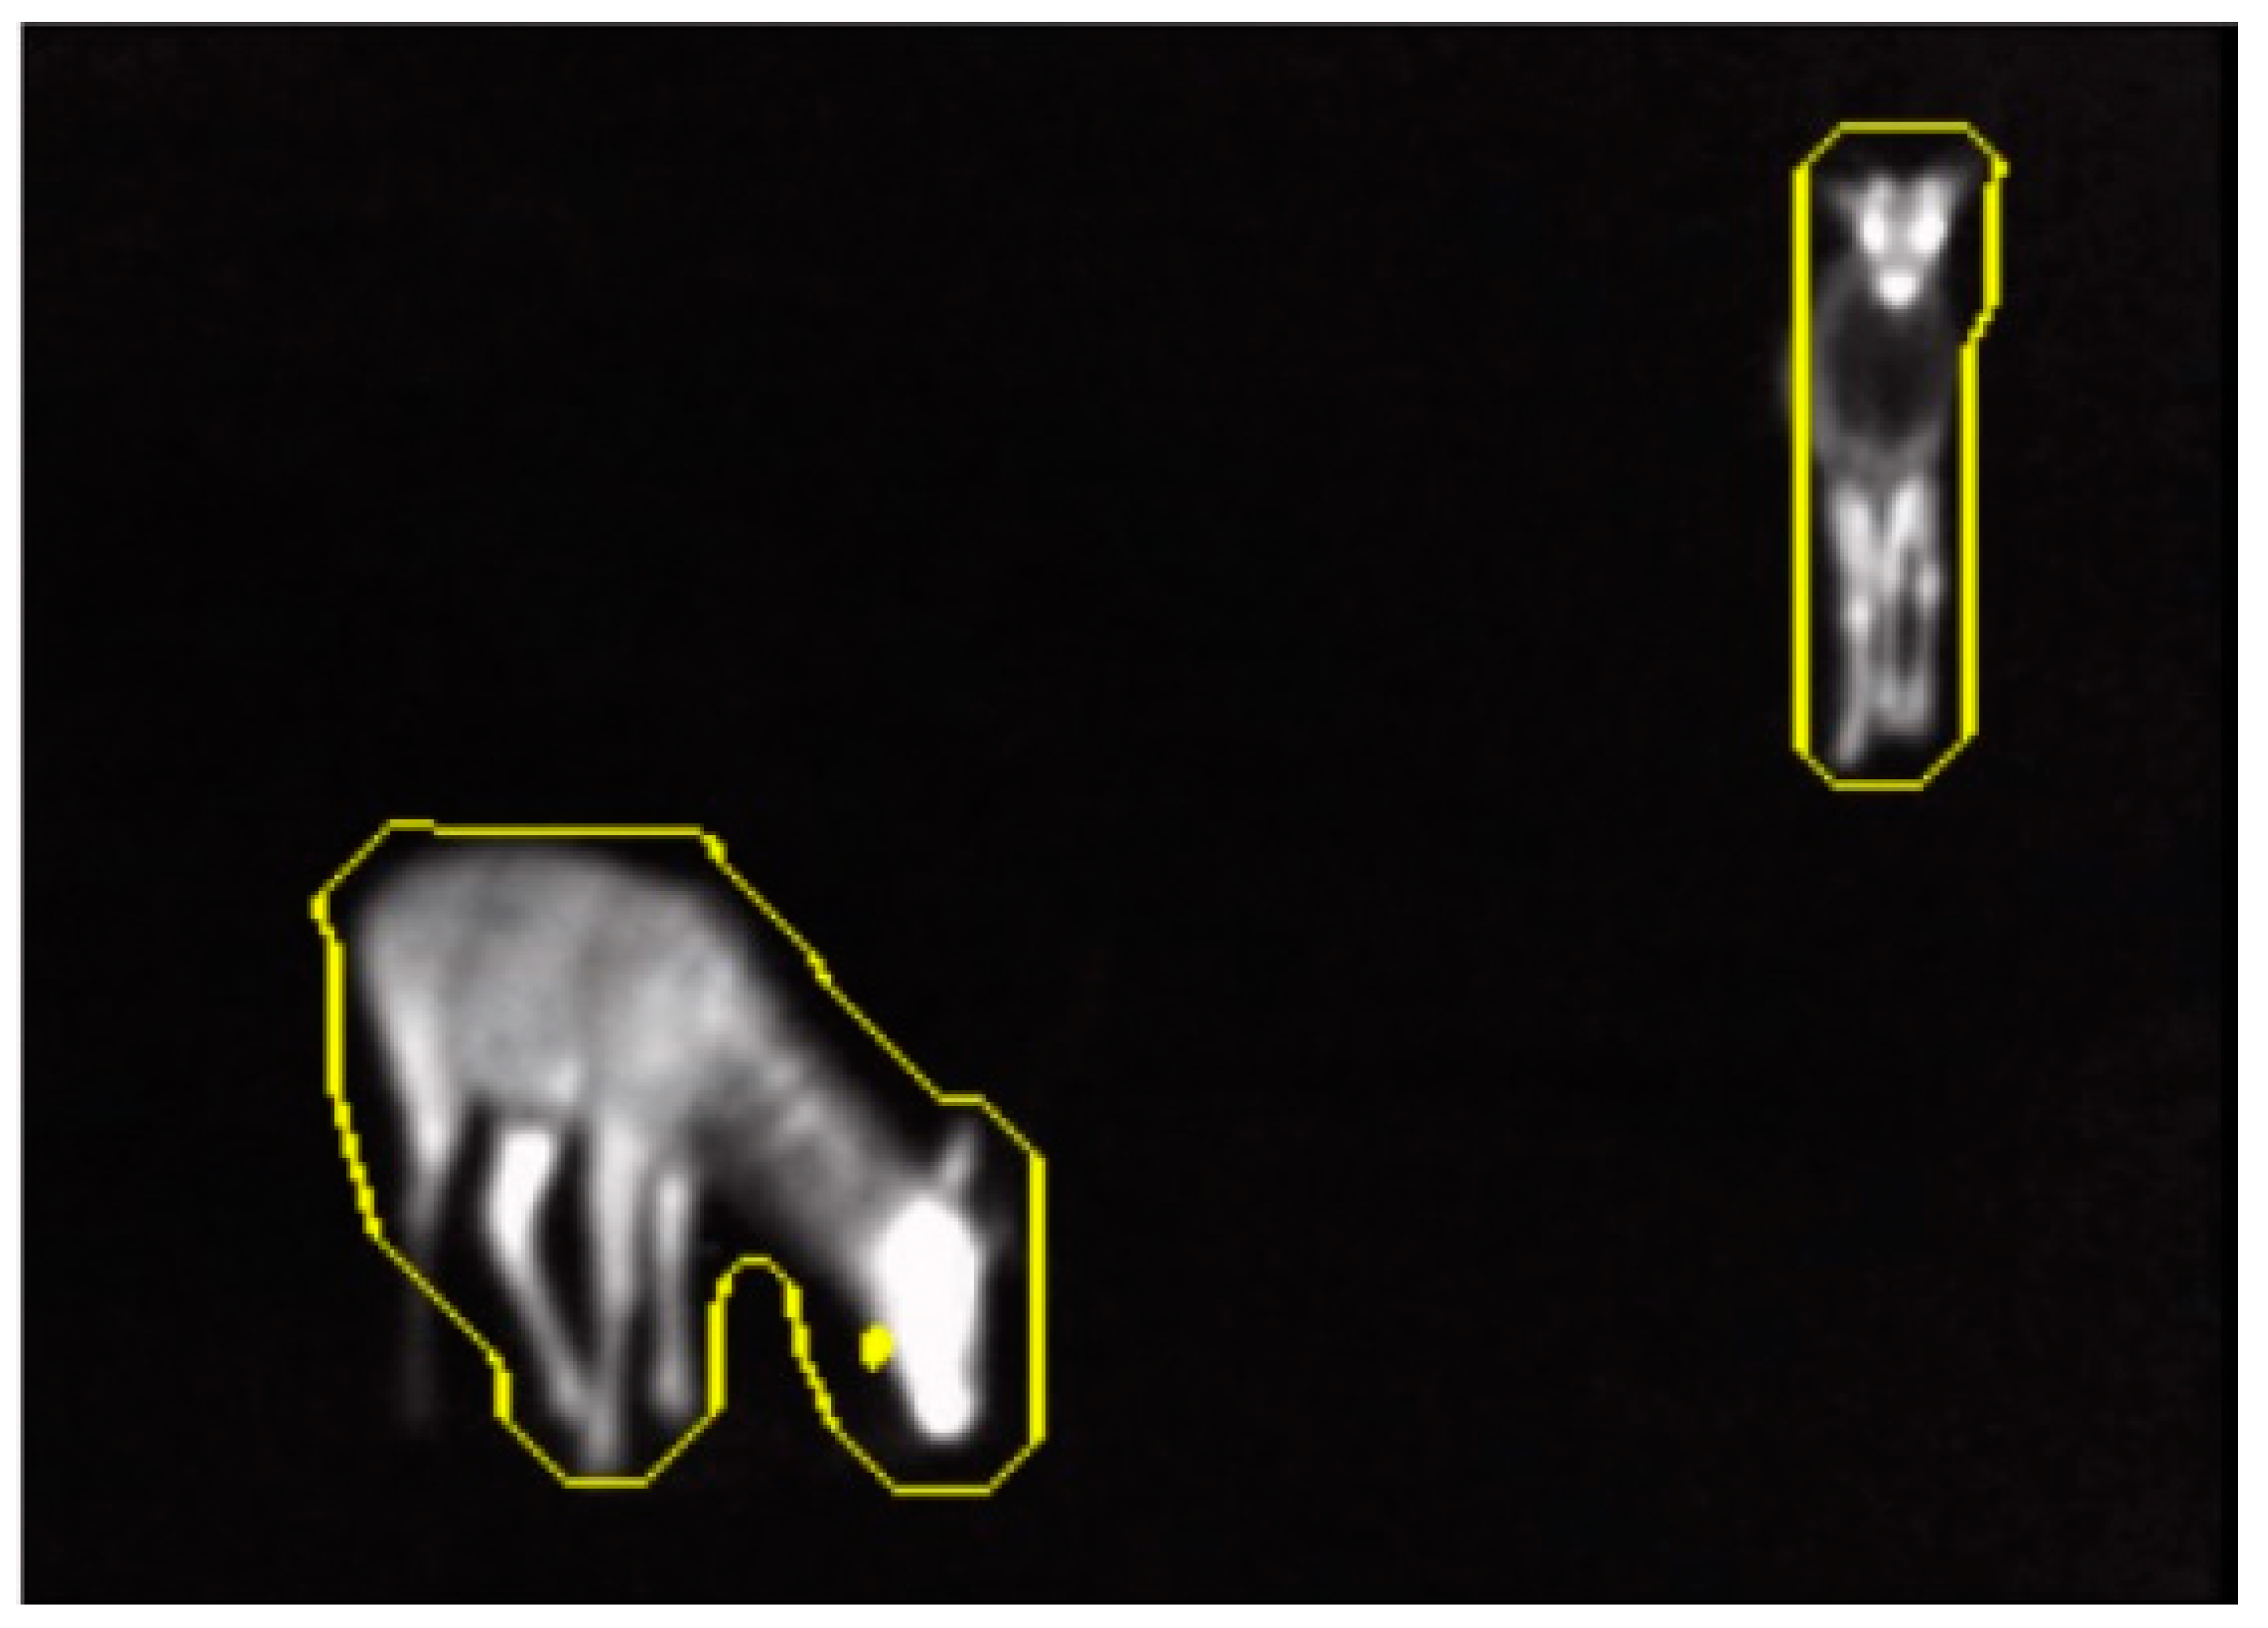
The first step was preprocessing the images, i.e., removing artifacts and symbols that different cameras leave in the images. The next step found regions of interest with potential objects. Since the thermal camera images are monochromatic, it was decided to use segmentation based on the Falzenszwalb algorithm, which groups pixels of similar brightness. The result of semantic segmentation with the Falzenszwalb algorithm is depicted in
Figure 3.
The segments thus determined were then transformed into rectangles based on the extreme pixels. The first selection process was then performed—elements that were too small (less than 100 pixels) were rejected, as were those whose length-to-width ratio significantly deviated from the value of 1 (animals in the images fit into an envelope that is close to a square). The objects selected in this way were first transformed to equal length and width, then scaled to 128 × 128 pixels. Since the images’ nature allows the objects’ edges to be captured unambiguously, it was decided to calculate the feature vector for subsequent classification based on a histogram of oriented gradients. This technique counts the occurrence of a particular brightness gradient orientation in a localized portion of the image. As a result, a given area of the image can be represented as a one-dimensional vector, making it possible to use a support vector machine as a classifier. To train the classifier, 30 examples from each class were specially prepared. The Scikit-Image library [
17] was used to implement the Falzenszwalb, HOG, and SVM algorithms. The final step was the evaluation and visualization of the results to assess the performance of the entire method. The tests were performed on an Acer Nitro AN515-31 on CPU (Intel(R) Core(TM) i5-8250U) with the Windows 11 operating system.
2.3. Convolutional Neural Networks
In recent years, approaches based on deep neural networks have gained wide popularity in the context of object analysis in digital images. Most of the currently used solutions are based on tuning network parameters (finetuning), which are pretrained on huge datasets. This approach allows good results with a small number of training examples simultaneously. It should be noted, however, that models are most often trained on ordinary RGB images, which means that using them for issues with other image characteristics can end up in failure. This study uses two popular architectures: Faster R-CNN and YOLOv3.
R-CNN is a faster network whose operation is based on breaking an image into multiple layers in search of features, then using RPN (Region Proposal Network) to find areas that are potential objects, and finally classifying them and determining the envelope. During the tests, implementations for Faster R-CNN from the Detectron2 Model Zoo library [
18] were used with the backboned R_50_FPN. The StandardRPNHead with an anchor number of 4 and 3 aspect ratio was used.
YOLOv3 skips the search for maps of regions of interest from the perspective of the problem. A grid is generated for the input image. Then the envelopes are matched. This approach, as opposed to a sliding window over the extracted feature maps, allows the YOLO model to avoid the confusion of a false-positive result for the background, as well as a holistic view of the image. For the tests in this paper, a pretrained YOLO architecture from the Darknet library was used [
19].
It should be noted that the architectures used were virtually fully default in terms of the choice of parameters such as number of anchors and location of feature extraction heads. This should be explained by the fact that this is a first approach to the problem and the aim was to select an optimal method rather than to optimize a specific one. Since training a network is computationally very expensive, the Google Colab application [
20] was used. It allows the free use of virtual machines containing GPUs and enables the rapid training of implemented solutions. The hardware utilized for training was NVIDIA V100 Tensor Core GPU.
3. Results
Tests were conducted for different configurations of network tuning hyperparameters. The main variables were the learning rate (Lr), which is responsible for regulating the rate of change of coefficients within the network, and the number of iterations, which is responsible for the learning time of the network. The initial levels of hyperparameter values were determined experimentally. Metrics measuring the precision and sensitivity of the model were used to assess detection accuracy. A general formula for precision averaged between classes:
where t is the minimum threshold of coverage of the envelope determined by the model with the reference envelope to consider the object as correctly found, n is the number of classes, TP is the number of correctly determined objects, and FP is the number of false positives. In the case of sensitivity, the formula can be presented in the form:
with the difference that FN stands for the number of false negative cases. The dataset was divided into three parts: training (70%), validation (20%), and test (10%). The test part was utilized only for determining the final score of the method. The final results are shown in
Table 1.
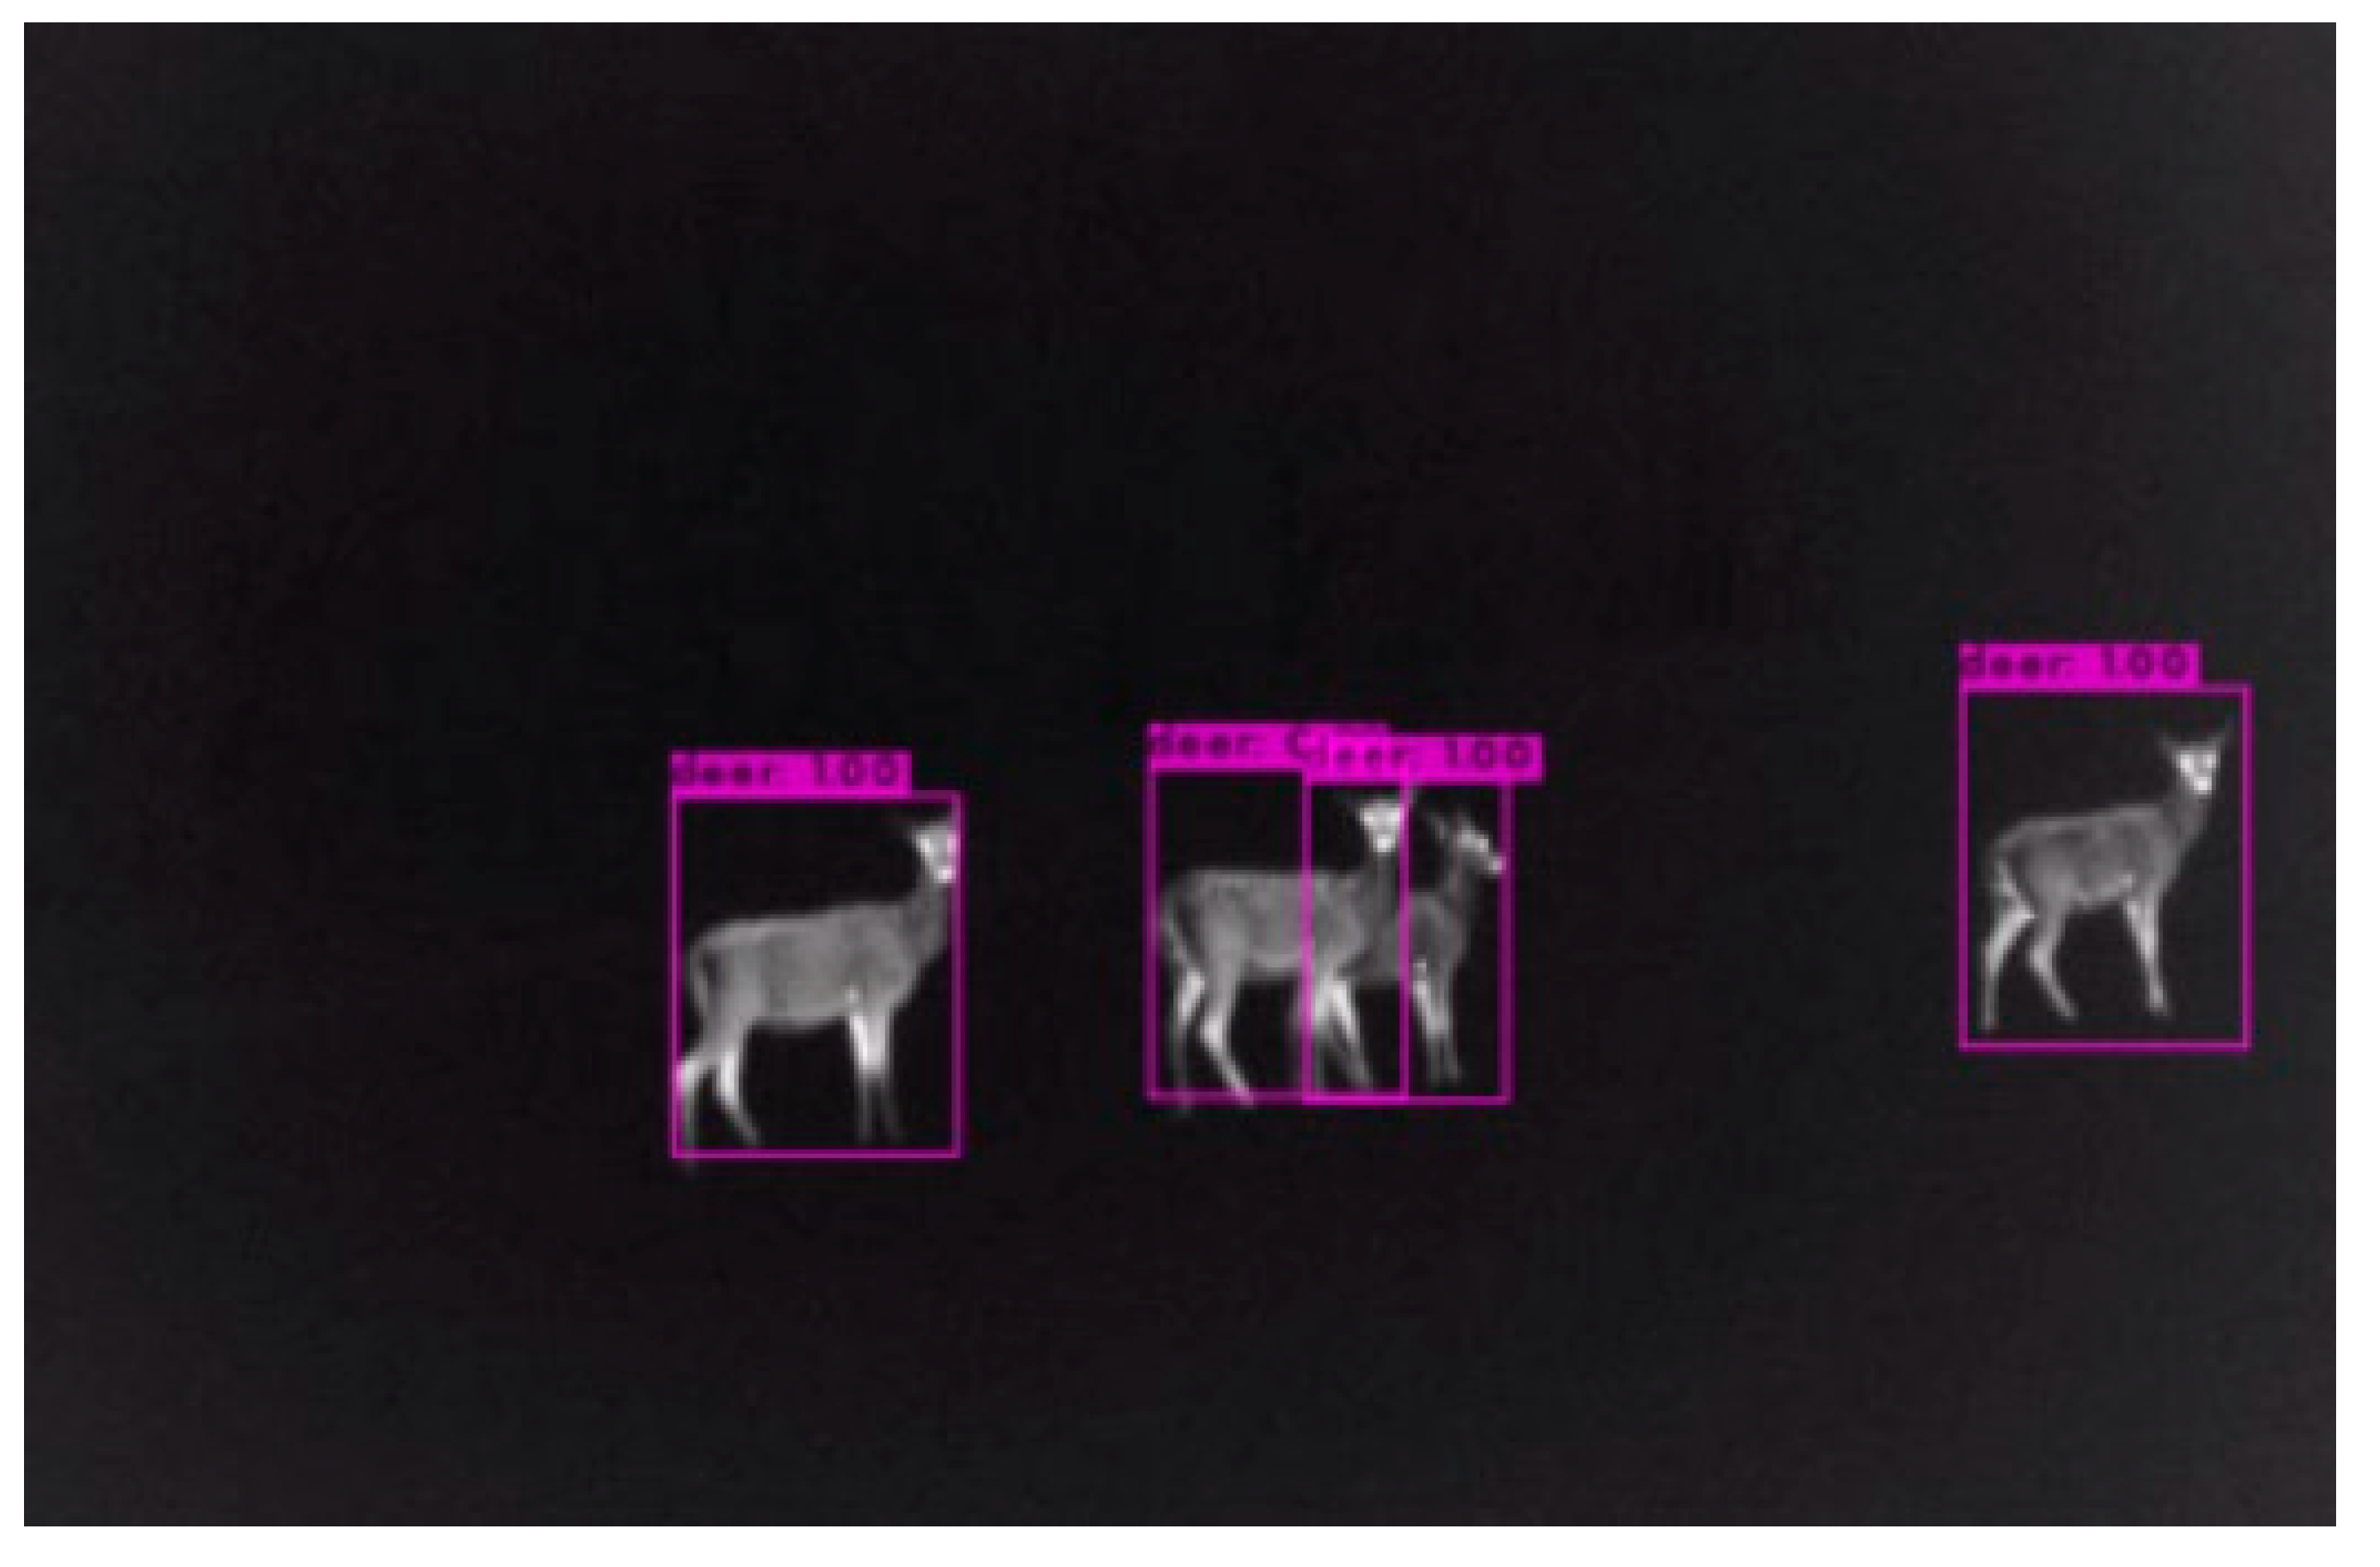
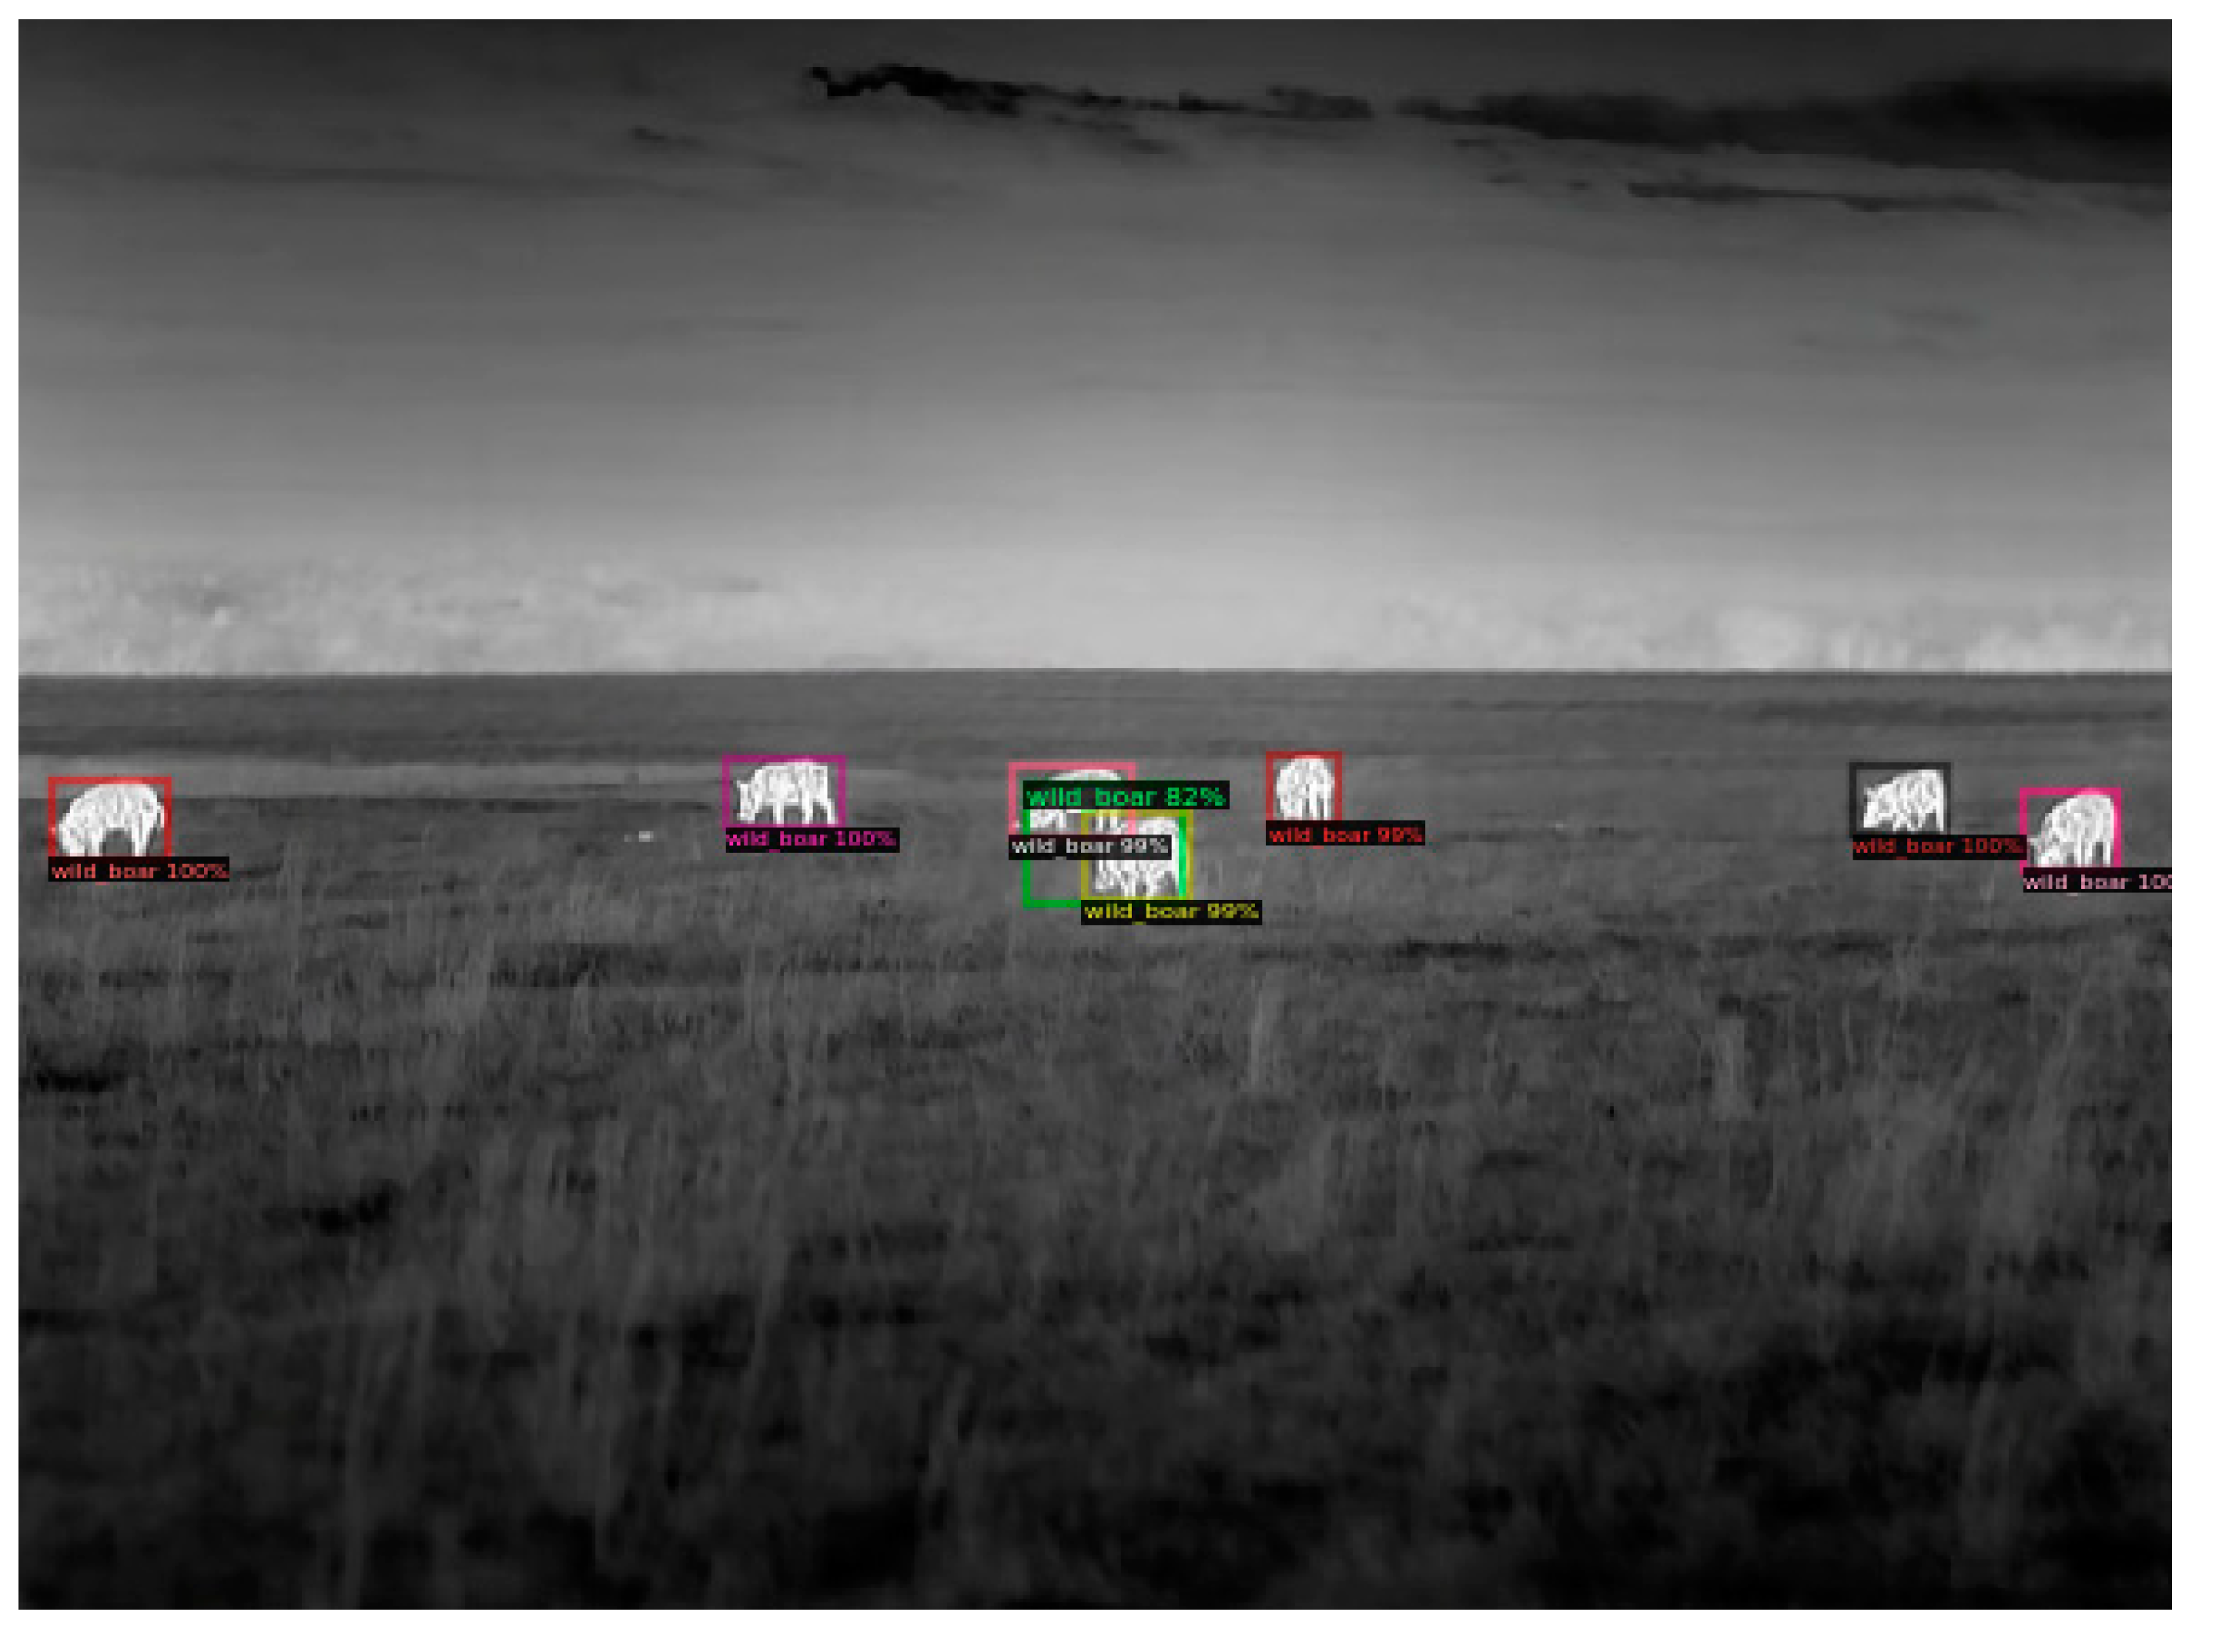
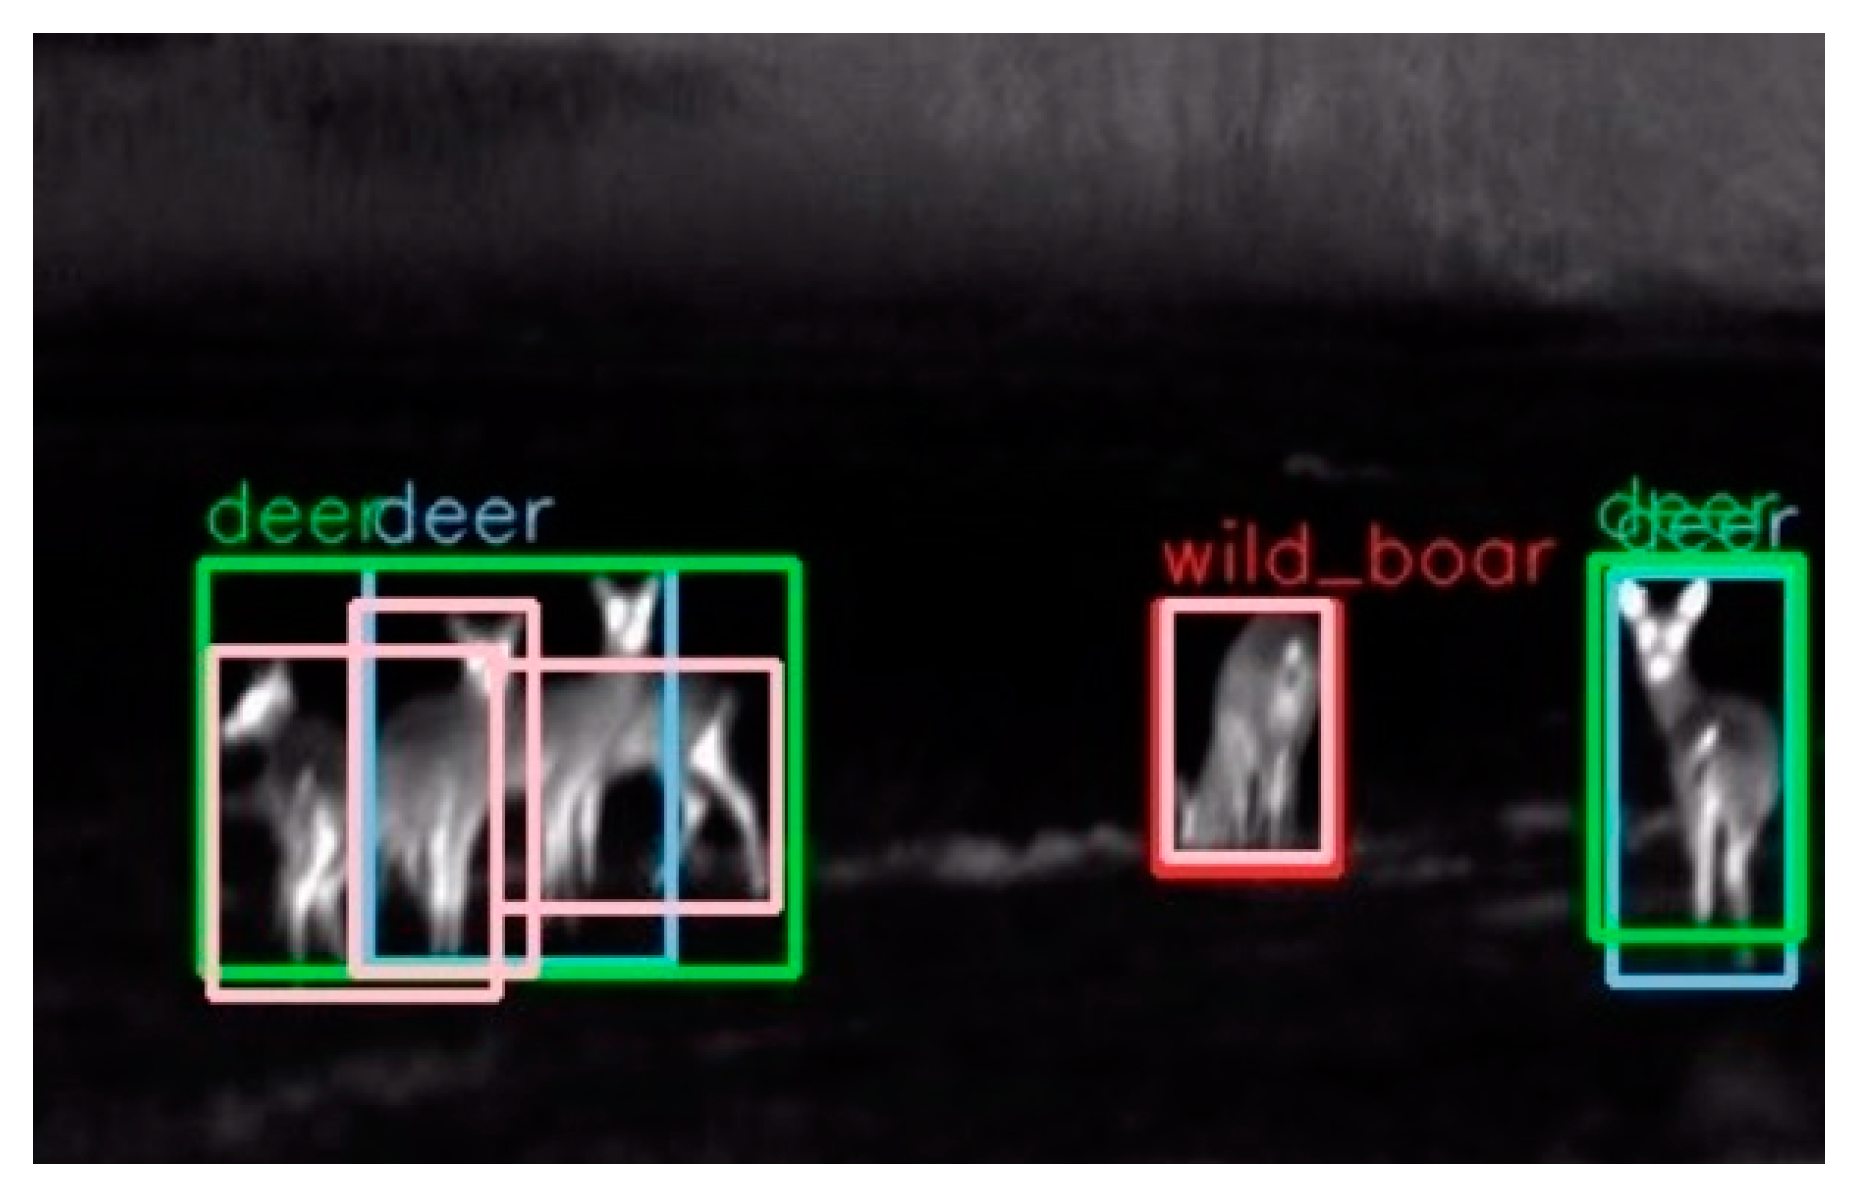
The visualization in
Figure 4 and
Figure 5 shows the generation of a bounding box around the silhouettes of the animals found and the probability that they belong to a given class.
4. Discussion
As can be seen, despite the ease of SVM training evident in the duration, the classical approach strongly deviates from the metrics results determining the correctness of classification obtained for both neural networks. The main problem observed through visualization of the detection result is the lack of uniformity of brightness of animal silhouettes. This can be well observed in
Figure 6. The images’ characteristics and the animals’ objects cause the occurrence of inhomogeneity of brightness of the whole body in the image. Changing the brightness of the image during preprocessing does not affect the quality of the results. When different binarization thresholds are set, this often distorts animal silhouettes to such an extent that they become unrecognizable. It should be emphasized, moreover, that any enhancement of image features, e.g., by using morphological operations or filtering, also fails to have the desired effect due to the nature of the images—the pixels especially in the background are arranged in the shape of isotherms. Although it is not possible to distinguish the zones with the naked eye, the above-mentioned operations amplify the effect, which results in a final deterioration of the image quality.
Another problem is related to the detection of animals that are in a compact group, so that their silhouettes overlap. Note that segmentation based on the Falzenszwalb algorithm groups pixels by color. Thus, the result is like semantic segmentation, not per individual instance. In the case of two animals standing next to each other in the image, marking the border of silhouettes becomes impossible for the algorithm. The phenomenon described can be seen in
Figure 7.
Neural networks correctly coped with the task of finding two given classes of objects. The main source of errors lowering the final value of the metrics stems from separating multiple animal silhouettes. In contrast, errors in classification practically does not happen as well as the occurrence of false positives or marking the part of the silhouette that has more brightness. The only drawback remains time—the training takes about an hour, during which about 1000 iterations of network training are performed. It should also be noted that the “deer” class had higher detection precision and sensitivity than the “wild_boar” class.
One of the main problems that remains unsolved is finding a method to distinguish between the different species of the deer family. This is because the silhouettes are morphologically similar, and for different distances from the acquisition point the main differentiating factor, which is the size of the animal, cannot be captured. The method used in the work [
19] is under consideration, which will use an appropriately trained architecture depending on the degree of silhouette coverage of the image.
5. Conclusions
In the course of the work, the basic assumption of selecting the optimal method for further development for detecting animals in thermal camera images was realized. Neural networks correctly coped with the problem of classification and finding objects in images of this nature, which cannot be said about the method based on HOG/SVM.
In the long run, the problem should be extended to other classes. Indeed, it can be a severe problem to capture differences between animals of the same family but of different species (e.g., roe deer vs. deer). Differences in the form of morphological features (different coloration) are impossible to capture with a thermal camera. At the same time, size in the absence of a comparison may not be sufficient for correct species distinction. Another development path for such a defined problem is to refine detection to a form that allows analysis of films, for example, to analyze footage from photo pools placed at feeding grounds. In order to enhance security or in an educational capacity, e.g., for nocturnal human activities such as the work of uniformed services at night or hunting, it is also possible to implement a module that would recognize objects in real-time on such a camera.
