1. Introduction
At present, permanent magnet synchronous motors (PMSMs) are commonly used in various industries. However, the widespread use of PMSMs has an impact on the reserve of rare earth materials. To overcome the dependence of PMSMs on NdFeB material, scholars have proposed permanent magnet-assisted synchronous reluctance motors (PMA-SynRMs). PMA-SynRMs can make full use of the permanent magnet torque and reluctance torque, thereby reducing the need for permanent magnets, making it a promising alternative for various applications.
The complex structure of the PMA-SynRM rotor magnetic barrier presents challenges for the design and optimization of this type of motor. As a result, scholars, both domestically and internationally, have been researching optimal design methods for this motor type.
In reference [
1], a motor optimization design method is proposed based on the cross-rectangular axis equivalent magnetic circuit model. The method achieves optimization of the motor’s convex pole ratio by deriving the magnetic circuit model of a 4-pole, 48-slot synchronous reluctance motor (SynRM). However, this method has a complex equivalent magnetic circuit structure and limited accuracy when deriving the cross-rectangular axis inductance model for motors with a large pole count. Furthermore, it only supports a limited number of rotor magnetic barriers, which presents clear disadvantages in the multi-objective optimal design of motors.
In reference [
2], a multi-objective optimal design method for electric machines based on Taguchi’s method is proposed. This method obtains the variances and influence weights of different parameters on different objectives through orthogonal tests to determine the optimal combination for multi-objective enhancement. While this method achieves the multi-objective enhancement of motors, it is limited by the type of orthogonal tables, which only allows for the selection of a specific number of design parameters. Additionally, a large number of finite element simulation analyses are required, making it inefficient and prone to large errors when dealing with problems with more than three optimization objectives.
In reference [
3], a multi-objective optimal design method for electric machines is proposed based on the parametric sensitivity analysis and response surface method. This method selects optimization variables through parametric sensitivity analysis and completes multi-objective optimization using the response surface modeling method. However, the response surface method can only perform a three-level analysis of design parameters, and there may be a certain number of repetition points. Additionally, when dealing with multi-parameter problems, the model accuracy is low, the influence relationship between different optimization objectives is not considered, and the optimization effect is not significant.
In reference [
4], a multi-objective optimal design method for electric machines is proposed based on the NSGA-II optimization algorithm. This method uses response surface method modeling and optimizes the design parameters using the NSGA-II algorithm, which improves the optimization speed and avoids the influence of repeated sample points on the optimization effect. However, the NSGA-II algorithm selects individuals based on the maximum congestion distance, which can lead to the non-uniform distribution of non-dominated layer solutions when dealing with problems with more than three optimization objectives, and may cause the algorithm to fall into a local optimum.
Building on the existing research, this paper presents a multi-objective optimal design method for motors based on a composite algorithm that combines parametric modeling with a 30-pole, 90-slot outer rotor PMA-SynRM. The method is then used to complete the multi-objective optimal design of motors with eight inputs and four outputs. Firstly, the external rotor PMA-SynRM model is built on the ANSYS platform. Based on 14 structural variables, parametric analysis data are obtained, and a Pearson product torque correlation analysis is conducted, with the power density, electromagnetic torque, tooth groove torque, and torque fluctuation coefficient as optimization objectives. Comprehensive sensitivity coefficients are introduced, and a parametric sensitivity analysis of structural variables is performed to stratify the variables. From the strongly correlated variables, eight are selected as optimization variables. Secondly, a GA-BP neural network is used to fit the motor prediction model under the four optimization objectives. Finally, NSGA-III is employed to perform a global search for the prediction model and complete the multi-objective optimization of the motor.
2. The External Rotor PMA-SynRM Structural Parameters’ Design
2.1. Basic Structure of the Motor
External rotor motors have been widely utilized in diverse fields, including electric vehicles and wind power generation [
5], owing to their unique structure. In recent years, the permanent magnet-assisted synchronous reluctance motor has emerged as a highly sought-after research subject in the industry due to its amalgamation of the advantageous features exhibited by both permanent magnet synchronous motors and synchronous reluctance motors. Consequently, investigating the external rotor permanent magnet assisted synchronous reluctance motor holds immense potential for broad application in various domains. Using a parametric design method, a 30-pole, 90-slot external rotor PMA-SynRM is constructed based on the ANSYS platform, and its 2D basic structure is illustrated in
Figure 1. The magnetoresistive torque is generated by creating a layered circular magnetic barrier through a slot in the rotor core [
6,
7]. The permanent magnet material, ferrite, is deeply embedded in the rotor magnetic barrier structure to produce a permanent magnetic torque. The fundamental motor variables are summarized in
Table 1.
2.2. Motor Mathematical Model
The outer rotor PMA-SynRM is designed with a stator winding that is fed with a three-phase current to produce a magnetic field. The rotor quadrature–direct axis magnetic paths have different magnetoresistances [
8], and the magnetic lines of force always follow the path with the least magnetoresistance. Defining the direction of rotor flux flow through the permanent magnet as the direct axis of the motor (i.e., the
d-axis direction) and the direction 90 electrical degrees ahead of the
d-axis as the quadrature-axis direction of the motor (i.e., the
q-axis direction), the stator current can be controlled to generate a reluctance torque to drive the motor by ensuring that the stator magnetic field is always at a specific angle to the straight axis of the rotor.
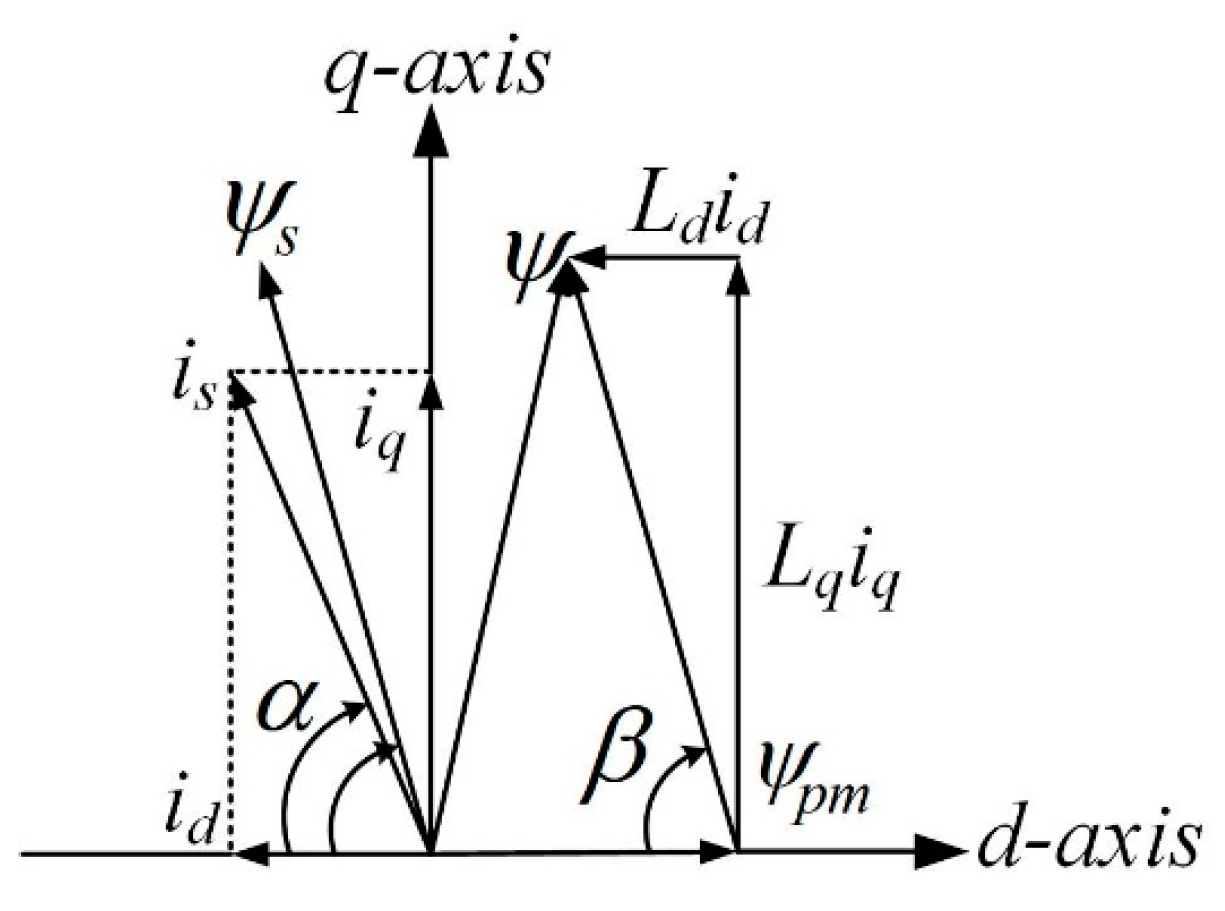
Figure 2 illustrates the rotor topology and magnet line orientation of the external rotor PMA-SynRM, while
Figure 3 presents the space vector diagram of the motor.
Electromagnetic torque equation:
In the given formula, the variables are defined as follows: is, id, and iq represent the stator current and its components on the straight and cross axes, respectively. Ψd and Ψq represent the straight-axis magnetic chains and cross-axis magnetic chains, respectively. Ψpm represents the magnetic chains generated by ferrite magnets. Ψs, Ψsd, and Ψsq represent the magnetic stator chain and its components on the straight and cross axes, respectively. Ld and Lq represent the straight-axis and cross-axis inductors, respectively. p represents the number of poles of the motor. Te represents the electromagnetic torque generated by the motor. α and β represent the angle between the stator current and the direction of the magnetic stator chain and the straight axis, respectively.
3. The External Rotor PMA-SynRM Multi-Objective Optimization
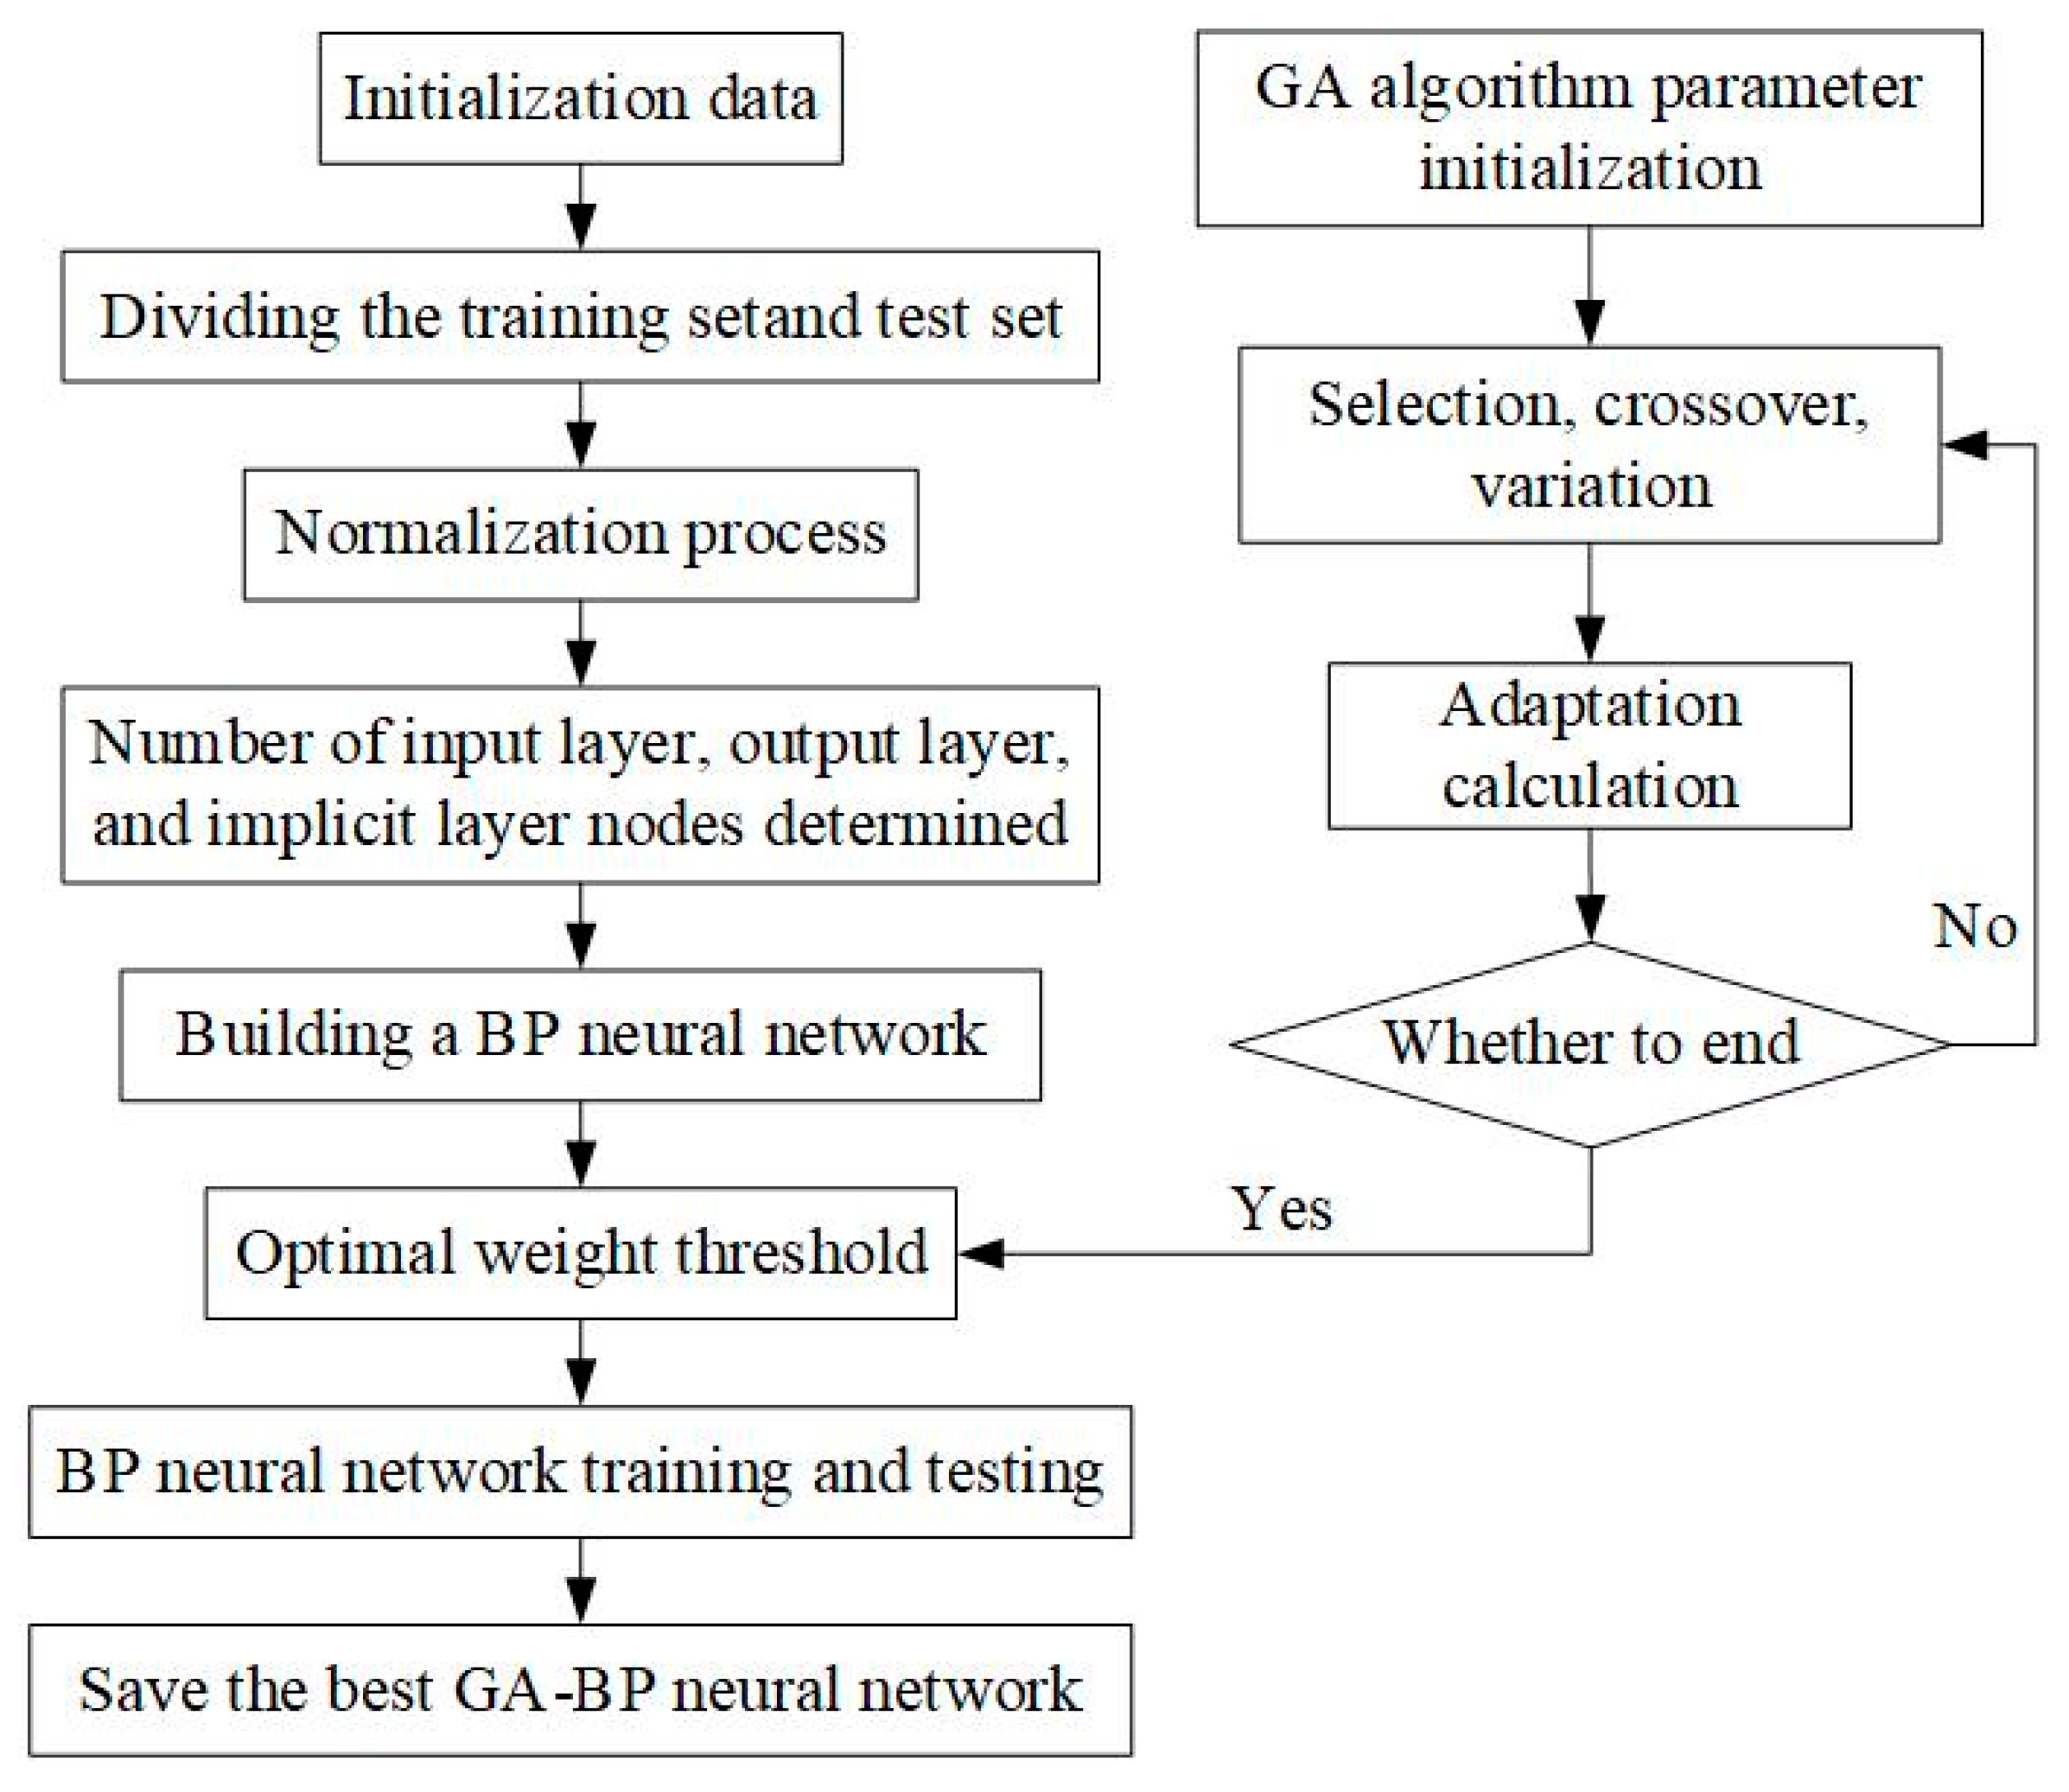
This paper proposes a novel composite algorithm that combines the genetic algorithm–backpropagation (GA-BP) neural network and non-dominated sorting genetic algorithm III (NSGA-III) to optimize the outer-rotor permanent magnet-assisted synchronous reluctance motor (PMA-SynRM) with multiple objectives using fundamental motor parameters. The GA-BP neural network is utilized to develop accurate prediction models for the motor, considering different optimization objectives, while the NSGA-III is employed to efficiently identify the optimal design solutions based on the fitted prediction models. To demonstrate the proposed methodology, a comprehensive flow chart of the multi-objective optimal design of the motor based on the composite algorithm is presented in
Figure 4.
3.1. External Rotor PMA-SynRM Initialization
3.1.1. Determination of Optimization of Objectives
The outer-rotor PMA-SynRM stator–rotor structure designed in this study comprises a multitude of variables, with each exerting a distinct influence on the motor’s performance. To achieve optimal output power and torque while minimizing motor vibration and noise, the power density (
Pd), electromagnetic torque (
Te), cogging torque (
Tcog), and torque fluctuation coefficient (
Tri) of the motor are identified as key optimization targets. The power density (
Pd) is defined as the ratio of actual output power to effective volume [
9], while the torque fluctuation coefficient (
Tri) is expressed as the ratio of the difference between maximum (
Tmax) and minimum (
Tmin) torque [
10,
11] to average output electromagnetic torque (
Tavg), i.e.,
Thus, the objective function for the multi-target optimal design of the motor and the corresponding constraints are established as follows:
3.1.2. Main Structural Variables of the Motor
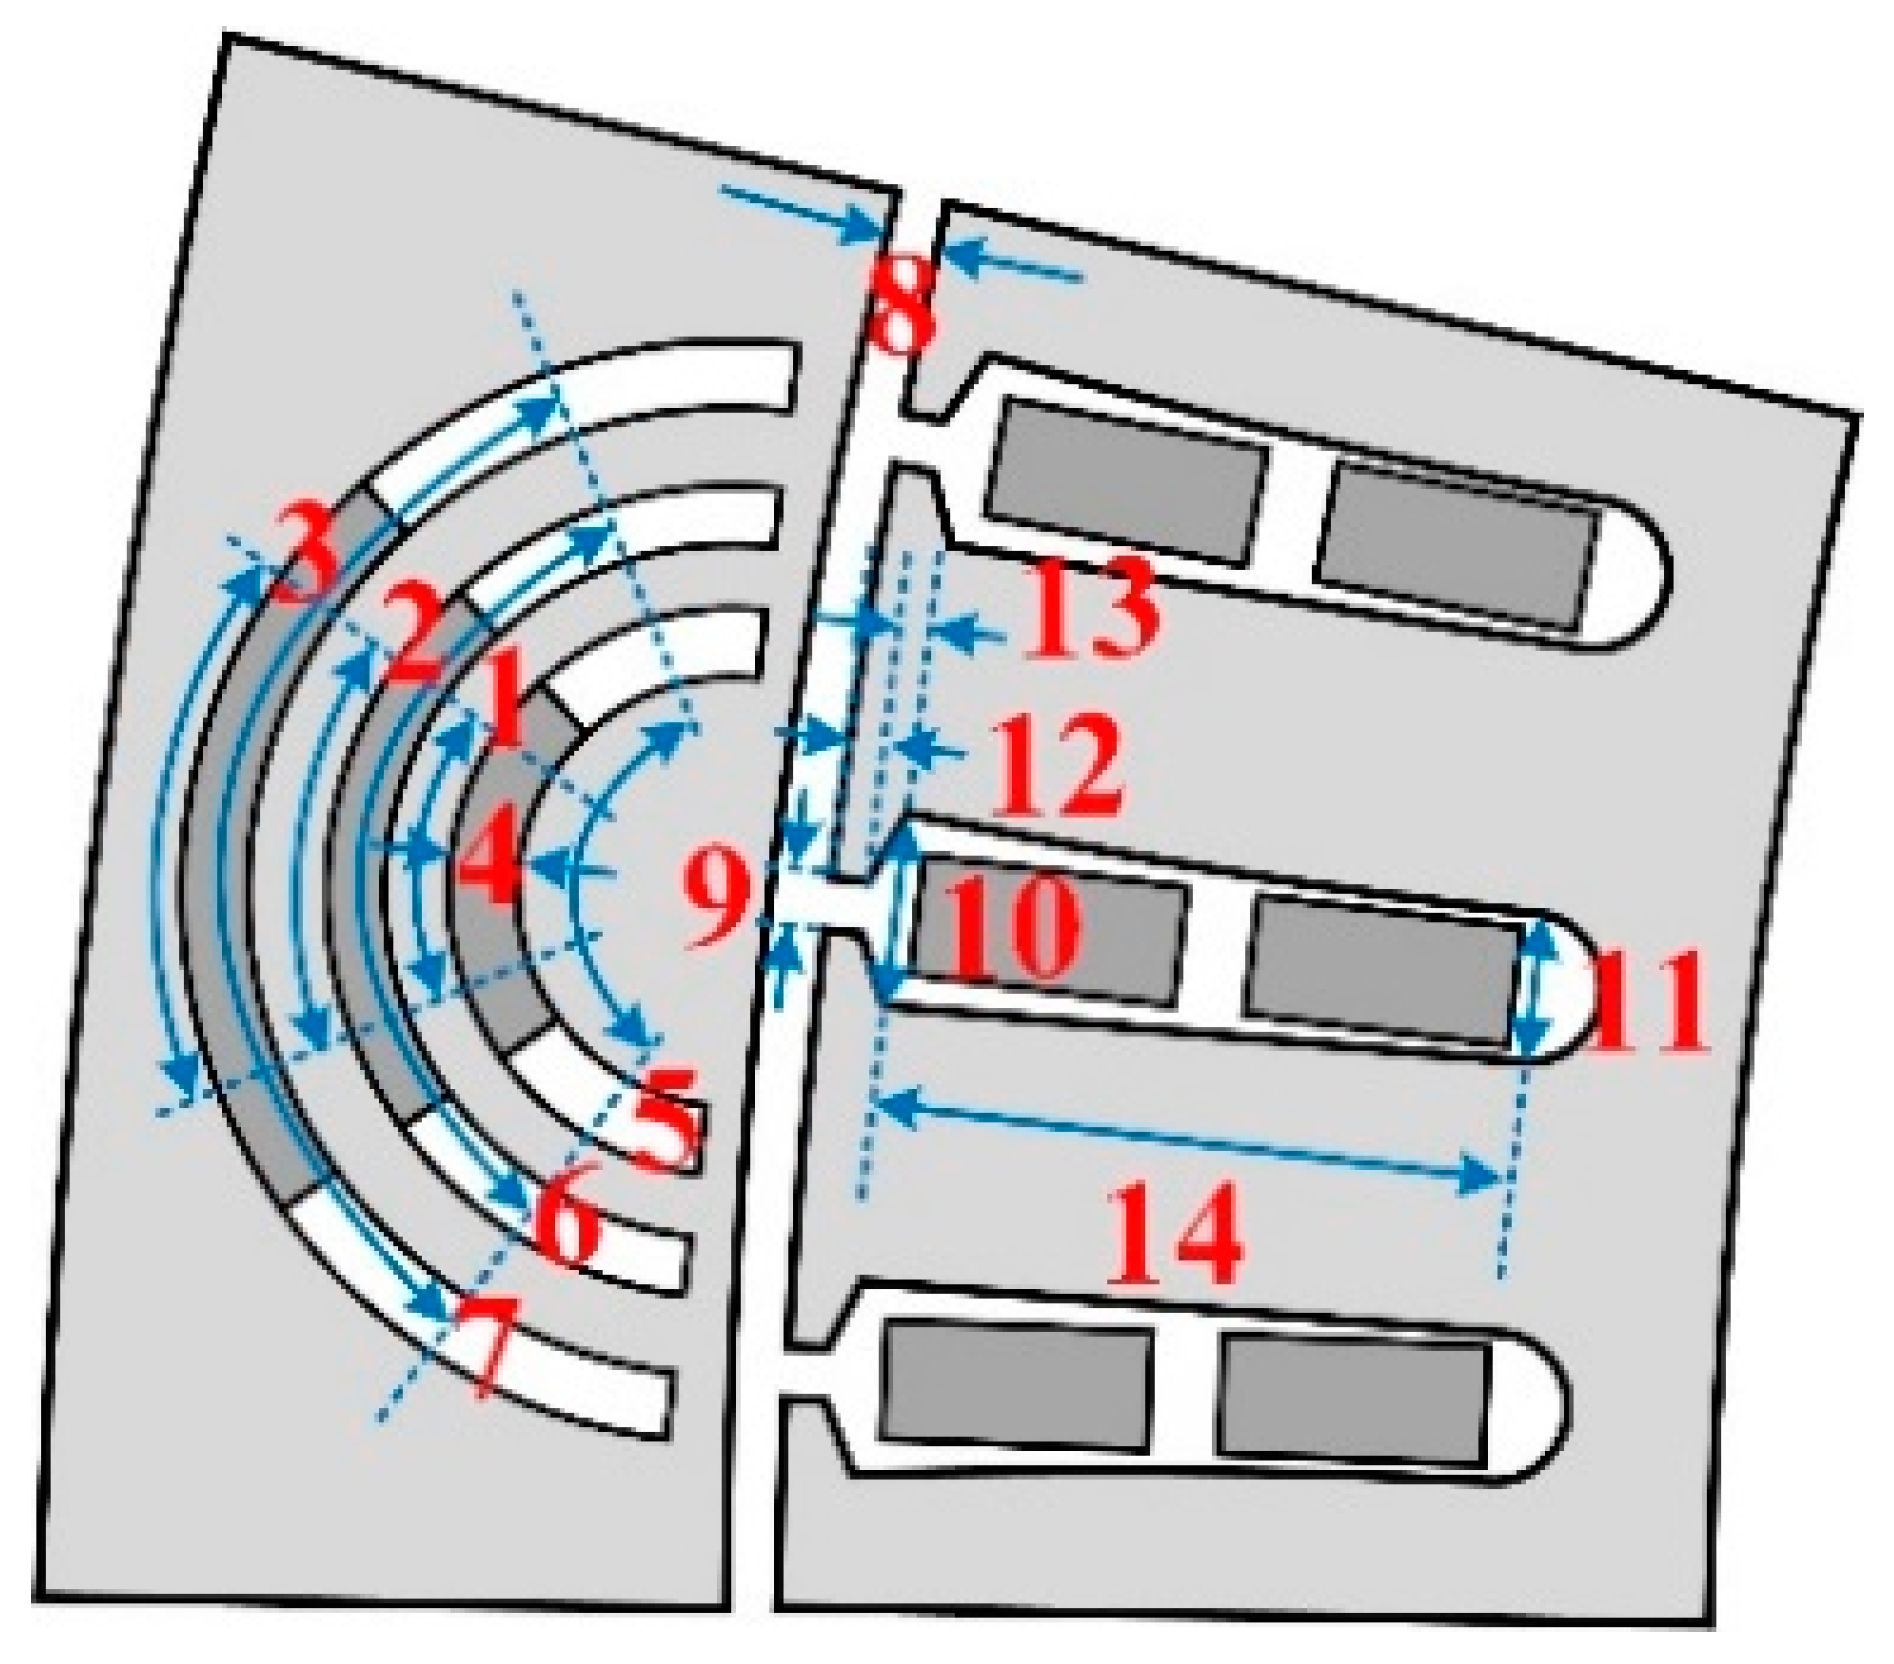
In this paper, we use a parametric modeling method to construct an external rotor PMA-SynRM finite element model, which enables us to parameterize 14 structural variables.
Figure 5 provides a schematic diagram of each of these structural variables.
The magnetic barrier located near the air gap side is regarded as the first layer of the rotor magnetic barrier, while the ferrite situated near the air gap side is deemed the first layer of ferrite. We conducted a finite element parameterized scanning analysis of each design variable of the motor while ensuring its normal operation, and determined the initial value range of each design variable, as shown in
Table 2.
3.2. Parameter Sensitivity Analysis
3.2.1. Pearson Product–Moment Correlation Analysis of Sample Data
This paper selected 14 structural variables and four optimization objectives, obtaining 400 sample points using the advanced Latin hypercube sampling (ALHS) technique to ensure a uniform probability distribution of the data. ANSYS finite element analysis was used to exclude sample points with conflicting parameters, resulting in 397 data sets. Although a linear relationship exists between the structural variables and the optimization objective, it does not satisfy the monotonic relationship. To measure the degree of association between two factors, this paper introduced the Pearson correlation coefficient and conducted a Pearson product–moment correlation analysis (PPMCA) on 397 × 4 × 14 groups of data.
Defining
Y as the optimization objective determined in this paper,
X as the selected structural variables, and
N as the number of samples, the Pearson correlation coefficient can be mathematically expressed as follows:
Based on the above analysis, the
X variable contains a total of 397 × 14 sets of sample data, the
Y variable contains a total of 397 × 4 sets of sample data, and the calculated
ρ(
X,
Y) contains a total of 14 × 4 sets of Pearson coefficient data. The results obtained using Matlab to conduct PPMCA on the aforementioned data are presented in
Table 3.
Table 3 presents the Pearson correlation coefficients of the 14 structural variables with respect to the four optimization objectives. The magnitude of the absolute value of the Pearson correlation coefficient indicates the strength of the constraint imposed by each specific structural variable on its corresponding optimization objective. These correlation coefficients provide valuable insights into the relationships between the structural variables and the optimization objectives, which are crucial for understanding the design constraints and achieving optimal performance.
3.2.2. Calculation of Integrated Sensitivity and Determination of Optimization Variables
Table 3 provides a comprehensive overview of how each optimization objective is uniquely influenced by various structural variables, while also highlighting the diverse effects exhibited by each structural variable across different optimization objectives. In order to streamline and simplify the motor optimization design process, it becomes imperative to thoroughly consider the intricate correlations between structural variables and optimization objectives. This necessitates the identification of strongly correlated variables that can serve as optimization variables, thus reducing the overall workload associated with motor optimization design. To determine the integrated sensitivities of each structural variable, a method centered around the design of optimized target weight coefficients was employed, resulting in the calculation of integrated sensitivity correlation coefficients based on the data presented in
Table 3.
,
,
and
are used to represent the PCC values of
Pd,
Te,
Tcog and
Tri, respectively. Considering the specific problem addressed in this paper, the mathematical expression of the integrated sensitivity correlation coefficient can be formulated as follows:
The formula includes ω1, ω2, ω3, and ω4, which represent the weight coefficients of the optimized target power density, electromagnetic torque, cogging torque, and torque fluctuation coefficient, respectively.
In this paper, priority is assigned to optimizing motor torque performance and output power performance, and the weight coefficients for each optimization objective are outlined in
Table 4.
Table 5 presents the combined sensitivity correlation coefficients of 14 structural variables, which were calculated by combining the above analyses.
Figure 6 provides a visual representation of the stratification process undertaken to categorize structural variables based on their correlation. In this study, a threshold value of 0.15 was set as the criterion for the integrated sensitivity of each parameter. Variables exhibiting an integrated sensitivity value surpassing 0.15 were deemed strongly correlated, while those with lower values were classified as weakly correlated. This classification helped to identify the variables that had a significant impact on the optimization objectives. The strongly correlated variables identified were subjected to further optimization by establishing a range of values. These optimized ranges, which encompass a diverse set of values, are detailed in
Table 2. By focusing on these ranges, engineers and designers can effectively narrow down the search space and streamline the optimization process. On the other hand, for the weakly correlated variables, a different approach was employed. Finite element single-parameter optimization techniques were utilized to identify the optimal values for these variables. By leveraging this method, the best values for the weakly correlated variables were determined. To summarize,
Table 6 and
Table 7 provide comprehensive information on the optimized variable ranges for strongly correlated variables and the best values for weakly correlated variables, respectively. These results serve as a valuable resource for motor optimization design, aiding in the selection of optimal values for different structural variables.
3.3. Fitting Motor Prediction Model Based on GA-BP Neural Networks
3.3.1. Obtain Experimental Points Based on OptiSlang
In this paper, a multi-objective optimization approach was adopted to optimize the designed external rotor PMA-SynRM, using eight optimization variables and four optimization objectives. To obtain the model, experimental points were generated by combining OptiSLang and the finite element method. Weakly correlated variables were optimized to ensure that they used their corresponding optimal values. Under the constraint of optimizing the range of variable values, a global search model was used to obtain 296 sets of experimental points.
Table 8 provides some of the data obtained in the paper.
3.3.2. Comparative Analysis of BP and GA-BP Neural Networks
This article proposes the use of a GA-BP neural network to fit the motor prediction model, as shown in
Figure 7. The BP neural network is built by initializing the data from
Table 8, which are divided into a training set of 260 data points and a test set of 36 data points. The number of optimization variables corresponding to the input layer and the number of output variables corresponding to the output layer are determined by the following equation [
12], which shows the relationship between the input layer, output layer, and hidden layer:
Among them, m and n represent the number of input and output layers, respectively. a is a constant, usually taken as an integer between 1 and 10, and the value should not be too large or too small. The value of a in this article is 8.
Taking an integer for the final calculation result can obtain the input, output, and hidden layers of the network consist of 8, 4, and 12 nodes, respectively. In order to prevent the BP neural network from getting stuck in local minima, a genetic algorithm is employed to optimize the network and obtain the optimal weight threshold.
This paper employs BP and GA-BP neural networks to fit the parameters to the motor sample data based on the 296 sets of data provided in
Table 8. The training number is set to 1000, with a learning rate of 0.01, and a minimum error of 0.0001 for the practicing objective. For the GA algorithm, a population size of 30, a maximum number of updates of 50, an intersection chance of 80%, and a variation probability of 20% are initialized. The root mean square error and the average absolute percentage error of the data processed by the two models are compared in
Table 9 and
Table 10, respectively.
Table 9 and
Table 10 demonstrate a noticeable reduction in the root mean square error and the average absolute percentage error of the data processing after optimizing the BP neural network using the GA algorithm. The GA-BP neural network was found to have a superior fitting effect on data processing compared to traditional BP neural networks.
3.3.3. Predicting Motor Models Using GA-BP Neural Networks
To minimize the total prediction error of the GA-BP neural network in fitting the data and optimize the accuracy of the parameters of the external rotor PMA-SynRM model, adjustments were made to the initialization parameters of the GA algorithm. The population size was set to 200, with a maximum number of updates of 200, an intersection chance of 10%, and a variance probability of 90%, thus minimizing the possibility of the algorithm having the best local results [
13,
14,
15]. The BP neural network model training parameters were also adjusted, with the number of practices set to 1000, a learning rate of 0.01, and a minimum error of the practicing objective set at 0.00001. The algorithm adaptation curve is presented in
Figure 8.
In this paper, the GA-BP neural network calculates the total error of the optimization target when processing data, with lower values indicating better performance. As shown in
Figure 8, the algorithm’s optimal fitness approaches 2.3% when the number of generations of population evolution is approximately 125, converging to a straight line until the end of evolution. When the population evolves for about 150 generations, the average fitness of the algorithm approaches 3.5%, fluctuating slightly above and below this value until the end of evolution. At this stage, the average adaptation and the best adaptation maintain a certain distance, with a difference of only 1.2%. It can be approximated that the individual has the strongest adaptation ability, and the GA algorithm has the best optimization performance for the BP neural network.
At this point, the best network is selected, the optimal weight threshold is determined, and the BP neural network is trained and tested. The fitting errors of the GA-BP neural network model for the four optimization objectives are presented in
Figure 9.
As depicted in
Figure 9, it is evident that the fitting error of the GA-BP neural network can be effectively controlled within specific ranges for each optimization objective. For instance, the fitting error for power density can be maintained at approximately 0–0.004, while the fitting error for electromagnetic torque also falls within the same range. Similarly, the fitting error for cogging torque ranges from 0 to 0.15, and for torque fluctuation coefficient, it ranges from 0 to 0.03. These controlled fitting errors demonstrate the accuracy and reliability of the GA-BP neural network in effectively capturing the underlying patterns in the experimental data and generating precise parameters for the external rotor PMA-SynRM model.
Furthermore,
Figure 10 illustrates the results of fitting the GA-BP neural network to the four optimization objectives. The visualization of these results provides a clear and comprehensive understanding of the network’s ability to accurately represent and predict the optimization objectives. This further substantiates the effectiveness and practicality of the GA-BP neural network in facilitating the motor optimization design process.
3.4. Optimization of Motor Model Parameters Based on NSGA-III Algorithm
The NSGA-III multi-objective optimization algorithm was employed to identify the optimization of the external rotor PMA-SynRM model fitted by the GA-BP neural network. The optimization process is illustrated in
Figure 11.
The cost function in this study was constructed based on the data fitted by the optimal GA-BP neural network, and the NSGA-III algorithm was utilized to search for the optimization of the constructed cost function. To debug the NSGA-III algorithm, we employed the method used to minimize the objective function [
16]. Specifically, the cost function was constructed by first taking the inverse of the fitted data of power density and the electromagnetic torque. The NSGA-III algorithm selected non-dominated layer individuals in the next generation based on reference points [
17], which prevented the algorithm from falling into the local optimum. The number of initialized populations was set to 300, the maximum number of updates was 200, the number of reference point divisions on each optimization objective was 10, and the crossover and variation probabilities were both 50%. Based on these parameters, the motor prediction model fitted by the GA-BP neural network was optimized, and a parallel plot of the optimization results for the four optimization goals was obtained, as shown in
Figure 12. In the figure, the unit of power density is W/m
3, the unit of electromagnetic torque and cogging torque is
N, and the torque fluctuation coefficient is dimensionless.
Based on the results presented in
Figure 12, the solution frontier in four dimensions is not easily visualized, making it difficult to obtain an intuitive optimal solution for motor design and hindering the decision-making task. To address this issue, we adopted a multi-objective weighted trade-off design-based approach [
18] to assist in determining the final preferred solution. By normalizing the data according to the constraints shown in Equation (8), we utilized the multi-objective weighted trade-off design method to calculate the weighted sum of 300 sets of optimized result data.
The normalized processing expression is:
The formula involves raw data represented by n, normalized data represented by n′, and the maximum (nmax) and minimum (nmin) values of the original data.
Considering the specific problem addressed in this paper, we determine the weights and expressions as follows.
The formula includes weighted weighting coefficients for power density, electromagnetic torque, cogging torque, and torque fluctuation coefficient, represented by λ1, λ2, λ3, and λ4, respectively. We set λ1 = 0.35, λ2 = 0.35, λ3 = 0.15, and λ4 = 0.15, such that they satisfy the relationship equation λ1 + λ2 + λ3 + λ4 = 1.
Figure 13 shows the weight sums of all optimization objectives for each data set obtained using the above method.
Figure 13 illustrates the high optimization target weights and visualization of each group of optimization result data. The larger the weighted sum, the more significant the optimization results. It is visually evident that the 76th group of data has the highest weight sum of 0.564906, implying that the corresponding motor model data scheme represents the optimal design scheme at present.
4. Analysis of Optimization Results
The analysis in
Section 3 compares the optimal design of the motor with the preliminary design of the motor in
Section 2. Using the 2021 R1 version of Maxwell 2D software, the PMA-SynRM finite element model of the outer rotor is built before and after optimization, and the electromagnetic performance of the motor is compared and analyzed. The initial rotor position angle before and after optimization remains at 2°.
Table 11 presents the comparison data of the optimized variables before and after optimization.
Figure 14 illustrates a comparison of the power density, electromagnetic torque, and cogging torque of the outer rotor PMA-SynRM before and after optimization. As shown in
Figure 13, the optimized motor’s average power density is 225,929.4773 W/m
3, which is 14.93% higher than the 196,572.4387 W/m
3 before optimization. The optimized motor’s average electromagnetic torque is 527.0483 N, which is 15.79% higher than the 455.3279 N before optimization. The maximum value of the cogging torque of the optimized motor is 3.9533 N, which is 9.2% lower than the 4.3183 N before optimization. The optimized motor’s maximum torque is 706.8589 N, while the minimum torque is 397.5200 N, and the torque fluctuation coefficient is 0.5903, calculated using Equation (6), which is 5.54% lower than the 0.6230 before optimization.
The optimization effect on power density and electromagnetic torque is more pronounced than that on cogging torque and torque fluctuation coefficient due to the weight assignment. However, all four optimization objectives show some improvement. The composite algorithm-based multi-objective optimization design method proposed in this paper can be utilized for the optimal design of external rotor PMA-SynRM electric motors.
5. Discussion
This paper focuses on the structural optimization design of permanent magnet-assisted synchronous reluctance motors with complex structures. The research object is a parametrically modeled external rotor ferrite-assisted synchronous reluctance motor. A multiple target optimized approach to the motor design based on a composite algorithm is proposed, and the multi-objective optimal design of the motor with eight inputs and four outputs is completed by this method. Firstly, the outer rotor PMA-SynRM model is built on the ANSYS platform. Based on the parametric analysis data of 14 structural variables, experimental data are obtained by ALHS method sampling. Power density, electromagnetic torque, cogging torque, and torque fluctuation coefficient are used as optimization targets. Pearson product torque correlation analysis is completed, and the comprehensive sensitivity coefficient is introduced to carry out a parametric sensitivity analysis of structural variables, realizing variable stratification. Eight of the strongly correlated variables are selected as optimization variables. Secondly, the prediction errors of a GA-BP neural network and traditional BP neural network in data fitting were compared and analyzed. It was verified that GA-BP neural network in this paper has a better fitting effect for the motor prediction model. The GA-BP neural network was used to fit the motor prediction model under four optimization objectives. Finally, NSGA-III is used to perform global optimization of the prediction model, normalize the optimization results, and use the multi-objective weighted trade-off design method to determine the best solution to complete the multiple target enhancement of the motor. The optimized motor has a 14.93% increase in power density, a 15.79% increase in electromagnetic torque, a 9.2% decrease in cogging torque, and a 5.54% decrease in torque fluctuation coefficient compared to the motor before optimization, resulting in a significant improvement in electromagnetic performance.
In order to test the superior performance of the composite algorithm proposed in this article, a combination of and response surface optimization method was used to optimize the same motor while ensuring the design parameters and optimization objectives remain unchanged. The obtained data were compared with the data processed by the method in this article to obtain
Table 12. The parameter sensitivity analysis did not use the orthogonal design method because it requires a lot of manual time [
19]. Therefore, the same method as presented in this article was directly used for parameter sensitivity analysis; that is, the selected optimization variables are the same. Among them, in response surface optimization design, 81 sets of successful data were obtained based on the Latin hypercube sampling method for optimal modeling and optimization.
Table 12 shows the specific values of the four optimization objectives when taking their respective optimal solution values.
From the above table, it can be clearly seen that both methods significantly improved electromagnetic torque and power density under optimization, but the optimization effect of the method proposed in this article is more obvious. For the cogging torque and torque fluctuation coefficient, although the response surface optimization method has a certain weakening effect, the effect is not very obvious. On the contrary, the method proposed in this article has a better degree of improvement for these two optimization objectives.
6. Conclusions and Statement
This article proposes a composite algorithm for the multi-objective optimization design of PMA-SynRM, and provides a detailed introduction to the process of using this algorithm for motor optimization design. It provides an analytical tool for the optimization design of complex structures such as PMA-SynRM.
Author Contributions
All authors listed in this article have participated in the preparation of the article, including content research and article writing. In addition, there are no other relevant personnel involved in the study in this article. Among the six authors listed in the article, G.L. is the first author, the initiator of the innovative points of this article, and the main researcher of the project. He was responsible for the preliminary preparation work of the project, the main research work, and writing the article, including the finite element modeling of external rotor permanent magnet assisted synchronous reluctance motors, parameterized scanning analysis of design variables, and data collection based on the OptiSLang platform, Pearson product moment correlation analysis, a comprehensive sensitivity analysis, writing of fitting algorithm GA-BP, comparative experiments of fitting data between the BP network and GA-BP network, writing of optimization algorithm NSGA-III, normalization of data, operation of all processes and analysis of the final results, writing the entire article, etc. H.S. is the second author and the main guiding teacher of the project. She chose the direction of the research project and is responsible for guiding the writing of this article and organizing the overall writing ideas. She guided the proposal of composite algorithms that can be used for multi-parameter and multi-objective complex motor optimization. W.H. is the third author, who assisted in the parameterized scanning analysis of design variables and provided her own ideas during the initial finite element modeling process of the motor. Y.L. is the fourth author, who assisted in collecting motor data using the OptiSLang platform. Y.B. is the fifth author, who mainly assisted in the production and aesthetic layout of relevant tables during the article writing process. Y.G. is the sixth author and the second instructor of the project, mainly responsible for guiding and polishing the English grammar. All authors have read and agreed to the published version of the manuscript.
Funding
This work was supported in part by the S&T Program of Hebei (20314501D), in part by the Science and Technology Project of Hebei Education Department (ZD2022030), as well as in part by the Overseas Expertise Introduction Project of Hebei (2023).
Data Availability Statement
This article proposes the optimization design of an external rotor permanent magnet assisted synchronous reluctance motor using a composite algorithm, which includes parameter sensitivity analysis, motor model fitting, and motor model optimization. Among them, it contains a large amount of process data and code used for development. We have presented the necessary data in the article. Due to the needs of subsequent research work, the undisclosed data and code will not be disclosed for the time being. We will upload them after all subsequent research work is completed.
Conflicts of Interest
The funders had no role in the design of the study; in the collection, analyses, or interpretation of data; in the writing of the manuscript; or in the decision to publish the results.
References
- Lu, M. Optimized design of rotor structure for high-efficiency synchronous reluctance motor. Master’s Thesis, Shandong University of Technology, Zibo, China, 2021. [Google Scholar] [CrossRef]
- Ma, H. Low-torque pulsation synchronous reluctance motor design and multi-objective optimization. Master’s Thesis, Hefei University of Technology, Hefei, China, 2019. [Google Scholar]
- Bian, Y.; Shi, L.; Liu, K. Optimal design of pole deflected permanent magnet assisted synchronous reluctance motor. Mach. Tools Hydraul. 2022, 50, 90–95. [Google Scholar]
- Zheng, S.; Zhu, X.; Xu, L.; Fan, W.; Wu, W. Design and performance analysis of permanent magnet-assisted synchronous reluctance motor with high torque-to-mass ratio. Chin. J. Electr. Eng. 2022, 42, 7236–7248. [Google Scholar] [CrossRef]
- Pan, Z.; Fang, S. Combined Random Forest and NSGA-II for Optimal Design of Permanent Magnet Arc Motor. IEEE J. Emerg. Sel. Top. Power Electron. 2021, 10, 1800–1812. [Google Scholar] [CrossRef]
- Wu, S.; Sun, X.; Tong, W. Optimization Design of High-speed Interior Permanent Magnet Motor with High Torque Performance Based on Multiple Surrogate Models. CES Trans. Electr. Mach. Syst. 2022, 6, 235–241. [Google Scholar] [CrossRef]
- Tong, W.; Wei, H.; Li, S.; Zheng, J. A novel multi-objective optimization method for the optimization of interior permanent magnet synchronous machines. IET Electr. Power Appl. 2021, 15, 359–369. [Google Scholar] [CrossRef]
- Abroshan, A.; Hasanzadeh, S.; Fard, J.R. Multi-objective optimization of a V-type line-start PM motor based on parameter stratification and RSM. Electr. Eng. 2022, 1–10. [Google Scholar] [CrossRef]
- Sudha, B.; Vadde, A.; Sachin, S. A review: High power density motors for electric vehicles. J. Physics Conf. Ser. 2020, 1706, 012057. [Google Scholar] [CrossRef]
- Chen, H.; Zhang, J.; Zhao, J.; Qu, S.; Zhou, Y. Analytical Calculations of Magnetic Fields Induced by MMF Spatial Harmonics in Multiphase Cage Rotor Induction Motors. IEEE Trans. Magn. 2021, 57, 8107612. [Google Scholar] [CrossRef]
- Yao, F.; An, Q.; Gao, X.; Sun, L.; Lipo, T.A. Principle of Operation and Performance of a Synchronous Machine Employing a New Harmonic Excitation Scheme. IEEE Trans. Ind. Appl. 2015, 51, 3890–3898. [Google Scholar] [CrossRef]
- Yang, R.; Hu, X.; He, L. Prediction of Shanghai air quality index based on BP neural network optimized by genetic algorithm. In Proceedings of the 2020 13th International Symposium on Computational Intelligence and Design (ISCID), Hangzhou, China, 12–13 December 2020. [Google Scholar] [CrossRef]
- Xu, J.; Lin, H.; Guo, H. Dynamic neighborhood genetic learning particle swarm optimization for high-power density electric propulsion motor. Chin. J. Aeronaut. 2022, 35, 253–265. [Google Scholar] [CrossRef]
- Zheng, S.-Y.; Zhu, X.-Y.; Xu, L.; Xiang, Z.X.; Quan, L.; Yu, B.X. Multi-Objective Optimization Design of a Mul-ti-PermanentMagnet Motor Considering Magnet Characteristic Variation Effects. IEEE Trans. Ind. Electron. 2021, 69, 3428–3438. [Google Scholar] [CrossRef]
- Xu, W.; Hu, Y.; Luo, W.; Wang, L.; Wu, R. A multi-objective scheduling method for distributed and flexible job shop based on hybrid genetic algorithm and tabu search considering operation outsourcing and carbon emission. Comput. Ind. Eng. 2021, 157, 107318. [Google Scholar] [CrossRef]
- Guo, H.; Xu, Y.; Huang, L.; Sun, J.; Chen, H. Optimization strategy using corresponding-point methodology (CPM) concerning finite time and heat conduction rate for CAES systems. Energy 2023, 266, 126336. [Google Scholar] [CrossRef]
- Cao, X.; Wen, Z.; Xu, J.; De Clercq, D.; Wang, Y.; Tao, Y. Many-objective optimization of technology implementation in the industrial symbiosis system based on a modified NSGA-III. J. Clean. Prod. 2020, 245, 118810. [Google Scholar] [CrossRef]
- Hu, Y.; Chen, B.; Xiao, Y.; Shi, J.; Li, L. Study on the Influence of Design and Optimization of Rotor Bars on Parameters of a Line-Start Synchronous Reluctance Motor. IEEE Trans. Ind. Appl. 2020, 56, 1368–1376. [Google Scholar] [CrossRef]
- Wu, Z.; Yin, D.; Chen, L.; Fu, J. Design of Magnetic Barrier Angle of Permanent Magnet Assisted Synchronous Reluctance Motor Based on Minimum Torque Ripple. In Proceedings of the 2022 7th Asia Conference on Power and Electrical Engineering (ACPEE), Hangzhou, China, 15–17 April 2022. [Google Scholar]
Figure 1.
Schematic diagram of the basic structure of the external rotor PMA-SynRM.
Figure 1.
Schematic diagram of the basic structure of the external rotor PMA-SynRM.
Figure 2.
Rotor topology and magnet wire orientation of the motor.
Figure 2.
Rotor topology and magnet wire orientation of the motor.
Figure 3.
Space vector diagram of the motor.
Figure 3.
Space vector diagram of the motor.
Figure 4.
Step-by-step diagram illustrating the multi-objective optimization design of the motor based on the proposed composite algorithm that combines the GA-BP neural network and NSGA-III.
Figure 4.
Step-by-step diagram illustrating the multi-objective optimization design of the motor based on the proposed composite algorithm that combines the GA-BP neural network and NSGA-III.
Figure 5.
Schematic diagram of the parameterized structure variables of the external rotor PMA-SynRM.
Figure 5.
Schematic diagram of the parameterized structure variables of the external rotor PMA-SynRM.
Figure 6.
The combined sensitivity correlation coefficients.
Figure 6.
The combined sensitivity correlation coefficients.
Figure 7.
Flow chart for fitting the motor prediction model based on GA-BP neural network.
Figure 7.
Flow chart for fitting the motor prediction model based on GA-BP neural network.
Figure 8.
Genetic algorithm adaptation curve.
Figure 8.
Genetic algorithm adaptation curve.
Figure 9.
Fitting error diagram for the different optimization objectives. (a) Fitting error plot for the power density. (b) Fitting error diagram of the electromagnetic torque. (c) Fitting error diagram of the cogging torque. (d) Fitting error plot of the torque fluctuation coefficient.
Figure 9.
Fitting error diagram for the different optimization objectives. (a) Fitting error plot for the power density. (b) Fitting error diagram of the electromagnetic torque. (c) Fitting error diagram of the cogging torque. (d) Fitting error plot of the torque fluctuation coefficient.
Figure 10.
Fitting effect of the different optimization objectives. (a) Fitting effect graph of the power density. (b) Fitting effect of the electromagnetic torque. (c) Fitting effect of the cogging torque. (d) Fitting effect of the torque fluctuation coefficient.
Figure 10.
Fitting effect of the different optimization objectives. (a) Fitting effect graph of the power density. (b) Fitting effect of the electromagnetic torque. (c) Fitting effect of the cogging torque. (d) Fitting effect of the torque fluctuation coefficient.
Figure 11.
Flow chart of the NSGA-III algorithm-based motor prediction model for finding the best model.
Figure 11.
Flow chart of the NSGA-III algorithm-based motor prediction model for finding the best model.
Figure 12.
Parallel diagram of optimization results for four optimization objectives.
Figure 12.
Parallel diagram of optimization results for four optimization objectives.
Figure 13.
Optimization objective weights for each group of optimization result data.
Figure 13.
Optimization objective weights for each group of optimization result data.
Figure 14.
Comparison of power performance and torque performance before and after optimization. (a) Comparison of power density before and after optimization. (b) Comparison of electromagnetic torque before and after optimization. (c) Comparison of cogging torque before and after optimization.
Figure 14.
Comparison of power performance and torque performance before and after optimization. (a) Comparison of power density before and after optimization. (b) Comparison of electromagnetic torque before and after optimization. (c) Comparison of cogging torque before and after optimization.
Table 1.
Basic parameters of the external rotor PMA-SynRM.
Table 1.
Basic parameters of the external rotor PMA-SynRM.
| Parameter Name/Unit | Numerical Value | Parameter Name/Unit | Numerical Value |
|---|
| Rated power/kW | 15 | Rated voltage/V | 380 |
| Rated speed/rpm | 300 | Rated frequency/Hz | 75 |
| Stator outer diameter/mm | 490 | Stator inner diameter/mm | 400 |
| Rotor outer diameter/mm | 540 | Rotor inner diameter/mm | 491 |
| Air gap length/mm | 0.5 | Magnet thickness/mm | 2.5 |
| Number of motor phases | 3 | Number of layers of magnets | 3 |
| Number of stator poles | 30 | Number of stator slots | 90 |
| Stator and rotor materials | DW 315_50 | Permanent magnet materials | Y30 BH |
Table 2.
Initial value range of each structural variable.
Table 2.
Initial value range of each structural variable.
| Number | Variable Name | Variable Symbols | Minimum Value | Maximum Value |
|---|
| 1 | Pole embrace of the first layer of PM | α1 | 0.38 | 0.46 |
| 2 | Pole embrace of the second layer of PM | α2 | 0.38 | 0.46 |
| 3 | Pole embrace of the third layer of PM | α3 | 0.38 | 0.46 |
| 4 | Ferrite thickness | lpm | 2.3 mm | 2.7 mm |
| 5 | Pole embrace of the first layer of MB | β1 | 0.955 | 0.975 |
| 6 | Pole embrace of the second layer of MB | β2 | 0.965 | 0.985 |
| 7 | Pole embrace of the third layer of MB | β3 | 0.975 | 0.995 |
| 8 | Air gap length | δ | 0.5 mm | 1.5 mm |
| 9 | Notch width | bs0 | 1.7 mm | 2.1 mm |
| 10 | Width of slot wedge | bs1 | 5.93 mm | 7.93 mm |
| 11 | Groove bottom width | bs2 | 4.32 mm | 6.32 mm |
| 12 | Notch depth | hs0 | 1.1 mm | 1.9 mm |
| 13 | Slot wedge depth | hs1 | 0.8 mm | 1.2 mm |
| 14 | Slot depth | hs2 | 17 mm | 25 mm |
Table 3.
Pearson correlation coefficients (PCC) of each structural variable and each optimization objective.
Table 3.
Pearson correlation coefficients (PCC) of each structural variable and each optimization objective.
| Structure Variables | PCC of Pd | PCC of Te | PCC of Tcog | PCC of Tri |
|---|
| α1 | 0.077 | 0.076 | 0.554 | 0.192 |
| α2 | 0.185 | 0.187 | −0.043 | 0.164 |
| α3 | 0.240 | 0.243 | −0.017 | 0.188 |
| lpm | −0.032 | −0.032 | 0.095 | 0.074 |
| β1 | 0.146 | 0.143 | 0.731 | 0.291 |
| β2 | 0.168 | 0.167 | −0.085 | 0.218 |
| β3 | 0.487 | 0.489 | −0.015 | 0.366 |
| δ | 0.621 | 0.623 | −0.034 | 0.445 |
| bs0 | −0.139 | −0.139 | 0.161 | 0.133 |
| bs1 | −0.049 | −0.050 | −0.012 | 0.041 |
| bs2 | −0.100 | −0.102 | 0.006 | 0.078 |
| hs0 | −0.061 | −0.062 | 0.043 | 0.058 |
| hs1 | −0.038 | −0.038 | 0.032 | 0.037 |
| hs2 | −0.285 | −0.285 | 0.030 | 0.229 |
Table 4.
Weighting coefficients of each optimization objective.
Table 4.
Weighting coefficients of each optimization objective.
| Optimization Goals | Power Density | Electromagnetic Torque | Cogging Torque | Torque Fluctuation Coefficient |
| Weighting factor | 0.35 | 0.35 | 0.15 | 0.15 |
Table 5.
Correlation coefficients of the combined sensitivity of each structural variable.
Table 5.
Correlation coefficients of the combined sensitivity of each structural variable.
| Structure Variables | Integrated Sensitivity Correlation Coefficient | Structure Variables | Integrated Sensitivity Correlation Coefficient |
|---|
| α1 | 0.192 | δ | 0.445 |
| α2 | 0.164 | bs0 | 0.133 |
| α3 | 0.188 | bs1 | 0.041 |
| lpm | 0.074 | bs2 | 0.078 |
| β1 | 0.291 | hs0 | 0.058 |
| β2 | 0.218 | hs1 | 0.037 |
| β3 | 0.366 | hs2 | 0.229 |
Table 6.
Optimal range of values of optimization variables.
Table 6.
Optimal range of values of optimization variables.
| Variable Name | Variable Symbols | Minimum Value | Maximum Value |
|---|
| First-layer ferrite polar arc factor | α1 | 0.38 | 0.46 |
| Second-layer ferrite polar arc factor | α2 | 0.38 | 0.46 |
| Third-layer ferrite polar arc factor | α3 | 0.38 | 0.46 |
| First layer of magnetic barrier polar arc factor | β1 | 0.955 | 0.975 |
| Second layer of magnetic barrier polar arc factor | β2 | 0.965 | 0.985 |
| Third layer of magnetic barrier polar arc factor | β3 | 0.975 | 0.995 |
| Air gap length | δ | 0.5 mm | 1.5 mm |
| Slot depth | hs2 | 17 mm | 25 mm |
Table 7.
Optimal values of weakly correlated variables.
Table 7.
Optimal values of weakly correlated variables.
| Variable Name | Variable Symbols | Values |
|---|
| Ferrite thickness | lpm | 2.5 mm |
| Notch width | bs0 | 2.0 mm |
| Width of slot wedge | bs1 | 6.93 mm |
| Groove bottom width | bs2 | 5.32 mm |
| Notch depth | hs0 | 1.5 mm |
| Slot wedge depth | hs1 | 1.0 mm |
Table 8.
Selected experimental point data based on OptiSlang and ANSYS finite element analysis.
Table 8.
Selected experimental point data based on OptiSlang and ANSYS finite element analysis.
| | α1 | α2 | … | β3 | hs2/mm | Pd/W/m3 | Te/N | Tcog/N | Tri |
|---|
| 1 | 0.4369 | 0.4204 | … | 0.9798 | 18.0001 | 211,039 | 492.3128 | 3.7106 | 0.6389 |
| 2 | 0.4463 | 0.4055 | … | 0.9773 | 18.5601 | 202,926 | 473.3869 | 5.8677 | 0.5104 |
| 3 | 0.4049 | 0.3956 | … | 0.9946 | 20.3467 | 208,358 | 486.0569 | 4.4749 | 0.6156 |
| … | …… | …… | … | …… | …… | …… | …… | …… | …… |
| 295 | 0.4484 | 0.4581 | … | 0.9837 | 18.6401 | 205,460 | 479.2963 | 4.7357 | 0.6171 |
| 296 | 0.3916 | 0.3844 | … | 0.9947 | 17.0401 | 203,410 | 474.5151 | 2.2857 | 0.7241 |
Table 9.
Root mean square error comparison table.
Table 9.
Root mean square error comparison table.
| Optimization Goals | BP Neural Network Model | GA-BP Neural Network Model |
|---|
| Power density | 450.5925 W/m3 | 324.5339 W/m3 |
| Electromagnetic torque | 0.90399 N | 0.69459 N |
| Cogging torque | 0.3638 N | 0.2288 N |
| Torque fluctuation factor | 0.016493 | 0.007895 |
Table 10.
Comparison table of average absolute percentage error.
Table 10.
Comparison table of average absolute percentage error.
| Optimization Goals | BP Neural Network Model | GA-BP Neural Network Model |
|---|
| Power density | 0.16604% | 0.12629% |
| Electromagnetic torque | 0.14379% | 0.11701% |
| Cogging torque | 7.2448% | 4.8369% |
| Torque fluctuation factor | 1.7959% | 0.93816% |
Table 11.
Comparison of the values of optimization variables before and after optimization.
Table 11.
Comparison of the values of optimization variables before and after optimization.
| Variable Symbols | Value before Optimization | Value after Optimization |
|---|
| α1 | 0.3800 | 0.4113 |
| α2 | 0.3800 | 0.4590 |
| α3 | 0.3800 | 0.4596 |
| β1 | 0.9700 | 0.9749 |
| β2 | 0.9800 | 0.9850 |
| β3 | 0.9900 | 0.9950 |
| δ | 0.50 mm | 0.97 mm |
| hs2 | 23.00 mm | 18.18 mm |
Table 12.
Comparison of optimal solutions to different optimization methods.
Table 12.
Comparison of optimal solutions to different optimization methods.
| Optimization Objectives | Response Surface
Optimization Method | Composite Algorithm
Optimization Method |
|---|
| Pd/W/m³ | 213,830 | 225,929.4773 |
| Te/Nm | 498.82 | 527.0483 |
| Tcog/Nm | 4.2802 | 3.9533 |
| Tri/Nm | 0.61 | 0.5903 |
| Disclaimer/Publisher’s Note: The statements, opinions and data contained in all publications are solely those of the individual author(s) and contributor(s) and not of MDPI and/or the editor(s). MDPI and/or the editor(s) disclaim responsibility for any injury to people or property resulting from any ideas, methods, instructions or products referred to in the content. |
© 2023 by the authors. Licensee MDPI, Basel, Switzerland. This article is an open access article distributed under the terms and conditions of the Creative Commons Attribution (CC BY) license (https://creativecommons.org/licenses/by/4.0/).


