
YOLO v7-ECA-PConv-NWD Detects Defective Insulators on Transmission Lines


Abstract
:1. Introduction
- (1)
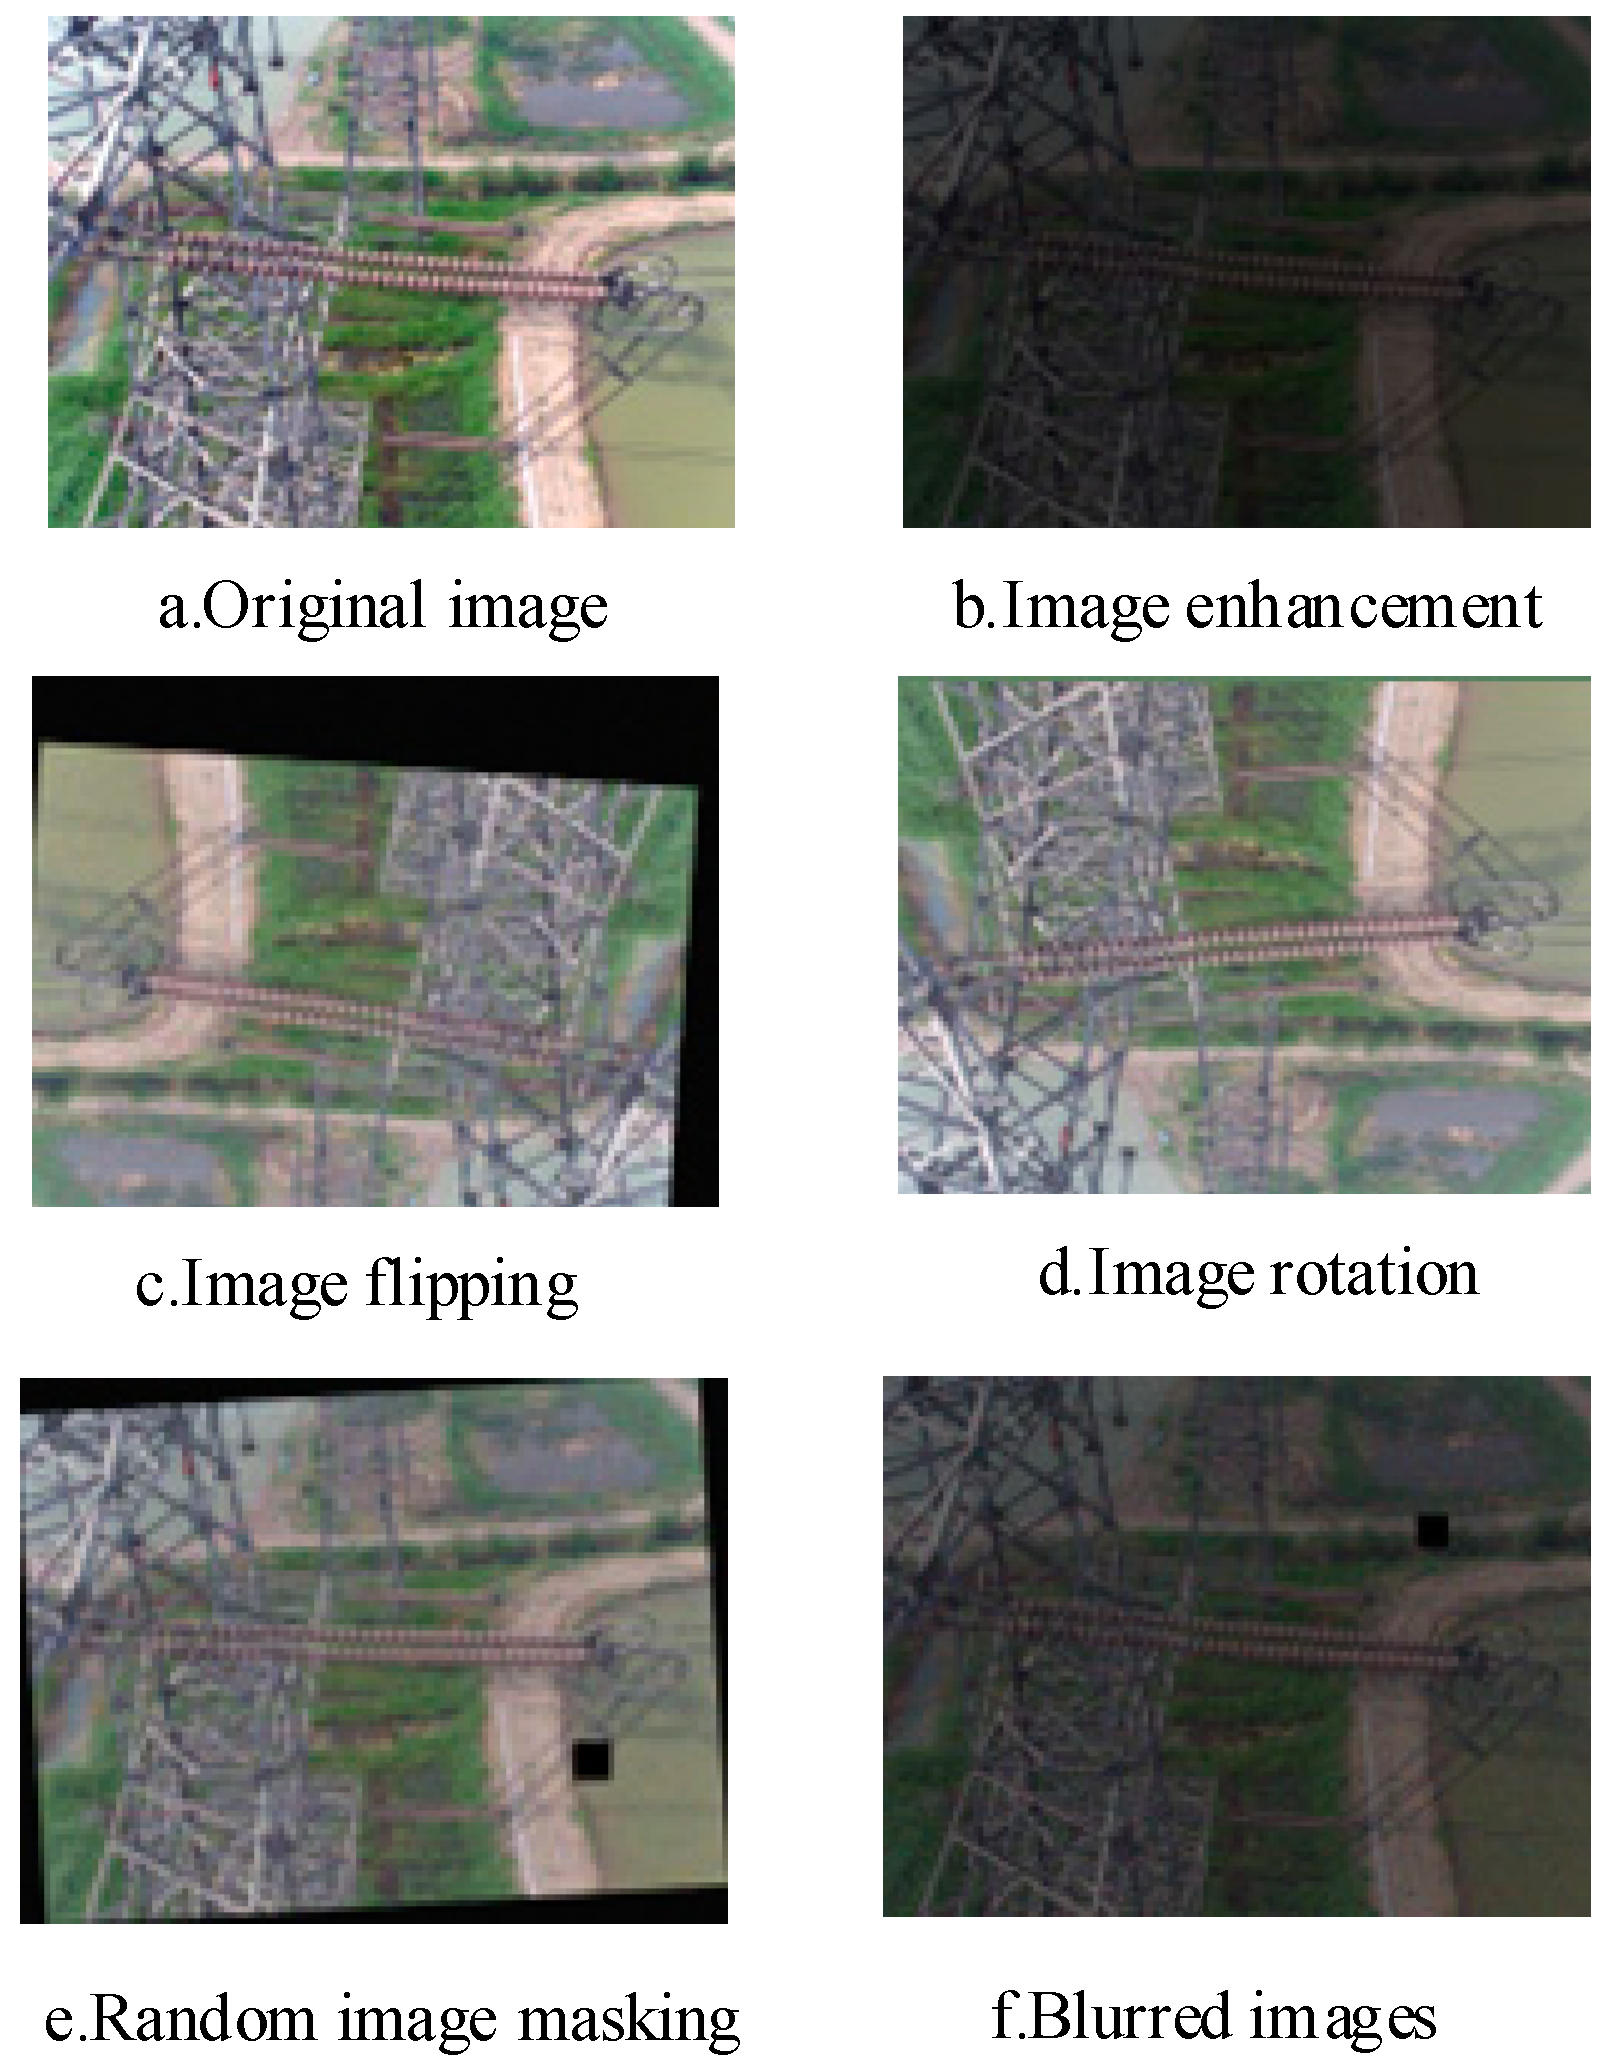
- Data Enhancement: The standard insulator dataset TISLTR and the high-resolution tiny target faulty insulator dataset FISLTR are enhanced through various techniques, including image enhancement, flipping, cropping, blurring, and random transformations. These techniques enhance the datasets by increasing their diversity and quality.
- (2)
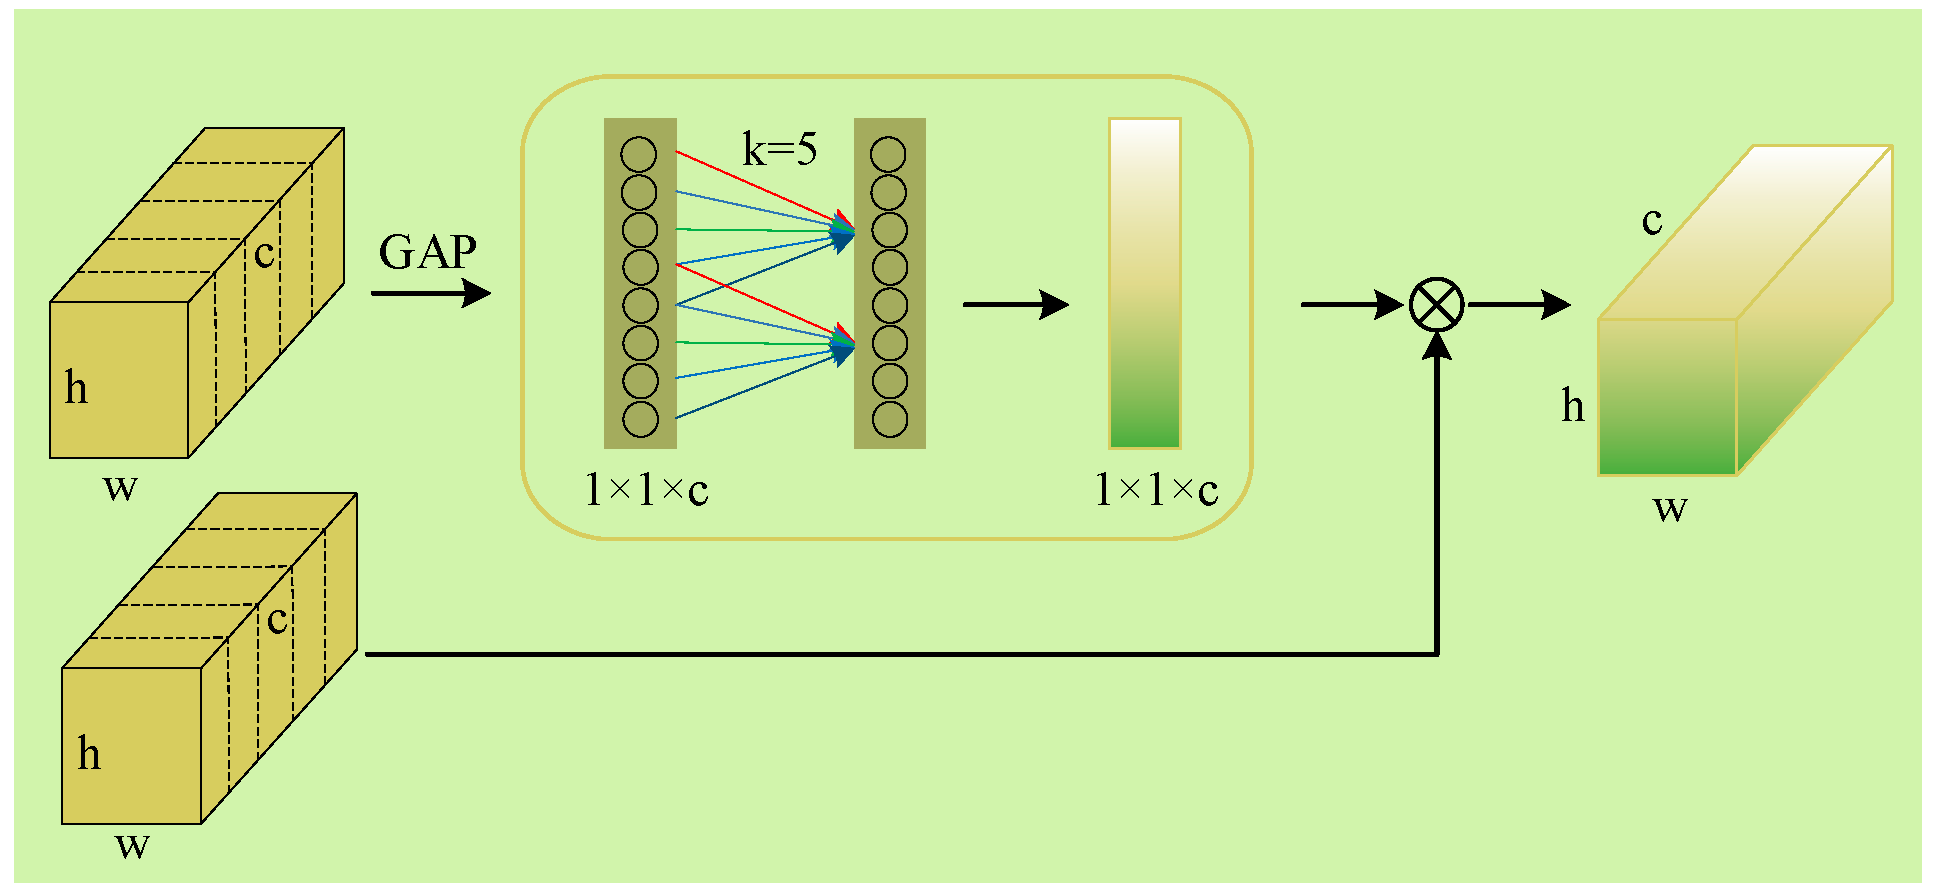
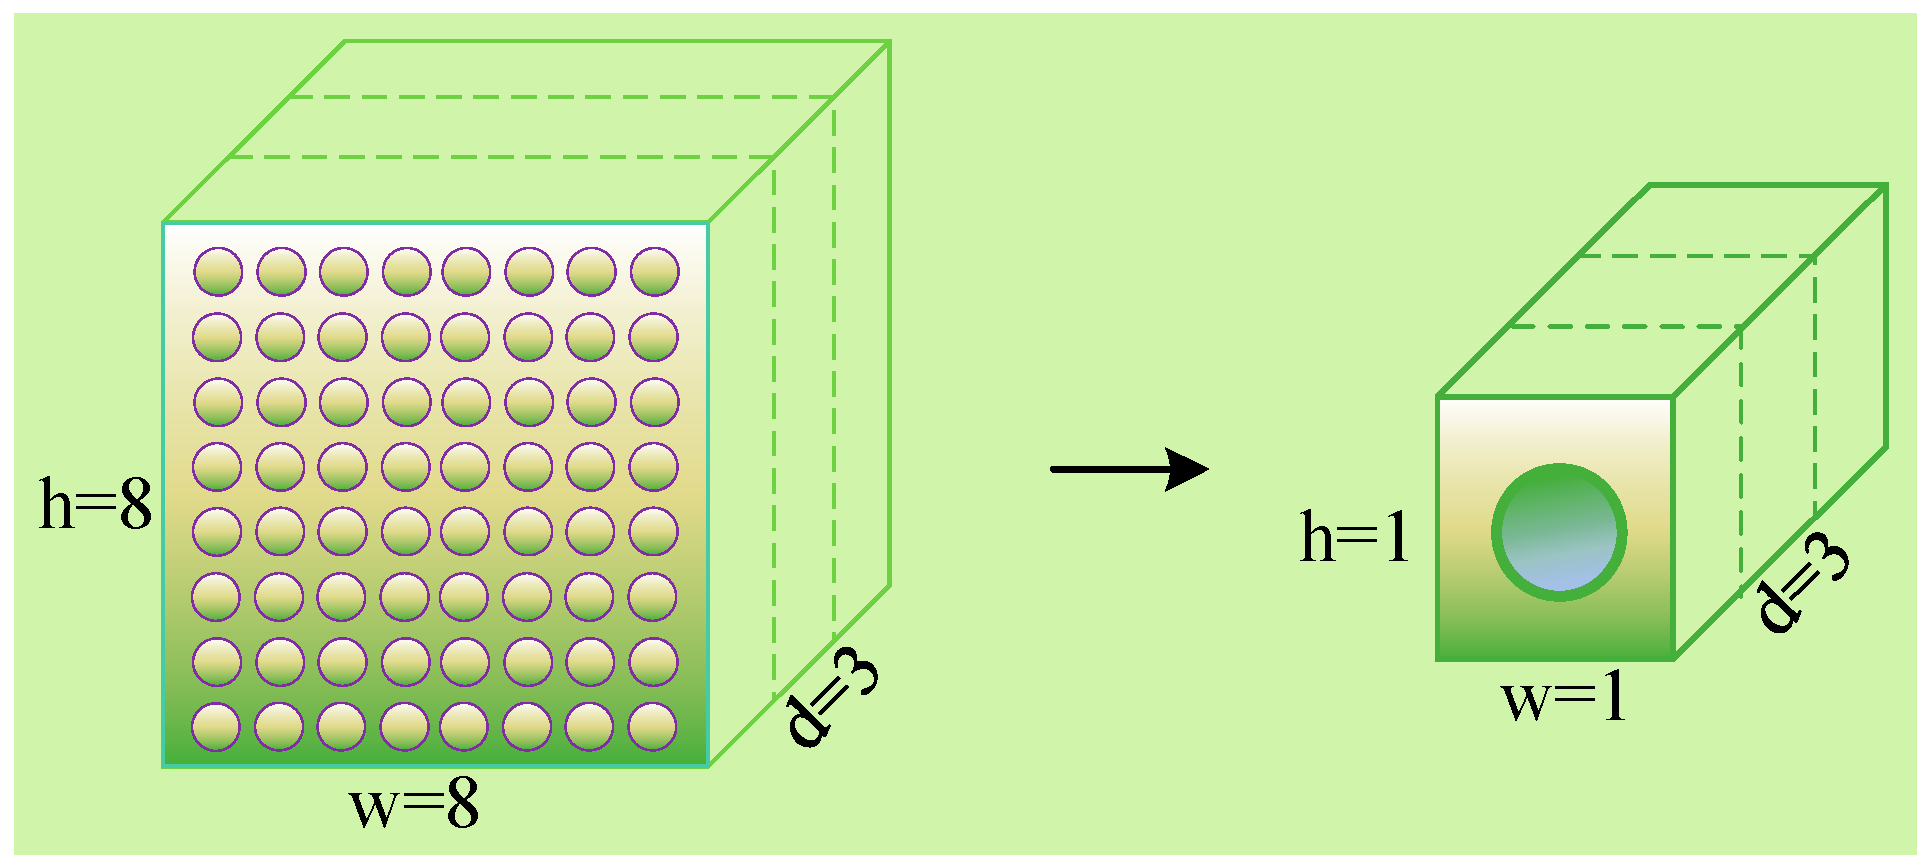
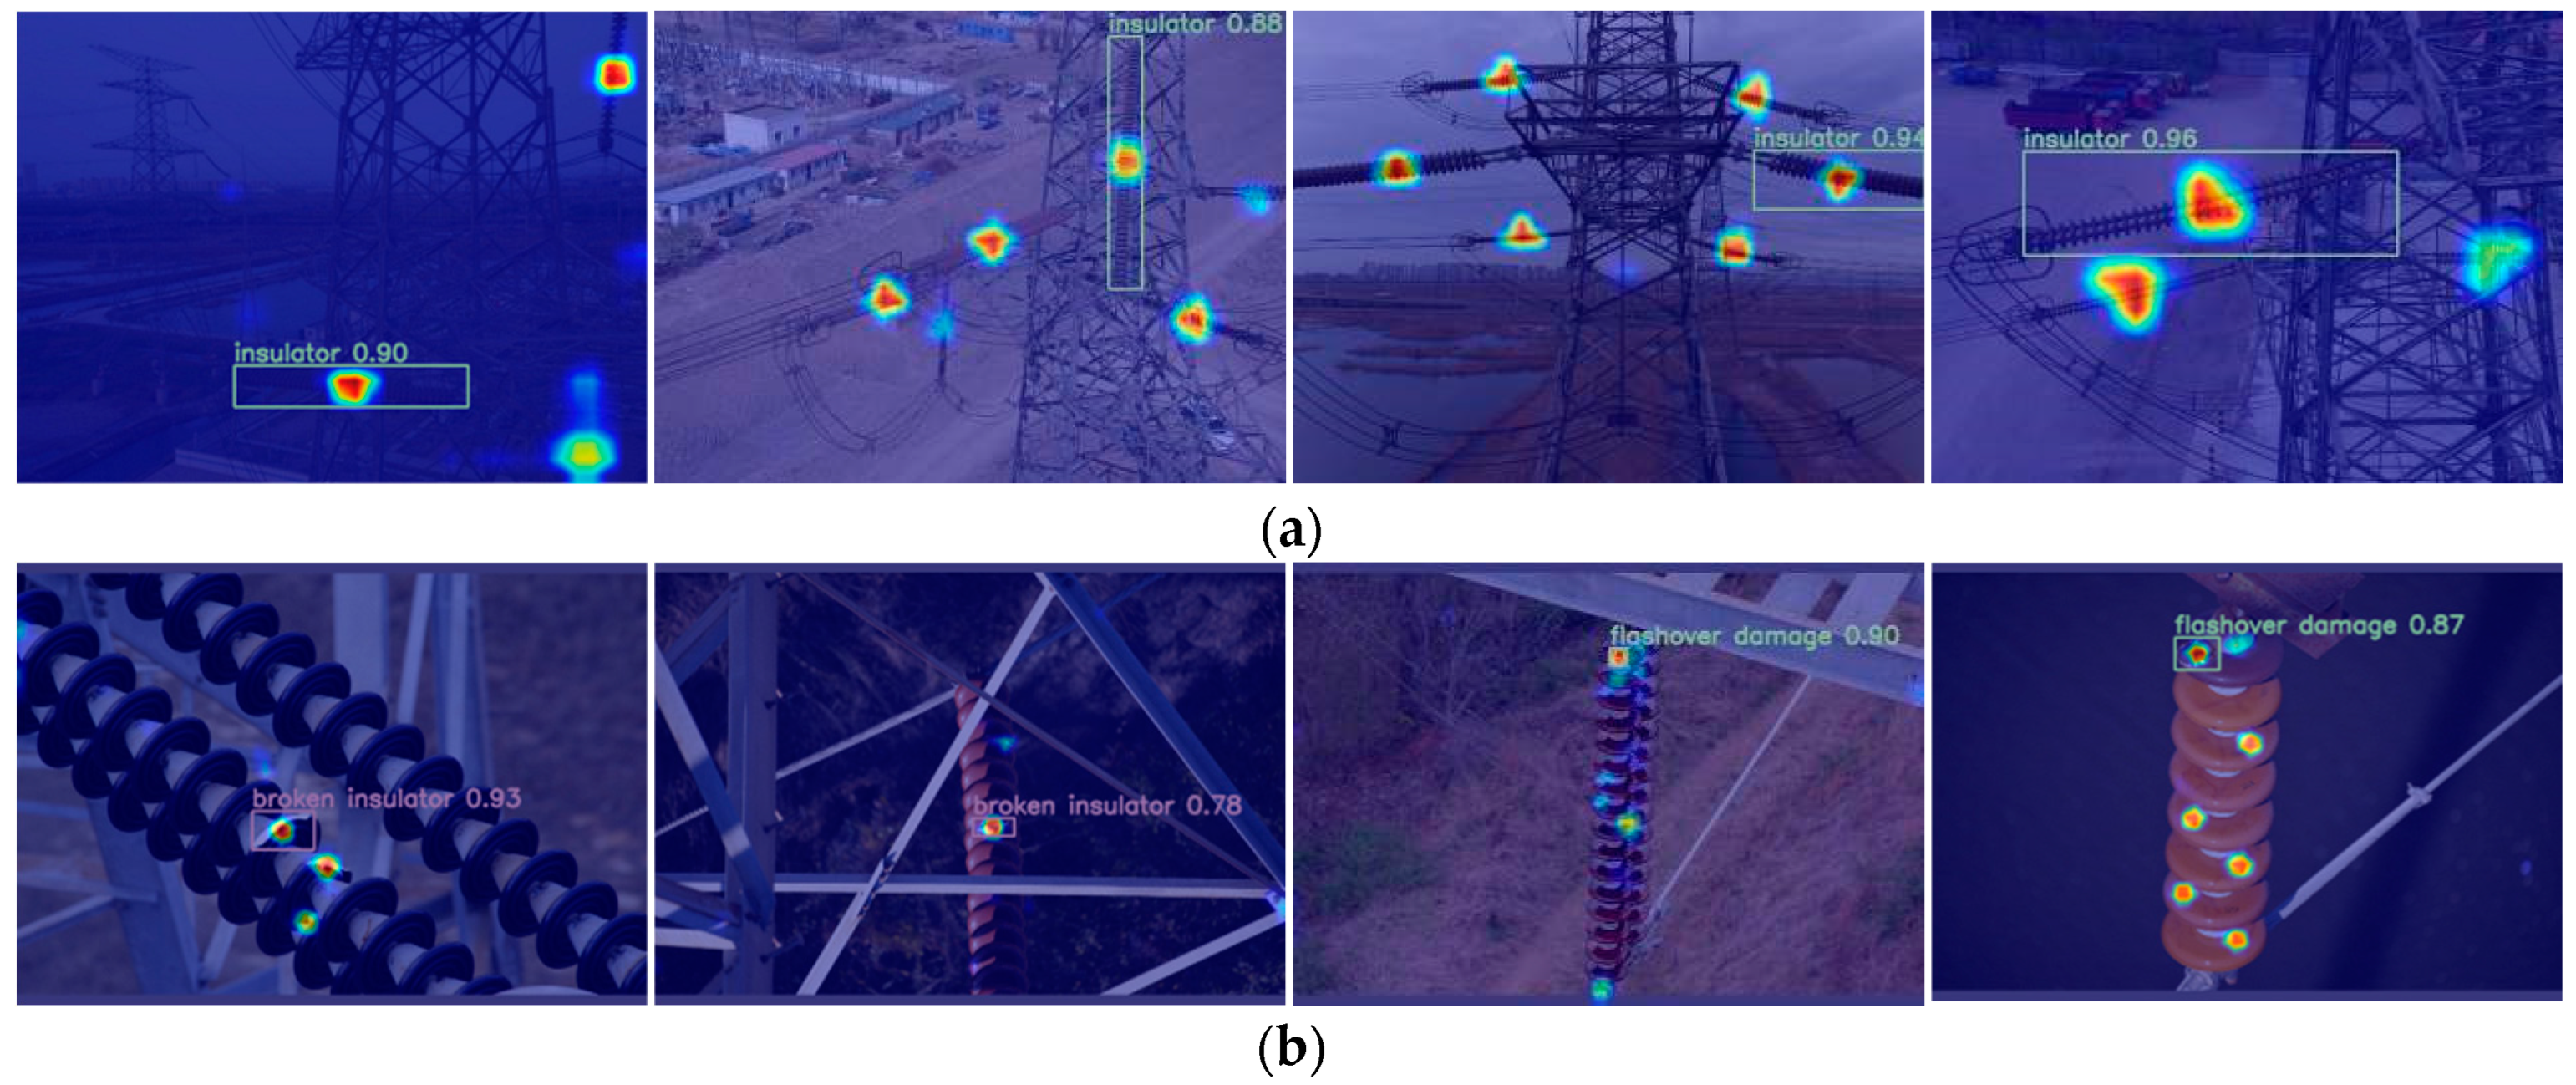
- Attention Mechanism: To address the challenge of varying insulator sizes and occlusion caused by transmission line towers, the ECA is incorporated into the backbone of YOLO v7. This mechanism dynamically learns the significance of various channels in the input image, effectively reducing the impact of pole occlusion and enhancing the detection algorithm’s accuracy.
- (3)
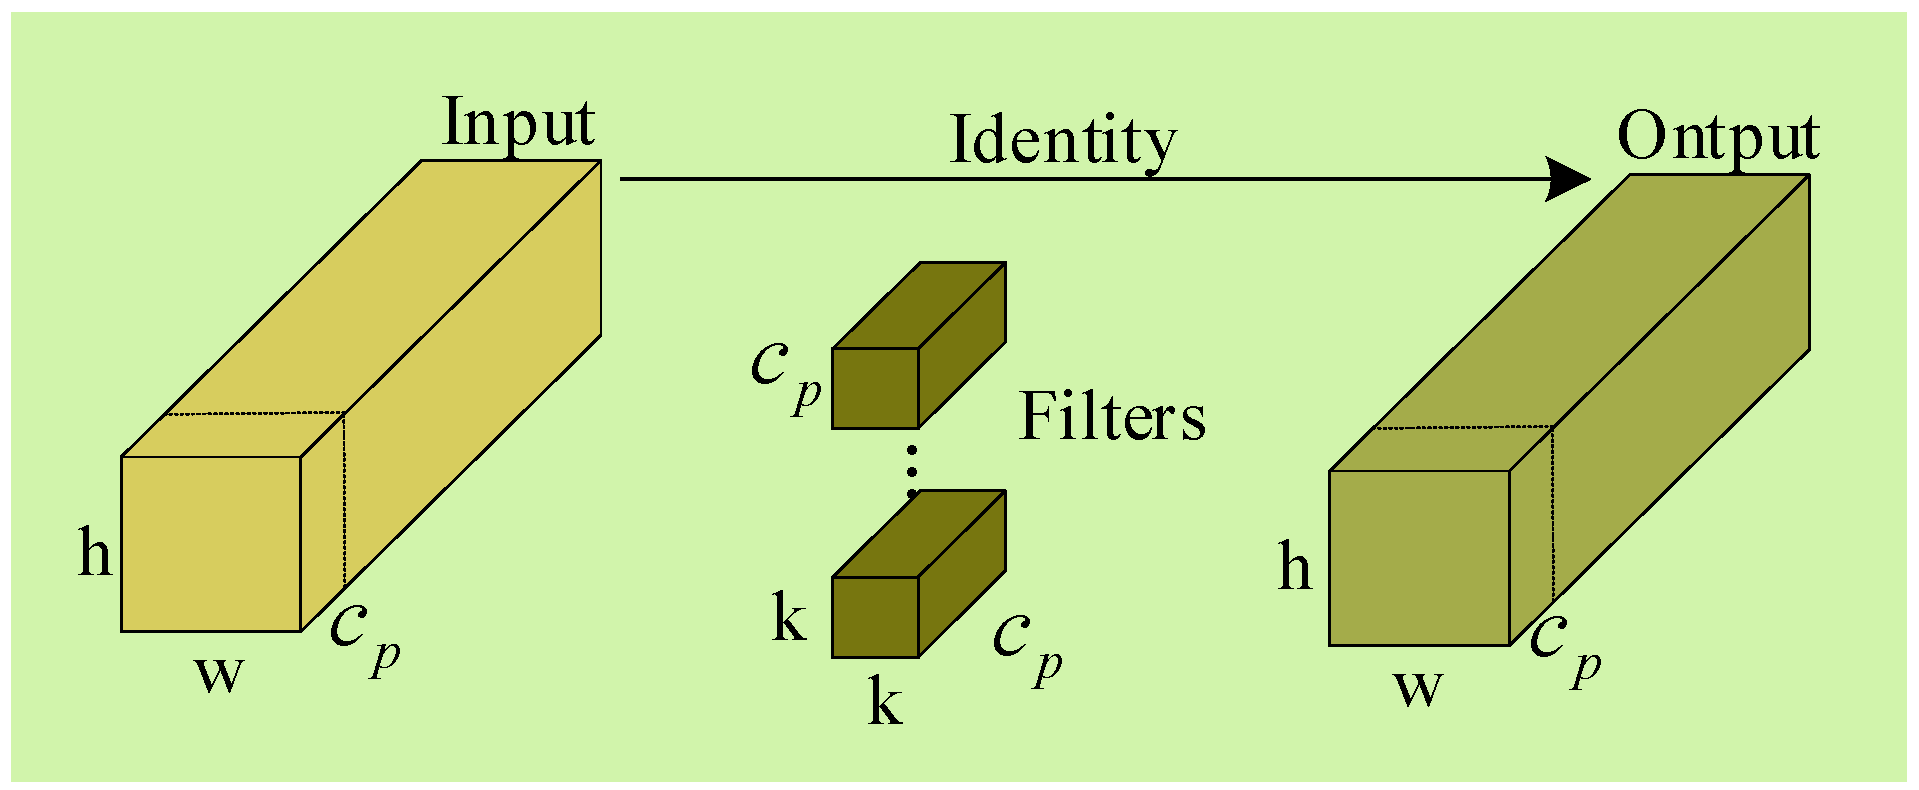
- Partial Convolution: The YOLO v7 network model has a complex network structure and many computational parameters, resulting in slower performance. To tackle this issue, partial convolution (PConv) is introduced as a replacement for traditional convolution in the YOLO v7 network model. PConv ensures both efficiency and detection accuracy while reducing computational parameters.
- (4)
- Normalized weighted detection: Due to the complex background of insulator images and the presence of small and dense insulators in datasets, insulator features can easily be lost during feature extraction, leading to missed detections. The YOLO v7 network model uses the Normalized Weighted Distance (NWD) metric instead of the traditional Intersection over Union (IoU) for target detection, which reduces the sensitivity of the IoU to the positional deviation of insulators with small targets, thus achieving the effective detection of insulators with small targets.
2. Enhanced YOLO v7 Defect Detection Method
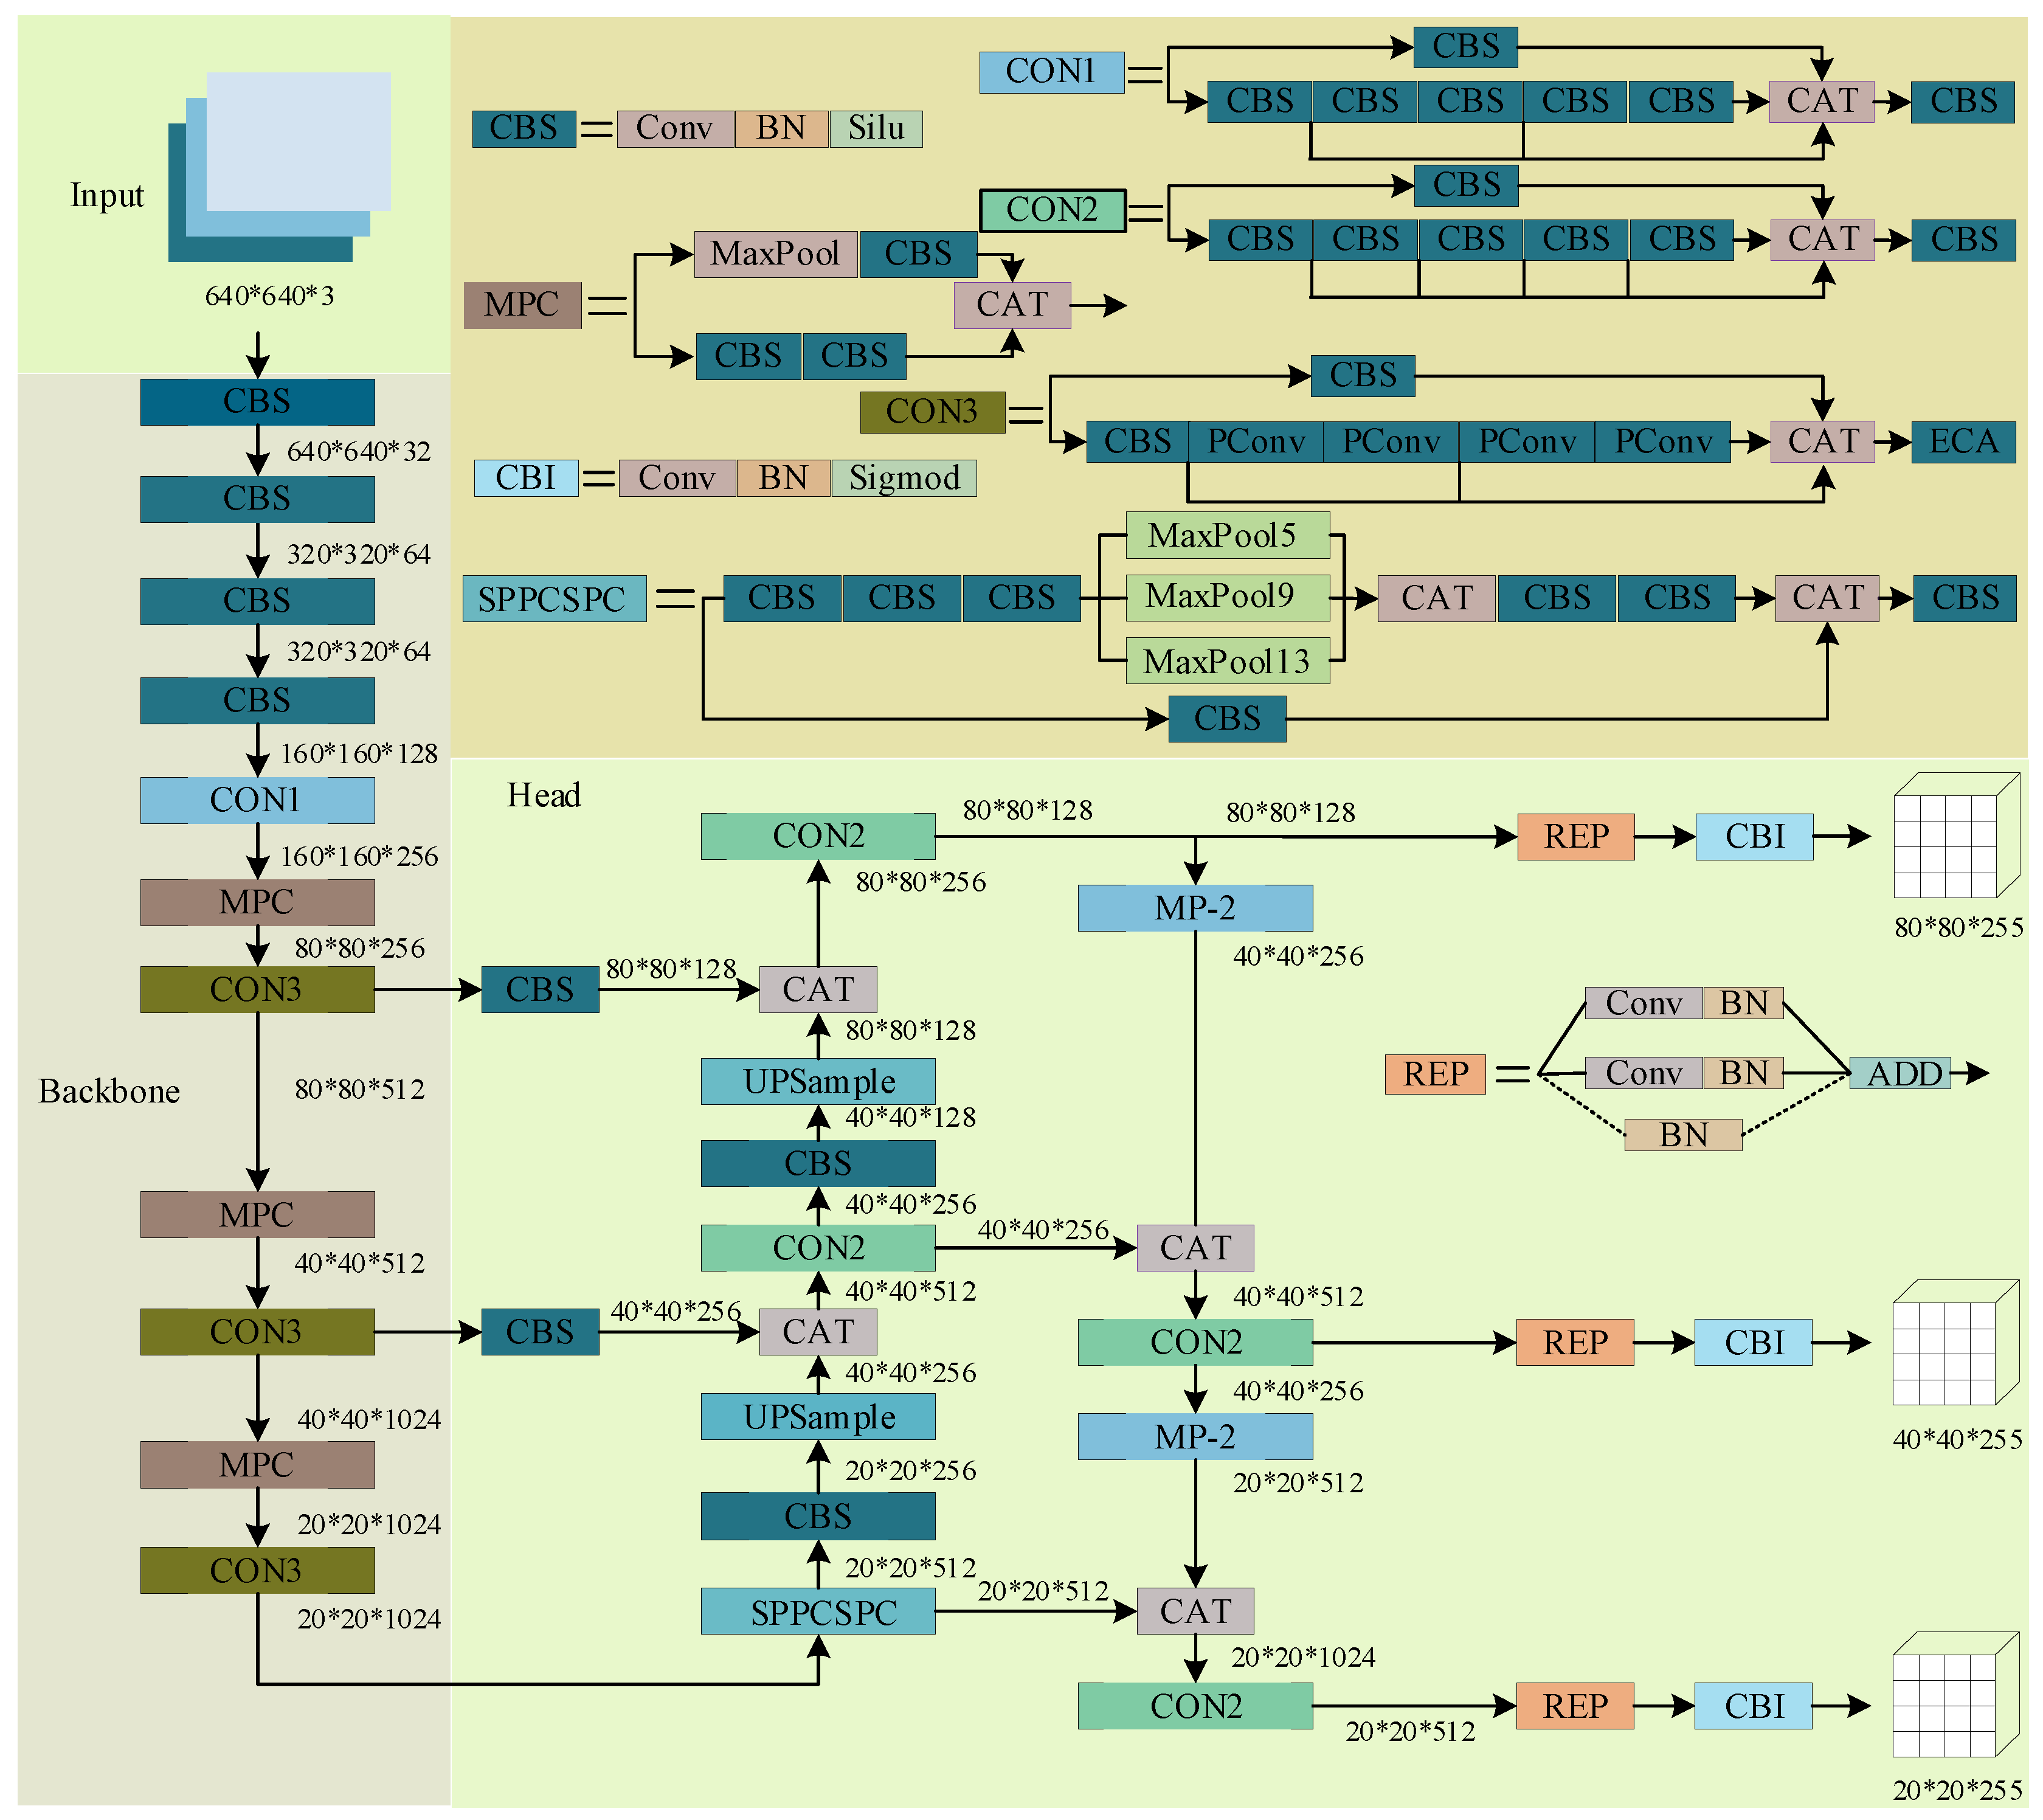
2.1. Overview of the YOLO v7 Algorithm
2.2. Insulator Detection Based on the Attention Mechanism ECA
2.3. PConv-Based Implementation of YOLO v7 Network Model for Fast Detection
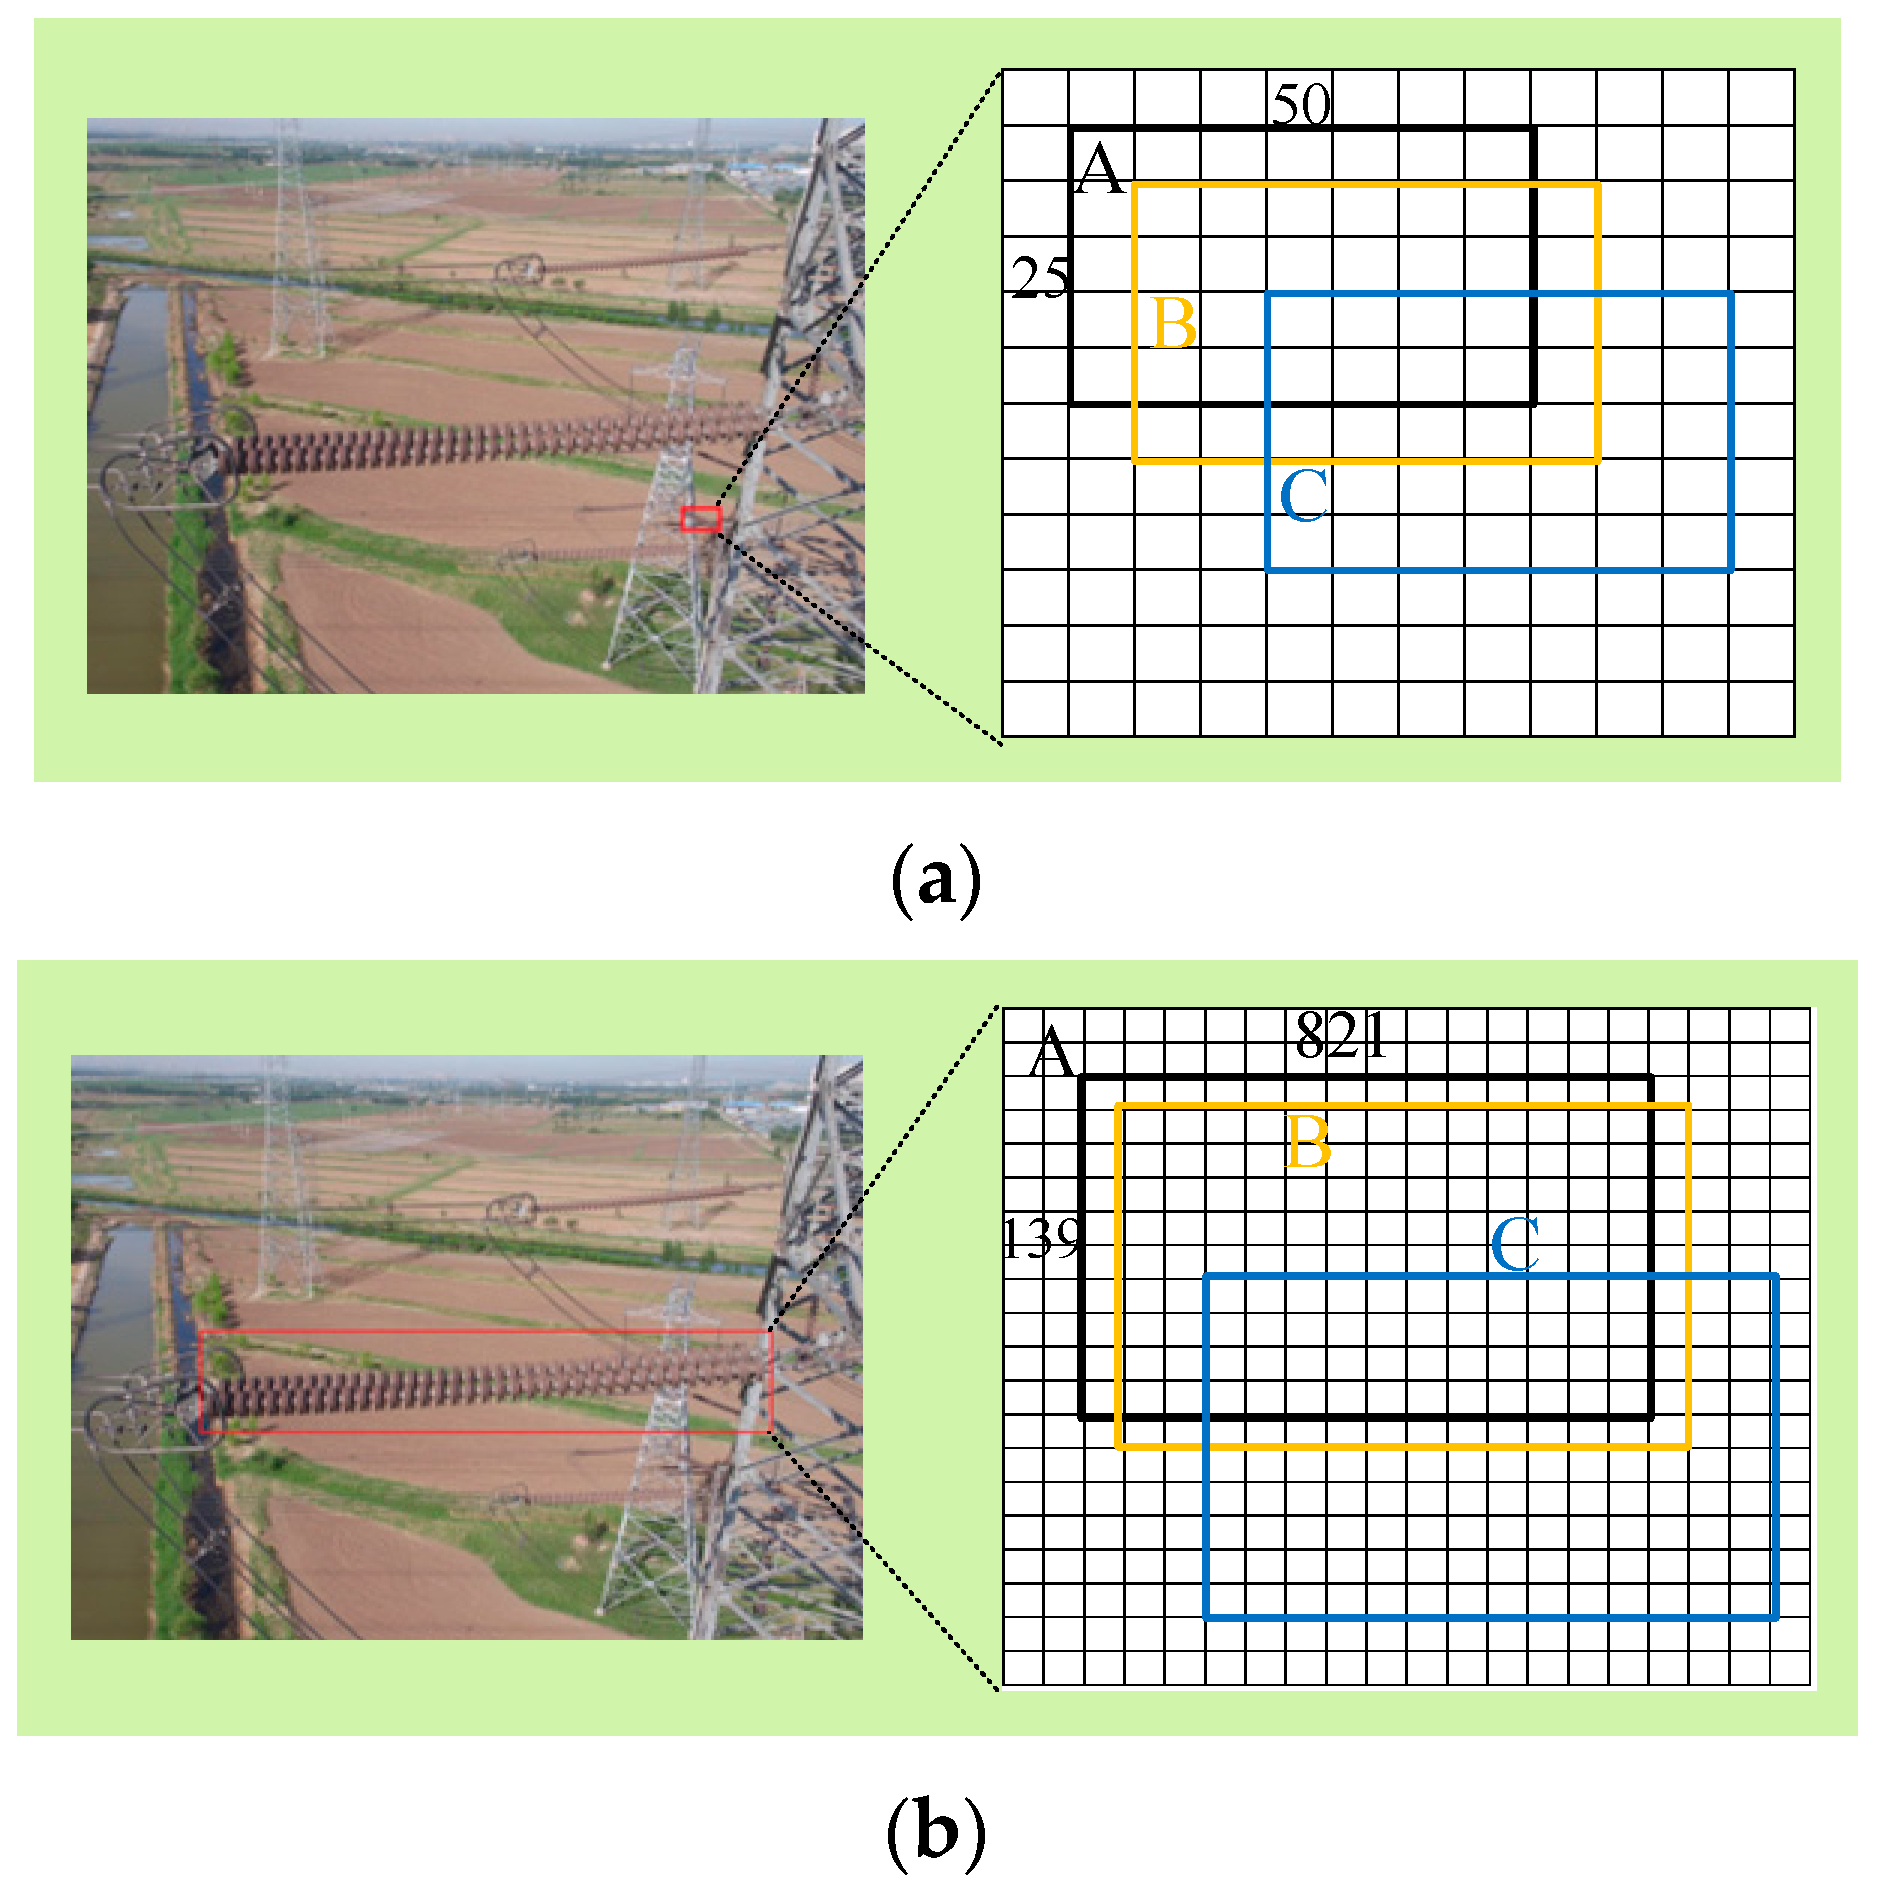
2.4. Small Target Insulator Detection Based on NWD
3. Experimental Results and Analysis
3.1. Experimental Platform
3.2. Data Description
3.3. Evaluation Indicators
3.4. Experimental Results and Analysis
3.4.1. Experimental Comparison of Different Attentional Mechanisms
3.4.2. Comparison of Different Convolution Experiments
3.4.3. A Comparison of Ablation Experiments
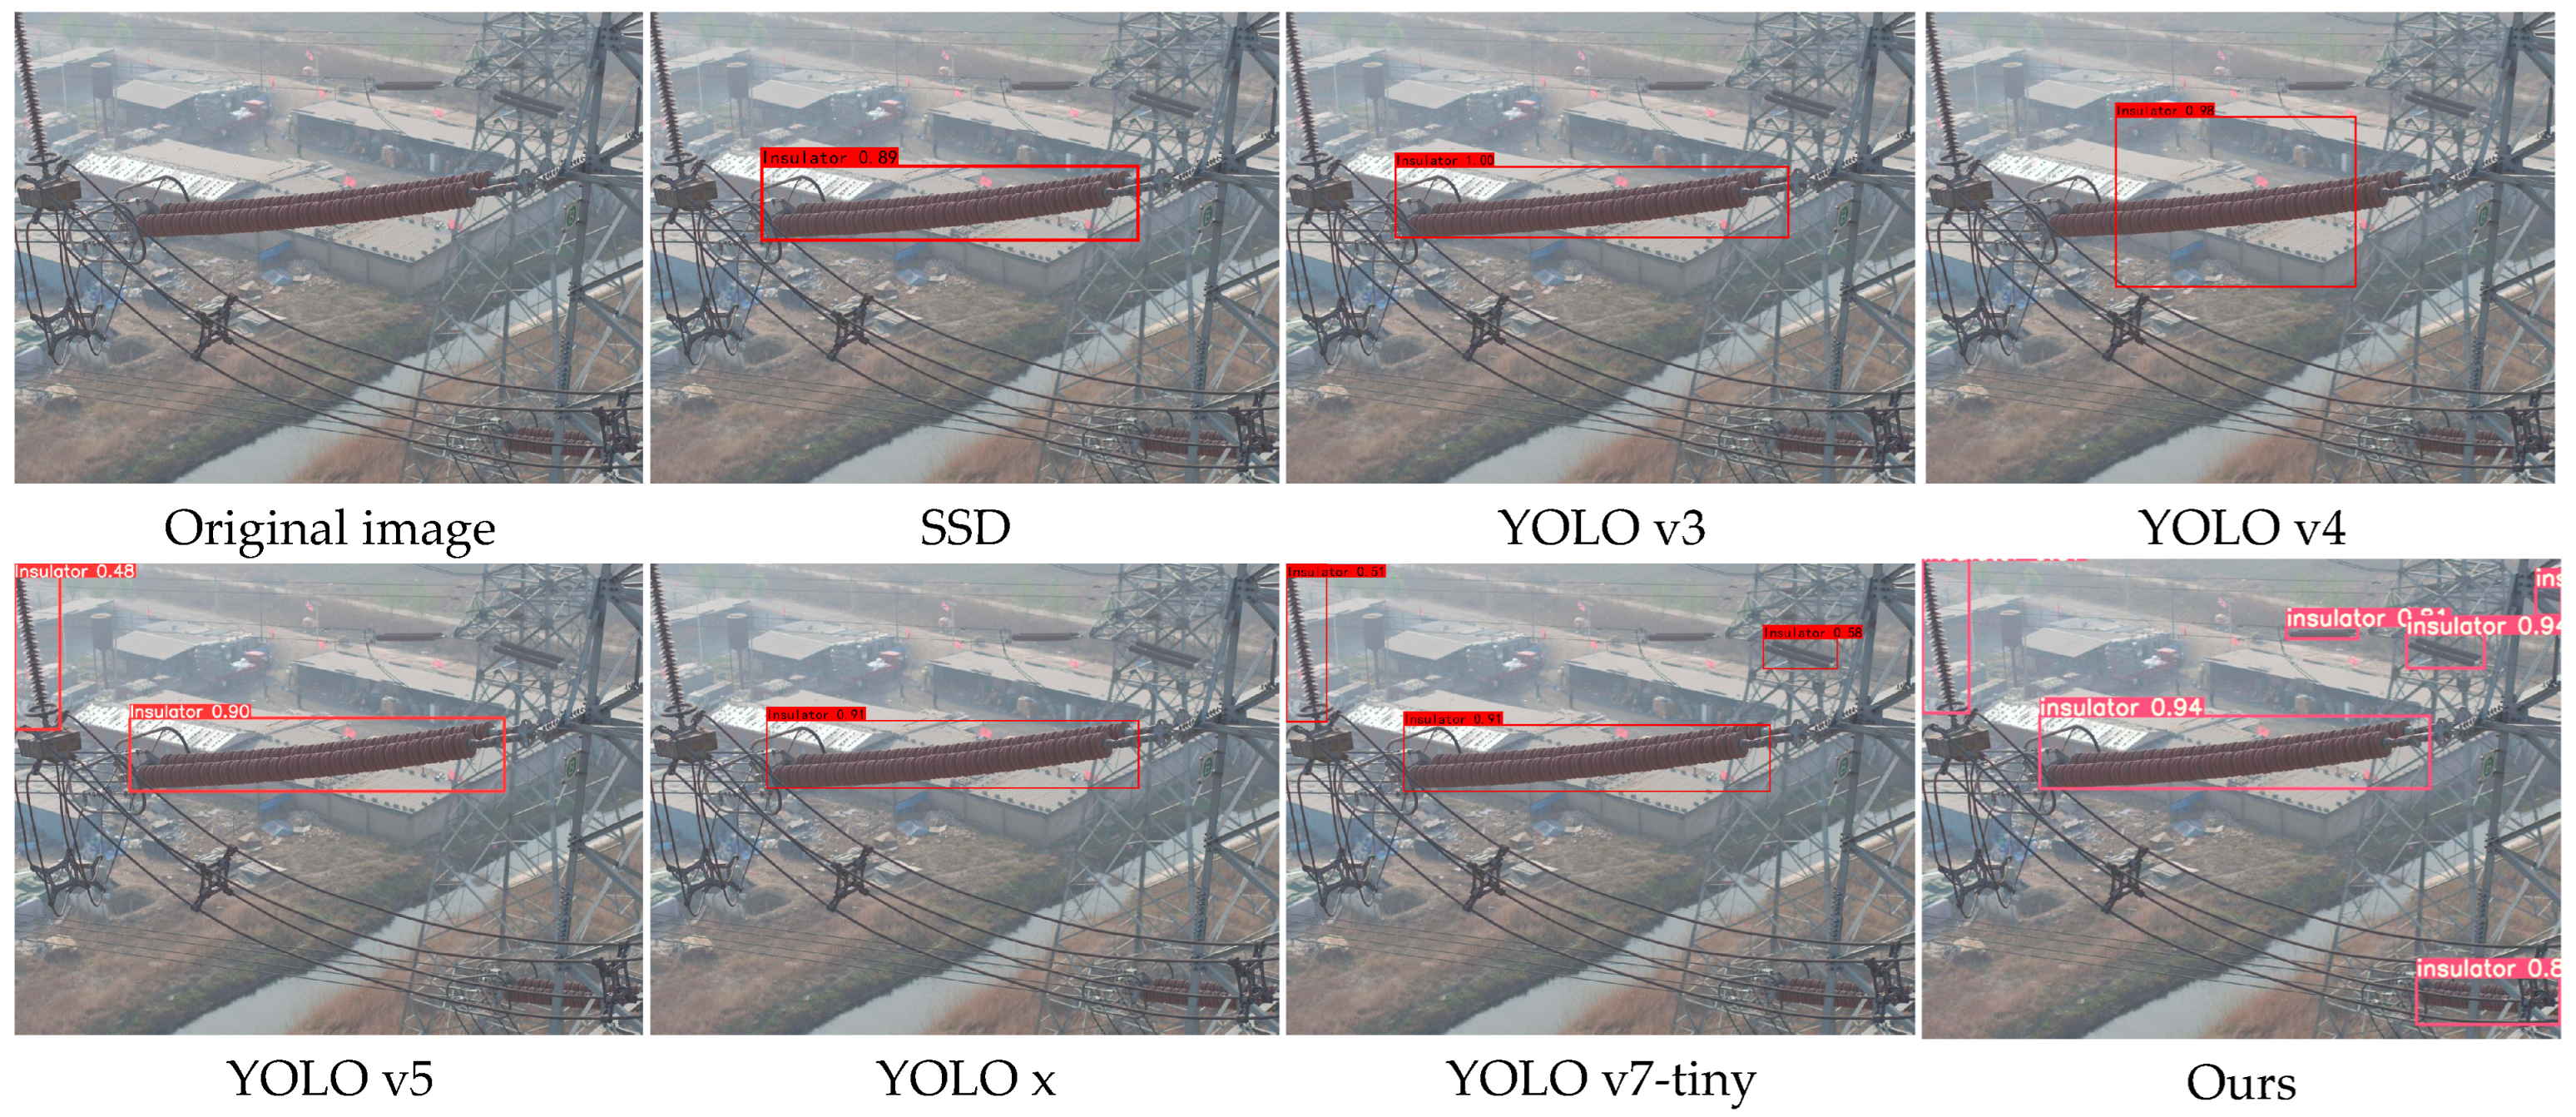
3.4.4. Experimental Comparison of Different Network Models
4. Conclusions
- (1)
- This paper proposes a model based on the YOLO v7-ECA-PConv-NWD network for identifying normal insulators, broken insulators, and flashover insulators in power transmission lines. After training, the model achieved detection accuracies of 98.1%, 93%, and 92.2%, respectively, resulting in enhanced performance. This provides a theoretical basis for the intelligent maintenance of power systems.
- (2)
- This paper proposes adding an ECA mechanism to the backbone of the YOLO v7 network model to improve its attention toward insulator features and reduce noise interference. As a result of this improvement, the accuracy of insulator detection could be enhanced.
- (3)
- A new PConv convolution was utilized in this paper to reduce the number of floating-point operations while processing insulators in the target detection task. By exploiting the similarity between different channel features and the redundancy in feature mapping, the PConv convolution successfully reduced the parameter size by 4.3 MB compared to conventional convolution. Despite this reduction, the accuracy of insulator detection remained largely unaffected.
- (4)
- This paper utilized NWD in place of the IoU ratio for target detection. By substituting NWD for IoU, the model became less susceptible to position deviations in small target insulators. Based on the fact that the center pixel has the highest weight and decreases from the center to the edge, it addresses the challenge of high miss detection rates in images.
Author Contributions
Funding
Data Availability Statement
Acknowledgments
Conflicts of Interest
References
- Mao, J.; He, Z.; Wang, Y.; Zhang, H.; Zhong, H.; Yi, J.F.; Tao, Z.M.; Chen, N.T. A review of research and applications on path planning technology for power inspection robots. Control. Decis. 2023, 1–16. [Google Scholar] [CrossRef]
- Liu, C.; Wu, Y.; Liu, J.; Han, J. MTI-YOLO: A lightweight and real-time deep neural network for insulator detection in complex aerial images. Energies 2021, 14, 1426. [Google Scholar] [CrossRef]
- Zhao, L.; Wang, P.; Yao, H.; Tian, M. Survey of power line extraction methods based on visible light aerial image. Power Syst. Technol. 2021, 45, 1536–1546. [Google Scholar]
- Yuan, W.H.; Liu, B.; Wang, Z.; Sai, T.; Xia, X.; Wang, F.; Zhong, L. Denoising of insulator hydrophobic image based on the guided filtering algorithm. J. Electr. Power Sci. Technol. 2021, 36, 135–140. [Google Scholar]
- Li, H.R.; Li, Z.H.; Wu, T.; Xu, X.R.; Fang, M.Q. Research on edge detection of insulators by canny operator optimized by two-dimensional maximum entropy threshold. High Volt. Appar. 2022, 58, 205–211+220. [Google Scholar]
- Huang, X.; Liu, X.; Zhang, Y.; Li, J.; Zhang, H.; Xing, X. Classification recognition method of the insulator in aerial image based on the red-blue difference and developed K-means algorithm. High Volt. Eng. 2018, 44, 1528–1534. [Google Scholar]
- Chen, G.C.; Gu, G.M.; Yu, X.N.; Li, Z.-b. Method for defect detection of catenary insulators by combining the features of PHOG and BOW-SURF. J. Chin. Comput. Syst. 2021, 42, 172–177. [Google Scholar]
- Mei, X.; Chen, J.; Wang, S.Y. Composite insulator hydrophobicity image detection method based on morphology. High Volt. Eng. 2013, 39, 3088–3094. [Google Scholar]
- Wu, Y. Research on Insulator Recognition Methods in Aerial Images Based on MACHINE Learning. Ph.D. Thesis, North China Electric Power University, Beijing, China, 2016. [Google Scholar]
- Huang, H.H. The Research and Implementation of Anomaly Detection System on High-Speed Rail Catenary Insulators Based on Multi-Core Parallel Technology. Ph.D. Thesis, Xi’an University of Electronic Technology, Xi’an, China, 2018. [Google Scholar]
- Liu, K.P.; Li, B.Q.; Qin, L.; Li, Q.; Zhao, F.; Wang, Q.L.; Xu, Z.P.; Yu, J.Y. Review of application research of deep learning object detection algorithms in insulator defect detection of overhead transmission lines. High Volt. Eng. 2023, 1–12. [Google Scholar]
- Gkioxari, G.; Hariharan, B.; Girshick, R.; Malik, J. R-cnns for pose estimation and action detection. arXiv 2014, arXiv:1406.5212. [Google Scholar]
- Ren, S.; He, K.; Girshick, R.; Sun, J. Faster R-CNN: Towards Real-Time Object Detection with Region Proposal Networks. IEEE Trans. Pattern Anal. Mach. Intell. 2017, 39, 1137–1149. [Google Scholar] [CrossRef]
- Zheng, R.J. Research and application of damaged insulator recognition based on R-CNN. Ph.D. Thesis, Hubei Minzu University, Enshi City, China, 2021. [Google Scholar]
- Yi, J.Y.; Chen, C.F.; Gong, G.Q. Aerial insulator detection of transmission line based on improved Faster RCNN. Comput. Eng. 2021, 47, 292–298+304. [Google Scholar]
- Tian, Z.J.; Wu, J.Q.; Zhang, W.Q.; Chen, W.; Yang, W.; Wang, S. An insulator faults detection method in low illuminance complex environment based TOE-Net. Power Syst. Technol. 2023, 1–14. [Google Scholar]
- Redmon, J.; Divvala, S.; Girshick, R.; Farhadi, A. You Only Look Once: Unified, Real-Time Object Detection. In Proceedings of the IEEE Conference on Computer Vision and Pattern Recognition, Las Vegas, NV, USA, 27–30 June 2016; pp. 779–788. [Google Scholar]
- Redmon, J.; Farhadi, A. YOLO9000: Better, Faster, Stronger. In Proceedings of the IEEE Conference on Computer Vision and Pattern Recognition, Honolulu, HI, USA, 21–26 July 2017; pp. 7263–7271. [Google Scholar]
- Redmon, J.; Farhadi, A. YOLOv3: An incremental improvement. arXiv 2018, arXiv:1804.02767. [Google Scholar]
- Zan, W.; Dong, C.; Zhao, J.; Hao, F.; Lei, D.; Zhang, Z. Defect Identification of Power Line Insulator Based on an Improved yolov4-tiny Algorithm. In Proceedings of the 5th International Conference on Renewable Energy and Power Engineering (REPE), Beijing, China, 28–30 September 2022; pp. 35–39. [Google Scholar]
- Zhu, X.; Liu, S.; Wang, X.; Zhao, Q. TPH-YOLOv5: Improved YOLOv5 based on transformer prediction head for object detection on drone-captured scenarios. In Proceedings of the IEEE/CVF International Conference on Computer Vision, Montreal, BC, Canada, 11–17 October 2021; pp. 2778–2788. [Google Scholar]
- Liu, W.; Anguelov, D.; Erhan, D.; Szegedy, C.; Reed, S.; Fu, C.-Y.; Berg, A.C. SSD: Single Shot Multibox Detector. In Proceedings of the Computer Vision–ECCV 2016: 14th European Conference, Part I 14, Amsterdam, The Netherlands, 11–14 October 2016; Springer International Publishing: Berlin/Heidelberg, Germany, 2016; pp. 21–37. [Google Scholar]
- Zhu, Y.C.; Zheng, Y.; Qin, J.L. Insulator target detection based on improved YOLOv3. Insul. Surge Arresters 2022, 2022, 166–171. [Google Scholar]
- Song, L.B.; Fei, Y.Q. A New YOLOv4-tiny neural network and its application on object detection of power-line insulators. J. Har Bin Univ. Sci. Technol. 2022, 27, 73–79. [Google Scholar]
- Wang, J.Y.; Xu, X.Y.; Xie, G.; Yan, G.W. Insulators self-explosion fault detection based on improved SSD model. Mod. Electron. Tech. 2022, 45, 115–121. [Google Scholar]
- Wang, C.Y.; Bochkovskiy, A.; Liao HY, M. YOLOv7: Trainable bag-of-freebies sets new state-of-the-art for real-time object detectors. In Proceedings of the IEEE/CVF Conference on Computer Vision and Pattern Recognition, Vancouver, BC, Canada, 17–24 June 2023; pp. 7464–7475. [Google Scholar]
- Wang, Q.; Wu, B.; Zhu, P.; Li, P.; Zuo, W.; Hu, Q. ECA-Net: Efficient channel attention for deep convolutional neural networks. In Proceedings of the IEEE/CVF Conference on Computer Vision and Pattern Recognition, Seattle, WA, USA, 13–19 June 2020; pp. 11534–11542. [Google Scholar]
- Chen, J.; Kao, S.; He, H.; Zhuo, W.; Wen, S.; Lee, C.H.; Gary Chan, S.H. Run, Don’t Walk: Chasing Higher FLOPS for Faster Neural Networks. In Proceedings of the IEEE/CVF Conference on Computer Vision and Pattern Recognition, Vancouver, BC, Canada, 17–24 June 2023; pp. 12021–12031. [Google Scholar]
- Wang, J.; Xu, C.; Yang, W.; Yu, L. A normalized Gaussian Wasserstein distance for tiny object detection. arXiv 2021, arXiv:2110.13389. [Google Scholar]


| Software | Details |
|---|---|
| OS | Windows 10 |
| CPU | Intel i5-12400F |
| GPU | NVIDIA GeForce RTX3060 |
| Memory size | 16 GB |
| Input | 640 × 640 px |
| Momentum | 0.937 | Weight decay | 0.0005 |
| Learning rates | 0.01 | Batch size | 8 |
| Dataset | Labels | Methods | Precision | Recall | mAP@0.5 |
|---|---|---|---|---|---|
| TISLTR | insulator | SE | 93.5% | 90.6% | 91.7% |
| CBAM | 96.7% | 93.8% | 92.1% | ||
| ECA | 90.9% | 93.7% | 94% | ||
| FILTER | flash | SE | 74.1% | 76% | 80.1% |
| broken | 83.8% | 67.9% | 74.7% | ||
| flash | CBAM | 81.3% | 83.4% | 87.4% | |
| broken | 85.2% | 77.2% | 81.3% | ||
| flash | ECA | 83.2% | 89.3% | 91.3% | |
| broken | 90.2% | 86.1% | 88.5% |
| Dataset | Labels | Convolutions | mAP@0.5 | mAP@0.5:0.95 | FPS | Params |
|---|---|---|---|---|---|---|
| TISLTR | insulator | Conv | 92.1% | 63.4% | 95.24 | 37.1 MB |
| PConv | 92.3% | 66% | 75.75 | 32.8 MB | ||
| FILTER | flash | Conv | 85.9% | 41.7% | 131.58 | 37.2 MB |
| PConv | 86.6% | 42.7% | 129.87 | 32.8 MB | ||
| broken | Conv | 81.9% | 40.6% | 131.58 | 37.2 MB | |
| PConv | 83.6% | 45% | 129.87 | 32.8 MB |
| Dataset | Labels | Methods | Precision | Recall | mAP@0.5 | mAP@0.5:0.95 |
|---|---|---|---|---|---|---|
| TISLTR | insultor | YOLOv7 | 90.9% | 93.7% | 92.1% | 63.4% |
| YOLOv7+ECA | 90.9% | 93.7% | 94% | 65.6% | ||
| YOLOv7+ECA+PConv | 91.2% | 96.8% | 96.7% | 66.5% | ||
| YOLOv7+ECA+Pconv+NWD | 96.8% | 93.7% | 98.1% | 68% | ||
| FITER | flash | YOLOv7 | 81.7% | 80.4% | 85.9% | 41.7% |
| broken | 92.6% | 73.2% | 81.9% | 40.6% | ||
| flash | YOLOv7+ECA | 83.6% | 90.2% | 91.3% | 47% | |
| broken | 89.9% | 89% | 90.8% | 52.5% | ||
| flash | YOLOv7+ECA+PConv | 81.5% | 91.6% | 91.1% | 48.1% | |
| broken | 91% | 87.5% | 92.5% | 54.6% | ||
| flash | YOLOv7+ECA+Pconv+NWD | 87.1% | 92.3% | 93% | 47.6% | |
| broken | 95.2% | 90.3% | 92.2% | 55.2% |
| Methods | Precision | Recall | mAP@0.5 |
|---|---|---|---|
| SSD | 92.36% | 59.92% | 78.18% |
| YOLOv3 | 93.47% | 76.86% | 88.31% |
| YOLOv4 | 92.00% | 57.02% | 75.69% |
| YOLOv5 | 91.7% | 87.5% | 89.3% |
| YOLOx | 88.56% | 86.36% | 90.43% |
| FasterR-CNN | 53.92% | 90.91% | 86.9% |
| YOLOv7-tiny | 91.82% | 83.47% | 92.01% |
| Ours | 96.8% | 93.7% | 98.1% |
Disclaimer/Publisher’s Note: The statements, opinions and data contained in all publications are solely those of the individual author(s) and contributor(s) and not of MDPI and/or the editor(s). MDPI and/or the editor(s) disclaim responsibility for any injury to people or property resulting from any ideas, methods, instructions or products referred to in the content. |
© 2023 by the authors. Licensee MDPI, Basel, Switzerland. This article is an open access article distributed under the terms and conditions of the Creative Commons Attribution (CC BY) license (https://creativecommons.org/licenses/by/4.0/).
Share and Cite
Zhang, J.; Wei, X.; Zhang, L.; Yu, L.; Chen, Y.; Tu, M. YOLO v7-ECA-PConv-NWD Detects Defective Insulators on Transmission Lines. Electronics 2023, 12, 3969. https://doi.org/10.3390/electronics12183969
Zhang J, Wei X, Zhang L, Yu L, Chen Y, Tu M. YOLO v7-ECA-PConv-NWD Detects Defective Insulators on Transmission Lines. Electronics. 2023; 12(18):3969. https://doi.org/10.3390/electronics12183969
Chicago/Turabian StyleZhang, Jianrui, Xia Wei, Linxuan Zhang, Libin Yu, Yannan Chen, and Meiqi Tu. 2023. "YOLO v7-ECA-PConv-NWD Detects Defective Insulators on Transmission Lines" Electronics 12, no. 18: 3969. https://doi.org/10.3390/electronics12183969
APA StyleZhang, J., Wei, X., Zhang, L., Yu, L., Chen, Y., & Tu, M. (2023). YOLO v7-ECA-PConv-NWD Detects Defective Insulators on Transmission Lines. Electronics, 12(18), 3969. https://doi.org/10.3390/electronics12183969