Abstract
The Beidou Radio Determination Satellite Service (RDSS) is an advantageous service of the Beidou system. However, due to the weak landing power of Beidou RDSS signals and an operating frequency close to the 5G frequency, the system is vulnerable to interference from ground signals. In this paper, from the perspective of civil aviation safety, different evaluation indicators are used for the takeoff and cruise phases, respectively, to study the impact caused by adjacent frequency interference on airborne Beidou RDSS equipment. In the takeoff phase, accurate aircraft position information is obtained by processing real trajectory files. Deterministic analysis methods are used to determine the safety distance for the coexistence of the two systems. During the cruise phase, ground-based 5G base stations have less influence on the airborne RDSS receiver due to the high flight altitude, so the main consideration is electromagnetic compatibility between the airborne Beidou RDSS system and the 5G ATG system. By establishing a Boeing 737–800 simulation model, the antenna isolation degree is used as the evaluation index, and a reasonable antenna layout is given according to the evaluation results. In this study, the theoretical simulation and real flight data are combined to summarise the exact range of adjacent frequency influence during the takeoff phase and a reasonable antenna layout during the cruise phase.
1. Introduction
The Beidou Radio Determination Satellite Service (RDSS) provides users with fast positioning, position reporting and short message communication services [1]. When the Beidou RDSS system is used for flight tracking, it can monitor and track an aircraft’s position and status in the air, and use its short message function to send information such as the aircraft’s current position, flight altitude and speed to the ground monitoring centre. If the flight deviates from the route or other unexpected situations occur, the airline staff can obtain relevant information in time and take necessary measures to improve flight safety and efficiency [2,3]. Beidou RDSS uplinks are located in the L-band (1559–610 MHz); downlinks are located in the S-band (2483.5–2500 MHz). According to 3GPP R16 TS38.104 [4], 5G is divided into two main frequency bands: FR1 (410–7125 MHz) and FR2 (24,250–52,600 MHz), of which the 5G band allocated to China Mobile is 2515 MHz. In addition, due to the ionosphere and the long distance of space transmission [5,6], the landing power of Beidou signals is around −160 dBW, which makes it somewhat vulnerable.redAs the Beidou RDSS system has not yet been used with 5G systems during the initial frequency design, the impact of 5G out-of-band spurious emission on the Beidou RDSS had not been taken into account. Consequently, the terrestrial 5G network could have an impact on the delicate Beidou system’s performance. This might lead, in severe cases, to malfunctioning of the RDSS system receiver. Therefore, the electromagnetic compatibility of the two systems will become an important factor of influence affecting the safe operation of civil aircraft. A diagram of the interference between the two systems’ adjacent frequencies is shown in Figure 1. The upper spectrum represents the transmitter power spectrum of the 5G signal whereas the lower spectrum shows the power spectrum of the RDSS receiver adjacent to it, where f indicates the center frequency of the receiver or transmitter. Moreover, the blue part represents the spurious radiation region of the 5G signal; if it falls within the main flap range of the receiver power spectrum, both the interfering signal and the useful signal will be detected by the receiver at the same time; thus, generating adjacent frequency interference.

Figure 1.
Diagram of adjacent frequency interference.
In 2012, there was a case of interference with GPS system caused by terrestrial communication systems (LightSquared) in the USA [7]. For instance, O’Driscoll et al. used experimental data to demonstrate that LightSquared’s LTE signals could affect GPS system in the L1/E1 band and Galileo civil signals [8]. In a study concerning the compatibility issues between both systems, Godet et al., of the European Commission’s Galileo Architecture Support Team, used the interference coefficient and the equivalent carrier-to-noise ratio as metrics to analyze the intersystem and intra-system interference [9]. Moreover, in 2014, Marco Rao et al. of the European Commission’s Joint Research Centre, pointed out that interference from LTE signals can have an impact on pseudo-range error and position errors and suggested that the receiver RF front-end plays an important role in protecting GNSS signals from interference [10]. Furthermore, in 2017, Zhang Xingjian et al. from the Civil Aviation Institute of Science and Technology of China, carried out a performance test of the Beidou RDSS general aviation operational surveillance service, and the subsequent results verified that Beidou RDSS could be able to provide equivalent services under different flight phases and latitude regions [11]. Subsequently, research regarding the interference between LTE signals and Beidou RDSS signals was initiated. For example, in 2019, the Beijing Satellite Navigation Centre proposed a countermeasure strategy for 4G interference with Beidou RDSS considering the RF system [12]. In addition, Beijing University of Posts and Telecommunications has also successively carried out research on adjacent frequency interference between satellite navigation systems and terrestrial wireless communication services in different frequency bands. Moreover, they launched, in specific scenarios, an analysis of the interference between the uplink of the terrestrial communication systems and Beidou terminals. Therefore, they developed the Max-ACIR resource scheduling algorithm, and obtained a closed-form solution to determine the isolation distance based on its analysis using a Gaussian function fitting the base station [13,14]. Later on, as 5G entered a rapid development stage, researchers began to study the compatibility between 5G signals and satellite navigation signals. In 2021, Beijing Satellite Navigation Centre analyzed, once more, the impact of 5G signals on Beidou RDSS from the signal perspective [15], and in 2022 Xi’an University of Posts and Telecommunications analysed the impact of 5G signals on the CN0-loss, communication and positioning of Beidou RDSS from the system perspective [16]. However, the above studies mostly focus on analyzing the capture performance, carrier-tracking performance, code-tracking performance, and demodulation performance of BeiDou signals under interference conditions from a signal perspective. Moreover, they establish the relationship between relevant assessment parameters and the equivalent carrier-to-noise ratio, along with providing the calculation method. However, this method only evaluates the interference impact based on the signal perspective; hence, it does not provide the exact impact range for this study and cannot be applied to the actual civil aviation field. Therefore, in this paper an interference assessment is mainly conducted from the system perspective, that combines the simulation model with the actual flight data, obtains the specific influence range of the 5G system interference on the Beidou RDSS system, and applies the compatibility opinion from a practical application perspective.
To sum up, based on an analysis of the coexistence of the 5G system and RDSS system compatibility, this paper adopts a differentiated approach by selecting different evaluation indexes for the takeoff and cruise phases. The aim is to evaluate the compatibility of Beidou RDSS airborne equipment with the 5G system while focusing on the perspective of aviation safety. In Section 2, three models are introduced, namely the RDSS signal model, the 5G base station model, and the 5G base station distribution model around the airport as they provide a reliable system model for the subsequent interference assessment. In Section 3, the takeoff approach phase is mainly evaluated. During this phase, the aircraft is at a low altitude above the ground, and the main considerations are the 5G antenna model, the propagation channel, and the base station distribution mode, etc. The aggregate interference is chosen as the evaluation index to study the impact of the interference on the RDSS receiver caused by the combined effect of 5G base stations near the airport ground. In Section 4, it is mainly evaluated in the cruise phase. When the aircraft enters the cruise phase, the flight altitude reaches a stabilized level between 8000 and 12,500 m. Due to the high flight altitude, the impact of ground-based 5G base stations on the RDSS receiver becomes negligible. In this phase, antenna isolation is used as a parameter to assess the electromagnetic compatibility of both airborne systems, and the Boeing 737–800 acts as a carrier to study the impact of factors such as airborne antenna layout and different Radio Frequency (RF) indicators of airborne equipment on the assessment results. Finally, In Section 5, based on the research content and the simulation data results, we provide a systematic summary and analysis, and suggest further ideas to increase the compatibility between the 5G system and the Beidou RDSS system in the full flight segment. The assessment results can provide reference for airworthy installation and promote the application of Beidou and 5G ATG systems in civil aircraft.
2. System Models
This section introduces three main parts. The separate sections are RDSS signal modelling, 5G base station antenna model and simulation analysis of 5G base station distribution around the airport to provide support for later aggregate interference simulation.
2.1. RDSS Signal Model
The RDSS system is a frequency conversion and retransmission satellite system, in which the downlink signal is sent from the main control station to the user terminal via satellite. The Beidou RDSS signal is a short-burst spread spectrum signal with a central frequency point of 2491.75 MHz and modulation method of Quad-Phase Shift Keyed (QPSK) [17]. The Beidou-2 RDSS signal can be divided into p and q orthogonal branch signals where each one can work independently. The Beidou-3 RDSS signal includes both data and pilot channels [18]. The Beidou RDSS signal, acquired by the receivers, can be expressed as follows:
where A represents the amplitude, is the spreading code, indicates the navigation message, presents the initial phase, and is the signal carrier frequency. Based on Equation (1), a block diagram of RDSS signal modulation is given in Figure 2.
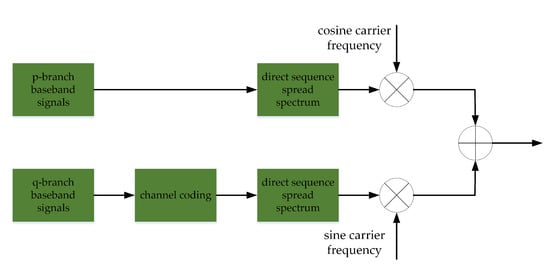
Figure 2.
RDSS signal modulation block diagram.
The sources of phase measurement error in the Phase Lock Loop (PLL) include the phase jitter and the dynamic stress error. The phase jitter is further divided into three main types of error: thermal noise, jitter in the oscillation frequency caused by mechanical chatter, and Allan squared error. As for the dynamic stress errors, these are negligible as they are very small compared to phase jitter errors when the equivalent carrier-to-noise ratio satisfies the signal capture. Therefore, the mechanical chattering of the receiver unit causes a jitter in the receiver reference oscillation frequency with a mean squared deviation of approximately 2° [19]. The equation for estimating the mean squared deviation of thermal noise is defined as follows [20]:
By combining the three sources of phase jitter, the total phase jitter error mean squared error can be estimated as follows:
represents the phase-locked loop noise bandwidth; T indicates the pre-detected integration time; is the carrier-to-noise ratio; represents the vibration-induced oscillator jitter and indicates the Allan variance induced oscillator jitter. In practice, the source of PLL flutter may be transient, and only carrier-tracking errors, caused by thermal noise are generally considered. Figure 3 shows the carrier-tracking error plot versus the equivalent carrier-to-noise ratio for different pre-detection integration times where the receiver carrier loop noise bandwidth is constant and equal to 20 Hz. The longer the pre-detection integration time, the smaller the effect of interference on the carrier-tracking performance.
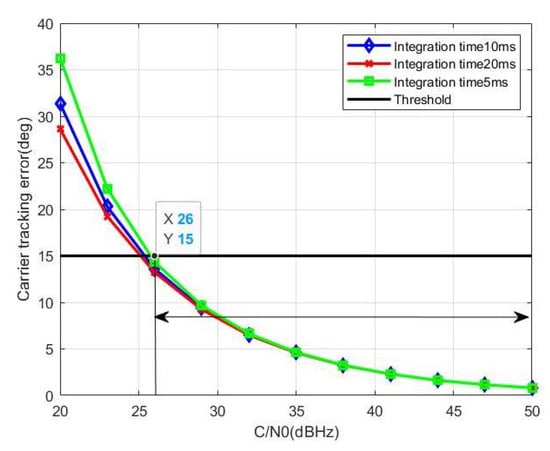
Figure 3.
Carrier-tracking error varies with carrier-to-noise ratio.
2.2. 5G Antenna Model
5G systems use Active Antenna System (AAS) antenna technology (3GPP TR 37.842 2017) [21]. In the study of aggregate interference in the 2.5 GHz band, 5G base stations are configured using beamforming antennas [22,23]. The purpose of beamforming is to generate directional beams by adjusting the angle and the weight coefficient of each antenna as a way to generate the antenna array gain. The antenna model is shown in Figure 4.
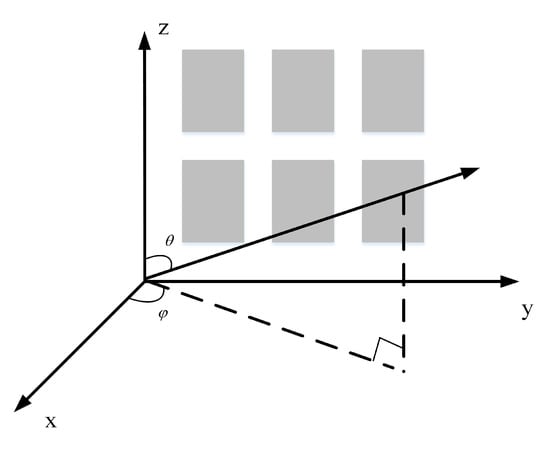
Figure 4.
Geometry of the antenna model.
As the beamforming antenna is a combination of several array antennas, the gain of the array antenna needs to be determined first. Therefore, the array antenna calculation formula is shown below [24]:
where and are the horizontal and vertical gains of the array antenna, and are the horizontal and vertical 3 dB beamwidth of the array antenna, respectively. Moreover, represents the front-to-back ratio of the array antenna, is the side flap level limit, is the maximum gain of the array antenna; all these values can be found in 3GPP TR 37.842, both in dBi. In actual communication, the gain generated by each beam can be obtained using the following equations:
where represents the gain of the array antenna in the horizontal or vertical direction, indicates the gain of the beamforming antenna in the corresponding direction (both variables are measured in dBi). Moreover, is the phase shift matrix factor, is the weight coefficient, and , correspond, respectively, to the downward angle and horizontal angle of the antenna. The simulations gain diagrams of the 5G base station beamforming antenna in the vertical and horizontal directions are shown in Figure 5 and Figure 6.
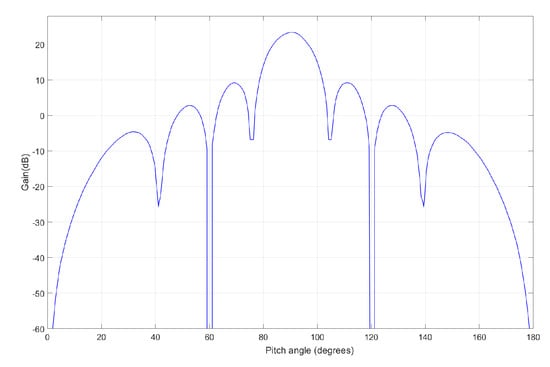
Figure 5.
Vertical gain diagram.
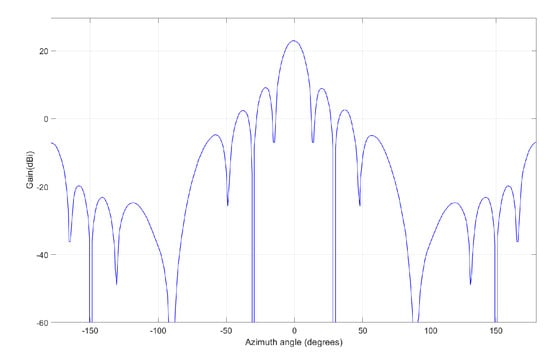
Figure 6.
Horizontal gain diagram.
After the calculation of the beamforming antenna gain directional diagram, it can be determined that the gain of the 5G base station transmitting antenna will not exceed 23.4 dBi. Therefore, within the simulations, the gain of the 5G base station transmitting antenna can be reasonably within this range.
2.3. Base Station Distribution Modelling
The density of the 5G base stations, distributed around airports, depends on the location of the specific airport and its regulations. In general, this density is high to ensure the quality of communication for the people and equipment on board both the airport and the aircraft. In the literature [25], it is stated that the deployment of the actual ground base station is close to the Poisson Point Process (PPP), and the system is modeled using random geometry, distributed over the simulated area using a random generation. The simulation produces a 10 km ×10 km area centred on the airport, as shown in Figure 7. The blue circles show the base stations in the external area of the airport where the cellular cell density is relatively high compared to the airport. In addition, the circled part indicates the airport area and the internal red circles show the internal 5G base stations in the airport. According to the regulations of the 5G base station construction in the airport area, the 5G base stations are mainly concentrated in the airport terminal, the gates, and other areas with high traffic flow and high communication demand; thus, the distribution is relatively concentrated.
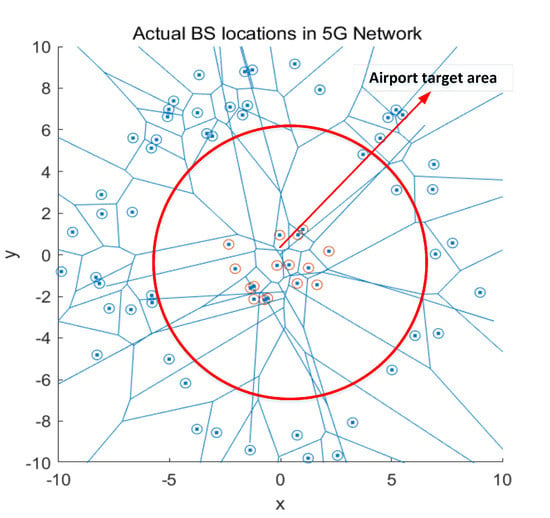
Figure 7.
Simulation of 5G base station distribution in and around the airport.
Each base station in Figure 7 uses the beamforming antenna model described in Section 2.2. Since the impact of interference generated by 5G users is small, only the aggregate interference generated by 5G base stations to aircraft within the target range is considered in this paper.
3. Takeoff and Landing Phase Assessment
3.1. Interference Scene Building
A single point of interference is used during the takeoff phase to create the interference scenario shown in Figure 8.
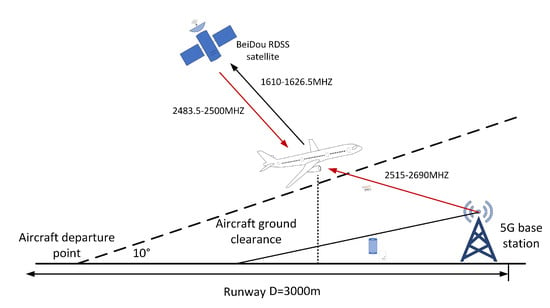
Figure 8.
Scenes of aircraft taking off with interference from ground base stations.
The dotted line in Figure 8 represents a virtual flight path established when the aircraft takes-off from the location at an angle of about 10° with the horizontal. The position of the aircraft departure point is related to the length of the airport runway, the takeoff weight, the weather, and other factors. In the case of the Boeing 737–800, for example, the departure point is typically 50–60% of the runway length horizontally from the beginning of the runway.
3.2. Interference Assessment Methods
This paper considers two different transmission paths to calculate transmission losses. The worst-case scenario, assuming a propagation environment where the interfering signal is not blocked by the buildings and the propagation path is the Line Of Sight (LOS) transmission, uses a free-space propagation loss model as indicated in the following equation:
where, f represents the frequency in MHz and d indicates the distance from the aircraft to the receiver in m. The second transmission path is the path loss model according to 3GPP TR 36.873 and ITU-R M.2412 [26]. The propagation of 5G signals is divided into Urban Macro (UMa) and Rural Macro (RMa) scenarios. Moreover, the transmission schematic is shown in Figure 9. The airport construction environment requires a flat, obstacle-free and wind-stable area to ensure safety during takeoff, landing and flight. Given these comprehensive airport construction considerations, the 5G signals propagation model for the airport field is selected as RMa. In addition, due to the airport’s terminal building, and other building facilities, the signal propagation may be transmitted through reflection, diffraction, and scattering processes to reach the receiver. Therefore, Non-Line Of Sight (NLOS) is selected as the signal transmission method.
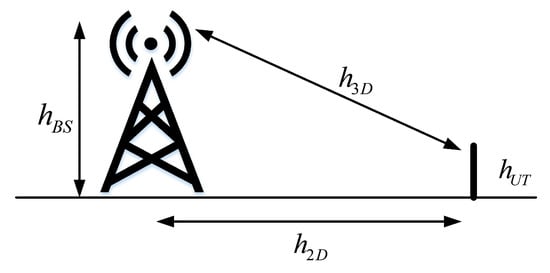
Figure 9.
Diagram of 5G signal propagation.
The NLOS path loss model for the RMa scenario is calculated as follows:
where, represents the signal frequency in GHz; shows the horizontal distance from the antenna at the transmitting end of the base station to the antenna at the receiving end of the user, indicates the spatial distance between the two systems, and are, respectively, the actual user antenna height and actual base station antenna height, h represents the average height of the buildings, and W indicates the width of the street. Note that all the above height quantities are in measured in m. The interference generated by a single 5G base station at the airborne RDSS system can be calculated as follows:
where represents the transmit power of the scrambled system (measured in dBm), and are, respectively, the transmit antenna gain of the scrambled system and the receive antenna gain of the disturbed system (measured in dBi), shows the feeder loss of the RDSS receiver in dB; presents the propagation path loss of the interference signal; is the adjacent channel leakage ratio (measured in dB), whose values are available in 3GPP TR 36.942 2018 [27]. The aggregate interference caused by 5G base stations to airborne RDSS systems can be calculated as follows:
is the maximum acceptable interference power level of the receiver, considered equal to −127 dBm according to the BD420007-2015 [28].
3.3. Simulation Results and Analysis
In this paper, different routes are chosen for comparison, and the data are obtained from the official FlightAware download, which includes real flight path files. To ensure accurate and reliable data, interpolation is carried out to obtain the aircraft’s position information per second. Moreover, the specific process is implemented as shown in Figure 10.
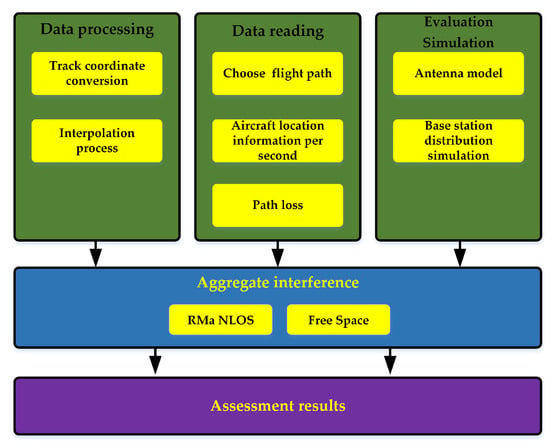
Figure 10.
Interference assessment analysis implementation process.
According to the 5G signal propagation methods, 5G antenna models and base station distribution introduced in Section 3.2, the flight paths of Berlin to Washington UAL235 (EDDB-KIAD), New York to Los Angeles DAL482 (KJFK-KLAX) and Tianjin to Chengdu CSC8861 (ZBTJ-ZUTF) are selected for analysis. Finally, the simulation of the variation of the aggregate interference under different propagation environments is displayed in Figure 11.
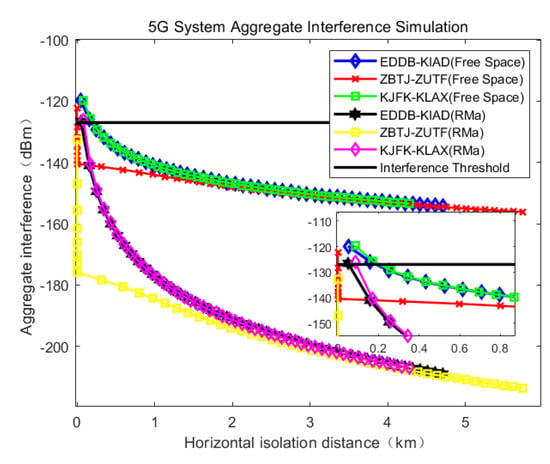
Figure 11.
Aggregate interference versus horizontal separation distance for different routes.
Since the 5G system is distributed in high density around the airport but with low transmission power, and the beamforming technique used enables the main lobe signal to be aimed at the user, the impact of interference is reduced on the RDSS system. Moreover, the simulation results show that the total aggregate interference from the ground 5G signals to the airborne RDSS receiver is related to the 5G signal propagation environment and the flight altitude as well as the horizontal projection distance. The horizontal isolation distance of the aircraft’s projection on the ground from the centroid of aggregate interference increases as the aircraft takes off and the altitude increases. Concurrently, the aggregate interference continuously decreases. In particular, the total aggregate interference value in the RMa NLOS scenario is slightly smaller than in the free space propagation due to the consideration of building shading equal to the factor. Since some routes in China lack ADS-B data information during the takeoff phase, the following analysis focuses on the aggregate interference data of EDDB-KIAD and KJFK-KLAX in Table 1.

Table 1.
Aggregate interference data analysis for EDDB-KIAD and KJFK-KLAX.
Considering the signal propagation environment, the horizontal isolation distance between both routes without interference effects is approximately 50–180 m, with slightly variations depending on the type of aircraft and the departure airport environment. According to the ICAO runway category A–F, the runway length of civil airports is within the range of 2000–4000 m. Furthermore, airports are constructed with a certain safety spacing to ensure the safety of aircraft during takeoff and taxiing. Before aircraft enter the runway, they need to wait for takeoff instructions on the taxiway. No large base stations can be built within the entire airport site to avoid any adverse impact on the operational safety. Therefore, combined with the above real airport construction environment, the interference between both systems is negligible under the influence of the real airport environment and no additional isolation measures are necessary. To sum up, this simulation method can be analogous to assess interference during the landing phase ensuring that the results maintain their generality.
4. Cruise Phase Assessment
4.1. Interference Scene Building
5G ATG is an air-to-ground communication method based on fifth-generation mobile communication technology, i.e., ground base stations are deployed along the flight path to transmit radio signals into the air, and high-bandwidth communication services are provided to airborne aircraft using ground-to-air communication links [29,30]. The propagation of ATG base stations and aircraft is shown schematically in Figure 12. According to the regulations of civil aviation ATG, the ATG system is only turned on during the cruise phase. When the aircraft is in the cruise phase, because of the high flight altitude, there is less possibility for the ground 5G base station to cause a safety threat to the RDSS receiver; therefore, the main factor that affects safety after the aircraft enters the cruise phase is interference between the airborne RDSS system and the 5G ATG system. Furthermore, the ATG base stations, shown in Figure 12 cover cells with a radius of 100–200 km, and the cell overlap band is about 20% [31].
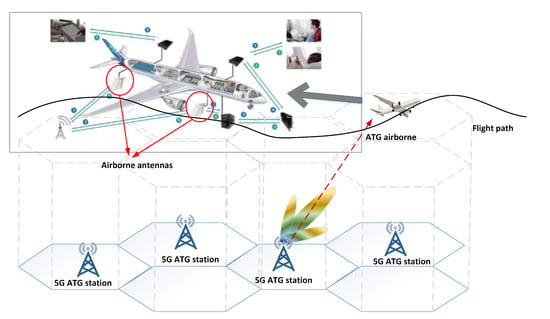
Figure 12.
5G ATG system layout by aircraft route.
4.2. Interference Assessment Methods
4.2.1. Fuselage Modelling
In this paper, geometric modelling is used to simulate the overall airframe architecture of an aircraft. The Boeing 737–800 model is deployed as the carrier for the cruise phase evaluation, and the degree of antenna isolation is utilized as an index to assess the electromagnetic compatibility of airborne systems and to analyze the effect of antenna layout on its isolation degree. The Boeing 737–800 model parameters and profiles are displayed in Figure 13.
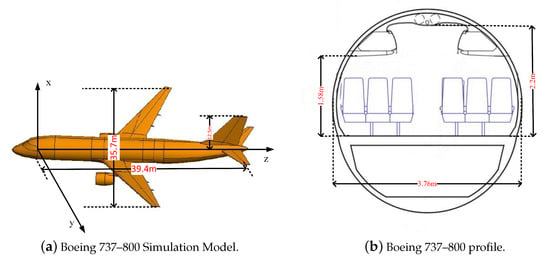
Figure 13.
Parameter information of Boeing 737–800.
In the antenna modelling process, the coordinate origin is centered at the midpoint of the fuselage axis. The positive direction of the Y-axis is set from the origin to the left wing whereas, for the Z-axis, it is along the fuselage axis towards the tail. Finally, the positive direction of the X-axis is determined using the right-hand spiral rule. According to the position requirements of the two antenna installation, the airborne RDSS receiving antenna installation position is determined first.
In order to protect the on-board antenna’s ability to receive satellite signals, the RDSS receiving antenna should be installed on the top of the aircraft fuselage, to avoid turning or tilting during the flight and obscuring the satellite signal path. For the ATG communication system, the antenna polarization method uses vertical polarization, so the installation location can only be in the belly section of the aircraft. In this paper, different parts of the aircraft belly are selected for the antenna installation locations to assess the impact of the installation location on the antenna’s performance.
4.2.2. Airborne Antenna Isolation Calculation
Antenna isolation degree is an important parameter for defining the electromagnetic compatibility of the two airborne systems, and the isolation between antennas is directly related to the reliability of the aircraft communication and navigation equipment [32]. In addition, airborne antenna isolation refers to the degree of interference between antennas when multiple ones share a common platform or equipment. In avionics, better onboard antenna isolation leads to less mutual interference between the different antennas.
Based on the analysis of the two antenna mounting positions in Section 4.2.1, an equivalent model of the aircraft fuselage is established. Idealizing the aircraft fuselage as a smooth cylindrical surface of pure metal, fixing the position of the onboard RDSS receiving antenna, and adjusting the position of the ATG antenna to move on the cylindrical surface are key factors to obtain the relationship between both antenna positions as shown in Figure 14.
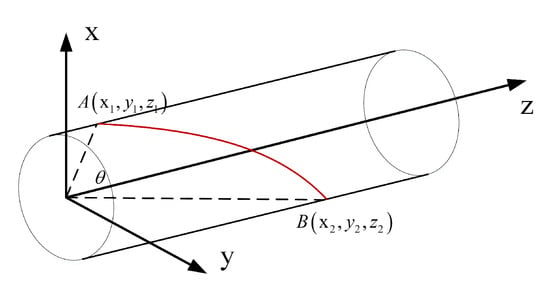
Figure 14.
Equivalent fuselage model and antenna position relationship.
If considering only a pair of transmitting and receiving antennas on an aircraft, the two antennas are in the far-field region of each other and propagate mainly through the radiation of electromagnetic waves. The far-field conditions are: and , where r is the distance between the two antennas, and are the equivalent diameters of the receiving and transmitting antennas, and are the wavelengths of the receiving and transmitting signals, respectively. The isolation between antenna far fields in free space is shown as follows:
where, is the received power of the receiving antenna and is the interference power of the transmitting antenna. When the interference power at the transmitting antenna is and the gain is , then the power density at the receiving antenna increases to
The effective aperture of the receiving antenna is expressed as follows:
When considering the polarization matching factor between the transmitting and receiving antennas, the received power of the receiving antenna can be represented as follows:
where S represents the polarization matching factor. Taking the above formula into the equation for isolation degree gives the following:
Due to the large size of the aircraft, the large amount of metal and electronic equipment loaded inside, the partial blocking of the surrounding radio signals by the aircraft itself, and the attenuation effect of the radio signals bypassing the fuselage, it is necessary to consider the effect of the shielding characteristics of the aircraft on the isolation level. Thus, the introduction of the shielding factor yields the following [33]:
where:
where, represents the radius of the cylinder (measured in m); represents the angle of the two antenna installation position (measured in radians). After considering the shielding coefficient, the isolation degree is expressed as:
The interference power level, received by the RDSS receiver antenna port, can be expressed as follows:
where, is the transmitting equivalent omnidirectional radiated power of the ATG (expressed in dBm); and are, respectively, the receiving bandwidth of the RDSS and the transmitting bandwidth of the ATG (measured in Hz). Loss represents the total propagation loss from the ATG transmitting antenna to the RDSS receiving antenna, mainly including free space propagation loss , transmitter feeder loss , polarisation loss and loss due to aircraft fuselage shielding effect A. The calculation formula is shown as follows:
Neglecting the effect of the ground environment as well as the radiation on the airborne antenna, the propagation environment can be considered as free space propagation; therefore, it is usually expressed as follows:
where, f is the signal frequency (measured in MHz); d is the propagation path distance (measured in km).
4.3. Simulation Results and Analysis
In this paper, the aircraft fuselage is idealized as a pure metal smooth cylindrical surface. In practice, such factors will also increase the actual isolation of both antennas due to variations in the shape of the fuselage surface, such as the recessed seams and the convex pegs. Figure 15 represents the simulation of fuselage shielding losses for antenna positions located in different areas of the belly with clamping angles ranging between 10° and 80°, whereas the loss values vary between 10 and 25 dB.
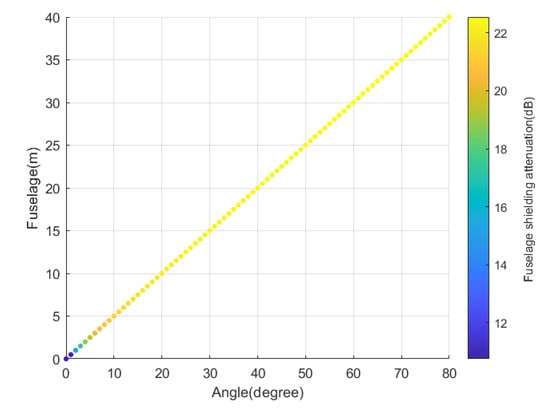
Figure 15.
Shielding attenuation values at different locations on the belly of the aircraft.
According to the parameter information of Boeing 737–800, the fixed airborne RDSS receiver is located at position coordinates A (3,0,3). By adjusting the ATG antenna to move in the belly part of the aircraft, the relationship between the free space path loss and the antenna isolation concerning the position change between antennas can be derived when the distance between the receiving and transmitting antennas is greater than three meters as shown in Figure 16.
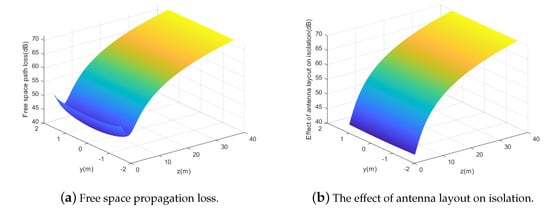
Figure 16.
Simulation of free space loss and antenna isolation with antenna position.
There exist limitations of the aircraft platform size and the relative concentration of the avionics equipment in the forward belly of the aircraft in the electronics bay. Therefore, the installation distance between the two antennas is largely limited. When the distance between the Beidou RDSS receiving antenna and the ATG antenna is greater than 3 m, the free space propagation loss ranges between 44.57 dB and 71.68 dB. Moreover, the antenna isolation values range between 40.03 and 69.61 dB. Different antenna layouts directly affect the isolation degree between these antennas, where the free space path loss and the airframe shielding loss represent the main impact term.
According to BD420007-2015, the maximum acceptable interference power level for RDSS is −127 dBm, where the polarization loss is set at 20 dB, and the feeder loss is equal to 3 dB. From a theoretical point of view, the transmitter power can be very large, refer to Gogo company transmitter, the transmitting power is 49 dBm. Considering the ATG transmitting EIRP of 40 dBm, 49 dBm, and 52 dBm, respectively, simulating the additional isolation required for the two systems antenna compatibility case leads to the results shown in Figure 17, Figure 18 and Figure 19.
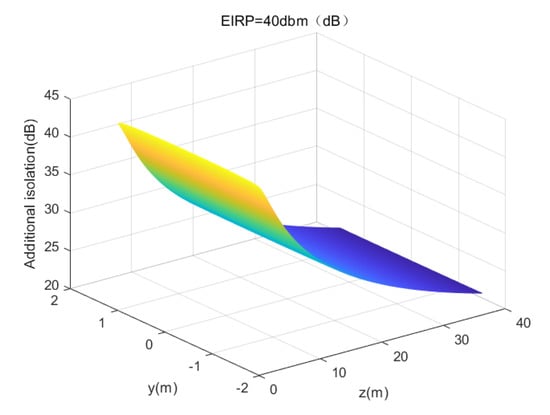
Figure 17.
Additional isolation required for EIRP = 40 dBm, = 3 dB, = 20 dB.
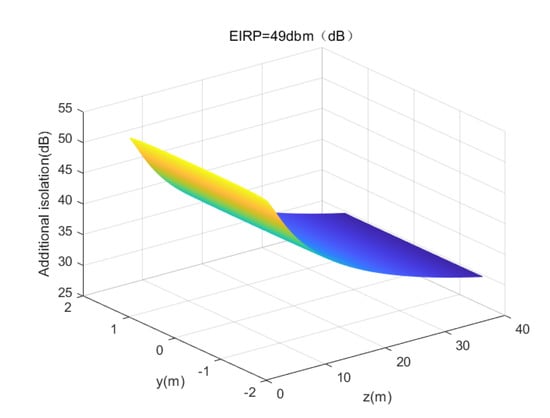
Figure 18.
Additional isolation required for EIRP = 49 dBm, = 3 dB, = 20 dB.
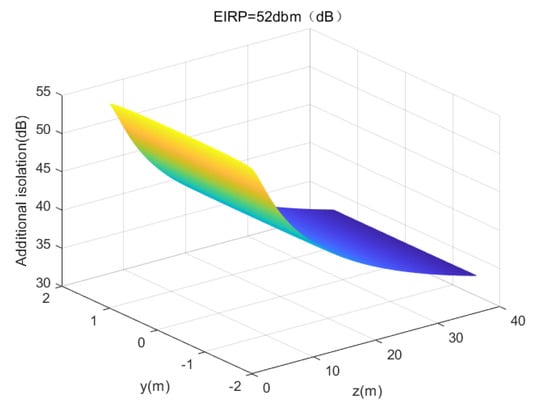
Figure 19.
Additional isolation required for EIRP = 52 dBm, = 3 dB, = 20 dB.
From the above simulation diagram, the additional isolation required is related to the installation position of the two antennas and the transmitting power when the compatibility is satisfied. The additional isolation required decreases as the installation position of both antennas becomes larger, where the additional isolations required are less than 42.39 dB, 51.31 dB, and 54.31 dB, respectively.
5. Conclusions
In this paper, we scientifically assess the impact of a full-flight 5G system on the Beidou RDSS system from the perspective of civil aviation safety. The key conclusions are as follows:
By combining the read real trajectory files with the simulation model, the aggregate interference of different routes is obtained. The results show that the aggregate interference value in the RMa NLOS scenario is slightly lower than the free space propagation. Moreover, according to the ICAO regulations for runway lengths of class A-F airports, the required distance separation can be offset by the runway and taxiway lengths. Considering the actual airport runway construction environment, the practical interference impact of the two systems can be neglected.
When the aircraft enters the cruise phase, the influence of the ground 5G base station to the RDSS receiver is no longer considered, and the electromagnetic compatibility between the onboard 5G ATG system and the RDSS receiving antenna is used to evaluate the object in this phase. The Boeing 737–800 model is chosen as the carrier and the simulation results show that the 5G ATG antenna can cause harmful interference to the RDSS antenna if no additional isolation measures are considered. The EIRP of the transmitting antenna should be reasonably controlled where the larger the EIRP, the higher the antenna additional isolation required. Optimising the layout of the two antennas can effectively improve the antenna’s isolation between the two systems.
Finally, the ATG system airborne antennas should be installed on the belly of the aircraft in the tail area as far as possible to maintain a large antenna isolation and avoid electromagnetic interference with the RDSS receiving antennas of adjacent frequencies. However, in practical application, the installation type, installation method and antenna type should also be considered to avoid interference with other avionics and reduce safety threats to civil aviation operation.
Author Contributions
Conceptualization, W.C. and S.S.; data curation, R.L. and Y.T.; formal analysis, S.S.; funding acquisition, R.L.; investigation, W.C. and Y.T.; methodology, W.C.; software Y.T.; writing—original draft, R.L. and Y.T.; writing—review and editing, W.C., Y.T., S.S. and R.L. All authors have read and agreed to the published version of the manuscript.
Funding
This work was supported in part by the National Natural Science Foundation of China Civil Aviation Joint Fund Key Project under Grant U2233215, and in part by the Open Fund of Key Laboratory of Civil Aircraft Airworthiness Technology under Grant SH2022070502.
Data Availability Statement
Not applicable.
Conflicts of Interest
The authors declare no conflict of interest.
References
- Sun, F.; Liu, S.; Zhu, X.; Men, B. Research and progress of Beidou satellite navigation system. Sci. China Inf. Sci. 2012, 55, 2899–2907. [Google Scholar] [CrossRef]
- Sun, Y.; Xue, R.; Zhao, D.; Wang, D. Radio frequency compatibility evaluation of S band navigation signals for future BeiDou. Sensors 2017, 17, 1039. [Google Scholar] [CrossRef] [PubMed]
- Ren, H.; Tang, C.; Guo, R.; Zhang, T.; Xing, N.; Hu, X.; Li, X. Precision analysis of BDS-3 GEO satellite orbit determination using RDSS. Sci. Sin. Phys. Mech. Astron. 2021, 51, 019510. [Google Scholar]
- 3GPP TS 38.104; 3rd Generation Partnership Project; Technical Specification Group Radio Access Network NR Base Station (BS) radio transmission and reception (Release 16). 3GPP: Sophia Antipolis, France, 2020.
- Jessner, A. Industrial interference and radio astronomy. Adv. Radio Sci. 2013, 11, 251–258. [Google Scholar] [CrossRef]
- Tong, W.; Zou, D.; Han, T.; Zhang, X.; Shen, P.; Lu, X.; Wang, P.; Yin, T. A New Type of 5G-Oriented Integrated BDS/SON High-Precision Positioning. Remote Sens. 2021, 13, 4261. [Google Scholar] [CrossRef]
- RTCA. Assessment of the Lightsquared Ancillary Terrestrial Component Radio Frequency Interference Impact on GNSS L1 Band Airborne Receiver Operations; RTCA: Washington, DC, USA, 2011. [Google Scholar]
- O’Driscoll, C.; Rao, M.; Borio, D.; Cano, E.; Fortuny, J.; Bastide, F.; Hayes, D. Compatibility analysis between LightSquared signals and L1/E1 GNSS reception. In Proceedings of the 2012 IEEE/ION Position, Location and Navigation Symposium, Myrtle Beach, NC, USA, 23–26 April 2012; pp. 447–454. [Google Scholar]
- Godet, J. GPS/GALILEO radio frequency compatibility analysis. In Proceedings of the 13th International Technical Meeting of the Satellite Division of The Institute of Navigation (ION GPS 2000), Salt Lake City, UT, USA, 22–25 September 2000; pp. 1782–1790. [Google Scholar]
- Rao, M.; O’Driscoll, C.; Borio, D. Light Squared effects on estimated C/N0 pseudoranges and positions. GPS Solut. 2014, 18, 1–13. [Google Scholar]
- Zhang, X. Research on the performance testing of Beidou RDSS navigational surveillance service. J. Civ. Aviat. Univ. China 2017, 35, 1–5. [Google Scholar]
- Wang, F. Analysis of 4G interference to BeiDou RDSS system and countermeasure strategies. Glob. Position. Syst. 2019, 44, 76–81. [Google Scholar] [CrossRef]
- Han, X. A tractable approach to coexistence analysis between COMPASS and TD-LTE system. In Proceedings of the 2014 21st International Conference on Telecommunications (ICT), Lisbon, Portugal, 4–7 May 2014; pp. 77–81. [Google Scholar] [CrossRef]
- An, N.; Wang, C.; Wang, W. Interference Coexistence of 5G NR and LTE System Based on 2.1GHz. In Proceedings of the 2020 12th International Conference on Communication Software and Networks (ICCSN), Chongqing, China, 12–15 June 2020; pp. 90–94. [Google Scholar] [CrossRef]
- Zhang, T.; Ge, X.; Liu, Z.; Zhang, W. Analysis and countermeasures of Beidou S signal affected by ground 5G interference. Radio Eng. 2021, 51, 1037–1041. [Google Scholar]
- Wang, Q.; Cheng, F.; Zhang, T. 5G Impacts analysis on the Beidou RDSS system in 2.5 GHz band. GPS Solut. 2023, 27, 24. [Google Scholar] [CrossRef]
- Wang, D.; Guo, R.; Xing, N. Performance analysis of two RDSS positioning modes of BeiDou-3 system. Astrodynamics 2022, 6, 317–327. [Google Scholar] [CrossRef]
- Jing, P.; Zhang, Y.; Zhan, J.; Ou, G. Research on key techniques of the Beidou RDSS receiver test system. J. Astronaut. Metrol. Meas. 2016, 36, 95. [Google Scholar]
- Won, J.H.; Eissfeller, B.; Schmitz-Peiffer, A.; Floch, J.J.; Zanier, F.; Colzi, E. Trade-off between data rate and signal power split in GNSS signal design. IEEE Trans. Aerosp. Electron. Syst. 2012, 48, 2260–2281. [Google Scholar] [CrossRef]
- Kaplan, E.D.; Hegarty, C. Understanding GPS: Principles and Applications, 2nd ed.; Artech House: Norwood, MA, USA, 2006. [Google Scholar]
- 3GPP TR 37.842; Radio Frequency (RF) Requirement Back-Ground for Active Antenna System (AAS) Base Station (BS).V13.2.0. 3GPP: Sophia Antipolis, France, 2017.
- Gkonis, P.K.; Trakadas, P.T.; Kaklamani, D.I. A comprehensive study on simulation techniques for 5G networks: State of the art results, analysis, and future challenges. Electronics 2020, 9, 468. [Google Scholar]
- Dangi, R.; Lalwani, P.; Choudhary, G.; You, I.; Pau, G. Study and investigation on 5G technology: A systematic review. Sensors 2021, 22, 26. [Google Scholar] [PubMed]
- ITU-R M.2101; Modelling and Simulation of IMT Networks for Use in SHARING and compatibility Studies. ITU-R: Geneva, Switzerland, 2017.
- Andrews, J.G.; Baccelli, F.; Ganti, R.K. A tractable approach to coverage and rate in cellular networks. IEEE Trans. Commun. 2011, 59, 3122–3134. [Google Scholar]
- ITU-R. Report M.2412; Guidelines for Evaluation of Radio Interface Technologies for IMT-2020. ITU-R: Geneva, Switzerland, 2017.
- 3GPP TR 36.942; Radio Frequency (RF) System Scenarios. V15.0.0. 3GPP: Sophia Antipolis, France, 2018.
- BD420007; Performance Requirements and Test Methods for RDSS Units of Beidou User Terminals. NSTDA: Beijing, China, 2015.
- Lei, L.; Hou, J. Analysis of interference of 5G system to ATG system in 3.5 GHz. J. Radio Wave Sci. 2021, 36, 477–482. [Google Scholar]
- Liu, L.; Wang, B.; Kadoch, M. Analysis of Interference from ATG Uplink to Terrestrial 5G Base Stations in 2.1 GHz Band. In Proceedings of the 2022 International Conference on Information Processing and Network Provisioning (ICIPNP), Beijing, China, 20–21 October 2022; pp. 43–46. [Google Scholar] [CrossRef]
- Zhang, S.W.; Hou, J.J.; Wang, J. Research on the form and capacity of 5G-based ATG networking. Mob. Communition 2020, 44, 1–6. [Google Scholar]
- Li, H.; Bolsover, M.; Ye, J.; Yan, L. The Role of Electromagnetic Compatibility Qualification Considerations in Airborne System Integration Programs. In Proceedings of the 2014 Asia-Pacific International Symposium on Aerospace Technology, APISAT2014, Shanghai, China, 24–26 September 2014; Volume 99, pp. 208–213. [Google Scholar] [CrossRef]
- Liu, R.H.; Wang, X. Analysis of compatibility between Beidou radio determination satellite service airborne equipment and iridium airborne earth station. Sci. Technol. Eng. 2021, 21, 4103–4109. [Google Scholar]
Disclaimer/Publisher’s Note: The statements, opinions and data contained in all publications are solely those of the individual author(s) and contributor(s) and not of MDPI and/or the editor(s). MDPI and/or the editor(s) disclaim responsibility for any injury to people or property resulting from any ideas, methods, instructions or products referred to in the content. |
© 2023 by the authors. Licensee MDPI, Basel, Switzerland. This article is an open access article distributed under the terms and conditions of the Creative Commons Attribution (CC BY) license (https://creativecommons.org/licenses/by/4.0/).