Article

Potential of Low-Cost Light Detection and Ranging (LiDAR) Sensors: Case Studies for Enhancing Visitor Experience at a Science Museum

Department of Mechanical Engineering, Ibaraki University, Hitachi 316-8511, Ibaraki, Japan
*
Author to whom correspondence should be addressed.
Electronics 2023, 12(15), 3351; https://doi.org/10.3390/electronics12153351
Submission received: 30 June 2023 / Revised: 27 July 2023 / Accepted: 31 July 2023 / Published: 5 August 2023
(This article belongs to the Special Issue XRiM: XR Technologies in Future Museums)

Abstract

:
A low-cost light detection and ranging (LiDAR) device has several advantages including being able to perform a wide range of angle measurements, less privacy concerns, and robustness to illumination variance owing to its use of infrared (IR) light. In this study, to enhance the visitor experience at a science museum, three case studies using low-cost LiDAR sensors are presented: (1) an interactive floor projection to learn about the phases of the Moon; (2) an information kiosk with touchless interaction and visitor tracking; and (3) a visitor tracking box with horizontal and vertical scanning. The proposed kiosk system uses a mirror to reflect a portion of the scanning plane of the LiDAR sensor, to allow the capture of touchless interactions, track visitor positions, and count the number of nearby visitors. The visitor tracking box also uses two detection planes reflected by a mirror: the vertical plane is for counting visitors crossing the scanning plane and the horizontal plane is for tracking visitor positions to generate the corresponding heat maps for the visualization of museum hotspots. A series of evaluation experiments were conducted at a science museum, whereby an accuracy of 85% was obtained to estimate the number of visitors, with an accuracy increasing in counting people taller than 140 cm. The interactive floor received a visitor rating of 4.3–4.4 on a scale of 1–5.

1. Introduction

Static displays and fixed exhibits at museums provide exactly the same experience to everyone and lack interactivity, making the museum less engaging for visitors. In this study, focusing on the broad potential of two-dimensional light detection and ranging (LiDAR) sensors, which have experienced a significant drop in price in recent years, we propose multiple applications for low-cost LiDAR devices, as shown in Figure 1, including an interactive floor, touchless information kiosk, and a visitor tracking box.
The contributions of this paper include the following:
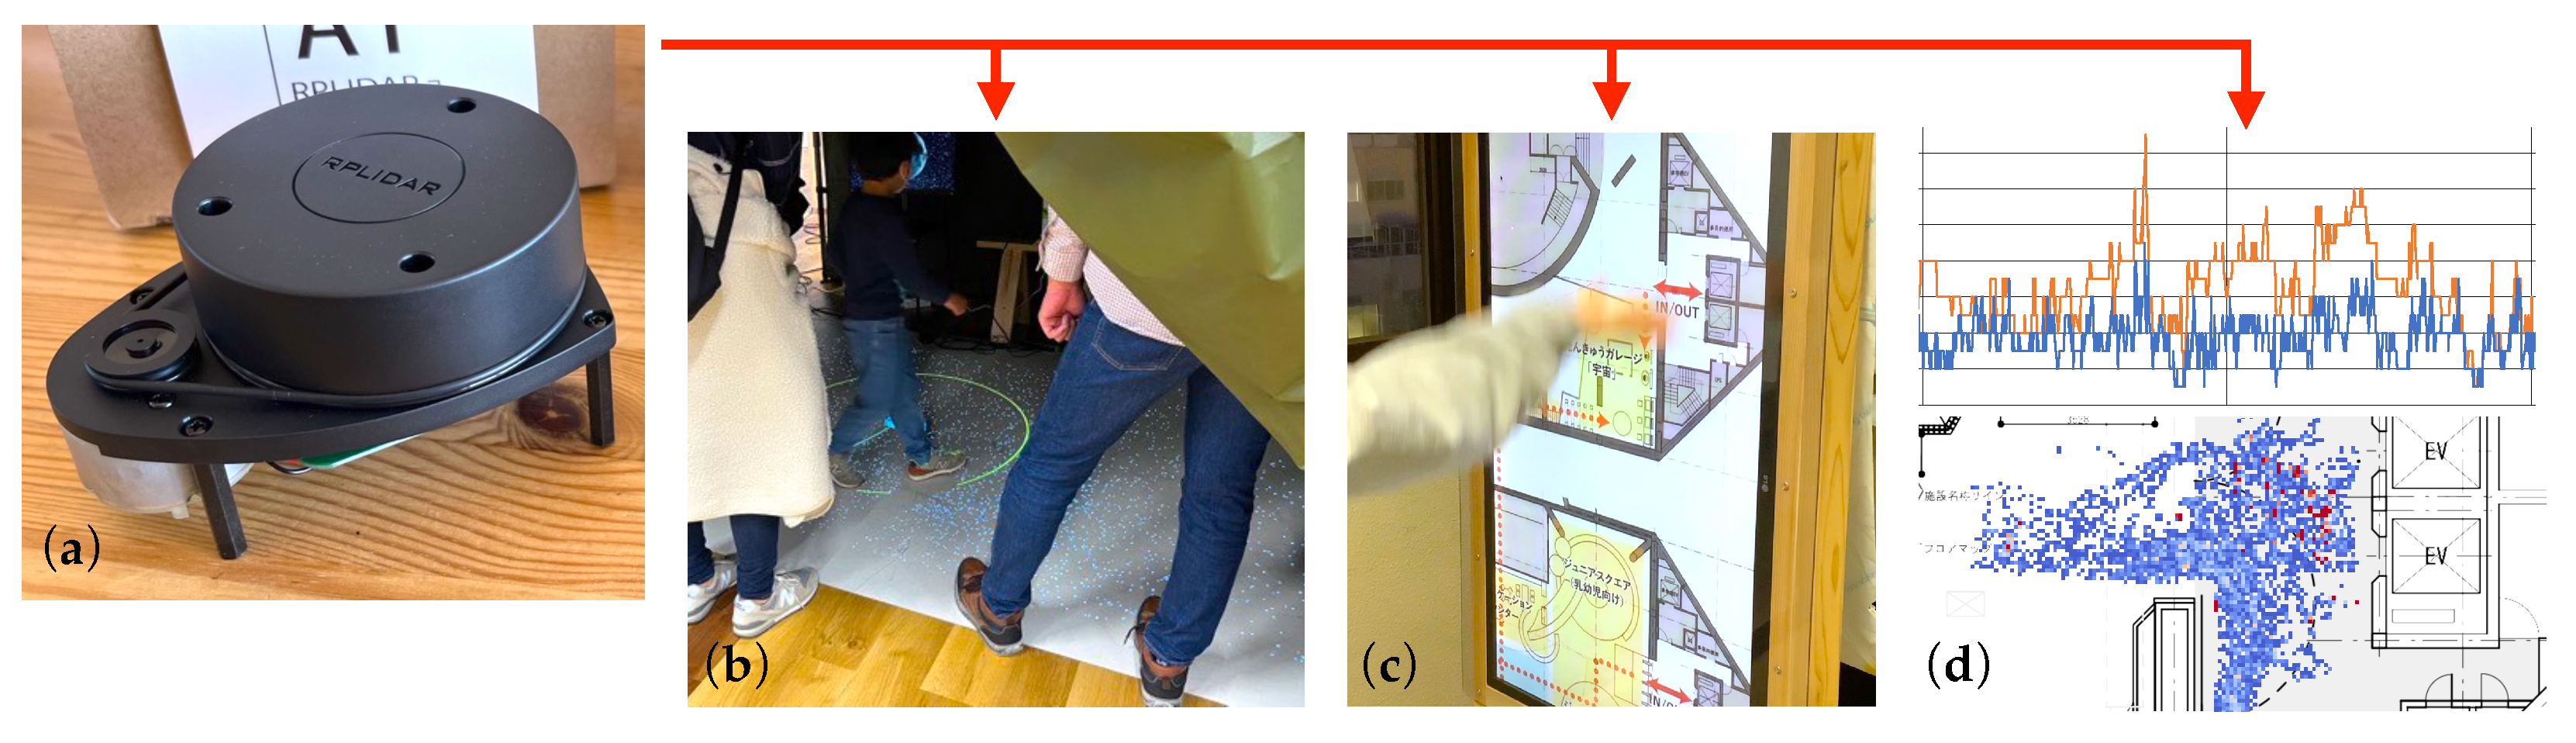
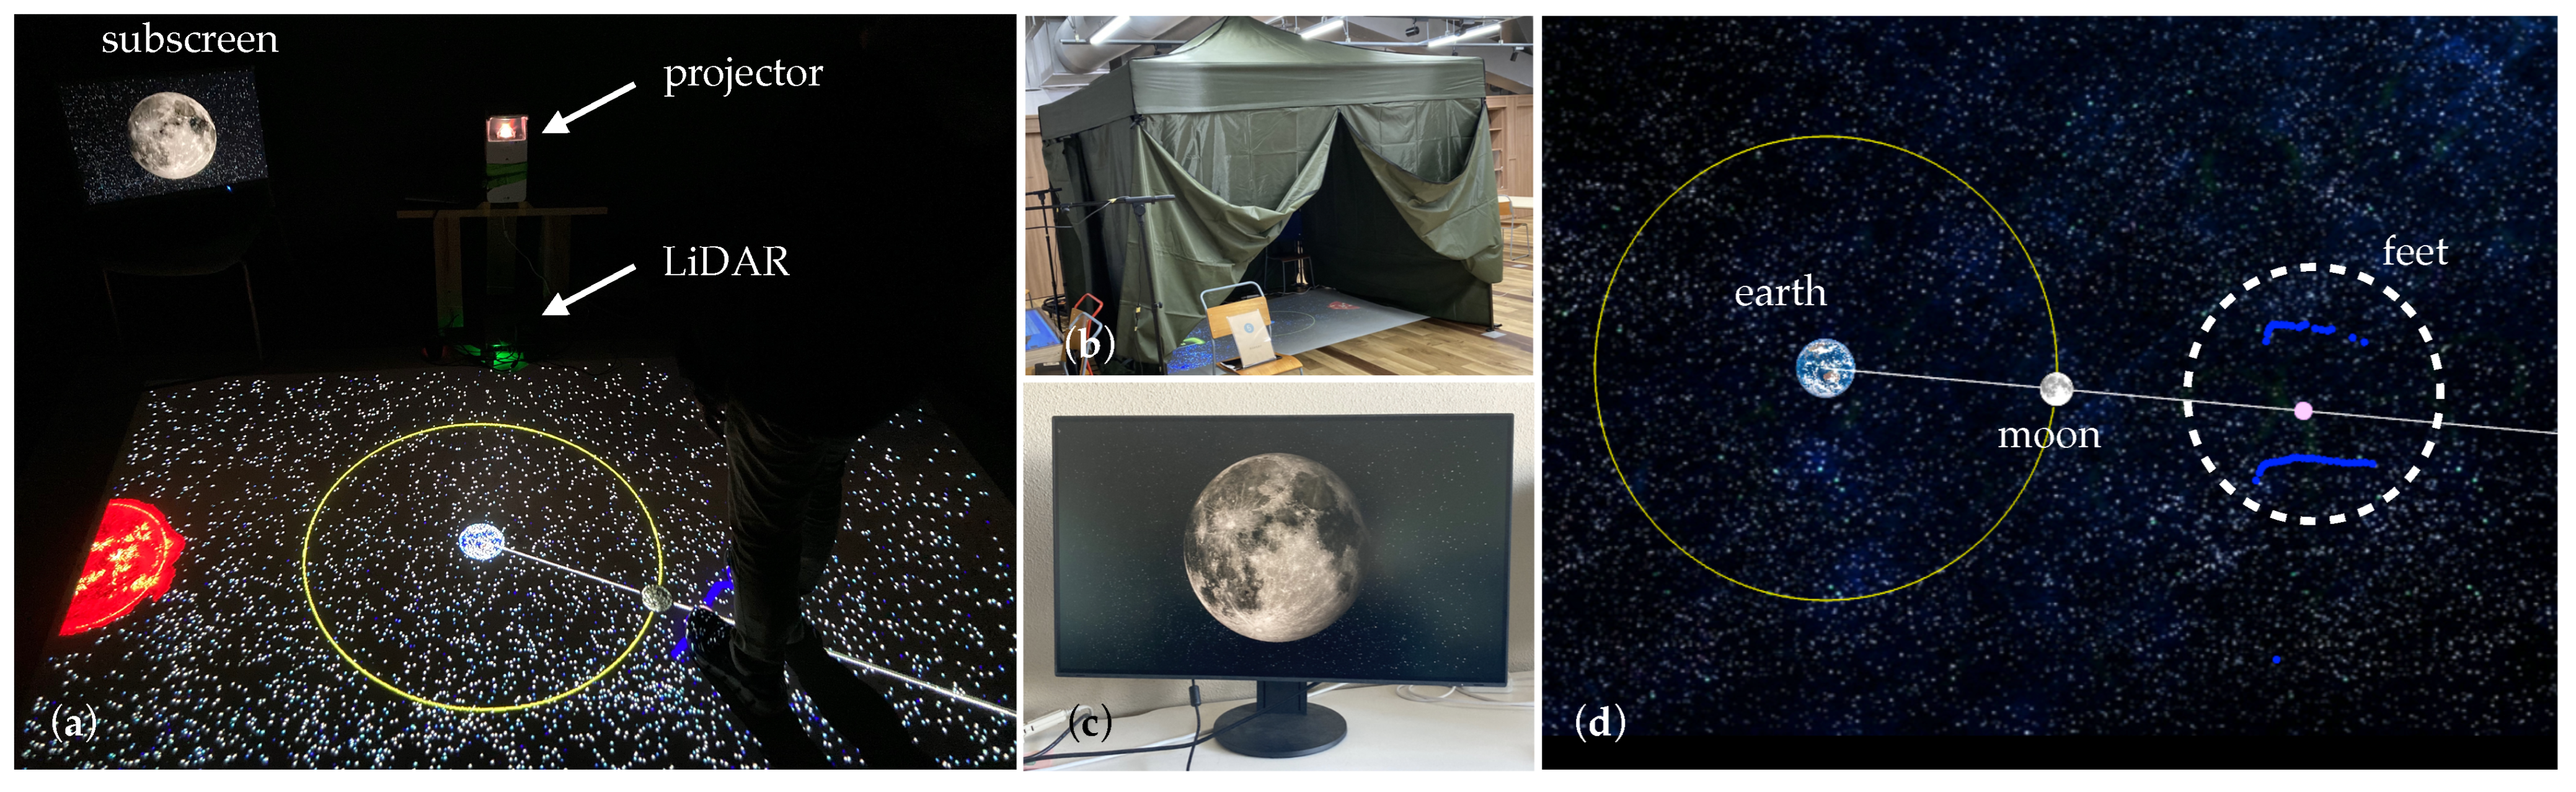
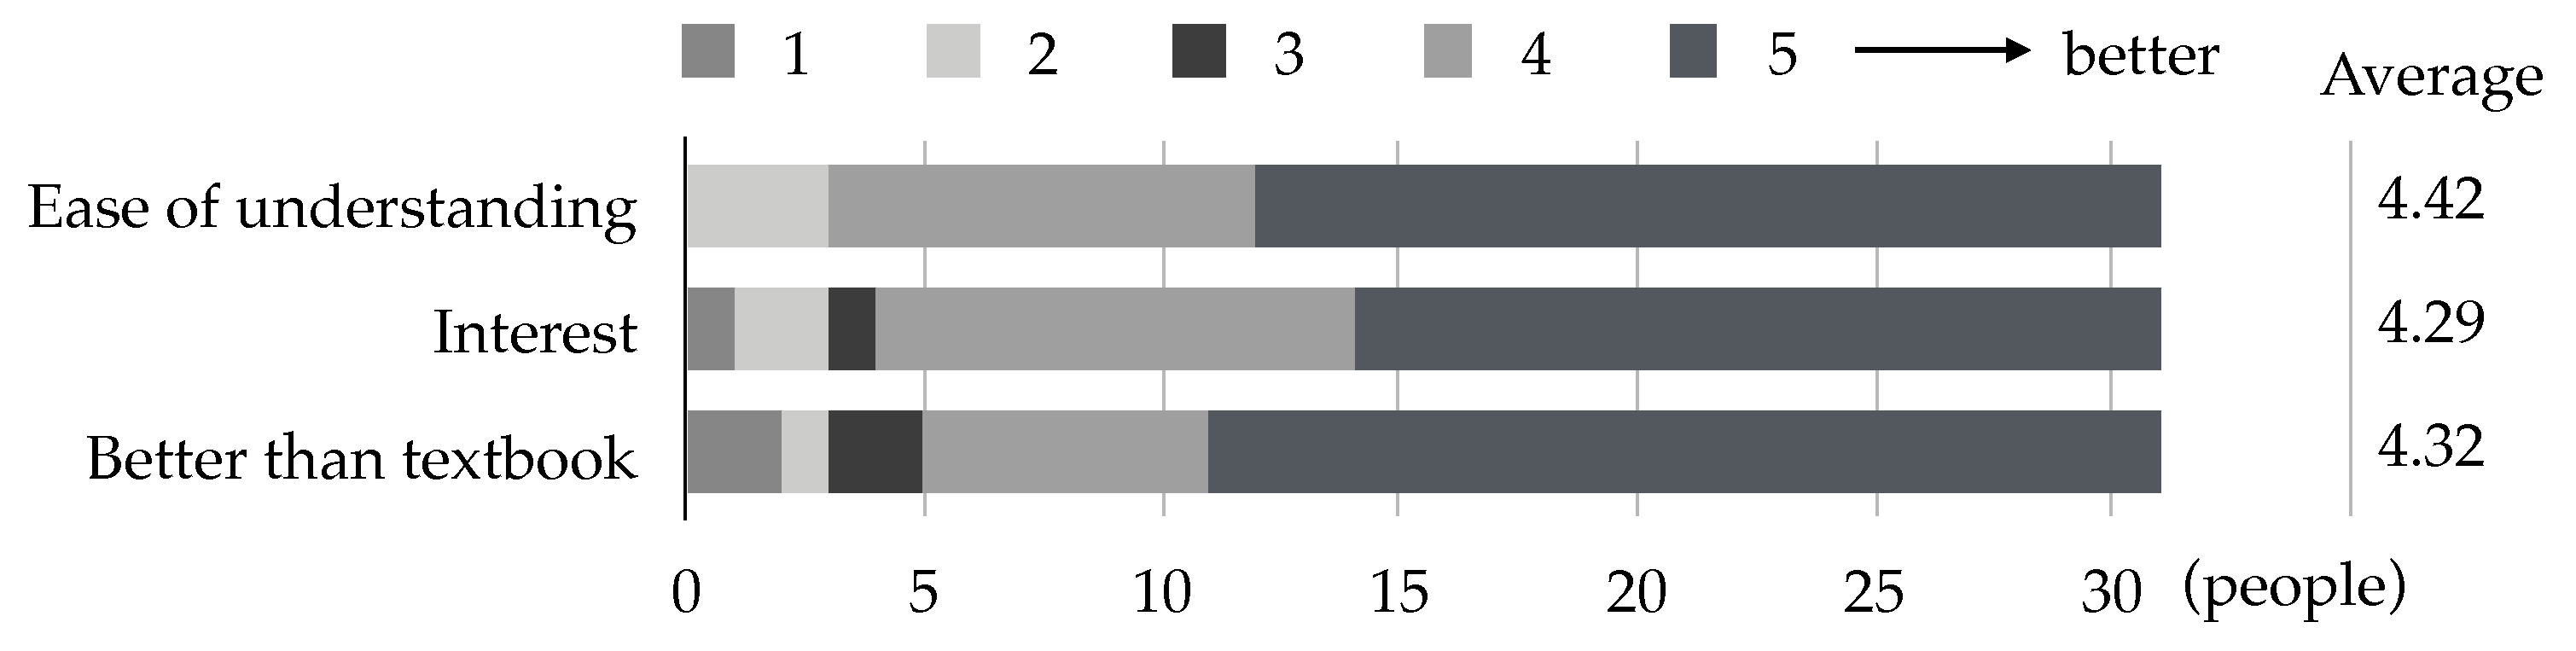
  • A floor projection was implemented to interact with users through a single low-cost LiDAR sensor (Section 4). The application which was designed to learn about the phases of the Moon received a high evaluation of 4.2 on a scale of 1–5 from 32 users (Section 4.2).
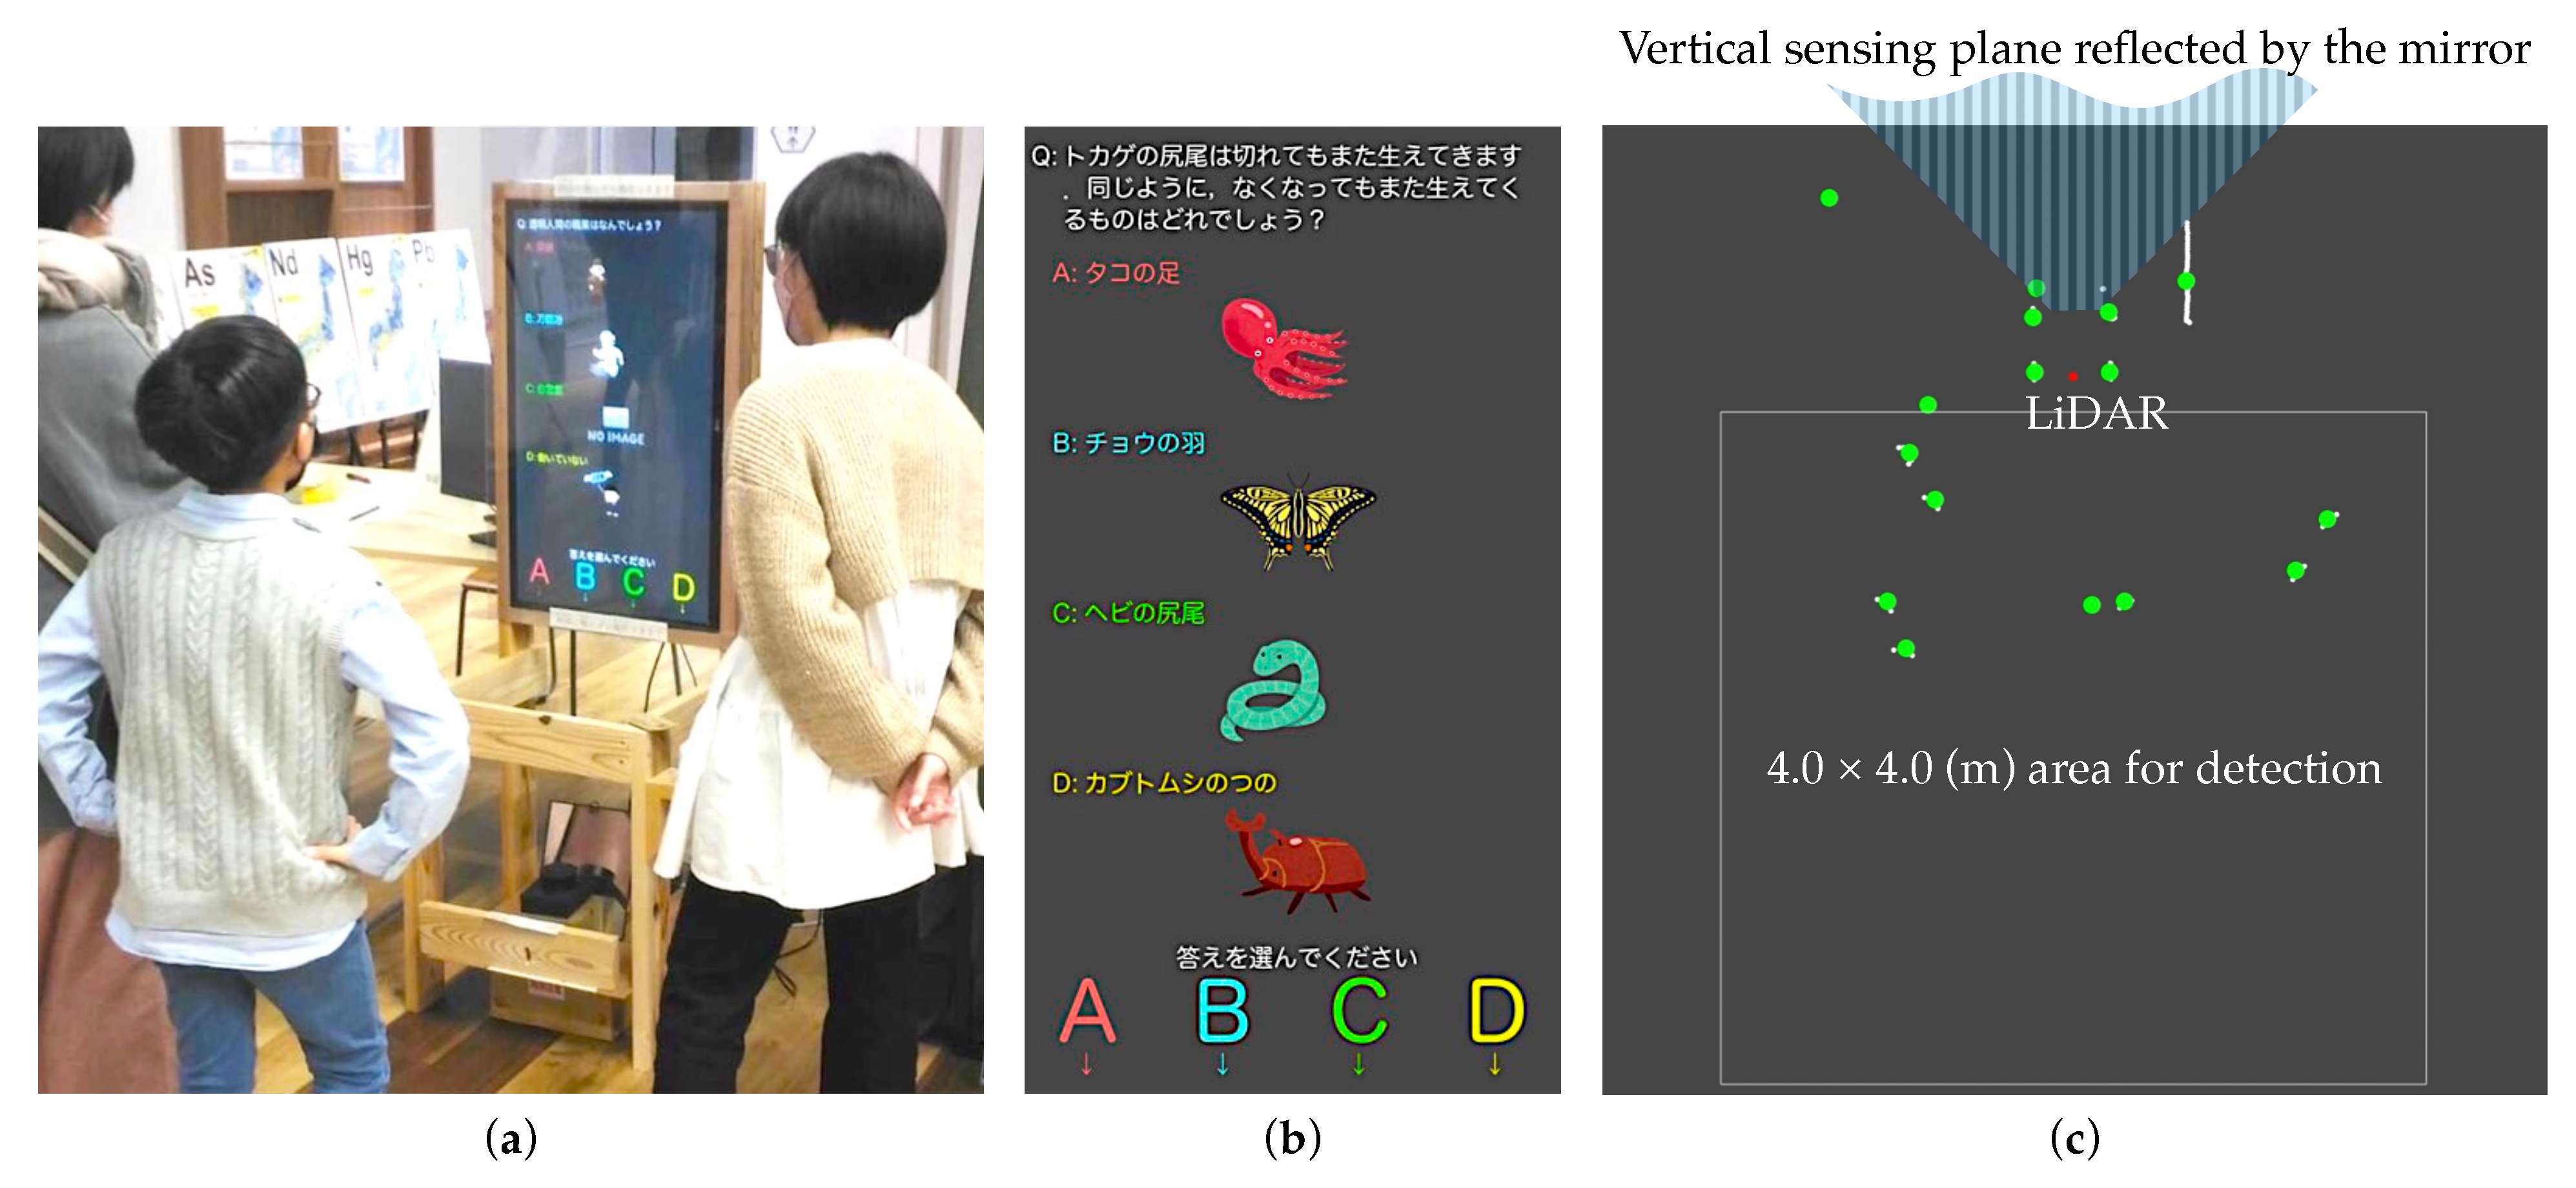
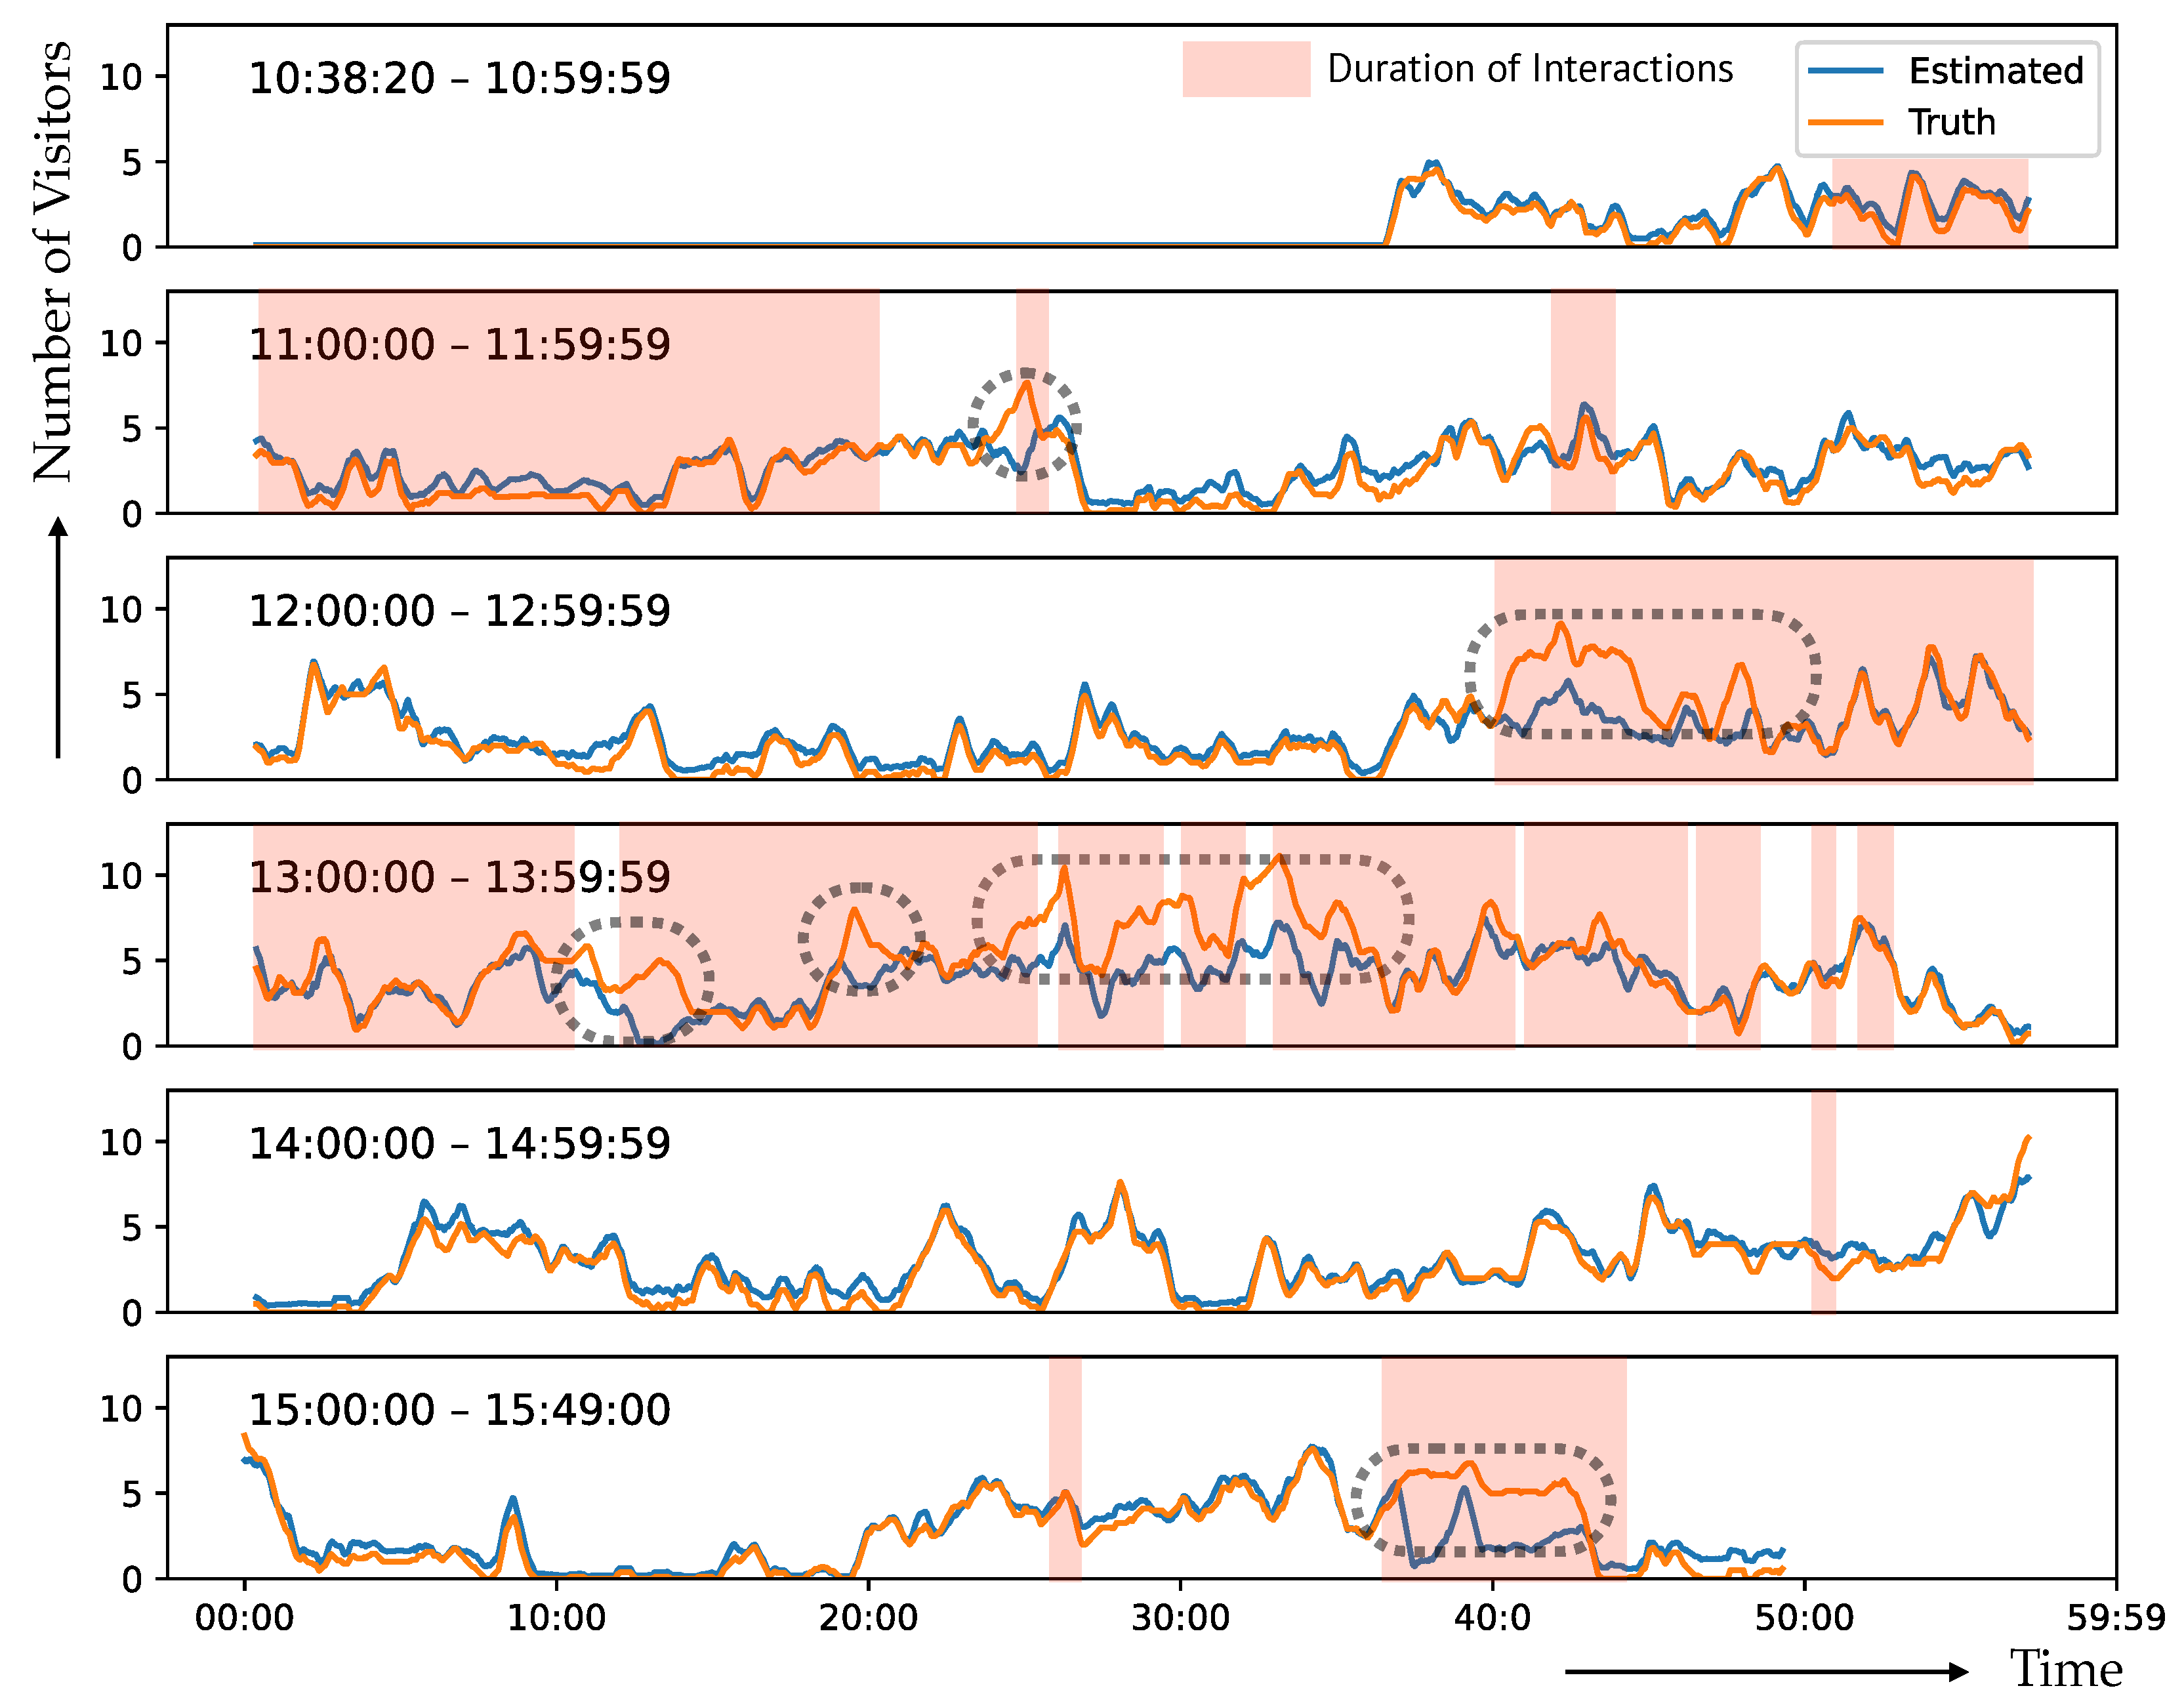
  • An information kiosk was also proposed with touchless operations and visitor tracking. As detailed in Section 5, both functions were implemented using a single LiDAR device with a mirror reflecting a portion of the detection plane of the 2D LiDAR. The kiosk provided a high accuracy rate in counting visitors when being idle without any interaction with visitors (Section 5.2).
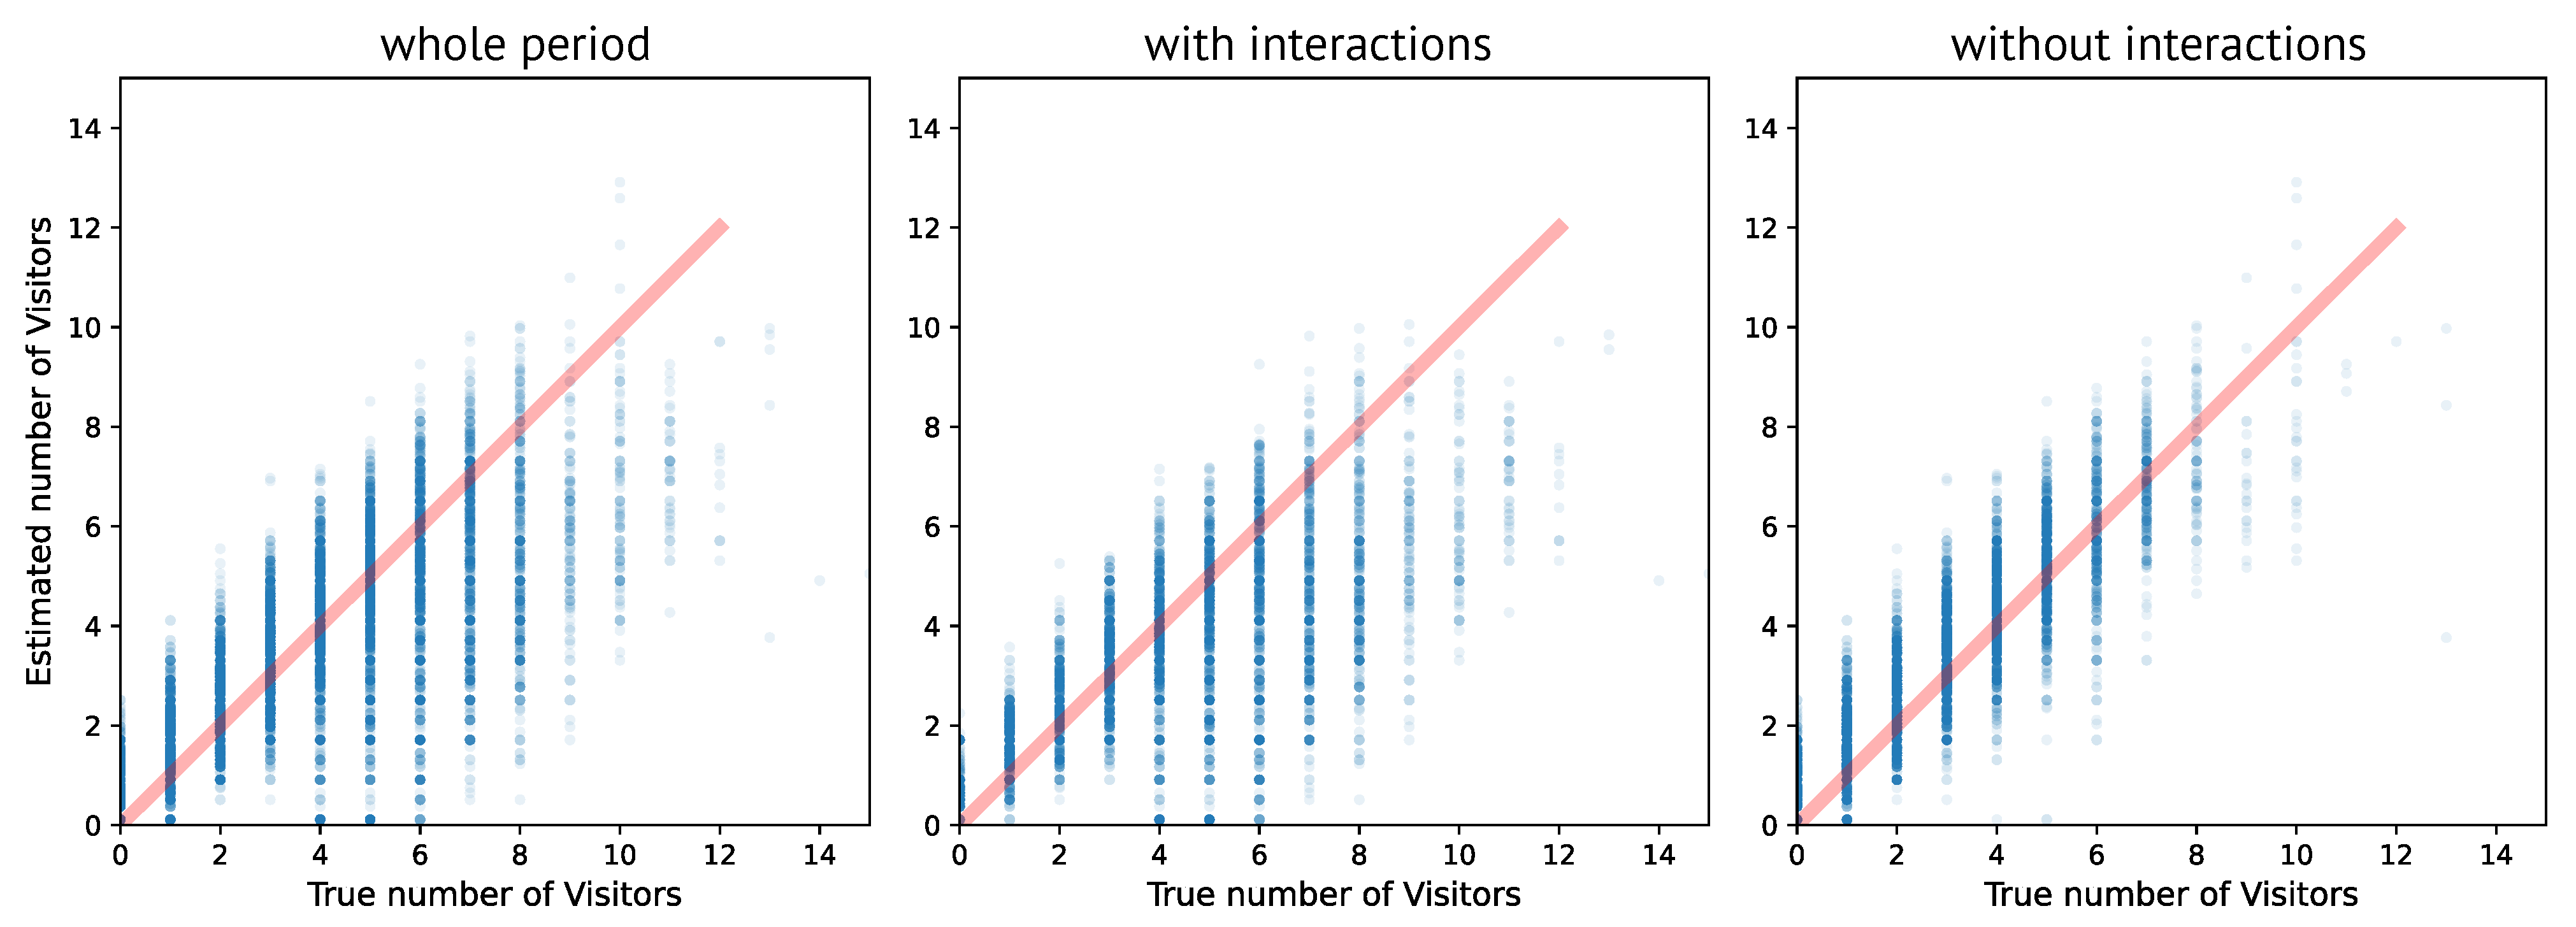
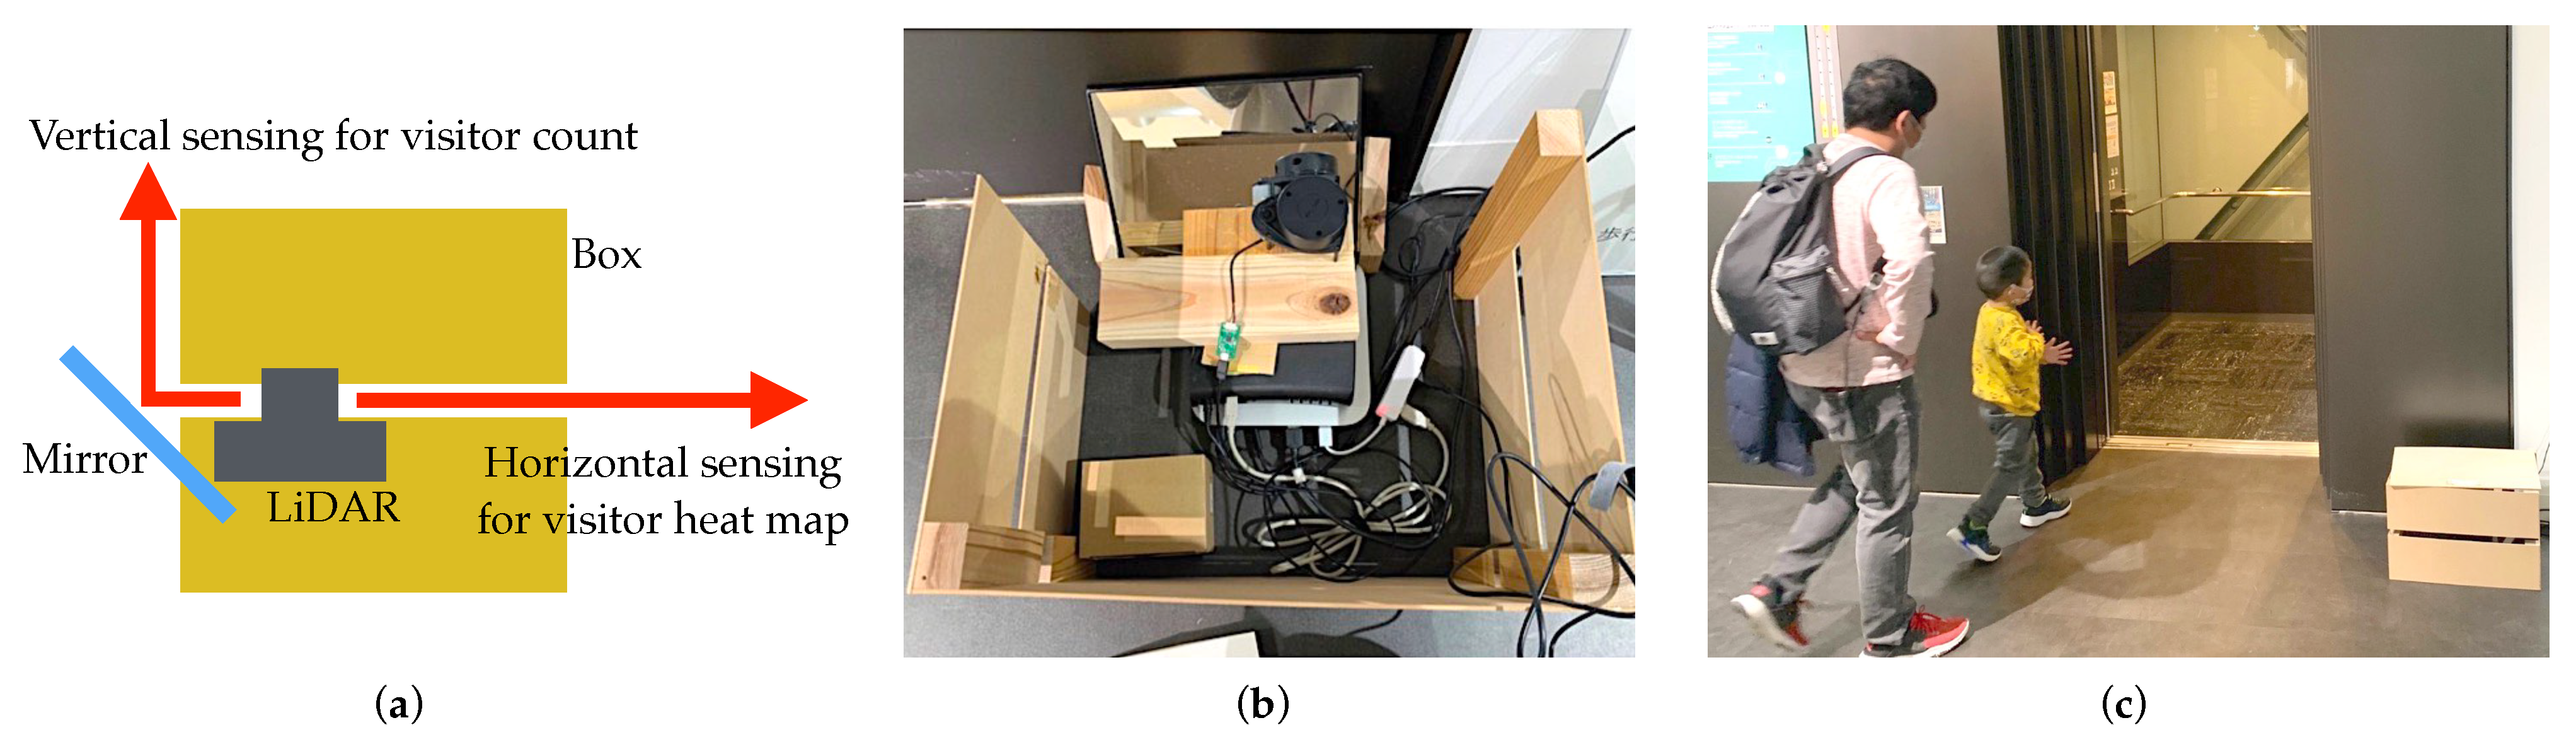
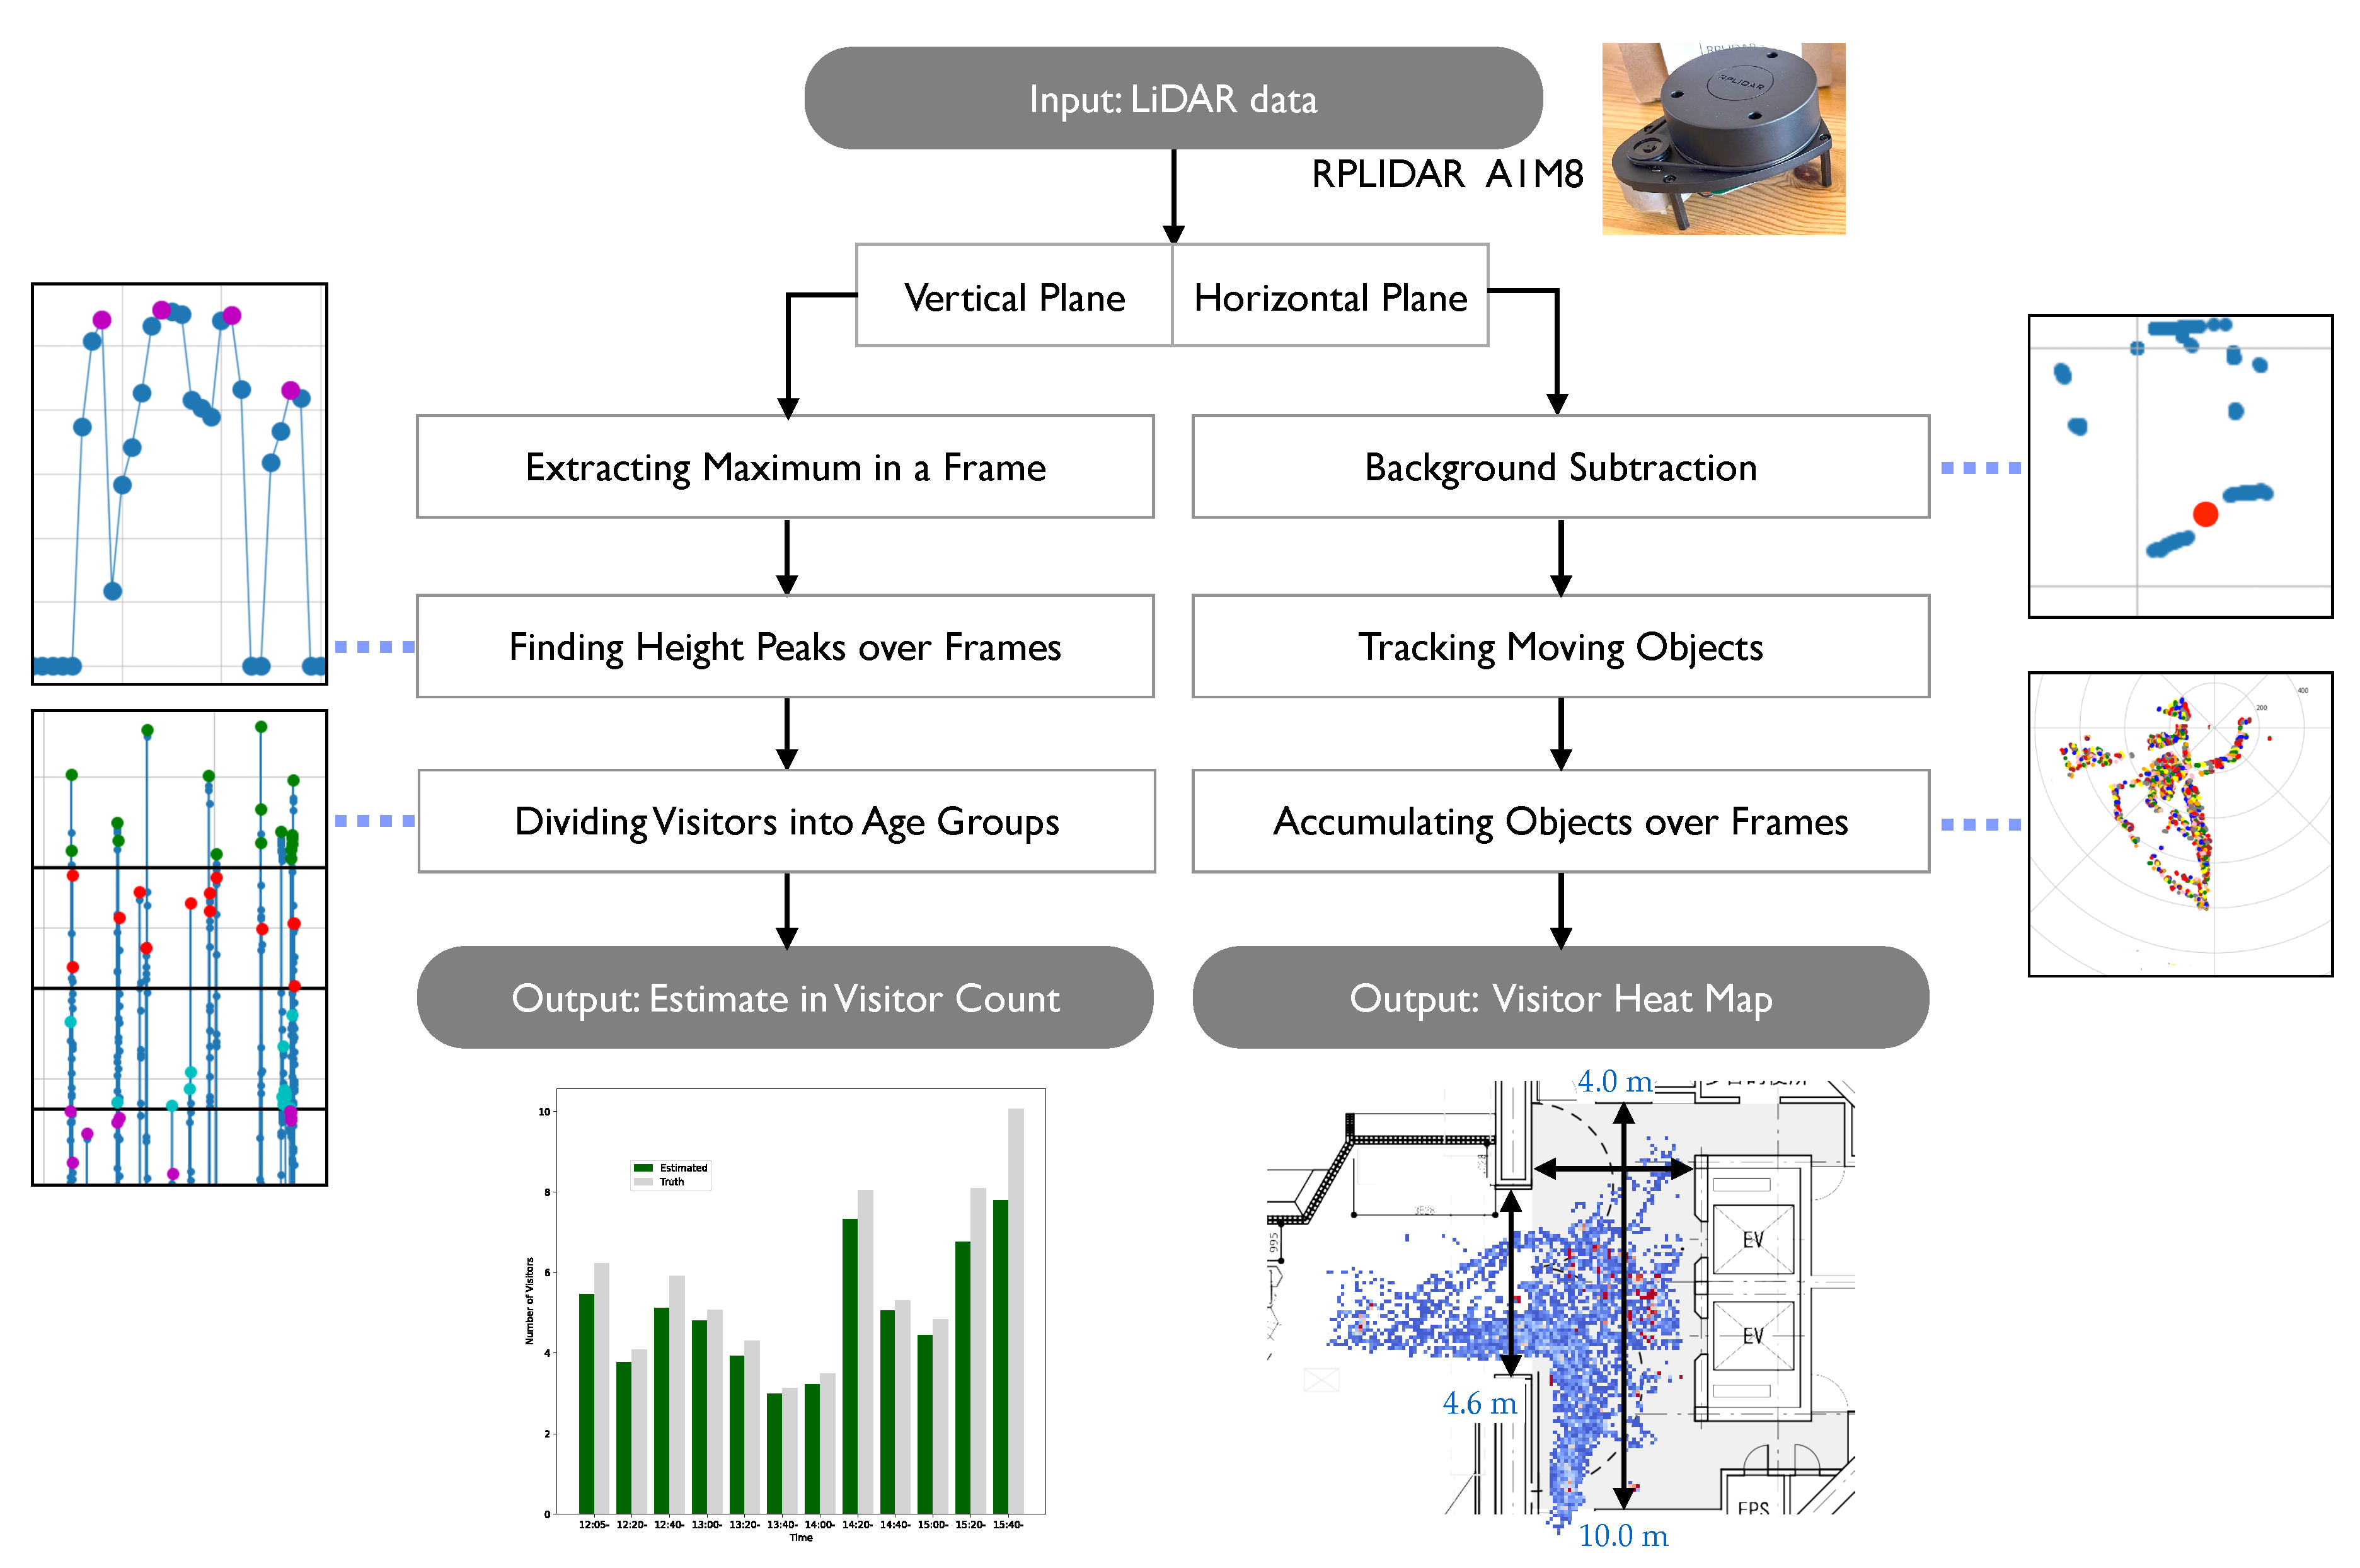
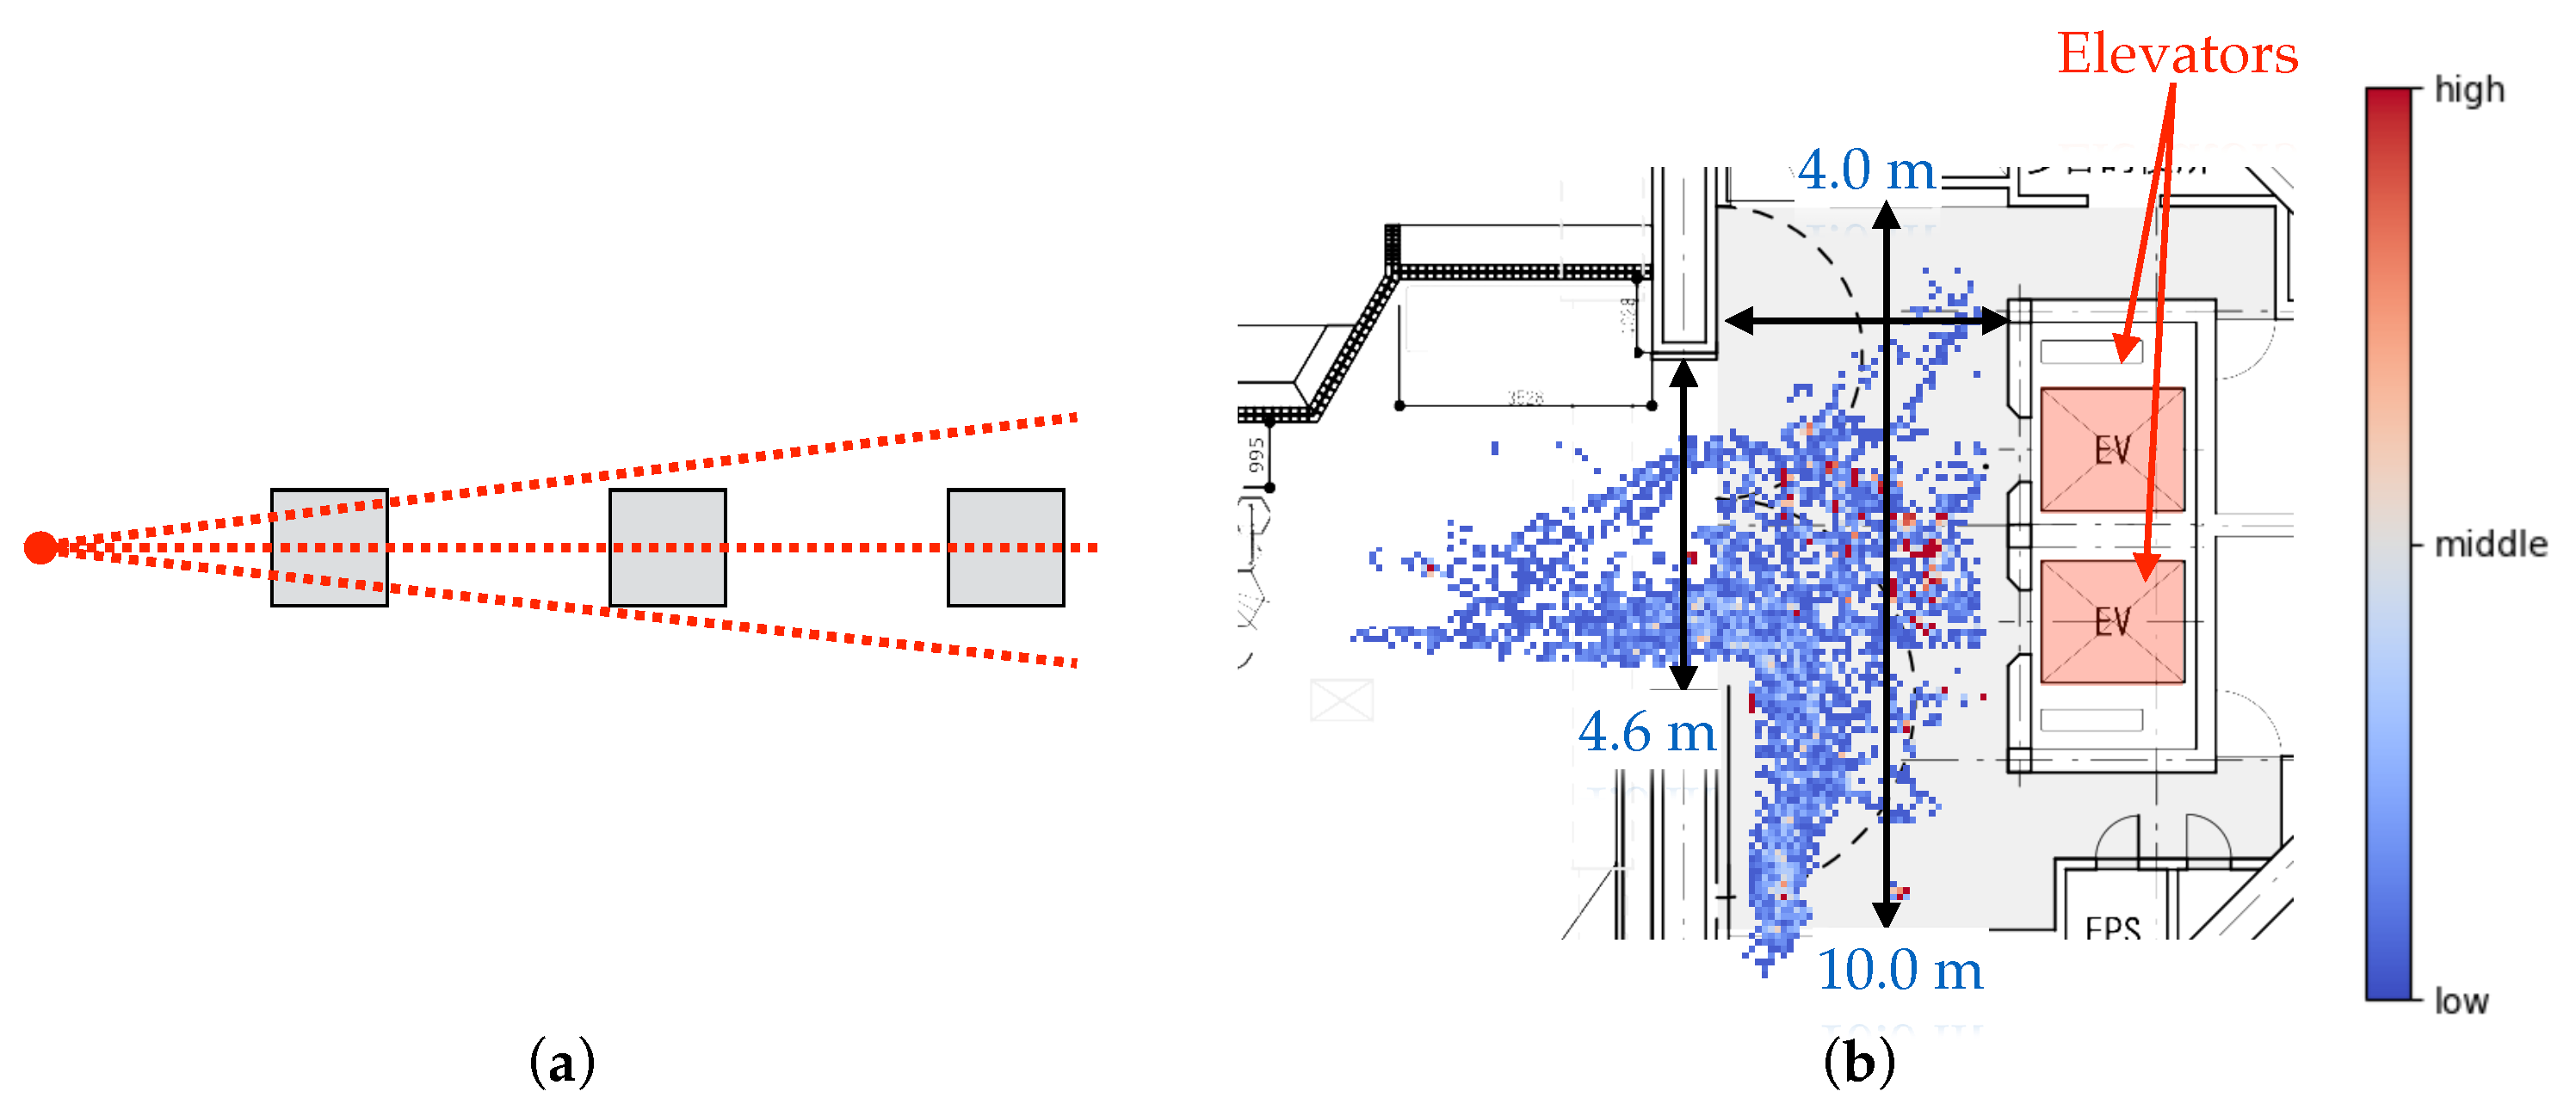
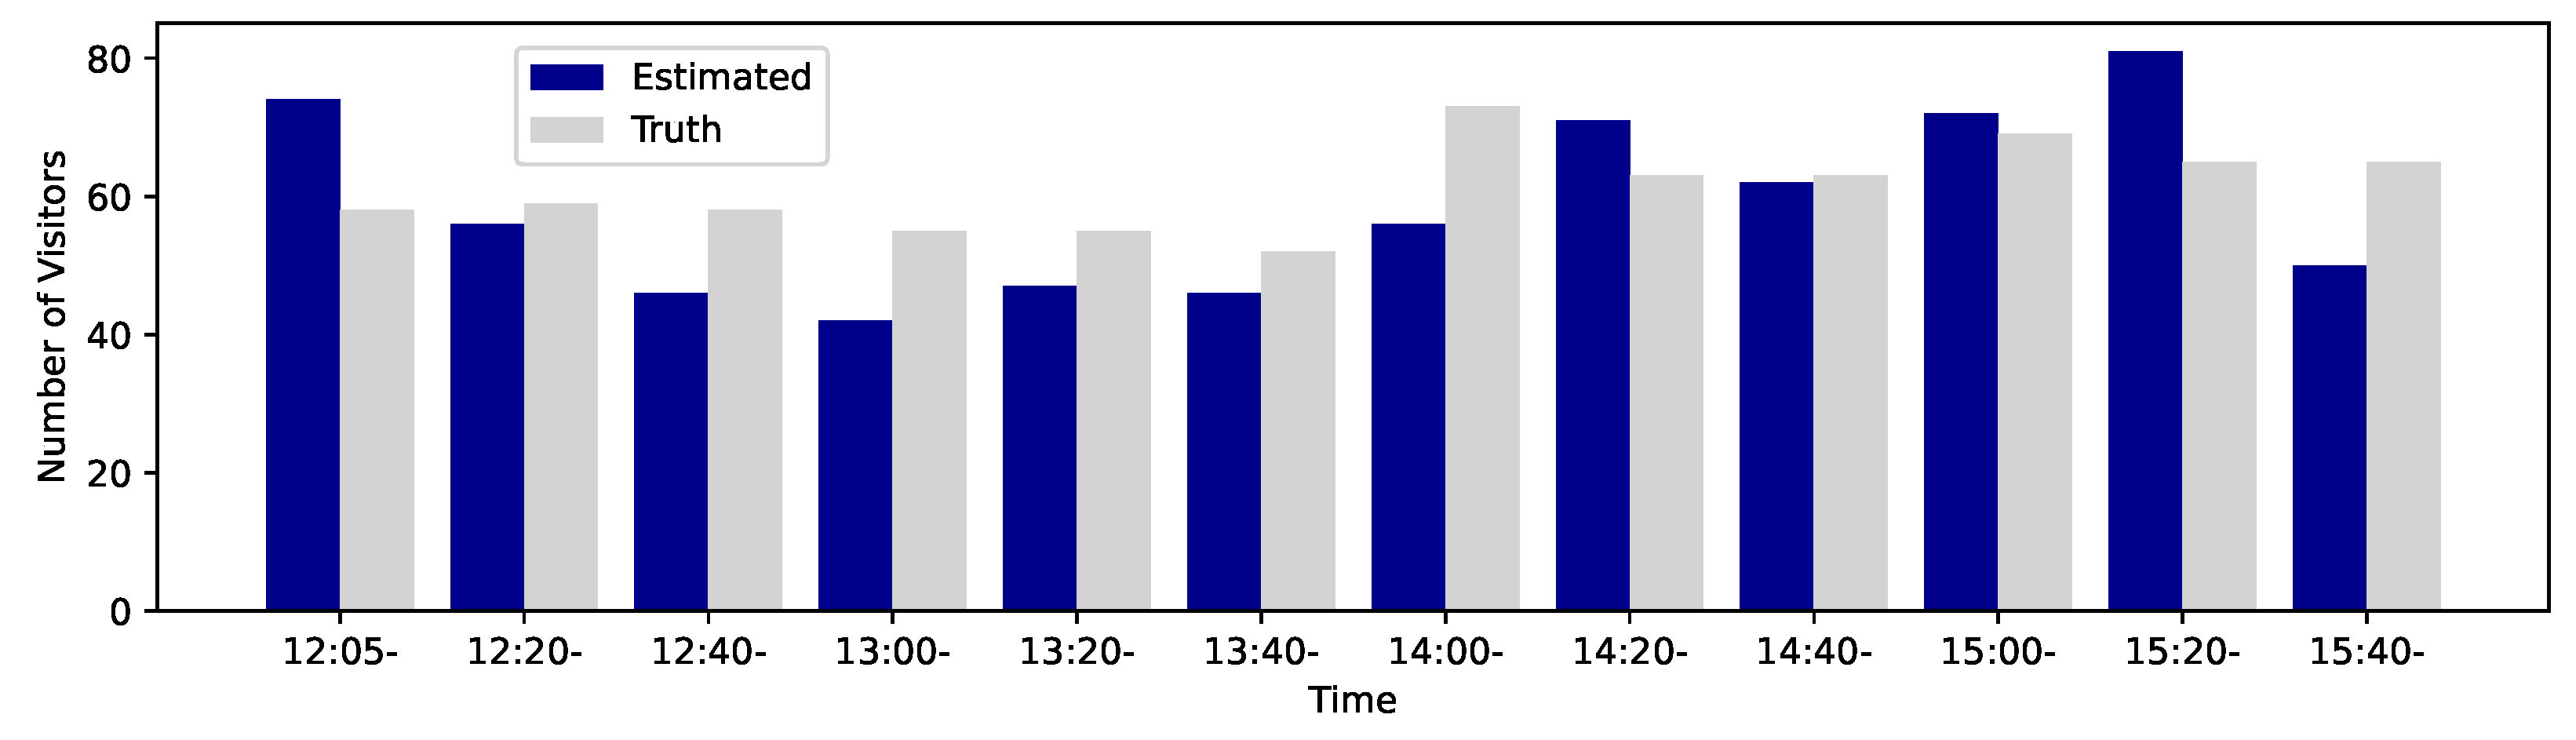
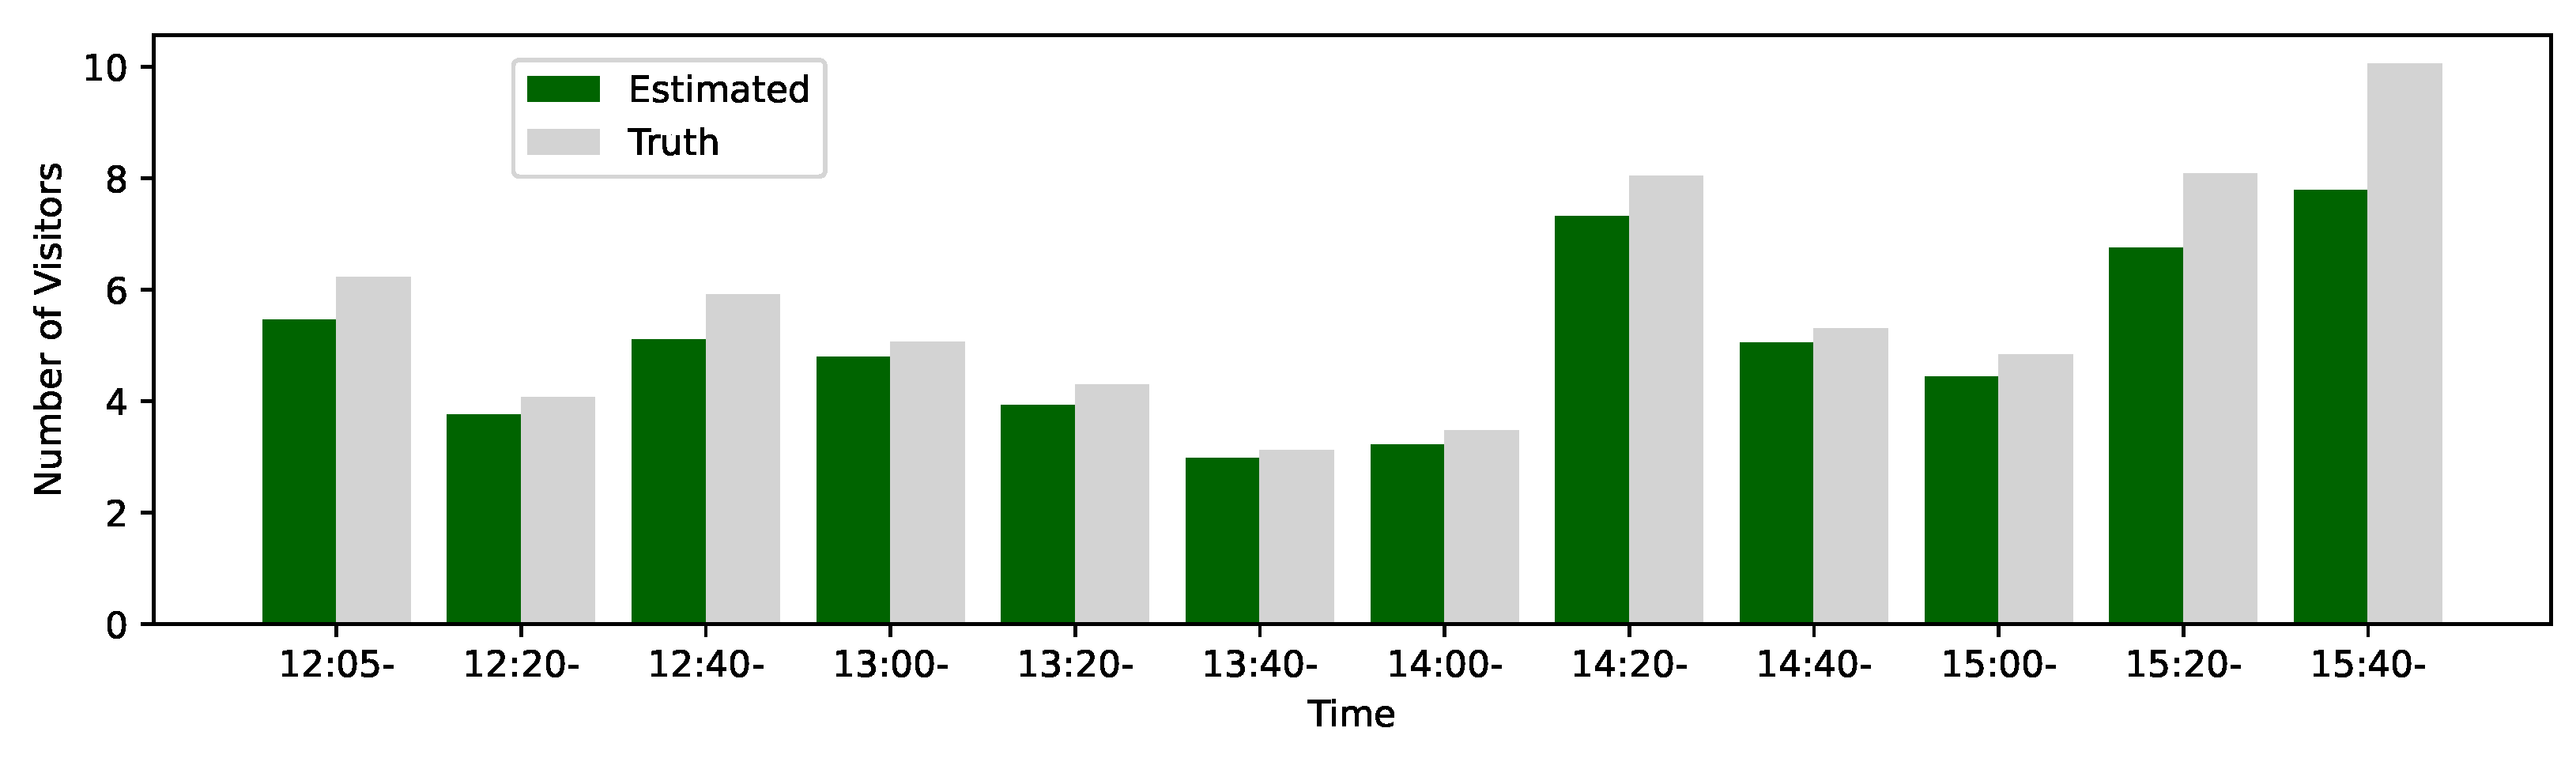
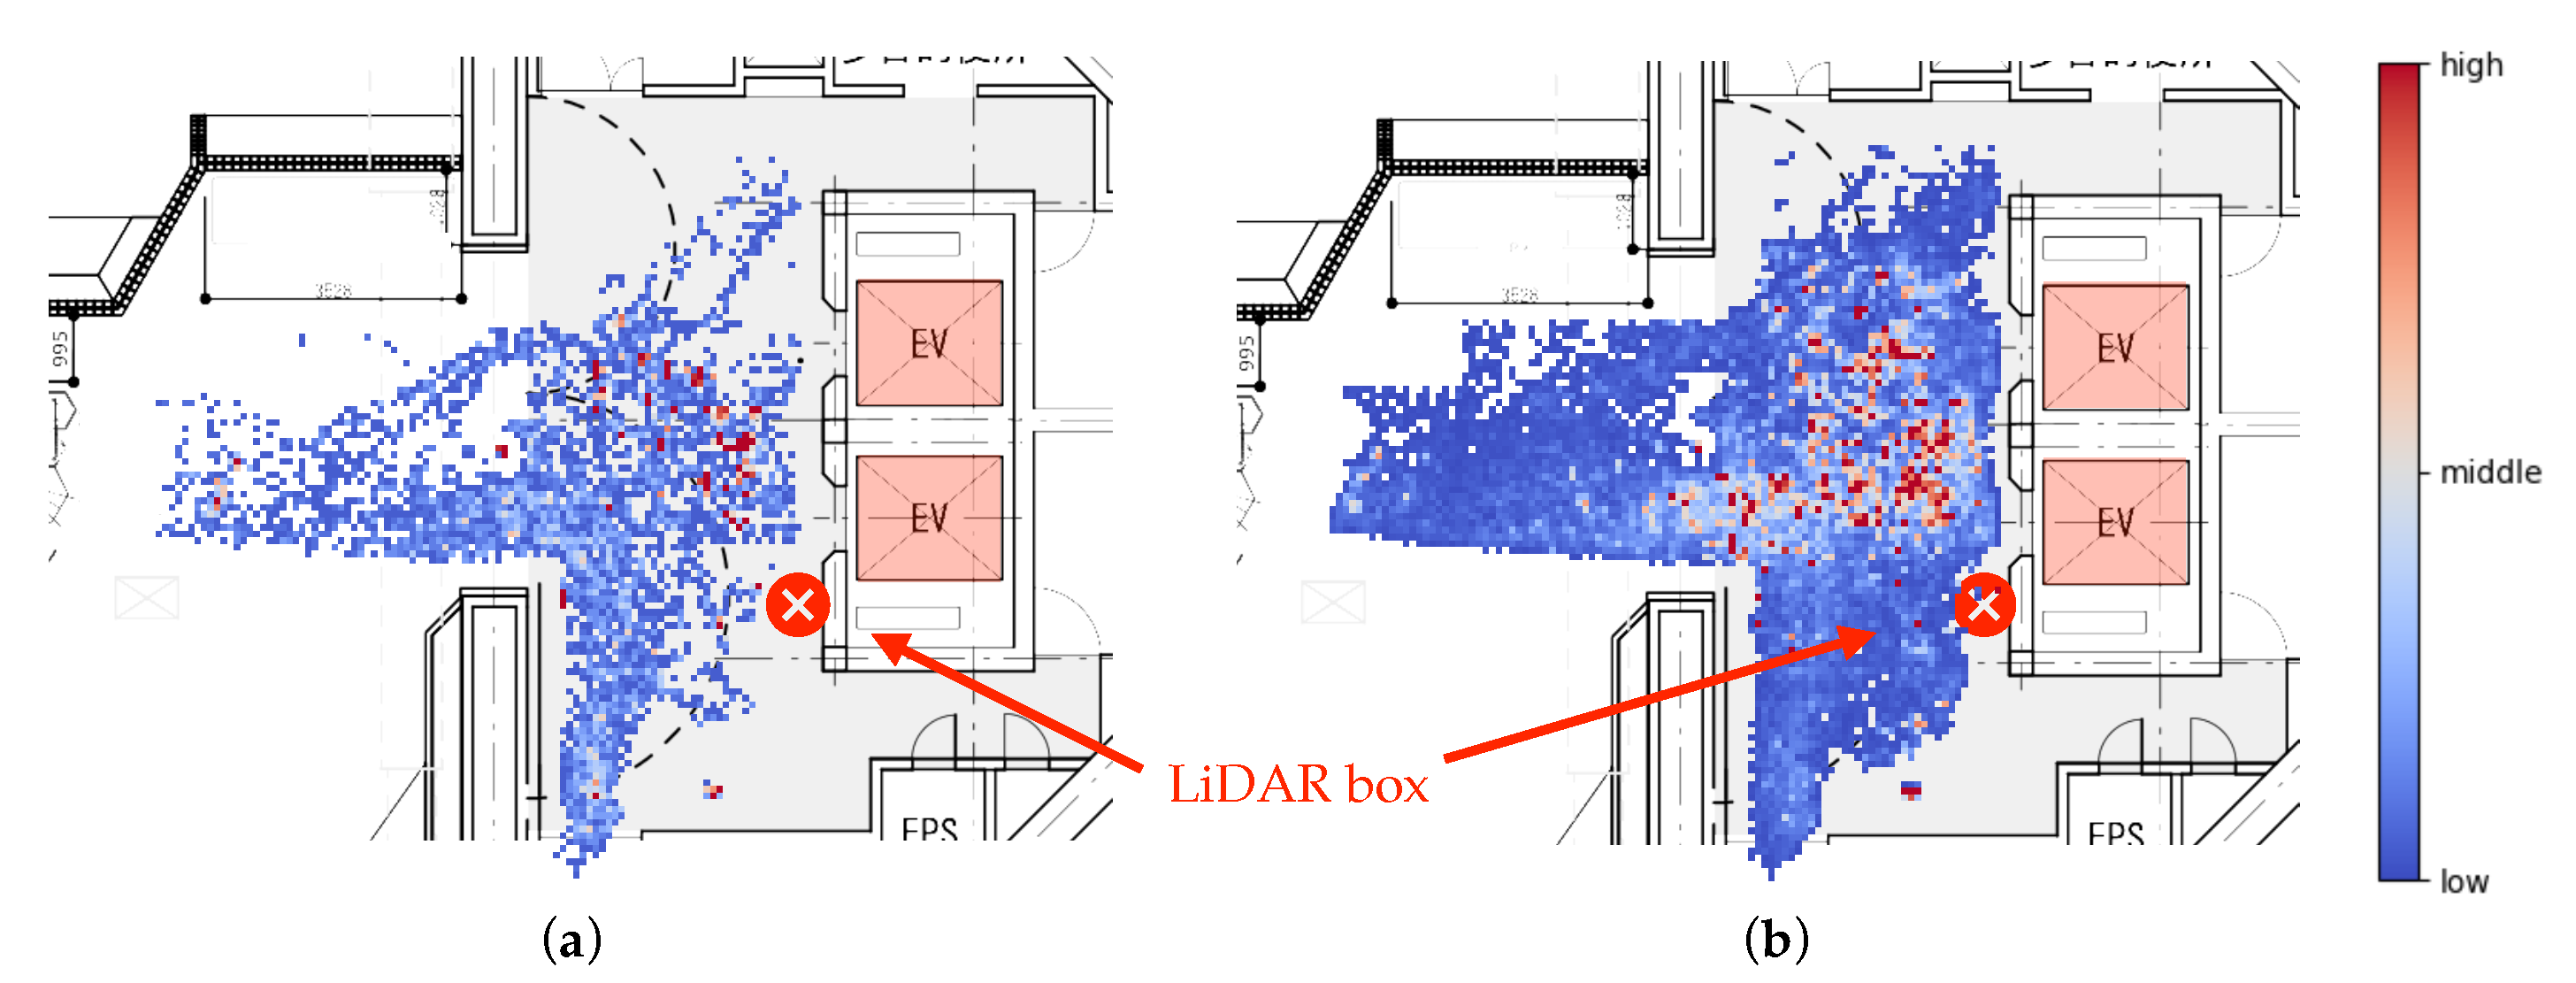
  • A LiDAR box (Section 6) with vertical and horizontal scanning was developed to count visitors (85.3% accuracy), whereby visitor heat maps were generated (Section 6.4).
With advances in digital devices for sensing, display, and computing, the following key factors should be considered for museums to evolve and offer more value to visitors.
  • Personalization, which provides every visitor with a unique experience;
  • Interactivity, which brings exhibits to life to ignite visitor interest;
  • Review, which provides visitors with the opportunity to reflect on their current visit.
In this study, the focus was on enhancing interactivity using low-cost LiDAR devices.
To the best of our knowledge, the potential of these 2D LiDAR sensors for museum use has not been well explored (see [1] for the case of object protection in a museum). We developed three applications for museums, all of which are based on a single 2D LiDAR device. These applications have been traditionally implemented with different types of sensors and input devices, such as a mouse, touch screen, color camera, and infrared (IR) sensors. Two-dimensional LiDAR sensors provide interactivity for museum exhibits and functionality for visitor counting and heat mapping.

2. Related Work

LiDAR sensors are the core technology for autonomous vehicles [2] and mobile robots [3], which is one of the reasons for the rapid and remarkable price drop of these devices. Archaeology is another field in which many LiDAR applications have been studied [4,5,6].

2.1. LiDAR Applications at Museums

In museum-related applications, LiDAR technology is commonly used to capture the three-dimensional structure of historical buildings and remains that need to be preserved. Once the shape of an object or building is captured, it can be presented as a still image, three-dimensional visualization with a head-mounted display (HMD), or a tangible solid miniature output using a three-dimensional printer. Smaller objects often require more precise measurements such as photogrammetry [7] to obtain a denser set of scanned points.
The use of two-dimensional, low-cost LiDAR devices is less common in capturing three-dimensional shapes. Although these plane-scanning sensors can be applied to real-time interactions with visitors rather than scanning the shapes of a few static objects, only a few studies have explored this potential in the implementation of a touchscreen wall [8].

2.2. User Interface for Museum Exhibits

A variety of user interface technologies can be used to enhance the museum experience. Unlike traditional displays, modern museums offer more interactive and sophisticated exhibits [9,10,11]. For decades, numerous studies have been conducted on the progress of traditional static window displays [12]. Touch-based interfaces such as augmented painting [13], traditional board games [14], and learning about specific geometric topics using tangible user interface (TUI) [15] are among the most well-examined techniques for museum use.
To prevent the spread of infectious diseases such as COVID-19, touchless interfaces are gaining increasing attention in museums. Some museums have replaced the control buttons of their exhibits with IR sensors to allow touchless operation. Vision-based techniques are widely adopted to provide content from cameras. Google released a portrait-matching application [16] called ‘Art Selfie’, which has been attracting many visitors to art museums. Visitor postures are captured using a camera for touchless operation, thereby finding a match in the stored images of cultural paintings.
The floor surface is an exceptional plane because it is stepped on all the time, that is, always touched. Therefore, an interactive floor display is a special case of a touchless user interface. Another advantage of using the floor as an interactive screen is its size, which allows multiple visitors to walk and discuss the screen. The potential of interactive floor displays has been explored, including applications in gymnasiums [17,18] and use cases in museums [19,20] (see [21] for a comprehensive survey).
Compared to other public spaces such as train stations, schools [22,23], and tourist attractions, relatively little attention has been paid to the use of information kiosks in museums [24]. Typical use cases include selling museum tickets, wayfinding [25], as well as providing floor guides, and additional content such as audio narratives and videos. Information kiosks at museums have remarkable potential for enhancing the visitor experience by providing personalized services and content.

2.3. Visitor Tracking at Museums

Although a wide range of methods have been proposed to localize digital devices (see a good survey [26] on indoor localization), most human detection techniques are based on visual information captured by a camera. A color camera is one of the most powerful sensors, which can violate the privacy of visitors in a museum. Two-dimensional LiDAR sensors are more privacy-preserving and collect less information, which is still sufficient for counting visitors and providing interactivity for museum exhibits. Radio-based solutions are also powerful; however, they require visitors to have a digital device, such as their own smartphone or a small terminal rented from the museum, and to register it before enjoying the museum. This significantly reduces the museum usability.
One of the most powerful resources for analyzing the motivations, interests, and backgrounds of museum visitors is the variety of information collected from them. Color cameras, although commonly used devices, do not respect the privacy of visitors. The visitor’s smartphone, another common device, is a powerful tool for providing additional information on exhibits, allowing the tracking of the visitor’s behavior and is highly private.
Sensing methods based on other technologies such as radio-frequency identification (RFID), Bluetooth, and Wi-Fi networks [27] maintain privacy. Techniques based on RFID were extensively studied [28,29,30,31] before smartphones became popular. The use of smartphones is one of the most common ways to track visitors’ behavior at museums.
The use of two- and three-dimensional LiDAR sensors is a hot topic in museum visitor tracking. These sensors only collect the locations of scanned data points, which is an advantage from a privacy perspective. Although applications specific to museums are rare, visitor tracking methods have been proposed for public spaces [32,33,34].

3. Case Studies on LiDAR Applications
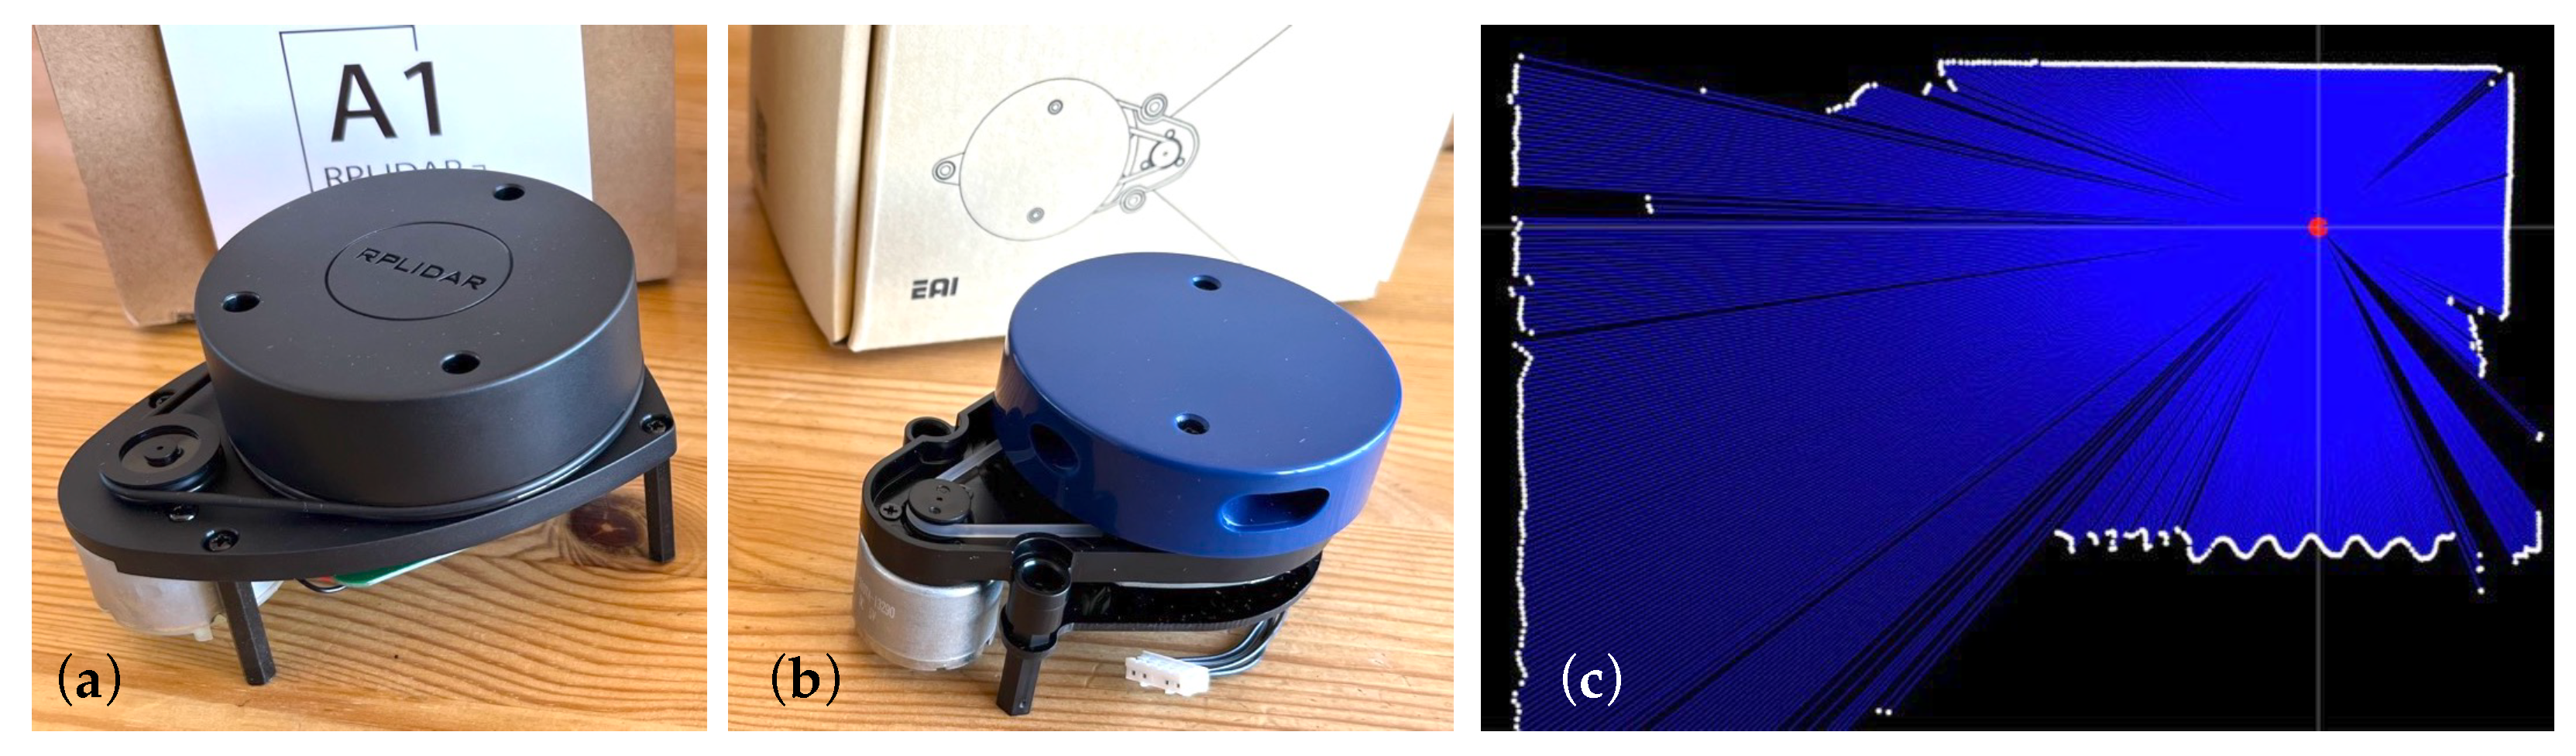
3.1. LiDAR Sensors

Among the range of sensors currently available on the market, LiDAR sensors have experienced a significant price decline in recent years. LiDAR is a remote sensing technology with a range of potential applications. It is based on the time-of-flight (ToF) principle, which measures the time light spends to travel to the target and then back to the sensor.
LiDAR sensors are one of the fundamental devices used in the development of self-driving cars and autonomous robots. These sensors are also used to scan three-dimensional structures and objects in a wide variety of fields, such as archaeology, aerial imaging, factory production, and building construction.
Some LiDAR sensors that are inexpensive, costing as little as approximately USD 100, are based on the triangulation measurement of the infrared laser system instead of ToF. Figure 2 shows two such low-cost LiDARs, namely (a) RPLIDAR A1M8 from Slamtec and (b) YDLIDAR X2 from EAI technology, both of which are priced at approximately USD 100.
Another trade-off is that these inexpensive sensors are two-dimensional. They measure distances to objects on a specific plane rather than considering the entire surrounding three-dimensional space. As shown in the scanning example in Figure 2c, a two-dimensional LiDAR sensor located at the red dot collects the distance measurements (white dots) in discrete directions (blue line segments). None of the objects or surfaces outside this plane are detectable given the design of the two-dimensional sensor. Some LiDAR products have multiple layered planes to detect objects in the vertical direction. We selected Slamtec A1M8 sensors for this study because this product was readily available at the time of this study.
LiDAR sensors at museums offer several advantages over the most common type of remote sensor, the ordinary camera:
  • A much wider viewing angle than those of cameras;
  • Less concern over privacy issues raised by cameras recording the appearance of visitors;
  • Low data density, making it more feasible to collect long-term records.
Table 1 compares different types of sensors, including RGB cameras. Low-cost LiDAR sensors are unique devices with a wide range of angle measurements. They are unencumbered by privacy concerns, low cost, and robust to illumination variance because of the use of infrared (IR) light, and do not requiring visible light.
Museums tend to be less profit-driven than most businesses, partly because some are owned by nonprofit organizations or local governments. Museums would like to benefit from advances in low-cost, powerful, and effective sensor technology. Low-cost LiDAR sensors have a wide variety of potential applications in museums. For example, they are used to measure the three-dimensional shapes of objects, such as ruins and fragile works of art, or can be mounted on top of a mobile robot for path finding. In this study, the focus is on interaction sensing for exhibits and counting and tracking visitors using the three following LiDAR applications which have received little attention in museums.

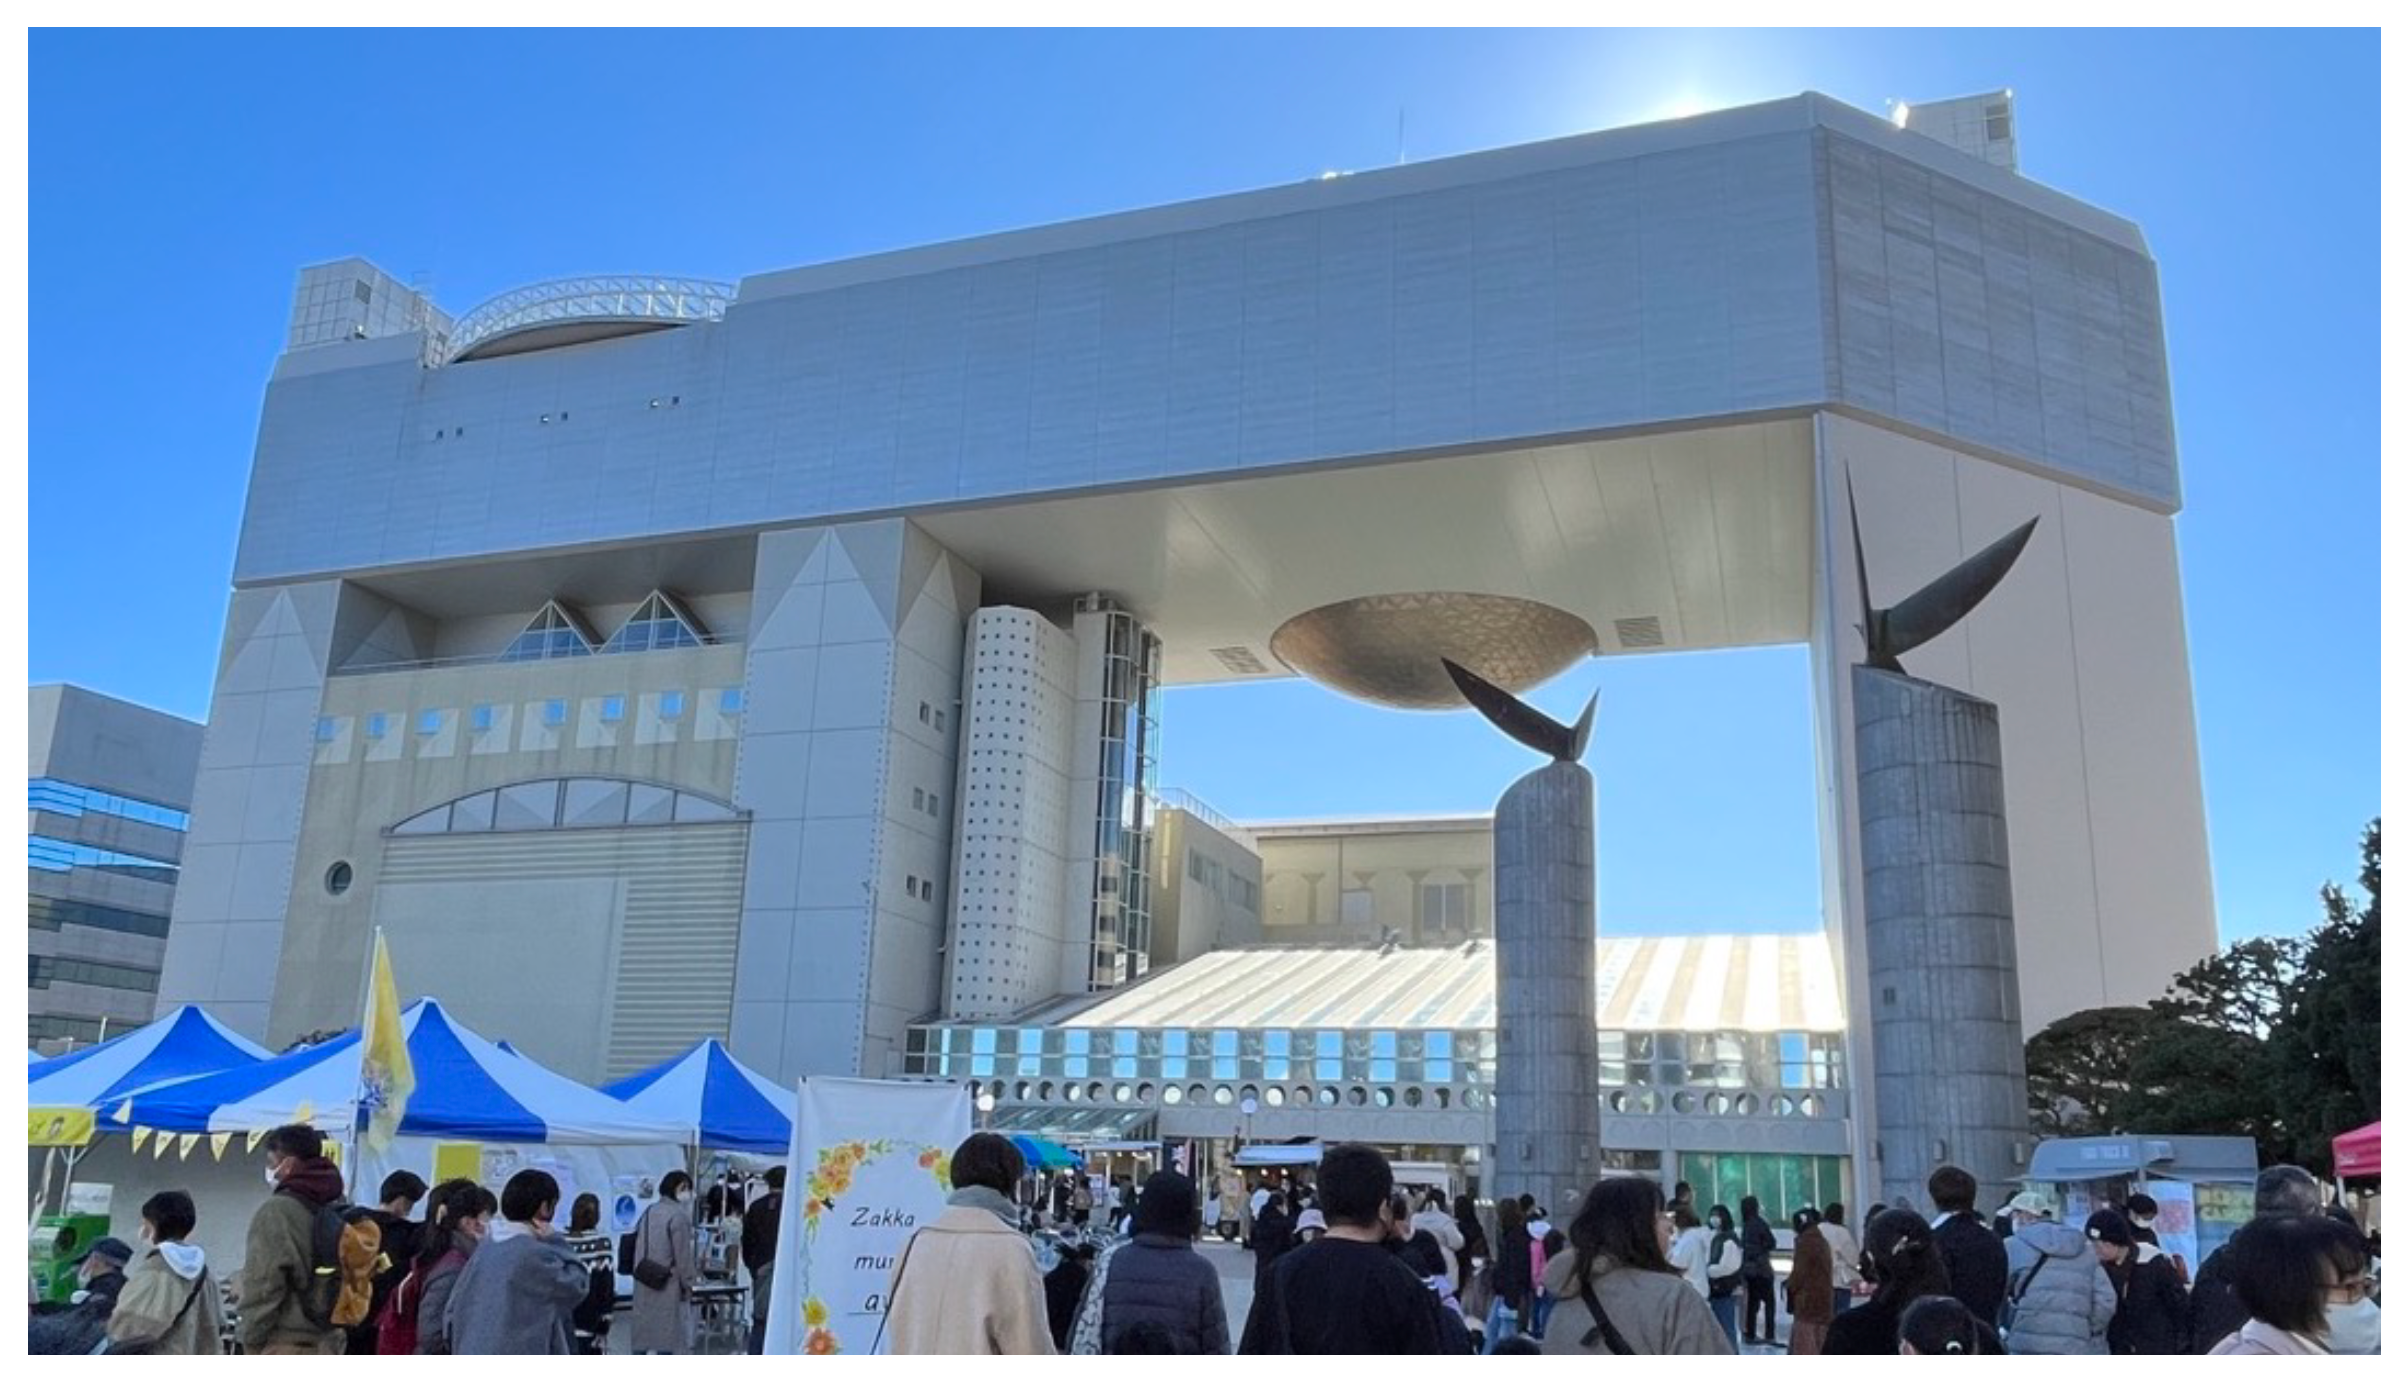
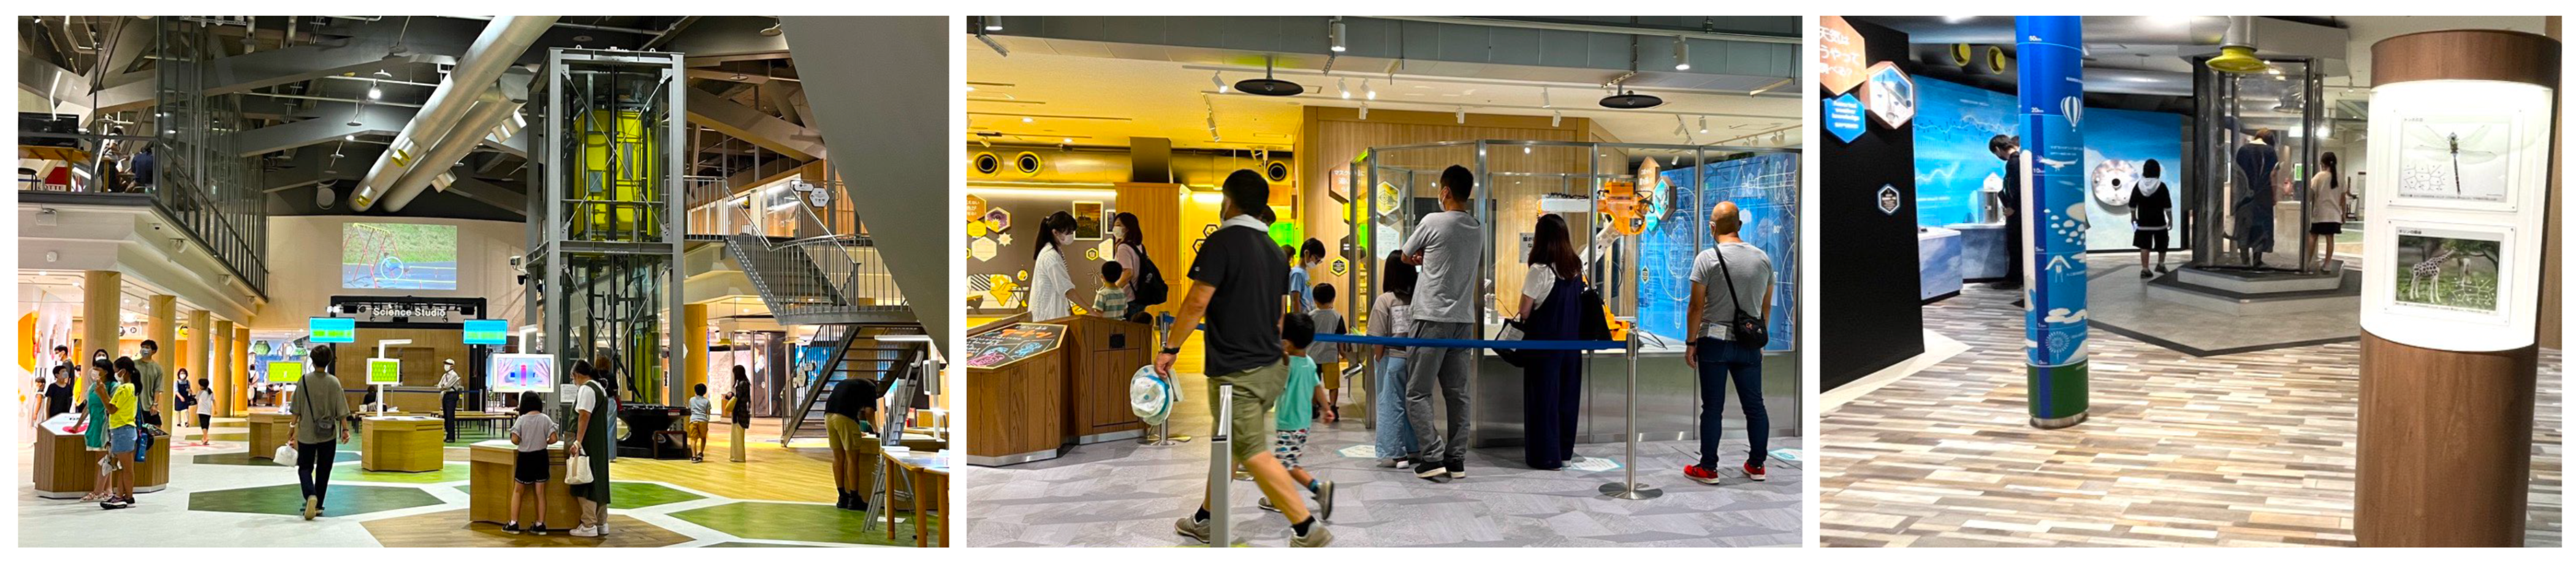
3.2. Experimental Setting of Case Studies

All case studies were conducted at the Hitachi Civic Science Museum (Figure 3), which was established in 1990 in Hitachi, Japan. It accepts approximately 80,000 visitors annually. More than 60 exhibits occupy the eighth and ninth floors of a complex public building next to the Hitachi Station, as shown in Figure 4. This museum is the closest to our university, and we have collaborated on several projects for the museum’s special exhibitions since 2017.
Although this museum experienced its first complete renovation in the past 30 years in 2021, it does not have any exhibits, such as information kiosks, interactive floors, and visitor tracking, which are the main focus of this paper.
As described in Section 3.1, we used RPLiDAR A1M8 [36] sensors from Slamtec. This sensor is based on laser triangulation measurements, and the device specifications are listed in Table 2. By rotating the sensor, the device measures distance values within a range of 6 m on a two-dimensional plane, more than 2000 times per second. The measured values are collected using the software development kit (SDK) [37] connected via a USB cable for various applications. A data frame from this sensor contains a 16-bit angle value with approximately 10 reliable bits and a 32-bit distance value with 12 reliable bits.
For the three following cases of LiDAR applications, we developed our own software using openFrameworks [38], a universal media processing library written in C++ language. Mac mini computers with Intel and Apple CPUs were used because of their small size and powerful computing capabilities.

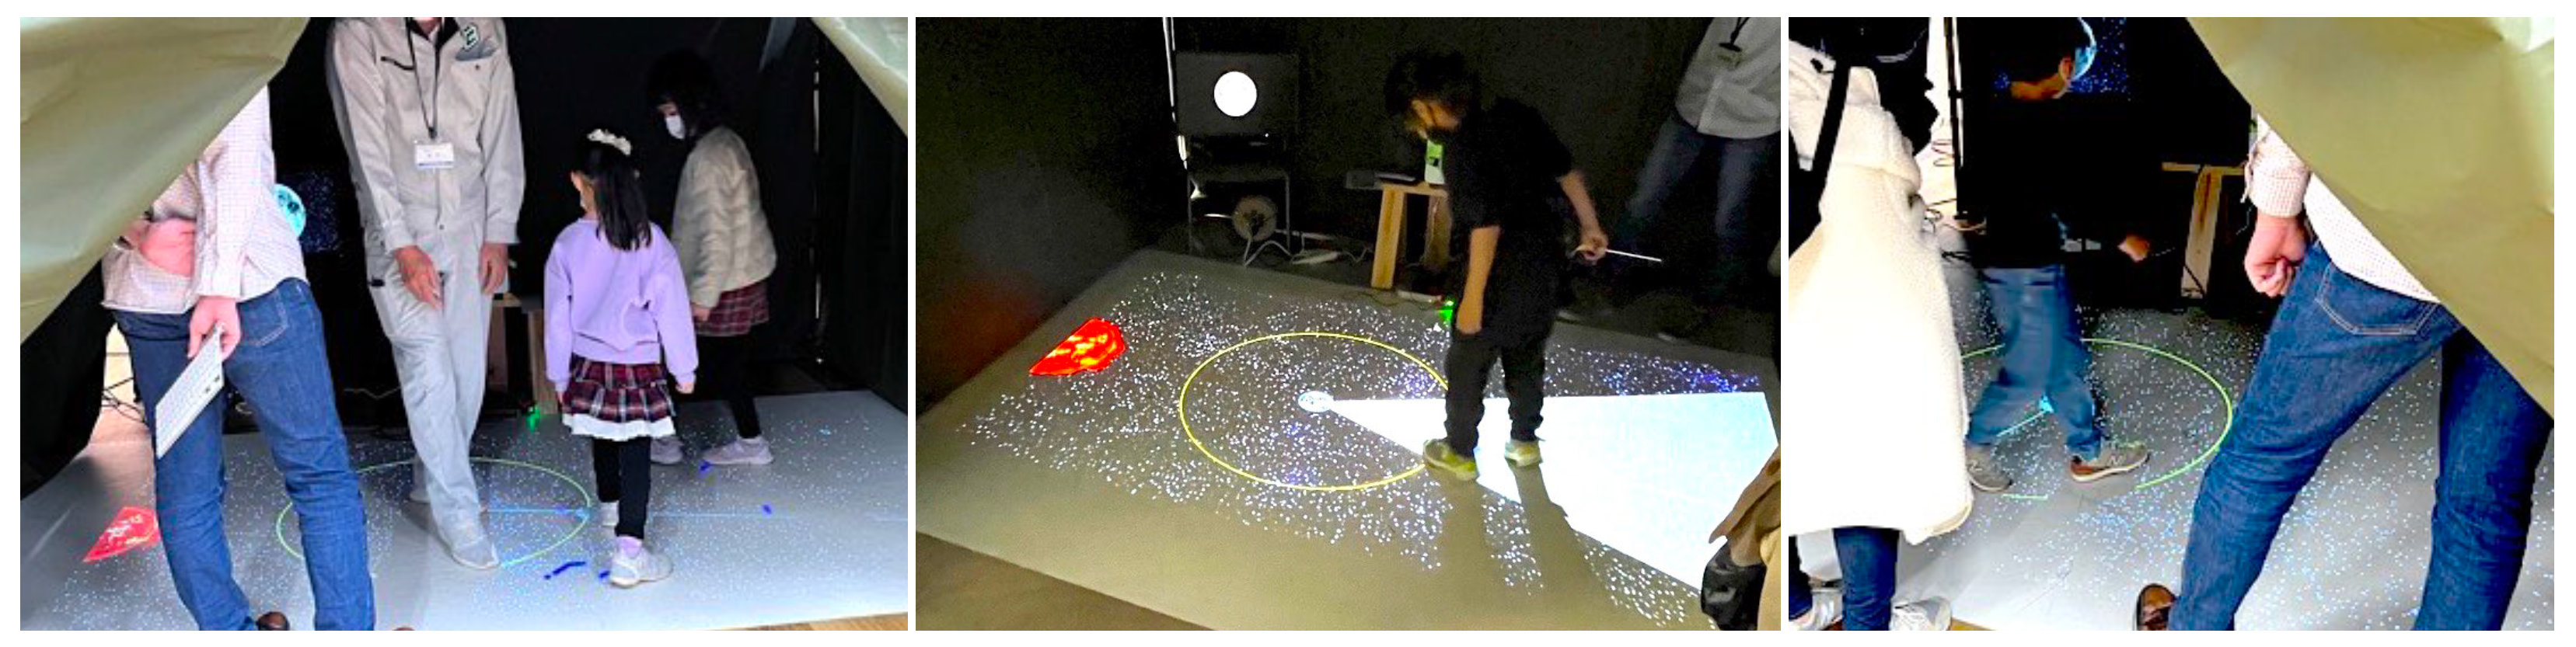
4. Case 1: Interactive Floor Projection to Learn about the Phases of the Moon

An advantage of two-dimensional LiDAR sensors is their wide-angle distance measurement, which was exploited in our first case study. Interactive floor projection is one of the simplest solutions for “touchless” user interactions because no one is free from touching the floor. Thus, floor-based interactions are affected the least by infectious diseases, such as COVID-19.

4.1. Application Design

In Japan, children learn the phases of the Moon in elementary school when they are at the age of 9 or 10. One of the reasons some children find it difficult to understand the phases of the Moon is that it requires a broader perspective of three objects: the Sun, the Earth, and the Moon. This situation can be alleviated by allowing students to walk around, pretending to be on the Moon. This is our approach in interactively projecting the phases of the Moon on the floor.
In our implementation, a very close focus projector (HF65LSR, LG Electronics, Seoul, Korea), was selected for an easy setup, as shown in Figure 5a. A white sheet with the size of 3.0 × 1.8 (m), as shown in Figure 5b, was spread out on the floor, as shown in Figure 5b, and covered by a tent with a dark green thick cloth to hide from the ceiling illumination. We assume that the only objects on the white sheet are the user’s feet and treat the center of all detected points as the user’s location, as shown in Figure 5d. By changing one’s location, the user moves the Moon, which is on the line connecting the Earth and the center of the feet. The Moon on the subscreen is rendered as a shaded sphere with a high-resolution texture image of the lunar surface, illuminated by distant light in the corresponding direction to simulate the Moon’s appearance at the phase given by the user location. The LiDAR sensor was placed at human ankle height to track the user’s position on the floor display. Another display in Figure 5c shows the phase of the Moon, based on a high-resolution image of the Moon [39], as determined by the user’s position on the floor. The LiDAR sensor was first placed at the Earth’s location in the center of the floor screen to determine the tendency of the children to touch and stop the rotating scanning device. The sensor, which was placed on the edge of the projection screen, emitted green light from a power LED, using infrared laser pulses. Regarding the learning content on the phases of the Moon, the user answered a series of questions about the location of the Moon causing a particular phase, the shaded appearance of the Moon, and the user’s location on the floor projection. Thus, the user learned the relationship between the position of the Moon on the ground and the Moon’s phase displayed on a subscreen.

4.2. User Study

User experiments were conducted at the Hitachi Civic Science Museum on five randomly selected non-continuous days from August 2022 to January 2023. Some visitors who experimented with the floor projections are shown in Figure 6. This application attracted many people during the experiments because the tent was eye-catching, with a dark room and an illuminated floor.
Thirty-two visitors, ranging in age from 5 to 69 years old, rated the application on a scale of 1–5 in terms of ease of understanding, interest, and comparison with textbooks. A higher score indicated the superiority of the application in this regard. The results shown in Figure 7, generally indicate high ratings, with an average of 4.3–4.4. Some very young visitors found the implementation of the Moon-phase mechanism difficult to understand. An additional set of questions asked for the correct position of the Moon to create a specific phase. The correct answer rate was approximately 65% in 46 trials.

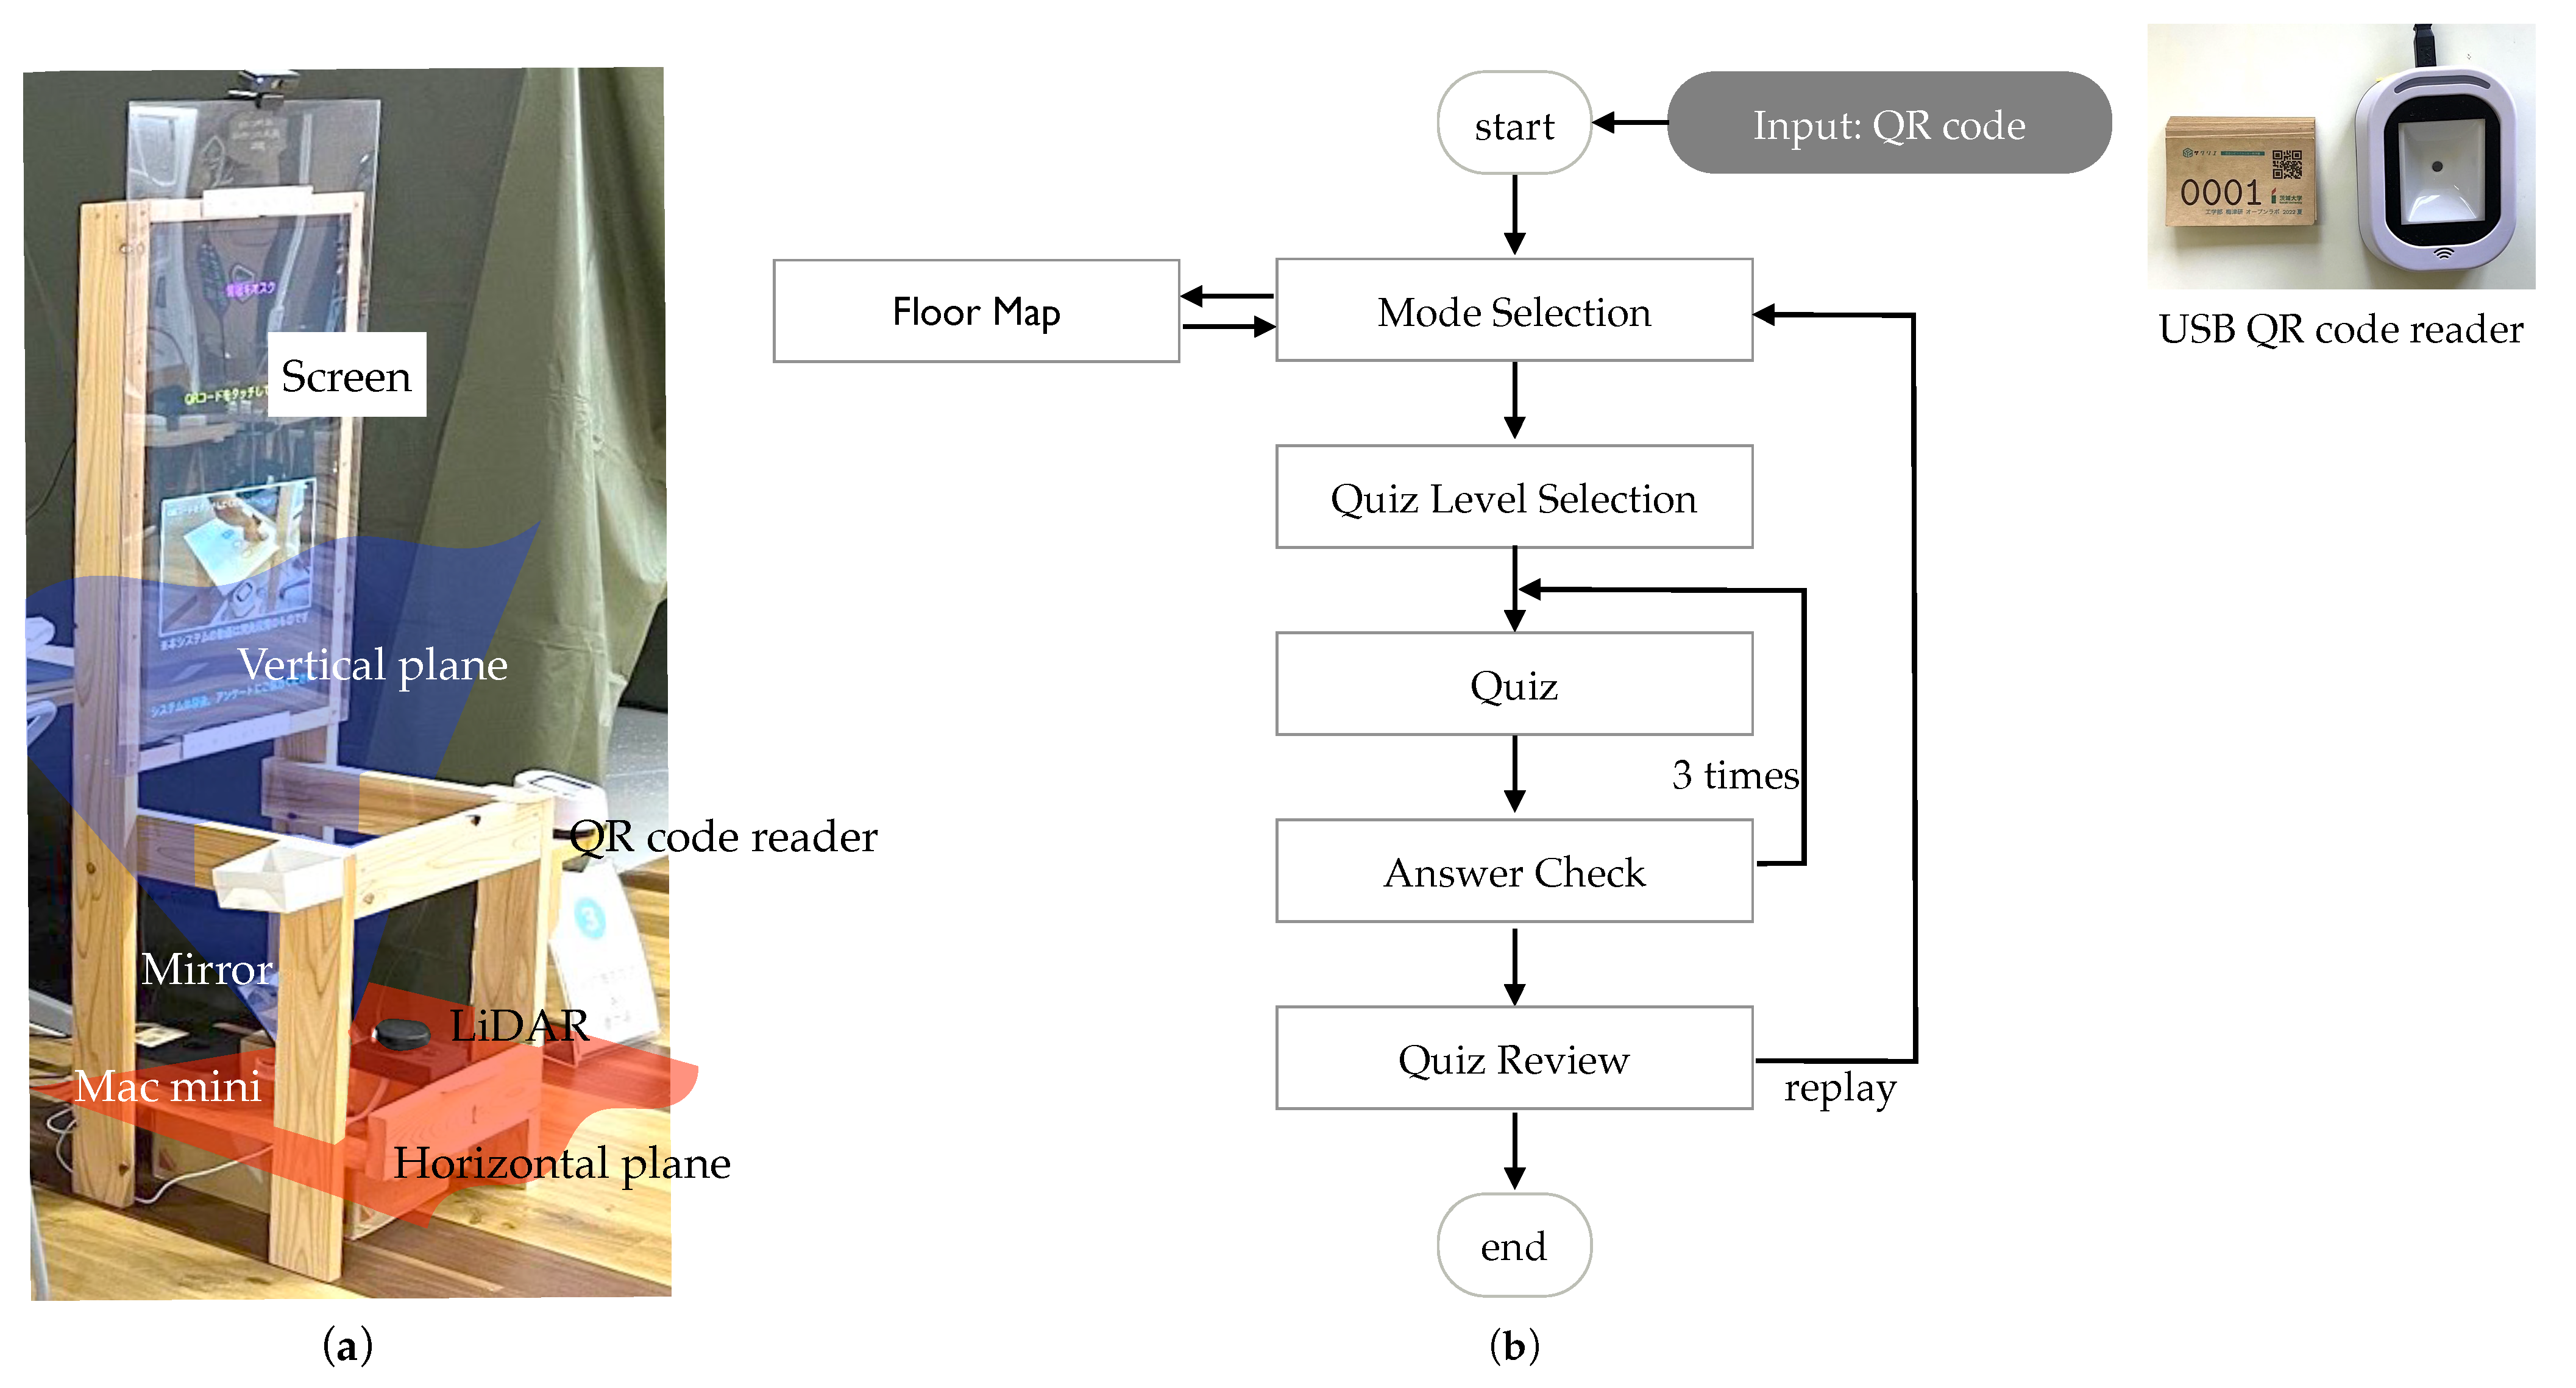
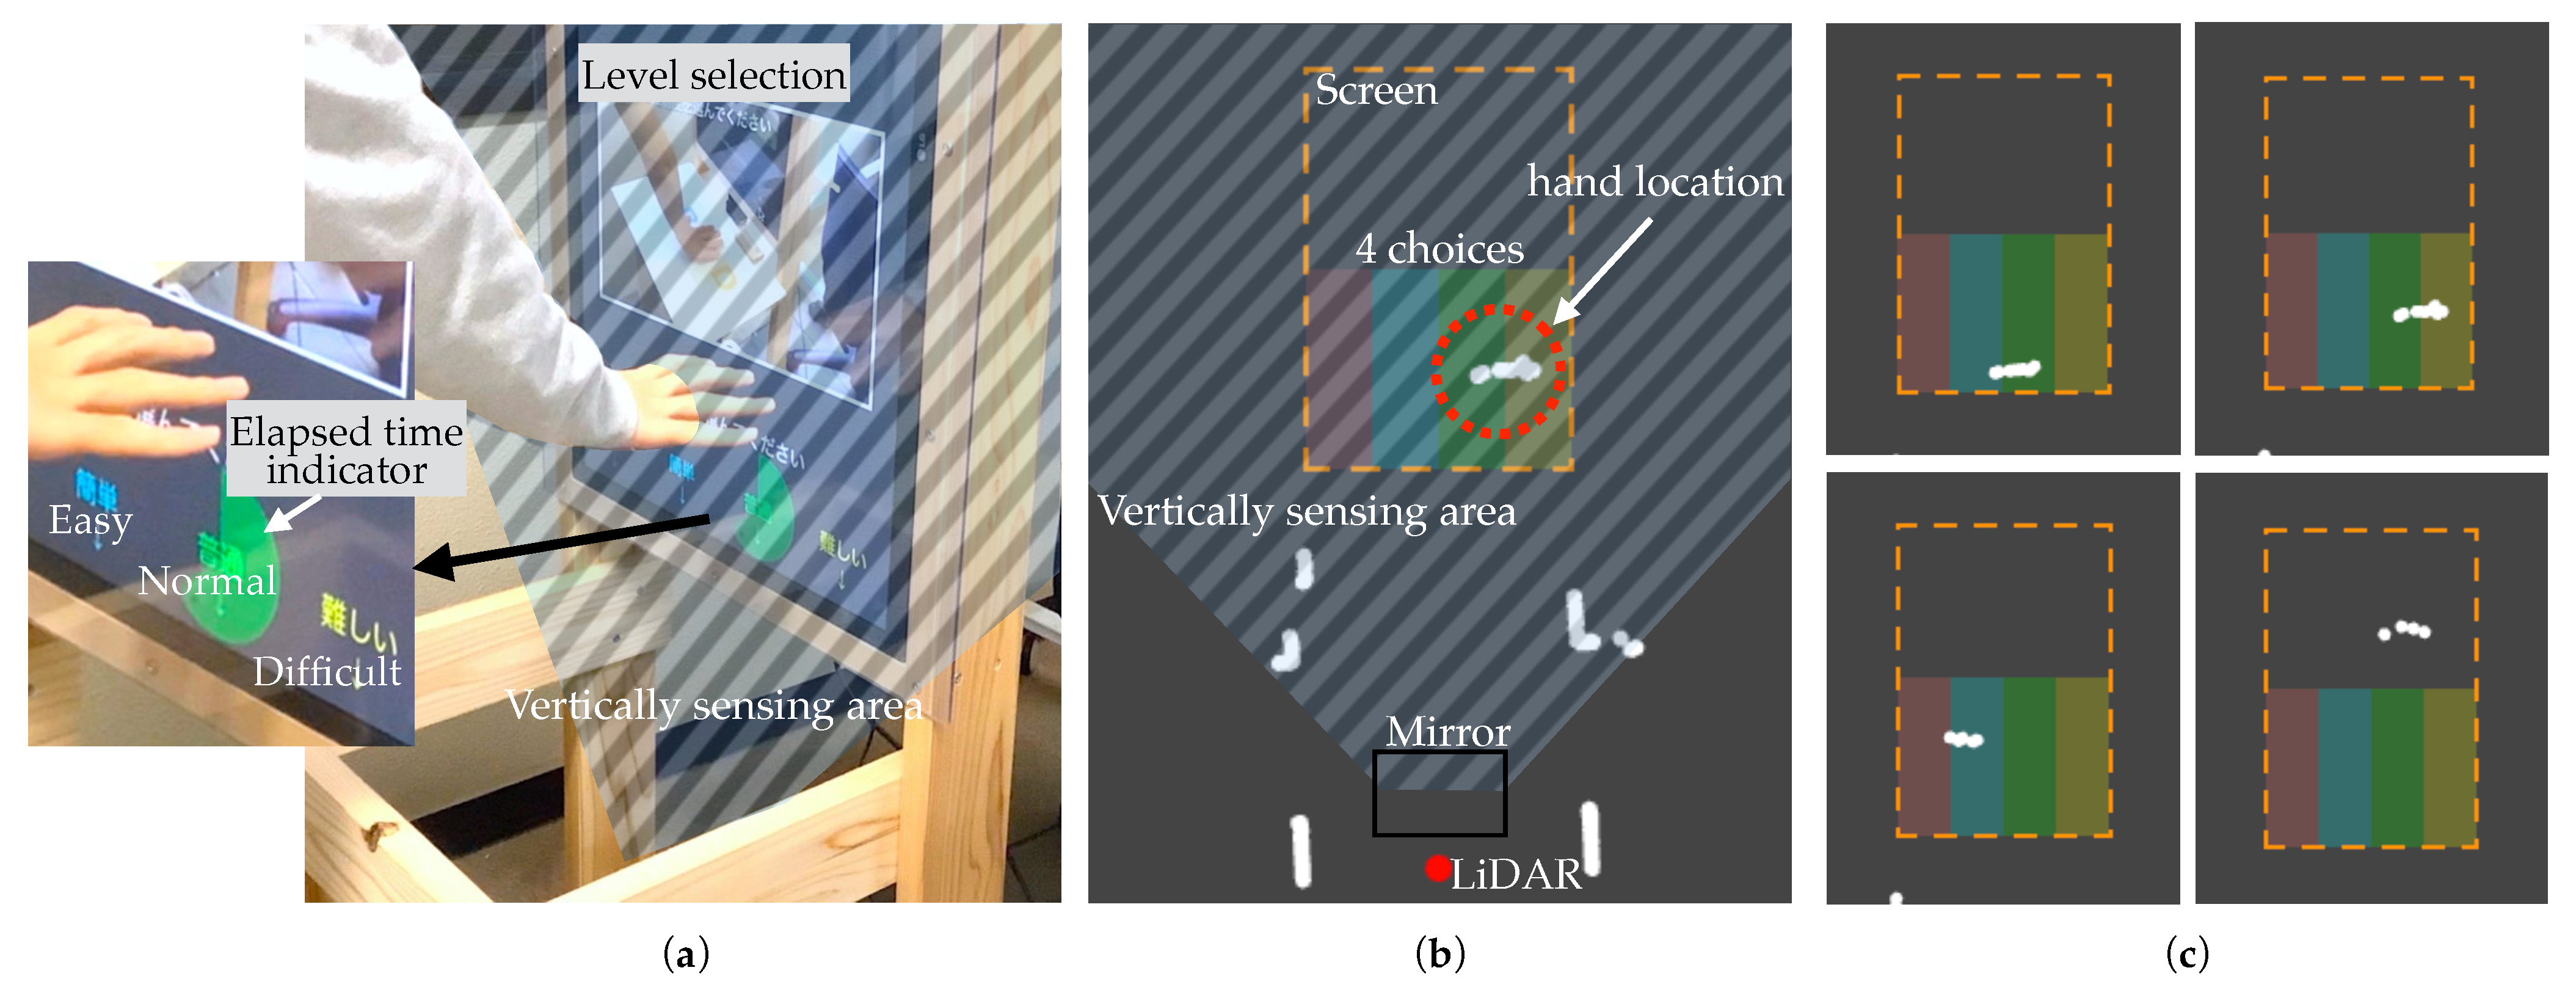
5. Case 2: Versatile Information Kiosk with Touchless Interactions

An information kiosk, also known as an interactive kiosk, is a computer-based, special-purpose terminal designed to provide people with various types of information and services. Information kiosks offer several advantages:
  • Multiple functions with fewer museum staff. Examples include floor guides, visitor membership services, and multilingual assistance. Wayfinding is particularly useful in large museums. Kiosks are more cost effective than hiring staff, whereby staff members can focus on basic and essential tasks to add value to the museum.
  • Active learning experience offered to visitors. A kiosk is more attractive than ordinary static exhibits at a museum because visitors can interact with it and test their understanding by answering the questions displayed on the screen.
  • Visitor data collection at a low cost. Using a visitor personalization method, such as a membership card, museum application software, or a paper ticket with a unique QR code, the staff can perform visitor analytics on the information collected from kiosks deployed at this museum.
Among the various applications mentioned above, a typical use of kiosk information at a museum is to provide content, such as:
  • Floor plans;
  • Interactive content such as quizzes;
  • More detailed and specific information on a particular topic.
The second application based on low-cost LiDAR entails the first and second steps described above.

5.1. System Overview
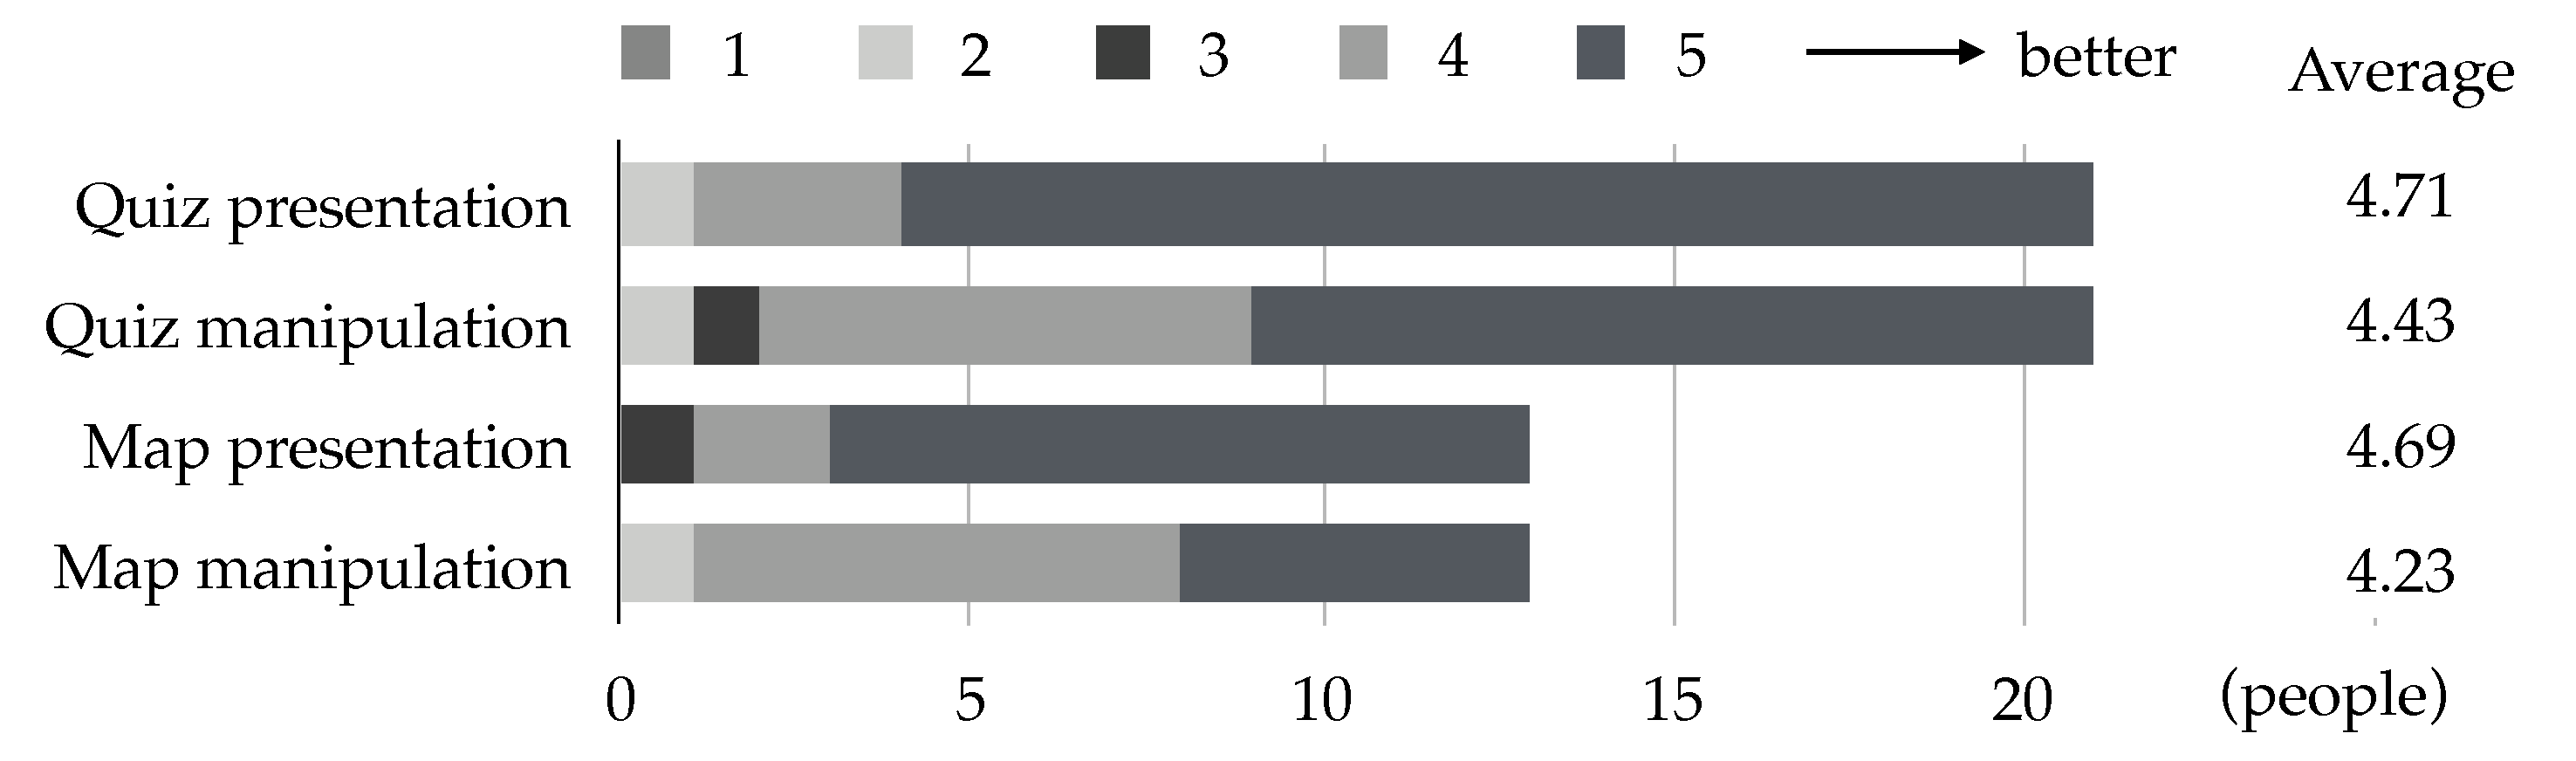
The proposed design focused on versatility, ranging from touchless interactions to visitor tracking. A single LiDAR sensor was used for the applications below. The use of various sensors such as humidity and temperature would make the information kiosk a much more versatile and powerful device at a museum.
As shown in Figure 8a, the proposed information kiosk consists of a 32-inch LCD with a vertically built-in Mac mini for system control, LiDAR sensor A1M8, USB-connected QR code reader, and a handmade wooden frame. The frame height and width was 145 × 37 cm, and the LiDAR sensor was placed 25 cm above the floor. The screen was covered with a transparent polyvinyl chloride (PVC) panel to protect it from the unintentional contact from visitors. A mirror set up reflecting the scanning plane by 90 was used to detect objects in the horizontal floor plane (red) for visitor tracking, and was used to detect objects in the vertical plane (blue) for touchless interaction with a single LiDAR. Note that the red and blue planes in Figure 8a are only used for illustrative purposes, and the actual scanning angle with LiDAR is limited by the wooden frame or the edge length of the mirror reflecting the laser pulses from the LiDAR.
By presenting the QR code card to the reader on the right, the visitor begins to interact with the information kiosk. The processing steps are illustrated in Figure 8b. Although the proposed system was designed to read QR codes with integrated software, a USB-connected QR code reader is sufficiently reliable and available at a low price. This reader acts like a regular USB keyboard and sends the converted code as ASCII keystrokes to the PC. This type of hardware QR code reader is used in our system. Visitors were given a code-printed card with a four-digit hexadecimal number to personalize the cardholder to a maximum of 16 4 = 65,536 people. After reading the card, the visitor first chooses the floor guide and quizzes, both operable with touchless hand gestures.
The hand controls were implemented as follows: The LiDAR was placed at the bottom of the kiosk hardware, and approximately a quarter of the measurement plane was reflected up by placing a mirror at an angle of 45 from the floor. An inexpensive mirror can be used (available for USD 1) because hand detection in the vertical direction is less sensitive to manufacturing precision. The reflected detection plane, which was set approximately 10 cm away from the screen surface, is shown as a translucent dashed area in Figure 9a. The detected objects are shown as dots in Figure 9b, where the area in front of the screen is covered by the reflected measurement plane. It is reasonable to assume that the detected single object is the visitor’s hand, which significantly simplifies the recognition process. To group the detected points into a single object, their average coordinates were calculated, to represent the location of the hand (detection examples shown in Figure 9c). The hand location is used for selecting a menu item, choice for quiz, and scrolling the floor guide. In answering the four-choice quizzes, preliminary user experiments were conducted to determine whether the hand position remained fixed on an answer for more than 1.5 s. The expanding colored sector in green on the left side of Figure 9a indicates the time elapsed until the current answer. The differences in location access frames were used to scroll the floor guide display.
The actual manipulation time of visitors at kiosks is limited, even when visitors play four-choice quizzes. This is because visitors tend to spend most of their time looking at the kiosk screen, reading questions, and thinking about the answers, only raising their hand to select an answer in the last few seconds of interaction with the kiosk. This means that most of the time, a single powerful LiDAR sensor is free. Another application of LiDAR is the horizontal measurement for tracking visitors on the floor. As shown in Figure 8a, approximately a quarter of the measurement plane is reflected vertically (blue), whereby the remaining three quarters (red) can be used to detect objects in the horizontal plane. The plane is at a height of 25 cm and aligned with the floor. A kiosk at a museum is typically placed with its back on the wall so that it does not have to detect the visitors behind it. The proposed kiosk setup maximized the measurement capability of the two-dimensional LiDAR sensor.
To estimate the number of visitors in the kiosk measurement area, a group was formed out of points representing an object such as a human leg. The collected points were at a distance of less than 10 cm from each other. This was based on a preliminary experiment, which determined the distance between the legs of a standing person to be typically 15 cm or more. The number of detected groups were counted at approximately 7 frames per second (fps) and averaged to produce an estimate per second. Using a simple linear regression model from the results of a preliminary experiment, we obtained the following relationship:
V n = 0.80 L n + 0.11
where the number of visitors V n is estimated from the number of detected objects (legs) L n .

5.2. User Studies

The first implementation of the information kiosk was exhibited for two days at the Hitachi Cover Science Museum in January 2023 (Figure 10). One of the four-choice quizzes presented at the kiosk asks for a case similar to the reproduction of a lizard tail, as shown in the middle of Figure 10b. In Figure 10c, the procedure for estimating the number of visitors passing through the 4.0 × 4.0 m area in front of the kiosk at this museum is illustrated by a white rectangle. To establish the ground truth, a webcam was used to continuously capture the experimental area. Subsequently to conducting these experiments, the actual visitors were manually counted. Among the visitors who interacted with the kiosk, 21 were randomly selected to evaluate and comment on the demonstrated system.
Figure 11 displays the ratings on a scale of 1–5 for the presentation and manipulation of the quizzes and the floor map. There were fewer visitors on the floor map as some of the visitors only took quizzes and did not use the map display. The map manipulation received a lower evaluation, probably because both back-and-forth movements were treated as scrolling controls to keep the map displayed in approximately the same region. This problematic behavior of the current implementation can be improved by setting a short inactivity period after the detection of scroll manipulation.
Table 3 summarizes the number of visitors estimated by the information kiosk during the experimental period lasting 5 h, 11 min, 47 s. The difference between the estimated and true numbers of visitors is denoted by Δ . The rate of estimation for periods with Δ = 0 , | Δ | 1 , as well as the maximum and average of Δ , are shown in the table. The total rate for Δ = 0 is 41.8% with the rate increasing to 83.1% when including | Δ | 1 . Although visitor interaction with the kiosk caused a remarkable reduction in estimation accuracy, the method successfully estimated the number of visitors without kiosk interaction as 48.7% for R Δ = 0 and 93.9% for R | Δ | 1 .
Figure 12 shows the number of visitors estimated using our method, with the estimates in blue and true values in orange for each hour. The estimation process was performed at approximately 7 fps and the calculated values were averaged for each second. The graphs in Figure 12 are drawn using a moving average window of 10 s to reduce small variations and increase visibility. Several periods surrounded by gray dotted ovals show lower accuracy in the estimation, all generating smaller values than the truth.
Scatter plots between the true and estimated numbers of visitors are shown in Figure 13, with the red line indicating y = x . The estimates are smaller than the true values throughout the entire period with a rate of 53.5%; this rate increases to 71.8% for the interaction periods in the middle. The plot for these interaction periods also displays a large spread, whereas the plot for the periods without kiosk interactions has a smaller distribution (right). Consequently, the plot for the entire period is too large to be estimated using the linear regression model.
Occlusion is the most problematic issue in estimations using a LiDAR sensor. This became more noticeable as visitors interacted with the information kiosk. During an interaction, a visitor standing close to the kiosk imposes an occlusion that hides a large part of the measurement plane behind the person. This causes people to approach the kiosk, thereby reducing estimation accuracy.
Visitor estimation accuracy is lower when the information kiosk is actively used; however, occlusion is unavoidable in LiDAR measurements. In this study, the interactivity of the kiosk was the primary focus, and visitor tracking was the secondary task when the system was idle. A more sophisticated estimation model could be used in future implementations. Using other devices, such as temperature and humidity sensors, is another improvement that would make the information kiosk in museums more versatile.

6. Case 3: Visitor Tracking with Horizontal and Vertical Sensing

A museum’s knowledge of its visitors is the key to its success. The visitors’ behaviors and paths through the museum provide a variety of information that can be used to improve exhibits and viewing paths. Such information is also important for discovering lesser-known inconveniences such as a lack of introduction and misleading or outdated exhibit panels. Visitor trajectories, as well as the number of visitors at each corner or floor in the museum, can be captured by LiDAR sensors which would significantly help with a better understanding of the interests of visitors.

6.1. System Design

To make the most of the very wide measurement angle of the two-dimensional LiDAR, our design of the LiDAR box was designed with a long horizontal slit, as shown in Figure 14a. A mirror was used to reflect a portion of the detected plane upward, giving us two perpendicular planes to track visitors for generating heat maps and to count the visitors simultaneously with a single LiDAR device. To track visitors, horizontal measurements were performed on the floor using a slit with a width of 2 cm and a height of 15 cm above the floor. This box containing the LiDAR had dimensions of 45 × 30 × 30 cm, a mirror of 27 × 22 cm, and a PC (Mac mini), as shown in Figure 14b. The back panel of this LiDAR box was removed to allow the mirror to hang out on the back wall, to reflect the scanning plane in the vertical direction upward. Unlike the vertical plane used in the information kiosk for interaction sensing, this reflected vertical plane is used to estimate the approximate height of visitors entering or exiting the elevator box, as in Figure 14c. A redundant fraction of the scanning plane was diverted to monitor another aspect of the visitors.
The visitor-tracking algorithm shown in Figure 15 comprises two components. The flow on the left is based on a vertical scanning plane that estimates the number of visitors around the LiDAR box, thereby categorizing them into four groups according to their height. On the right, the horizontal plane is used to track visitors, draw their trajectories, and generate heat maps on the museum floor plan.
We assume that visitors passing through the vertical sensing plane can be extracted by simply setting an appropriate sensing area in the plane. Occlusion is a more serious problem in the horizontal plane than in the vertical plane because the arrangement of multiple objects on the floor plane, including visitors, museum exhibits, and structural parts, can often be obstacles for a single LiDAR sensor. The generation of visitor heat maps is less affected by occlusions, and no special treatment is applied to occlusions caused by visitors. To suppress occlusions in our experiments described later, we selected the elevator lobby of 10.0 × 4.0 (m) shown in Figure 15, which is one of the largest areas in the museum without any exhibit. This situation could be relaxed if multiple LiDAR sensors were deployed at different locations, which is beyond the scope of this study.

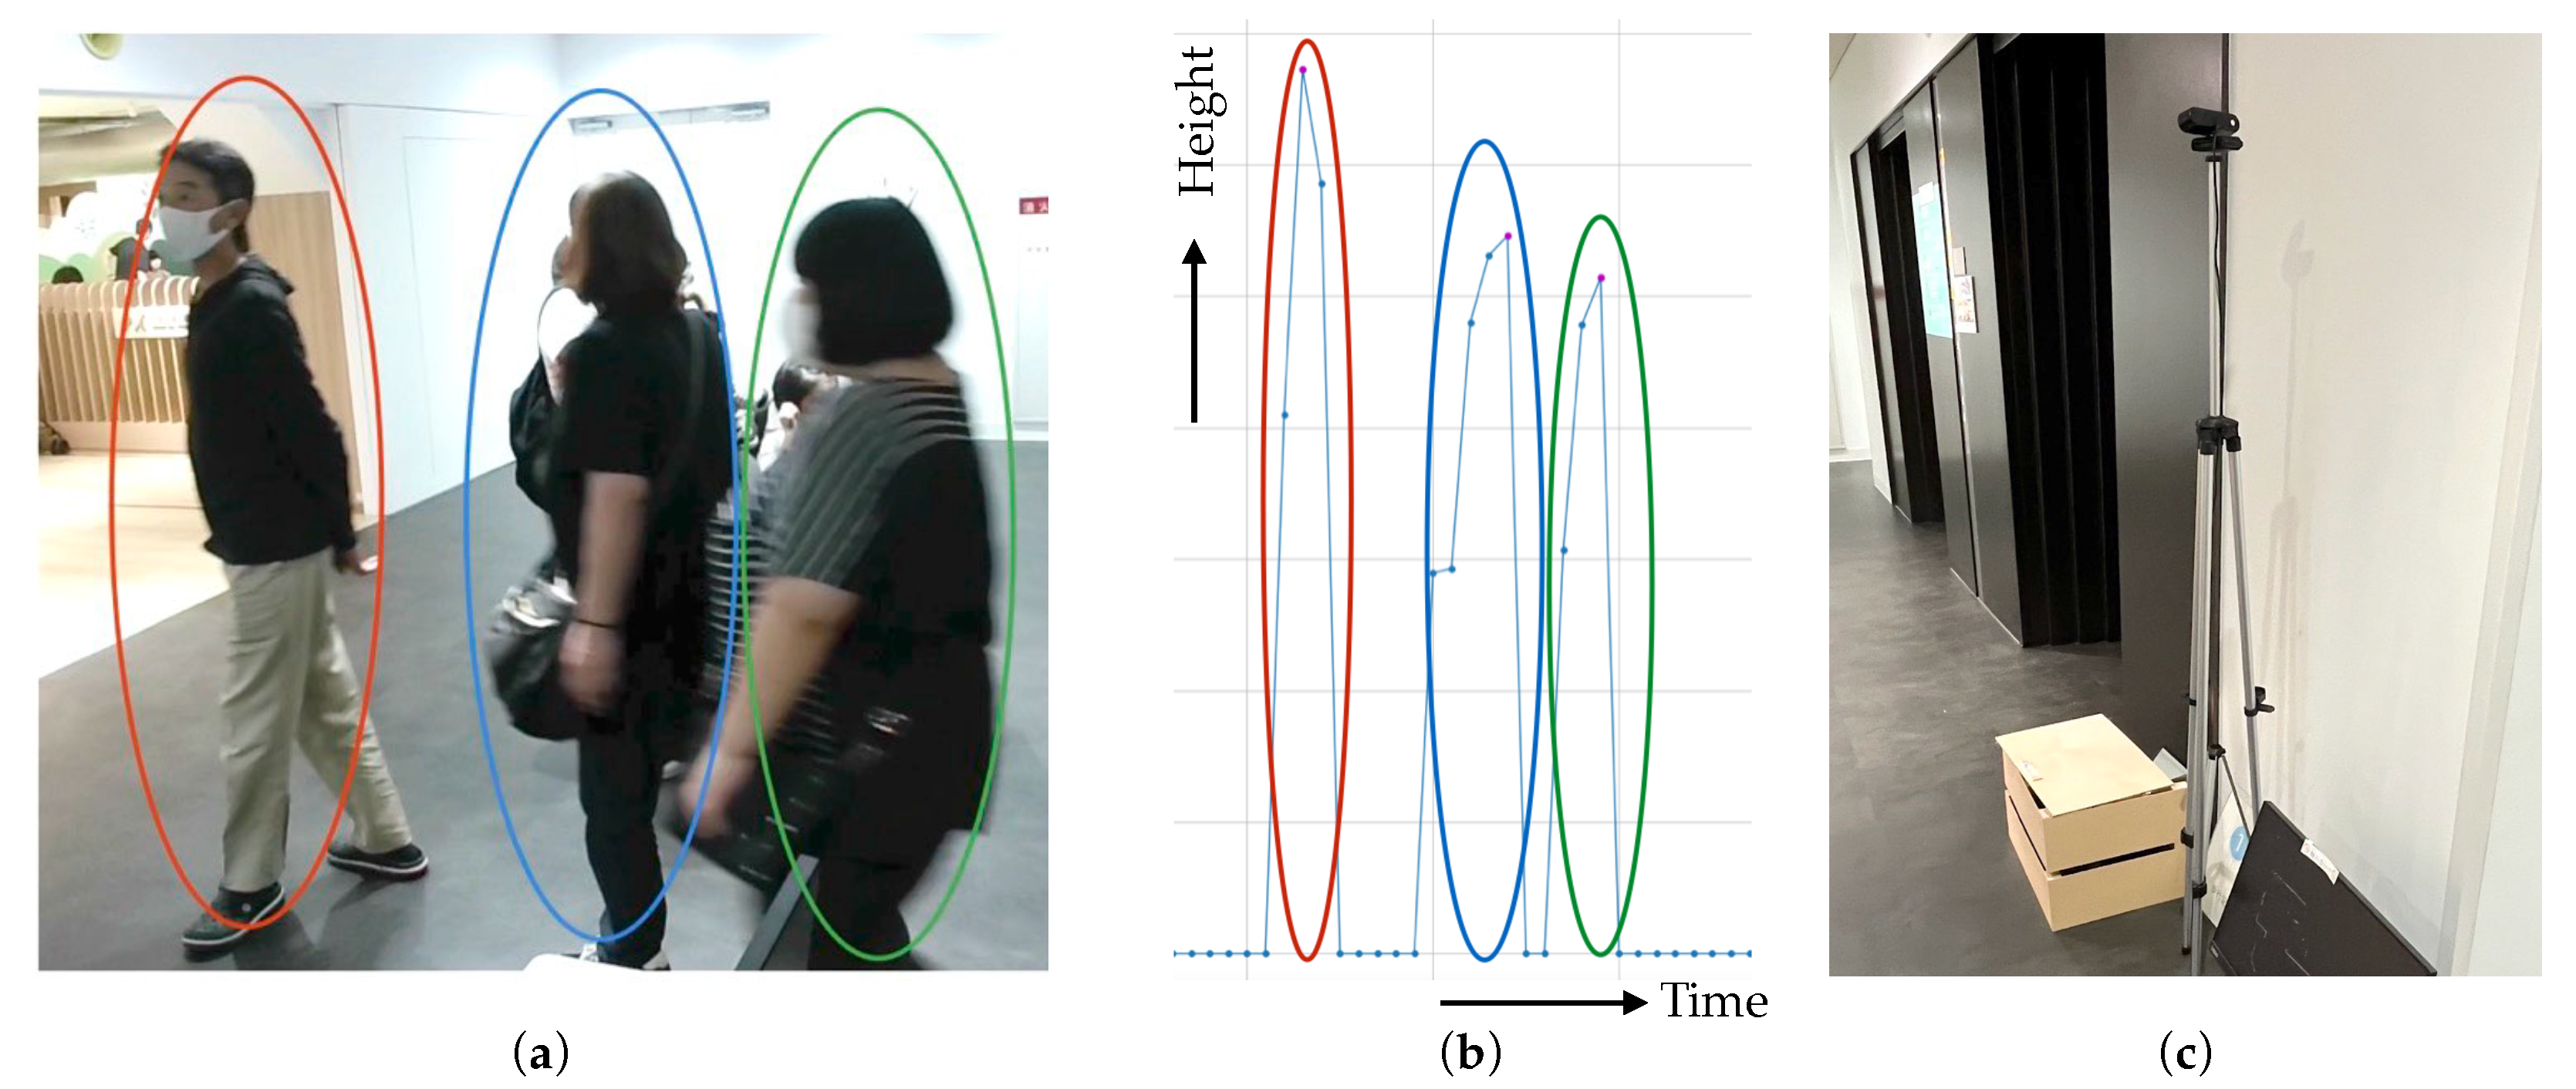
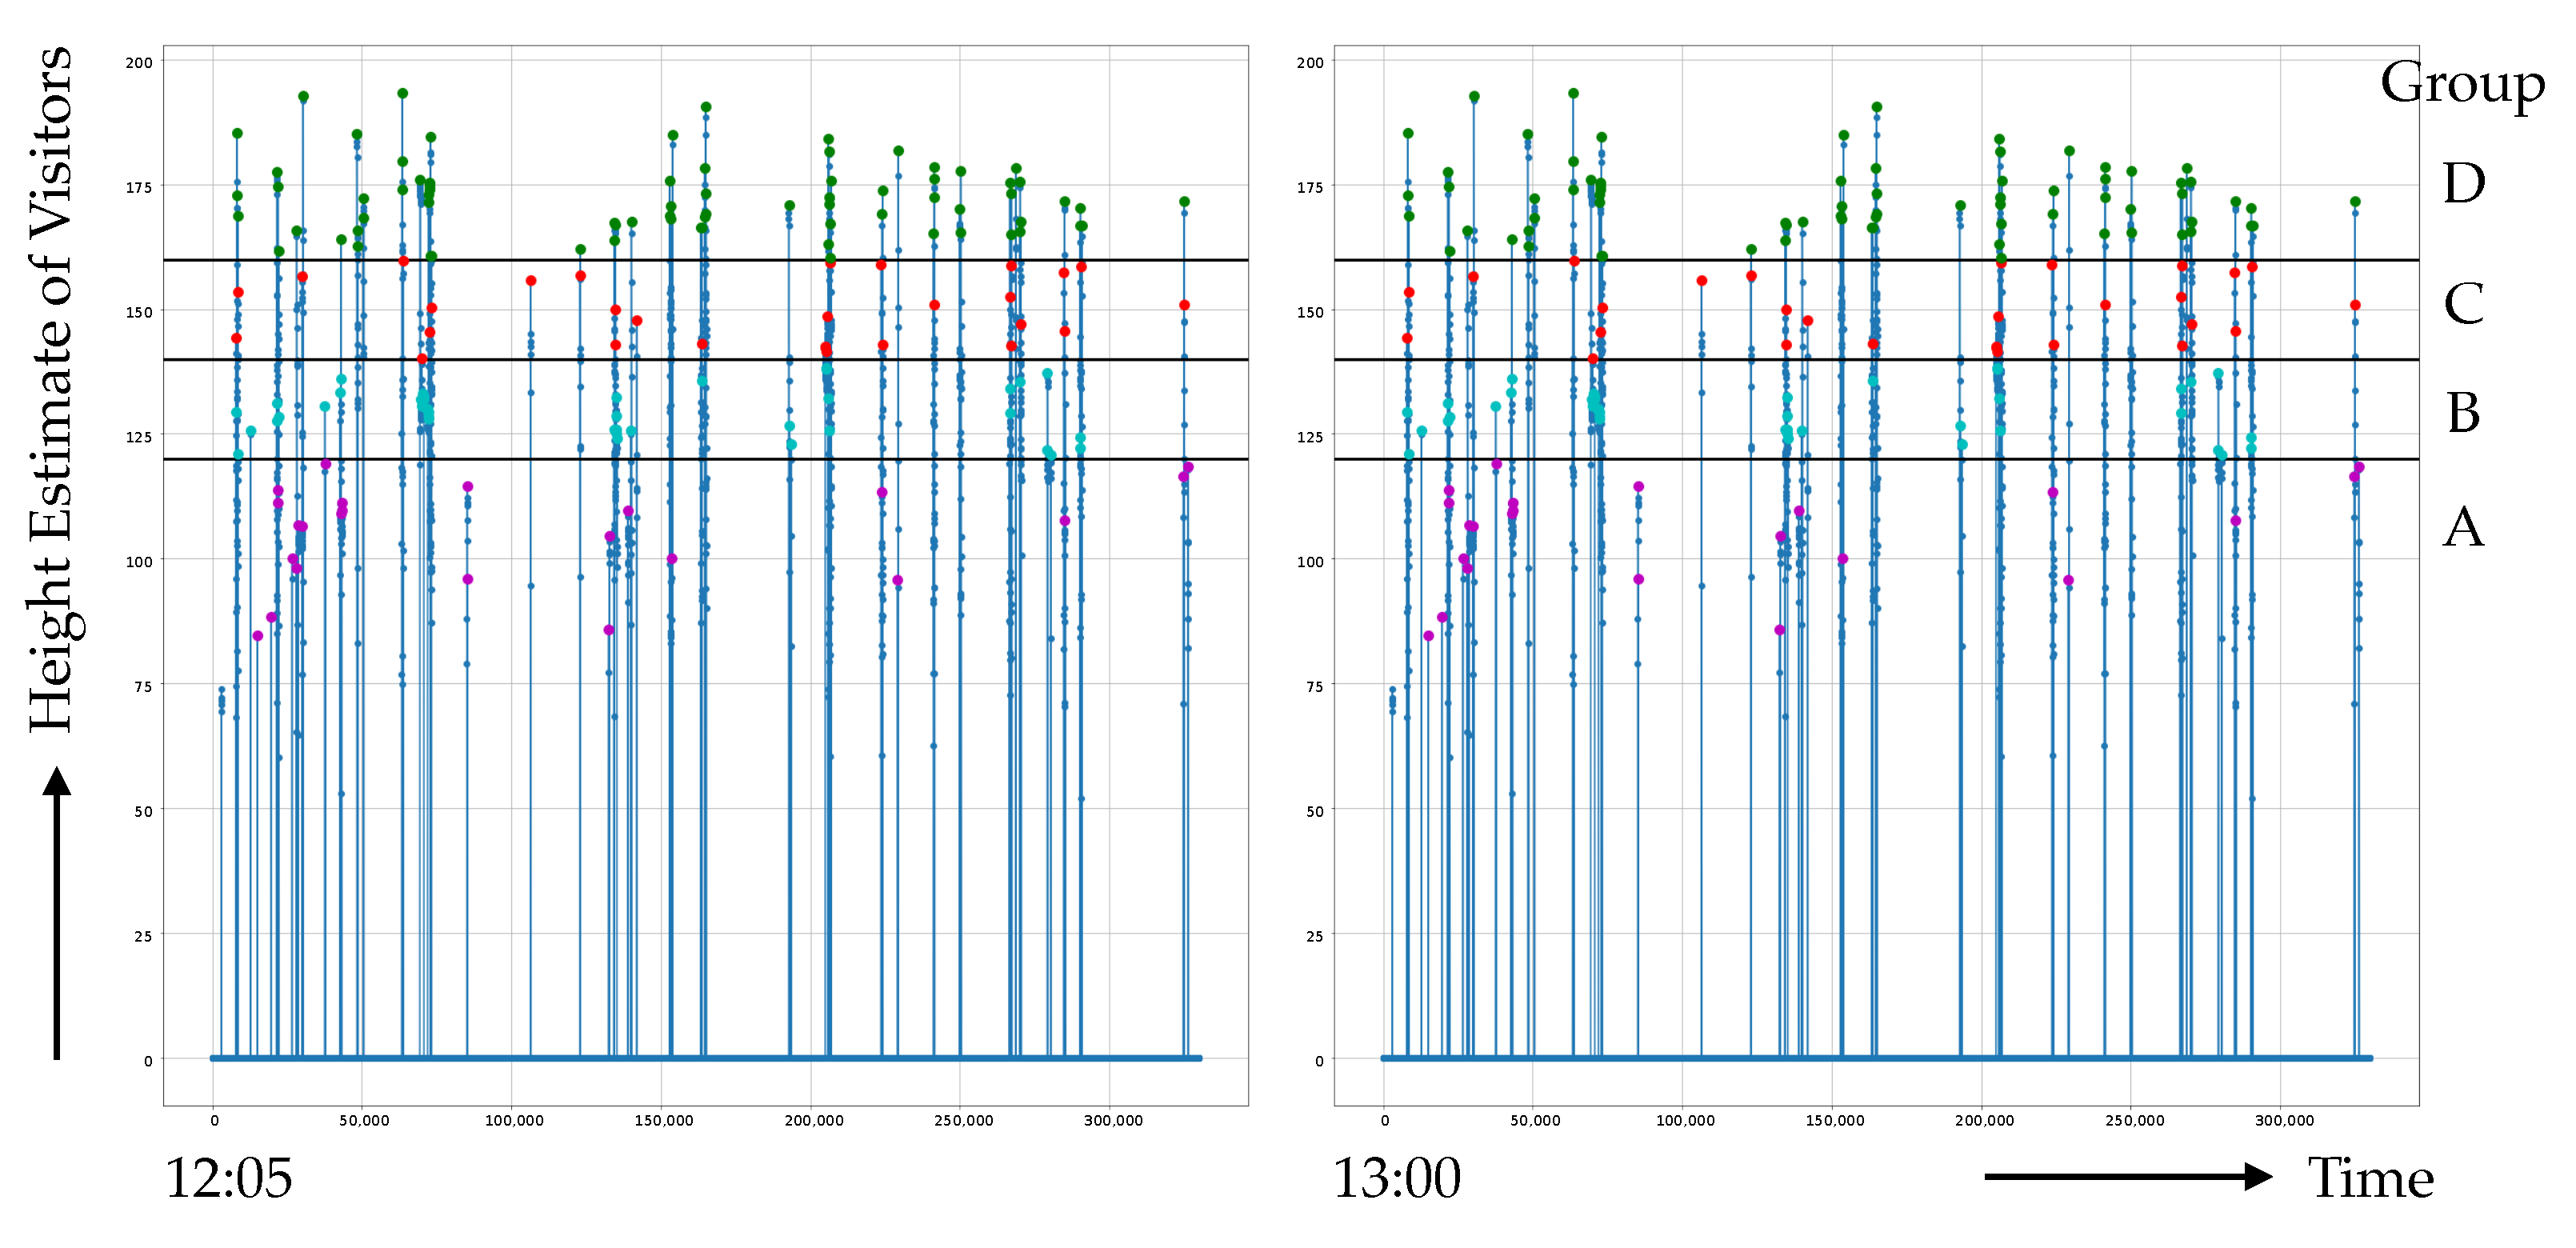
6.2. Vertical Measurement for Visitor Counting

A portion of the scanning plane of the LiDAR sensor is reflected vertically by the mirror in the box. This partial plane captures visitors passing from or into the elevators on the museum floor. The entrance to this elevator is almost one-person-wide, and visitors tend to pass through it individually. This allows the estimation of the number of visitors by counting the peaks of vertical measurements in the plane covering the elevator entrances. Visitors exiting one of the elevators shown in Figure 16a are captured with three peaks in the vertical measurement in Figure 16b, as the vertical plane covers the two elevator entrances in Figure 16c.
To roughly estimate the age groups of visitors, we divided the height of visitors into four categories in intervals of 20 cm: ≤119, 120–139, 140–159, and ≥ 160 cm. The LASER rays emitted by the LiDAR are well absorbed by black materials, such as human hair on the visitor’s head, which often leads to detecting the height of the shoulder, not the head.

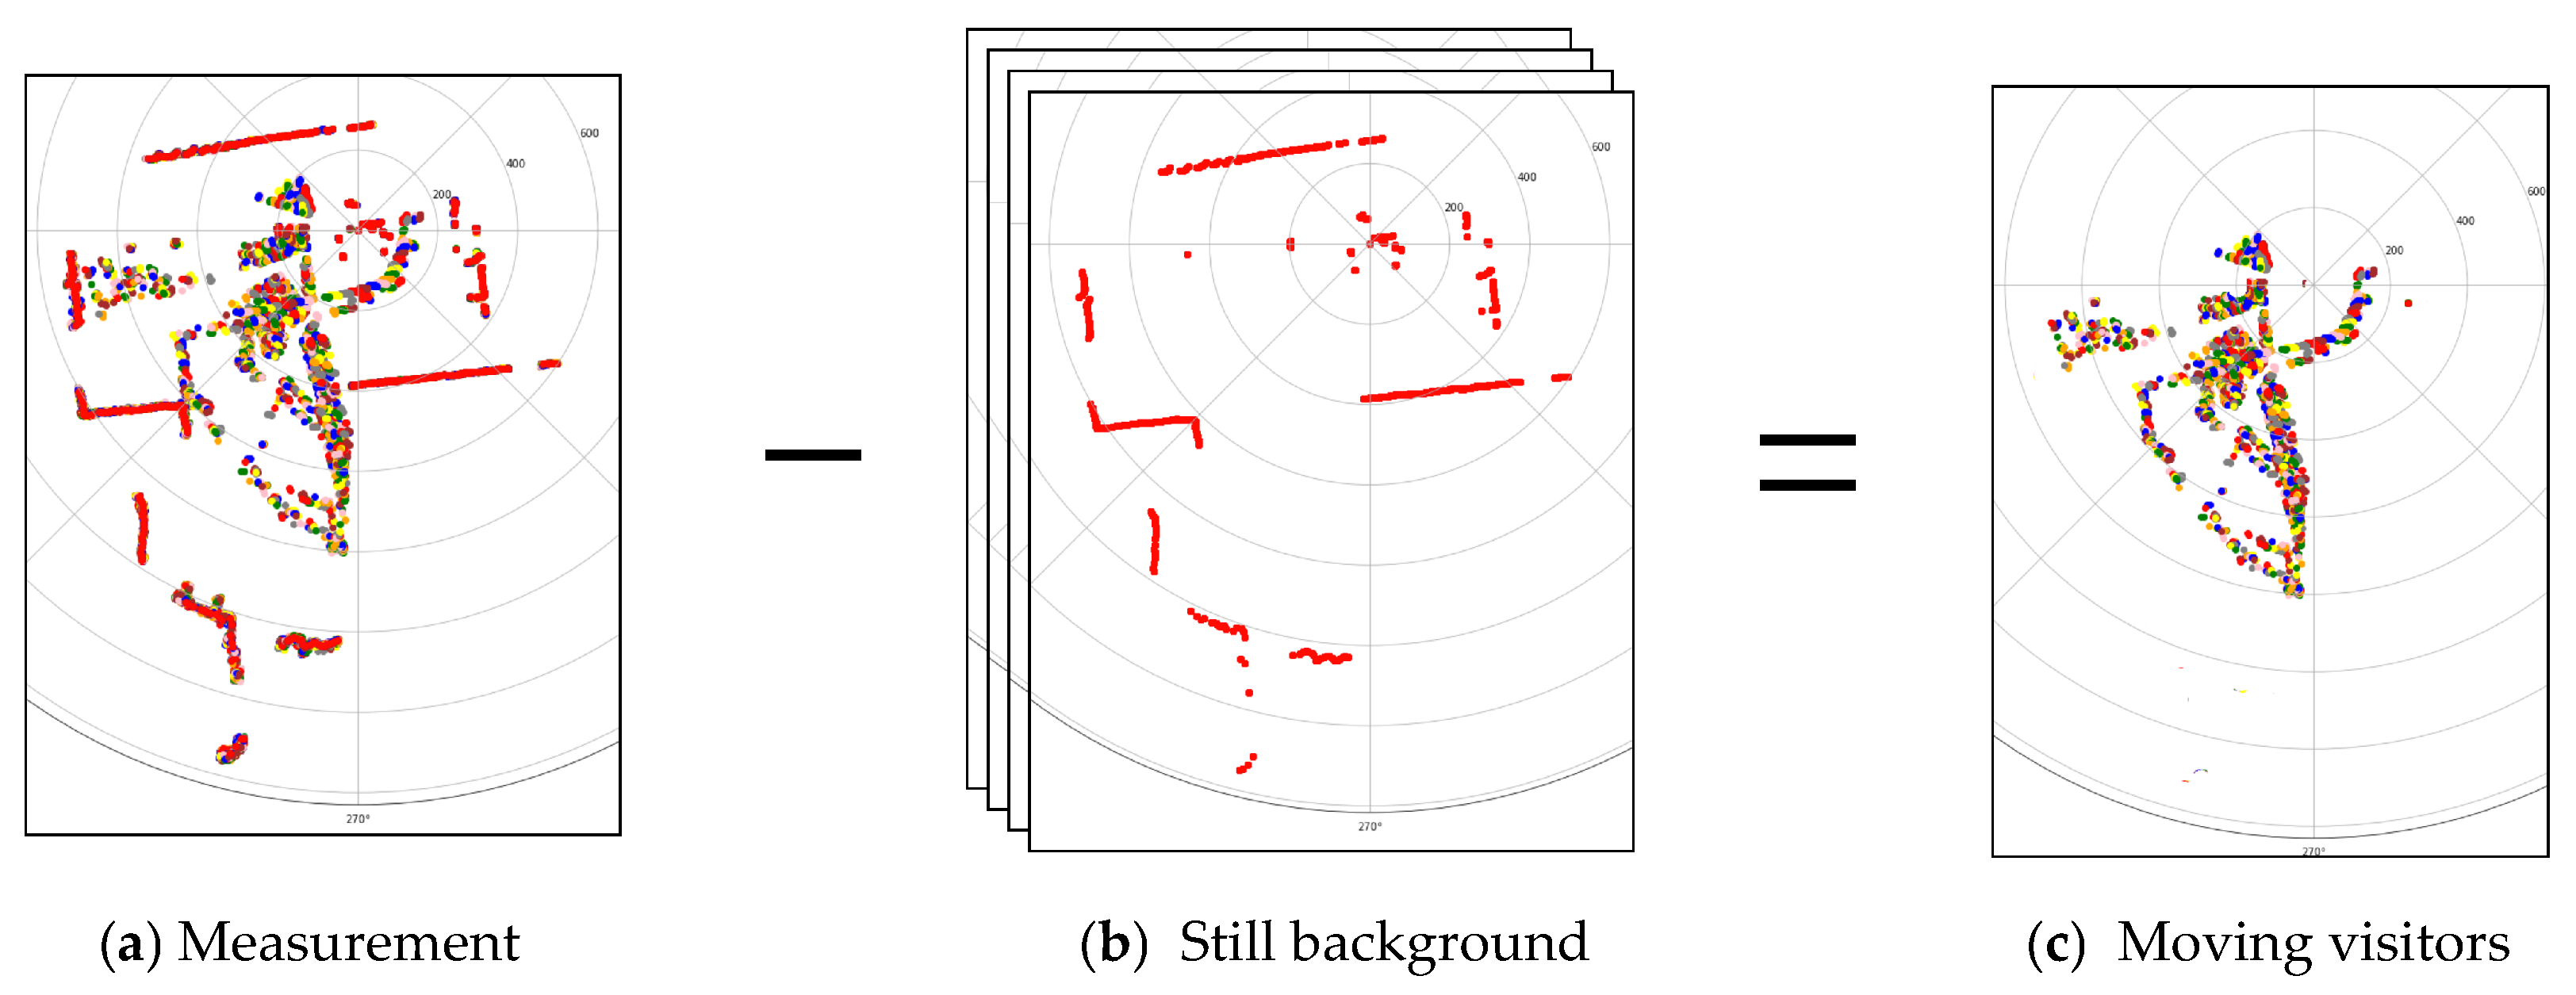
6.3. Horizontal Measurement for Visitor Tracking

The horizontal measurements included more non-visitor objects than vertical measurements. This is simply because there are many more objects on the museum floor than on a vertical plane, such as a wall with elevator entrances. The background subtraction method based on the average of the last three captured frames, which is shown in Figure 17, can efficiently suppress stationary objects on the floor, allowing for the detection of only moving visitors. We assumed that the points detected in a rectangle of side 30 cm form an object (human leg) and that all visitors have stride lengths of less than 80 cm. The number of detected rectangles and their distances from each other were used to estimate the number of visitors.
Forming a heat map is simple, and can be achieved using the accumulated points detected by the LiDAR sensor except for density measurement compensation. As shown in Figure 18a, the number of detections associated with identical objects can differ because the magnitude of the LiDAR measurement decreases with the distance from the sensor. The proposed visitor-counting technique, which uses the rectangles described above, does not suffer from this measurement density problem. An example heat map of the elevator lobby in the Hitachi Cover Science Museum is shown in Figure 18b.

6.4. Evaluation Experiments

Figure 19 shows the estimated number of visitors for approximately four hours from 12:05 to 16:00. This is based on the visitors crossing the vertical scanning plane to enter and exit the elevators. The system estimated the number of people to be 713, whereas the actual number was 735, a difference of 3.1%. The per-frame visitor estimate had an accuracy of 85.3% for these four hours.
The vertical scanning plane can also be used to estimate visitor age groups. The visitors are roughly divided into four groups, A, B, C, and D, according to their height instead of their actual age: shorter than 120 cm, between 120 and 139 cm, between 140 and 159 cm, and taller than 160 cm. The results of the visitor height estimates between 12:05 and 14:00 are shown in Figure 20. The four groups, A–D, are associated with the vertical axis from bottom to top. The accuracy rate of visitor estimates for these four height groups was roughly computed as 48.4, 78.4, 97.8, and 96.1% for groups A, B, C, and D, respectively. Note that the rates are remarkably lower for people shorter than 139 cm whereas the rates are very high for those taller than 140 cm.
Groups C and D correspond to the heights of people aged 12 years or older. The Hitachi Civic Science Museum currently does not hold any records for the age groups of its visitors, and this estimate would be of great help in improving the museum in the future. Although visitor heights were binned at 20 cm intervals, this value could be adjusted according to the actual distribution of visitor heights.
Another estimate, as shown in Figure 21, is based on the horizontal scanning plane to detect visitors staying or walking in front of the elevators. These values, which are calculated every 20 min, can be regarded as the average number of visitors around the elevator hall for these time frames. The estimates matched the true value of 84.0% of the time on a per second basis.
The visitor heat maps shown in Figure 22 were generated for every (a) 5 min and (b) 30 min. This lobby is one of the hottest spots on the first floor because visitors wait for elevators, which can only be accessed from and to the first floor of the museum building.

6.5. Discussion

In several cases, it was difficult to track the visitors. Two cases are shown in Figure 23. In the first case, a visitor stood still for minutes, causing the background subtraction method to recognize the visitor as part of the background. Although this behavior is natural for museum visitors, there is no simple solution except for the use of a two-dimensional low-cost LiDAR.
The second difficulty in detecting visitors is when people crouch down on the floor, which increases the estimated number of visitors because more rectangles are detected in the horizontal measurement plane. Such a person tends to remain still for several minutes, leading to the first problem.
In this study, to draw heat maps, visitors were tracked and counted using two-dimensional LiDAR images. However, a more effective method may be the direct estimation of visitor locations from the LiDAR sensor output, which consists of a series of one-dimensional values that do not need to be converted into a two-dimensional image. The key to improving the quality of visitor tracking in a museum is the use of more complex methods, such as deep neural network-based approaches.

7. Summary

7.1. Conclusions

This study focuses on LiDAR sensors, the prices of which have recently decreased, to propose applications for museums. Low-cost LiDAR sensors have multiple advantages, such as a significantly wide angle of measurement and non-private data collection. Our study included three case studies: (1) interactive floor projection, where a LiDAR is used to detect the location of visitors on the floor; (2) a versatile information kiosk with touchless interaction and a visitor tracking system based on a single LiDAR sensor; and (3) a visitor tracking box with horizontal and vertical sensing, also implemented with a single LiDAR sensor.
The interactive floor was designed to teach the phases of the Moon, whereby visitors pointed to the position of the Moon by standing on a certain point. Although this LiDAR application for interactive floor projections was rated highly in the user study, its potential can be further explored.
An information kiosk is the primary key to personalizing museum experiences through the use of a single low-cost LiDAR that allows the implementation of both touchless operations and visitor tracking. This was accomplished by simply reflecting a portion of the horizontal scanning plane vertically upward. User studies have shown that visitor evaluations are generally positive; however, the usability of a floor map displays requires further improvement. Visitor estimation, which is an additional feature of the proposed information kiosk, provides an exact estimate at a rate of 41.8%, with the rate increasing to 83.1% when the difference of the estimate from the true value is allowed to be less than or equal to one.
The third LiDAR application that was implemented and tested in this study was the visitor tracking box with two measurement planes: a vertical plane for counting visitors and judging their age groups, and a horizontal plane for tracking visitors to generate a heat map on the museum floor. The implementation was encased in a box of dimensions 45 × 30 × 30 cm and a slit width of 2 cm; this form factor can be further improved by shrinking the box. The experimental results have shown that the estimation accuracy was approximately 85%, and the height estimate was remarkably accurate for individuals taller than 140 cm.
The three applications in this study demonstrate the considerable potential of low-cost LiDAR sensors in providing three key factors for museums: personalization, interactivity, and review. These applications were all tested at the Hitachi Civic Science Museum to obtain visitor ratings and feedback, as well as visitor trajectories and counts.

7.2. Future Work

For enhanced information kiosks in museums, server-connected transactions are crucial for providing personalized and consistent interaction experiences over multiple terminals. The history of the same visitor using multiple kiosks allowed us to design a more personalized visitor experience. It is expected that loose personalization based on QR codes would work well at museums, especially with children and the elderly, who tend not to have their own smartphones. The use of a series of kiosk terminals can provide the museum with a learning path and history of these visitors and their pace, which can vary significantly with each visitor, whereupon visitors would be provided with their own visualized learning path at the museum, to help them recall their visit on a particular day for better guidance.
The sensing principle of a LiDAR device makes occlusions inevitable in the measurement results. However, a network of multiple LiDAR sensors implemented to count visitors and estimate trajectories at the museum can reveal the true potential of this device. The trajectory visualization of visitors, along with their learning path and history using information kiosks, is helpful not only for museum staff but also for the visitors themselves because such information would provide them with the opportunity to review their visit and experience at the museum.
In this study, the focus was on applications in science museums. Other types of museums, such as history, art, literature, industry, and themed museums would require their own applications and use cases. For example, a historical museum and cultural heritage museum with a number of static exhibits would benefit the most from the use of the proposed LiDAR-based techniques. Collaborating with a set of local museums is one of our plans for the near future.

Author Contributions

Conceptualization, N.U.; methodology, N.U., S.K., K.N., and S.N.; software, N.U., S.K., K.N., and S.N.; validation, N.U.; formal analysis, S.K., K.N., and S.N.; investigation, S.K., K.N., and S.N.; resources, N.U.; data curation, S.K., and S.N.; writing—original draft preparation, N.U.; writing—review and editing, N.U., S.K., K.N., and S.N.; visualization, N.U., S.K., K.N., and S.N.; supervision, N.U.; project administration, N.U. All authors have read and agreed to the published version of the manuscript.

Funding

This research received no external funding.

Data Availability Statement

The data presented in this study are available upon request from the corresponding author. The data are not publicly available due to privacy restrictions with images of museum visitors captured for the method validation.

Acknowledgments

The authors would like to thank the Hitachi Civic Science Museum for its assistance in our experiments.

Conflicts of Interest

The authors declare no conflict of interest.

Abbreviations

The following abbreviations are used in this manuscript:
FPSFrames per second
HMDHead-mounted display
IRInfrared
LiDARLight detection and ranging
RFIDRadio frequency identification
ToFTime of flight
UIUser interface
USBUniversal serial bus
VRVirtual Reality

References

  1. SICK. Using 2D Laser Scanners to Protect Larger Objects or Multiple Objects in a Museum. Available online: https://www.sick.com/ch/en/industries/building-safety-and-security/indoor-safety-and-security/object-surveillance/using-2d-laser-scanners-to-protect-larger-objects-or-multiple-objects-in-a-museum/c/p394352 (accessed on 18 July 2023).
  2. Rozsa, Z.; Sziranyi, T. Object Detection From a Few LIDAR Scanning Planes. IEEE Trans. Intell. Veh. 2019, 4, 548–560. [Google Scholar] [CrossRef] [Green Version]
  3. Yang, S.; Li, B.; Liu, M.; Lai, Y.K.; Kobbelt, L.; Hu, S.M. HeteroFusion: Dense Scene Reconstruction Integrating Multi-Sensors. IEEE Trans. Vis. Comput. Graph. 2020, 26, 3217–3230. [Google Scholar] [CrossRef] [PubMed] [Green Version]
  4. Chase, A.S.Z.; Chase, D.Z.; Chase, A.F. LiDAR for Archaeological Research and the Study of Historical Landscapes. In Sensing the Past 16; Masini, N., Soldovieri, F., Eds.; Springer International Publishing: Berlin/Heidelberg, Germany, 2017; pp. 89–100. [Google Scholar]
  5. Guyot, A.; Hubert-Moy, L.; Lorho, T. Detecting Neolithic Burial Mounds from LiDAR-Derived Elevation Data Using a Multi-Scale Approach and Machine Learning Techniques. Remote Sens. 2018, 10, 225. [Google Scholar] [CrossRef] [Green Version]
  6. Albrecht, C.M.; Fisher, C.; Freitag, M.; Hamann, H.F.; Pankanti, S.; Pezzutti, F.; Rossi, F. Learning and Recognizing Archeological Features from LiDAR Data. In Proceedings of the IEEE International Conference on Big Data (Big Data), Los Angeles, CA, USA, 9–12 December 2019; pp. 5630–5636. [Google Scholar]
  7. Apollonio, F.I.; Fantini, F.; Garagnani, S.; Gaiani, M. A Photogrammetry-Based Workflow for the Accurate 3D Construction and Visualization of Museums Assets. Remote Sens. 2021, 13, 486. [Google Scholar] [CrossRef]
  8. Neoge, S.; Mehendale, N. LiDAR-Based Touchscreen Wall. SSRN J. 2020. [Google Scholar] [CrossRef]
  9. Campos, P.; Dória, A.; Sousa, M. Interactivity for Museums: Designing and Comparing Sensor-Based Installations. In Human–Computer Interaction—INTERACT 2009, Proceedings of the 12th IFIP TC 13 International Conference, Uppsala, Sweden, 24–28 August 2009; Gross, T., Gulliksen, J., Kotzé, P., Oestreicher, L., Palanque, P., Prates, R.O., Winckler, M., Eds.; Springer: Berlin/Heidelberg, Germany, 2009; Volume 5726, pp. 612–615. [Google Scholar]
  10. Alexander, J.; Barton, J.; Goeser, C. Transforming the Art Museum Experience: Gallery One. In Proceedings of the Annual Cnference of Museums and the Web (MW), Portland, OR, USA, 17–20 April 2013. [Google Scholar]
  11. Zhang, J.; Shang, J.; Yan, H. The Application of Augmented Reality Technology in Museum Display Design. In Proceedings of the IEEE International Conference Intational Conference on High Performance Computing & Communications, on Data Science & Systems on Smart City on Dependability in Sensor, Cloud & Big Data Systems & Application (HPCC/DSS/SmartCity/DependSys), Haikou, China, 20–22 December 2021; pp. 2344–2348. [Google Scholar]
  12. Back, M.; Gold, R.; Balsamo, A.; Chow, M.; Gorbet, M.; Harrison, S.; MacDonald, D.; Minnerman, S. Designing innovative reading experiences for a museum exhibition. Computer 2001, 34, 80–87. [Google Scholar] [CrossRef]
  13. van Eck, W.; Kolstee, Y. The augmented painting: Playful interaction with multi-spectral images. In Proceedings of the IEEE International Symposium on Mixed and Augmented Reality—Arts, Media, and Humanities (ISMAR-AMH), Atlanta, GA, USA, 5–8 November 2012; pp. 65–69. [Google Scholar]
  14. Soga, A.; Shiba, M.; Suzuki, T. Computer-Aided Sugoroku Games in the Edo Period Using Interactive Techniques for Museum Exhibits. In Proceedings of the International Conference on Cyberworlds (CW), Singapore, 3–5 October 2018; pp. 132–137. [Google Scholar]
  15. Umezu, N.; Iijima, S. Tangible User Interface to Learn about Voronoi Diagrams. In Proceedings of the IEEE International Conference on Artificial Intelligence and Virtual Reality (AIVR), Virtual, 12–14 December 2022; pp. 221–224. [Google Scholar]
  16. Google Arts & Culture. Art Selfie. Available online: https://artsandculture.google.com/camera/selfie (accessed on 7 March 2023).
  17. Takahashi, I.; Oki, M.; Bourreau, B.; Kitahara, I.; Suzuki, K. FUTUREGYM: A gymnasium with interactive floor projection for children with special needs. Int. J. Child Comput. Interact. 2018, 15, 37–47. [Google Scholar] [CrossRef]
  18. Graf, R.; Benawri, P.; Whitesall, A.E.; Carichner, D.; Li, Z.; Nebeling, M.; Kim, H.S. iGYM: An Interactive Floor Projection System for Inclusive Exergame Environments. In Proceedings of the Annual Symposium on Computer-Human Interaction in Play, Barcelona, Spain, 22–25 October 2019; pp. 31–43. [Google Scholar]
  19. Barile, F.; Calandra, D.M.; Caso, A.; DAuria, D.; Di Mauro, D.; Cutugno, F.; Rossi, S. ICT Solutions for the Orchestra Project: From Personalized Selection to Enhanced Fruition of Cultural Heritage Data. In Proceedings of the International Conference on Signal-Image Technology and Internet-Based Systems, Marrakech, Morocco, 23–27 November 2014; pp. 501–507. [Google Scholar]
  20. Umezu, N.; Yuming, B. Floor Projection with QR code-based Interactions and Visitor Drawings. In Proceedings of the IEEE Global Conference on Consumer Electronics (GCCE), Osaka, Japan, 18–21 October 2022; pp. 318–320. [Google Scholar]
  21. van Delden, R.; Gerritsen, S.; Heylen, D.; Reidsma, D. Co-located augmented play-spaces: Past, present, and perspectives. J. Multimodal User Interfaces 2018, 12, 225–255. [Google Scholar] [CrossRef] [Green Version]
  22. Sarmiento, J.R.; Capio, A.F.; Sison, J.A.L.; Nabua, C.J.A.; Guadaña, R.R.H. Ask Billy: An Informative Kiosk in a University. In Proceedings of the International Conference in Information and Computing Research (iCORE), Manila, Philippines, 11–12 December 2021; pp. 72–77. [Google Scholar]
  23. Adhoni, D.Z.A.; Ambreen, S. Developing KIOSKs—Touch Based Interactive Information System. Int. J. Comput. Sci. Inf. Secur. IJCSIS 2017, 15, 166–177. [Google Scholar]
  24. Rehg, J.M.; Loughlin, M.; Waters, K. Vision for a smart kiosk. In Proceedings of the IEEE Computer Society Conference on Computer Vision and Pattern Recognition (CVPR), San Juan, Puerto Rico, 17–19 June 1997; pp. 690–696. [Google Scholar]
  25. Edwards, A.; Elmer, B.; Kim, B.S.; Smith, K. AR-enabled wayfinding kiosk. In Proceedings of the IEEE International Symposium on Mixed and Augmented Reality—Arts, Media, and Humanities, Seoul, Republic of Korea, 13–16 October 2010; pp. 65–66. [Google Scholar]
  26. Yassin, A.; Nasser, Y.; Awad, M.; Al-Dubai, A.; Liu, R.; Yuen, C.; Raulefs, R.; Aboutanios, E. Recent Advances in Indoor Localization: A Survey on Theoretical Approaches and Applications. IEEE Commun. Surv. Tutor. 2017, 19, 1327–1346. [Google Scholar] [CrossRef] [Green Version]
  27. Guo, D.; Zhu, Y.; Xu, W.; Ge, Y.; Shang, S.; Ding, Z. How to Find Appropriate Automobile Exhibition Halls: Towards a Personalized Recommendation Service for Auto Show. In Proceedings of the IEEE International Conference on Data Mining Workshop (ICDMW), Atlantic City, NJ, USA, 14–17 November 2015; pp. 1025–1030. [Google Scholar]
  28. Giuliano, R.; Mazzenga, F.; Petracca, M.; Vatalaro, F. Application of Radio Frequency Identification for Museum Environment. In Proceedings of the Workshops on Enabling Technologies: Infrastructure for Collaborative Enterprises, Hammamet, Tunisia, 17–20 June 2013; pp. 190–195. [Google Scholar]
  29. Huang, Y.P.; Wang, S.S.; Sandnes, F.E. RFID-Based Guide Gives Museum Visitors More Freedom. IT Prof. 2011, 13, 25–29. [Google Scholar] [CrossRef]
  30. D’Amico, G.; Del Bimbo, A.; Ferracani, A.; Landucci, L.; Pezzatini, D.; Santi, L. RFID-based Solutions for User Profiling in Interactive Exhibits. In Proceedings of the IEEE International Symposium on Multimedia, Dana Point, CA, USA, 5–7 December 2011; pp. 216–221. [Google Scholar]
  31. Fevgas, A.; Tsompanopoulou, P.; Tsiovoulos, A.; Drasidis, G.; Bozanis, P. Utilizing UHF RFIDs to Enhance Museum Visiting Experience. In Proceedings of the Panhellenic Conference on Informatics, Tripoli, Greece, 10–12 September 2010; p. 5600283. [Google Scholar]
  32. Guerrero-Higueras, Á.M.; Álvarez-Aparicio, C.; Calvo Olivera, M.C.; Rodríguez-Lera, F.J.; Fernández-Llamas, C.; Rico, F.M.; Matellán, V. Tracking People in a Mobile Robot From 2D LIDAR Scans Using Full Convolutional Neural Networks for Security in Cluttered Environments. Front. Neurorobotics 2018, 12, 85. [Google Scholar] [CrossRef] [Green Version]
  33. Hasan, M.; Hanawa, J.; Goto, R.; Fukuda, H.; Kuno, Y.; Kobayashi, Y. Tracking People Using Ankle-Level 2D LiDAR for Gait Analysis. In Advances in Artificial Intelligence, Software and Systems Engineering, Proceedings of the AHFE 2020 Virtual Conferences on Software and Systems Engineering, and Artificial Intelligence and Social Computing, Virtual, 16–20 July 2020; Ahram, T., Ed.; Springer International Publishing: Cham, Switzerland, 2021; Volume 1213, pp. 40–46. [Google Scholar]
  34. Jia, D.; Hermans, A.; Leibe, B. 2D vs. 3D LiDAR-based Person Detection on Mobile Robots. In Proceedings of the IEEE/RSJ International Conference on Intelligent Robots and Systems (IROS), Kyoto, Japan, 23–27 October 2022; pp. 3604–3611. [Google Scholar]
  35. Hitachi Civic Science Museum, Ibaraki, Japan. Available online: http://www.civic.jp/science/ (accessed on 20 January 2023).
  36. Shanghai Slamtec Co., Ltd. A1M8 Data Sheet. Available online: https://download-en.slamtec.com/api/download/rplidar-a1m8-datasheet/3.2?lang=en (accessed on 11 February 2023).
  37. Shanghai Slamtec Co., Ltd. Slamtec RPLIDAR Public SDK for C++. Available online: https://github.com/Slamtec/rplidar_sdk (accessed on 20 January 2023).
  38. openFrameworks. Available online: https://openframeworks.cc (accessed on 20 January 2023).
  39. NASA’s Scientific Visualization Studio. CGI Moon Kit. Available online: https://svs.gsfc.nasa.gov/4720 (accessed on 23 December 2022).
Figure 1. Three case studies using low-cost LiDAR sensors for enhancing visitor experience at a museum; (a) 2D LiDAR sensor for three applications; (b) Interactive floor; (c) Touchless kiosk; and (d) Visitor count and heat map.
Electronics 12 03351 g001
Figure 2. Low-cost LiDAR products and measurement example; (a) RPLIDAR A1M8 from Slamtec Co., Ltd., Shanghai, China, which was used in our study; (b) a similar product YDLIDAR X2 from Shenzhen EAI Technology Co., Ltd., Shenzhen, China; and (c) measurement example (white dots) with A1M8 (red dot) placed in a small room.
Electronics 12 03351 g002
Figure 3. The Hitachi Civic Science Museum [35].
Electronics 12 03351 g003
Figure 4. More than 60 exhibits on display at the Hitachi Civic Science Museum.
Electronics 12 03351 g004
Figure 5. Phases of the Moon interactively projected on the floor: (a) system outline; (b) tent to cover the screen from lighting; (c) phase of the Moon displayed on the subscreen; and (d) the center of detected feet as the location of the user to control the Moon.
Electronics 12 03351 g005
Figure 6. Visitors experimenting with the application to act as the Moon to control its phases at the Hitachi Civic Science Museum.
Electronics 12 03351 g006
Figure 7. Ratings received from 32 visitors on the Moon phases application in terms of the ease of understanding, interest, and comparison to textbooks on a scale of 1–5 (where a higher score indicates a better rating).
Electronics 12 03351 g007
Figure 8. Information kiosk outline: (a) information kiosk implementation for the museum—angle mirror reflects part of the vertical scanning plane (blue) from the LiDAR onto the vertical plane (red) to sense hand movements in front of the screen; and (b) the processing flow starts by scanning the QR code on a card.
Electronics 12 03351 g008
Figure 9. Hand detection to interact with the proposed kiosk. The dashed area corresponds to the detection area: (a) the detection area is approximately 10 cm above the screen with the hand selection fixed at 1.5 s, as represented by the expanding colored region (the elapsed time indicator in green); (b) objects detected by LiDAR measurement—we limit the detection to the area above the screen in the dotted rectangle and find the only object in the red circle, which is assumed to be the user’s hand; and (c) examples of detected location of the user’s hand.
Electronics 12 03351 g009
Figure 10. (a) Visitors in front of the kiosk with four-choice quizzes; (b) example of a four-choice quiz displayed on the kiosk screen, asking a similar case with the reproduction of a lizard tail. A: octopus leg, B: butterfly wing, C: snake tail, and D: beetle horn. The four arrows at the bottom indicate the hand positions for selections; (c) detected legs (green dots) of visitors crossing the kiosk area. The LiDAR device is located at the red dot.
Electronics 12 03351 g010
Figure 11. Ratings received from 21 visitors on the information kiosk on a scale of 1–5 regarding the usability of the quiz and floor map modes. While most of the ratings are positive, the usability of the floor map display has the lowest rating.
Electronics 12 03351 g011
Figure 12. Estimated number of visitors based on LiDAR measurement. The estimate is in blue and the true value is in orange. The durations of interactions between visitors and the information kiosk are represented by bright red rectangles. Regions surrounded by gray dotted ovals show larger differences between the estimated and true visitor counts.
Electronics 12 03351 g012
Figure 13. Scatter plots of the true and estimated number of visitors with the line y = x (red) separating periods with and without kiosk interactions. The plot for no interaction periods (right) shows a narrower spread than that for periods with interactions (middle). The plot for the whole period (left) has the mixed distribution.
Electronics 12 03351 g013
Figure 14. The visitor tracking system in a box: (a) The LiDAR device with a mirror and its vertical and horizontal detection planes; (b) the interior of the box containing a single LiDAR sensor, mirror, and PC; and (c) visitors entering the elevator.
Electronics 12 03351 g014
Figure 15. Proposed algorithm for tracking visitors and estimating their number. Number and age group estimation on the left is based on the vertical measurement; visitor tracking on the right is based on the horizontal measurement. The elevator lobby is 10.0 × 4.0 (m) in front of the 4.6 (m) wide entrance.
Electronics 12 03351 g015
Figure 16. Visitor measurement: (a) three visitors walking out of the elevator; (b) each of the peaks (red, blue, and green) in the vertical measurement corresponds to a single visitor in the same color; (c) two entrances of elevators are covered by the vertical scanning plane reflected by the mirror.
Electronics 12 03351 g016
Figure 17. Background subtraction using LiDAR measurement to only detect moving visitors. The average of the last three frames is used as the background frame. Different color dots are captured by the LiDAR sensor at a different frame.
Electronics 12 03351 g017
Figure 18. Heat map generation: (a) density of LiDAR measurements decreases with distance from sensor, even for identical objects; (b) generated heat map of visitor trajectories in the elevator lobby of the Hitachi Cover Science Museum. The main hall is located to the left of the map.
Electronics 12 03351 g018
Figure 19. Estimated visitors based on the vertical measurement plane reflected by the mirror. The estimation accuracy is 85.3% for the total number of visitors passing through the vertical scanning plane at the elevator entrance.
Electronics 12 03351 g019
Figure 20. Estimated height of visitors between 12:05 and 14:00 at the elevator entrance. Visitors are divided into four groups with purple, cyan, red, and green dots, namely A, B, C, and D at 20 cm intervals, for height estimation.
Electronics 12 03351 g020
Figure 21. Average number of estimated visitors at the elevator lobby for every 20 min. This is based on the horizontal scanning plane and shows an accuracy of 84.0% on a per second basis.
Electronics 12 03351 g021
Figure 22. Heat map examples: (a) heat map of visitors in the elevator lobby for five minutes. Visitors waiting at the doors for elevators to arrive are represented by red regions; (b) a heat map at the same location generated for 30 min including the time interval in (a). The LiDAR box is represented by the red symbol and red boxes are the elevators.
Electronics 12 03351 g022
Figure 23. Estimation difficulties.Due to magnifying images taken with an ordinary USB camera for the validation of the proposed method, these figures are at a low resolution. (a) A person who stands still for minutes blends into the background. (b) A person who crouches down on the floor causes an increase in the number of visitors.
Electronics 12 03351 g023
Table 1. List of sensor types used for human–machine interaction and their comparison. Two-dimensional LiDAR sensor provides touchless operation, a wider scanning angle, non-privacy-offensive measurement with a mid-range cost at around USD 100.
2D LiDARCamera (RGB)RGBD Camera (Depth Sensor)Button, Touch SensorIR SensorMicrophone
Privacy-preserving
Touchless operation
Sensing speed
Rich information
Illumination robustness✓(IR) ✓(IR)
Wide measurement angle
Multiple-user distinctive
Typical cost (USD) < $ 100 < $ 30 > $ 300 < $ 5 < $ 5 < $ 30
Table 2. Specifications of PRLiDAR A1M8 sensor from Slamtec.
ItemSpecification
Size97 × 70 × 60 (mm)
Weight170 (g)
Distance range (radius)0.15–6 (m)
Distance resolution0.5 (mm) or 1% of the distance
Angular range0–360 (degree)
Sample frequency2000 (Hz)
Scan rate5.5 (1–10) (Hz)
Scan rotationclockwise (seen from the top)
IR Laser wavelength785 (nm)
IR Laser power3 (mW)
InterfaceUSB-C (USB 1.0)
Table 3. Accuracy rates R Δ = 0 , R | Δ | 1 of the estimated visitors. Δ denotes the difference between the estimated and true numbers of visitors.
Mode R Δ = 0 (%) R | Δ | 1  (%) | Δ | max | Δ | ave
With kiosk Interactions (2:03:50)32.665.96.621.49
Without kiosk interactions (3:07:57)48.793.94.780.51
Whole experimental period (5:11:47)41.883.16.630.87
Disclaimer/Publisher’s Note: The statements, opinions and data contained in all publications are solely those of the individual author(s) and contributor(s) and not of MDPI and/or the editor(s). MDPI and/or the editor(s) disclaim responsibility for any injury to people or property resulting from any ideas, methods, instructions or products referred to in the content.

