1. Introduction and Literature Review
Intelligent transportation systems (ITSs) are advanced solutions for providing traffic safety and sustainability, including infrastructure, vehicles, users, traffic and mobility management, as well as interfaces with other modes of transport [
1]. The key enablers of ITSs are V2X communications, which include vehicle-to-vehicle (V2V), vehicle-to-network (V2N) or vehicle-to-infrastructure (V2I), vehicle-to-roadside units (V2R) and vehicle-to-pedestrian (V2P) communications [
2]. ITSs were introduced in 1999 by the US Federal Communication Commission, and they resulted in great research work in the USA [
3] and Europe [
4], which resulted in the first standards for V2X in the USA [
5] and in Europe [
6], respectively. Briefly, 3GPP Release 12 [
7] was the first standard that introduced V2X communication services, enabling direct communication and data exchange between vehicles. This standard was the base for the 4G LTE V2X standard under Releases 14 [
8] and 15 [
9], while 3GPP Release 16 was the first to include sidelink communications based on the 5G NR–air interface [
10].
The success of 5G NR [
11] led to 5G NR V2X, which was not only designed to complement LTE V2X on sidelink communications, but it also mainly targets four advanced use cases groups, namely, vehicle platooning, advanced driving, sensors and remote driving [
12]. In [
13], 3GPP specified the payload, data rate, maximum end-to-end latency, reliability and required communication range as the key requirements for the above 3GPP use case groups and defined the range of acceptable values for them. These key requirements and their typical values are the QoS requirements of a V2X system depending on the service it implements and are the most important quality and efficiency measures for a 5G NR V2X communication system. Briefly, 5GAA combines and extends the 3GPP requirements, and, apart from the 3GPP requirements, it introduces vehicle velocity and vehicle density as important QoS requirements [
14].
On the other hand, channel coding is a crucial and vital process in a communication system since it is the key process of reliable communication. Turbo codes were introduced in 1993 [
15,
16], and they were the first class in coding/decoding techniques to achieve near Shannon performance [
17]. This class consists of two coding/decoding algorithms, namely, the MAP algorithm (BCJR) [
18], and the soft-output Viterbi algorithm (SOVA) [
19]. Being complex, it was difficult to implement BCJR in real systems, so the less complex Max-Log-MAP (maxlogBCJR) implementation [
20,
21] as well as the Log-MAP (logBCJR) implementation of the algorithm [
22] were proposed, although they were suboptimal. Turbo codes had outstanding error-correcting behavior, so they became part of 4G-LTE [
23,
24]. The drawbacks of turbo coding were latency and complexity in large frame sizes [
25], and as a result, LDPC [
26,
27,
28] was introduced as a simpler [
29] coding scheme for 5G NR [
30]. The latest coding scheme is polar [
31], which is a low-complexity capacity-achieving coding scheme, and due to its superior performance, it became part of the 3GPP 5G NR [
32].
In [
33], the authors proved that turbo codes can be used as an efficient coding solution for short-frame 5G V2V and V2I services and flat Rayleigh fading channels. In [
34,
35], the authors studied the effect of turbo codes on QoS and BER performance in a 3GPP 5G NR V2X geometry-based propagation environment, where small data frames are transmitted. In [
36], the authors studied the behavior of turbo codes under low latency and high-performance use cases, while in [
37], the authors performed extensive research on the BER and FER performance of turbo, LDPC and polar codes, introducing a stochastic V2X communication model, based on the 3GPP 5G V2X specifications, and they concluded that turbo schemes are more suitable for small-frame 5G V2X services in terms of BER and FER performance. In [
38], the authors presented a QoS-aware decentralized resource allocation for V2X communication based on a deep reinforcement learning framework and proposed a scheme to maximize the throughput of all V2I links while meeting the latency constraints of V2V links associated with the respective priority. Trivisonno et al. [
39] investigated QoS in order to improve the service availability and stability for safety-critical applications, specifically targeting safety-critical V2X services. Del Puerto-Flores et al. [
40] used turbo coding in V2V doubly-dispersive channels and studied the impact of delay spread and Doppler spread, i.e., vehicle speed, on the V2V system as well as the gain in terms of BER performance by using turbo coding on the V2V communication system. In [
41], the authors analyzed the link reliability and they observed that larger-sized resources are preferred when the vehicle density decreases, the message size increases or the communication range decreases. In [
42], the authors built and simulated a system in several V2V channel environments, using FER and throughput as the performance measures. In [
43], the authors measured the performance of a V2V communication system that consists of high-density truck platooning in terms of latency and reliability. Anwar et al. [
44] investigated BER, FER and throughput as performance and QoS features under several waveform candidates and coding schemes for various ultra-reliable and low-latency V2X use cases. Dey et al. [
45] proposed an LDPC-based model that improves reliability by reducing the BER compared to the existing physical layer framework, and in [
46], the authors examined the effect of LDPC and multiple input multiple output (MIMO) in a V2X system model, supported by dedicated short-range communication. In [
47], the authors emphasized the BER evaluation and analysis of turbo and polar codes over AWGN channels. Belhadj et al. [
48] analyzed the influence that turbo, polar and LDPC codes have on 5G massive-machine-type communications over AWGN channels by examining the BER performance. In [
49], the authors compared polar and LDPC for the AWGN channel.
Based on the discussion above, a lot of work has been conducted investigating individual QoS parameters in V2X communication systems as well as analyzing the performance of 4G and 5G coding schemes, but no one, to our knowledge, has addressed the impact of all 4G and 5G coding schemes on the overall QoS requirements as defined in [
13,
14]. Therefore, in this work, we examine and compare the FER performance of turbo codes, LDPC and polar codes for 128-bit frames in 3GPP 5G V2X Release 16 scenarios and analyze the 3GPP and 5GAA QoS parameters for each scenario. Our goal is to draw conclusions about the overall QoS behavior of coding schemes in each possible V2X communication scenario and evaluate each coding scheme for its QoS efficiency. The main contributions of this paper are:
We examined 3GPP 5G V2X Release 16 system model simulation scenarios for both turbo-based and 5G-NR coding schemes and 128-bit frames, as a representative for small-frame V2X communications. In our simulation scenarios, different traffic propagation models and channel states are considered, targeting a comprehensive FER analysis for all the coding schemes.
QoS simulations scenarios are also examined, where reliability, power, vehicle velocity, maximum range, throughput, end-to-end latency, vehicle density and number of vehicles, as well as the impact of channel state change and traffic model change, are considered and optimized for each coding scheme and system simulation scenario.
Finally, a simulation-based selection of the most effective QoS coding scheme was conducted for small-frame 5G V2X propagation environments among all the 4G and 5G coding candidates, which is the main objective of this article. Such an analysis is missing in the current literature as can be seen in
Section 5.13. The next step of this study is to utilize the resulting knowledge and to draw conclusions, which will be used to create a coding/decoding scheme based on machine learning (ML), where the ML coding scheme will learn using data from the optimal coding/decoding. This scheme will consider both the FER performance and QoS parameters for every possible SNR value in order to achieve optimal overall performance in dynamic 5G V2X communication environments.
3. Fifth-Generation V2X System Simulation Parameters and Scenarios
In our simulation scenarios, we implemented the BCJR, logBCJR, maxlogBCJR, SOVA, polar and LDPC coding schemes. Turbo-based algorithms were implemented using four iterations according to [
33,
37]. Polar coding and decoding were implemented according to [
32,
50], and LDPC was implemented based on the offset min-sum algorithm using 12 iterations [
37], where the base matrices are provided by the 5G NR standard specification TS 38.212 [
32].
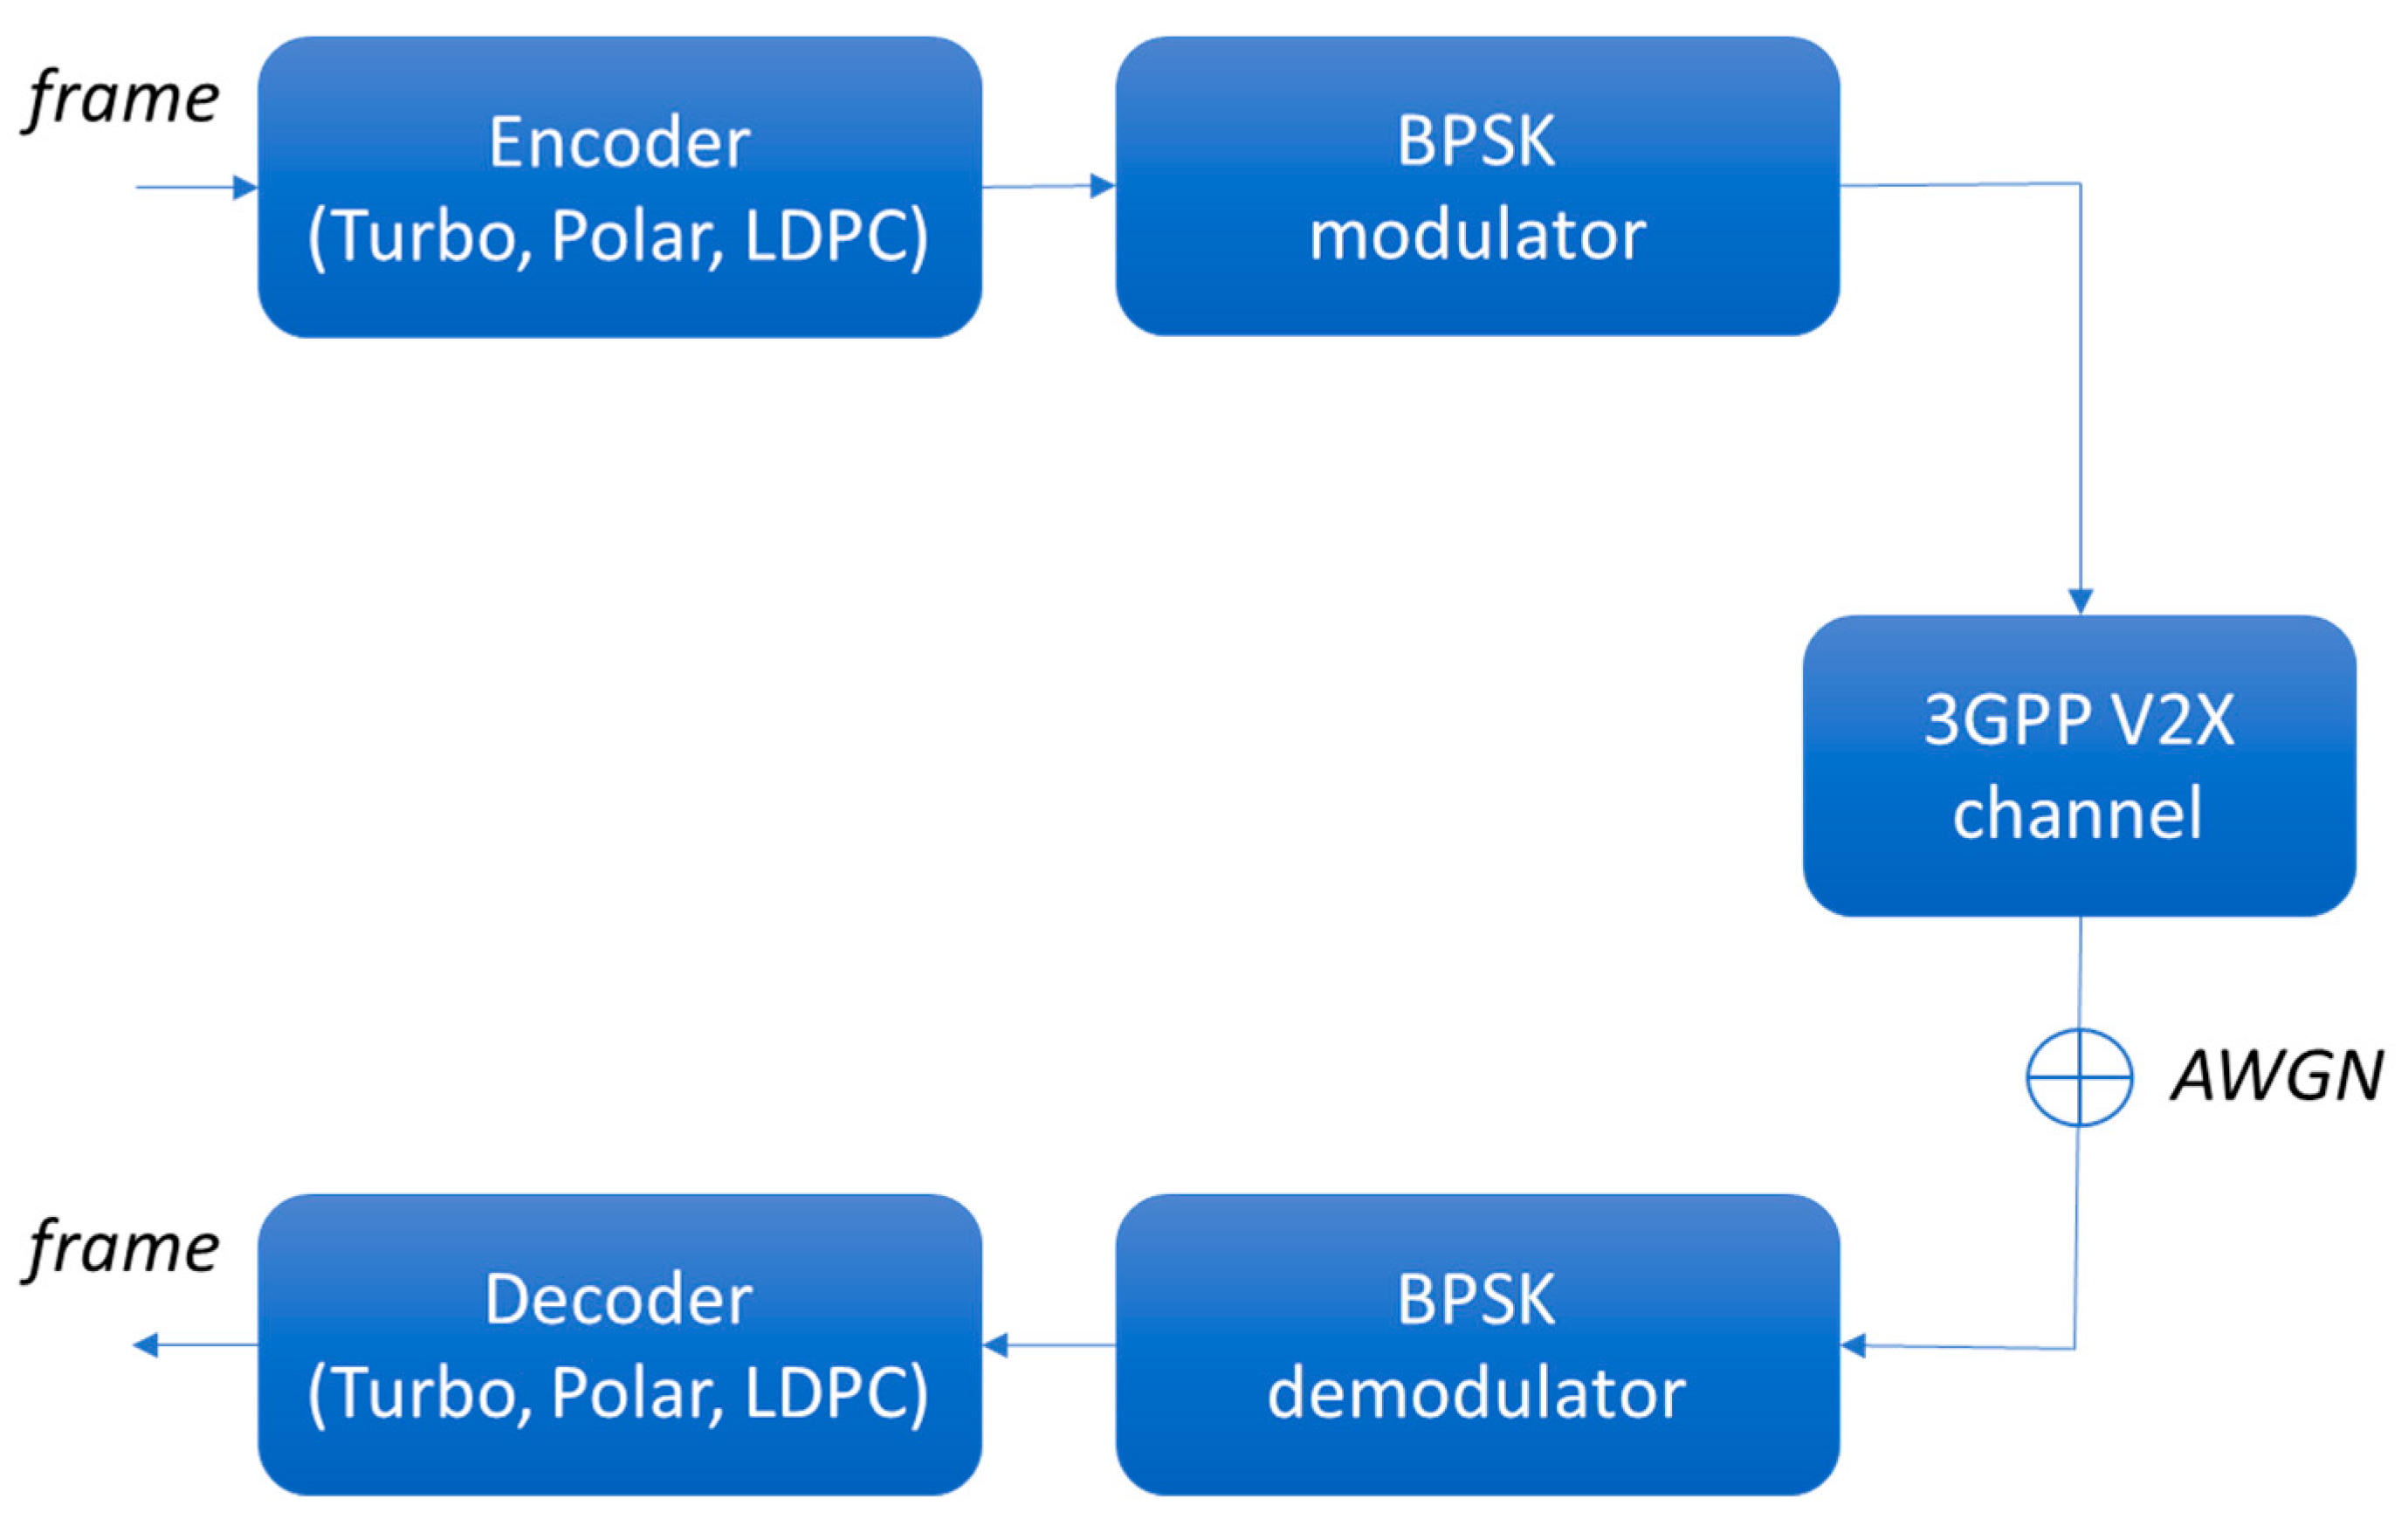
The coding rate was equal to one-third. Additionally, binary phase-shift keying (BPSK) modulation and demodulation were used at the transmitter and the receiver, respectively, as illustrated in
Figure 1. The carrier frequency was set to 5.9 GHz, similarly to [
34,
37]. We also assumed that the vehicles were moving at 50 km/h in urban fabric and at 100 km/h on highways. Furthermore, additive white Gaussian noise (AWGN) was added to the signal.
In our simulations, we assumed 128-bit frames as representatives for 128-, 256- and 512-bit frames since similar quality results are extracted in all three different data-frame sizes [
37]. Furthermore, we implemented five different simulation scenarios, which are summarized in
Table 1, and we transmitted 100,000 data frames for each scenario.
MATLAB was used for the implementation of the coding/decoding schemes and for the implementation of the 3GPP V2X channel in each simulation scenario of
Table 1. The details of the large-scale and small-scale parameters for each system simulation scenario were derived from [
8,
9] and are fully analyzed in [
37].
5. Simulation Results
Our main objective is to determine the behavior of the V2X system model in different channels and QoS scenarios and evaluate the effect that different coding schemes have on FER performance. Additionally, we examine important QoS parameters and their effectiveness for each QoS scenario in
Table 2 according to [
13,
14], which will be also used for the overall QoS evaluation of the coding schemes. More specifically, we analyze the FER performance for all the coding schemes and system simulation scenarios and analyze the impact of vehicle speed, channel state and traffic model on the system simulation model. Additionally, we study the minimum required SNR, transmitted power, maximum range, and throughput that achieve the minimum reliability requirements for each QoS scenario. Furthermore, we examine the end-to-end latency, the maximum number of vehicles and the vehicle density for each QoS scenario, and, finally, we present an overall QoS evaluation of each coding scheme, based on the aforementioned research results.
5.1. FER Simulation Results for 128-Bit Frame Length
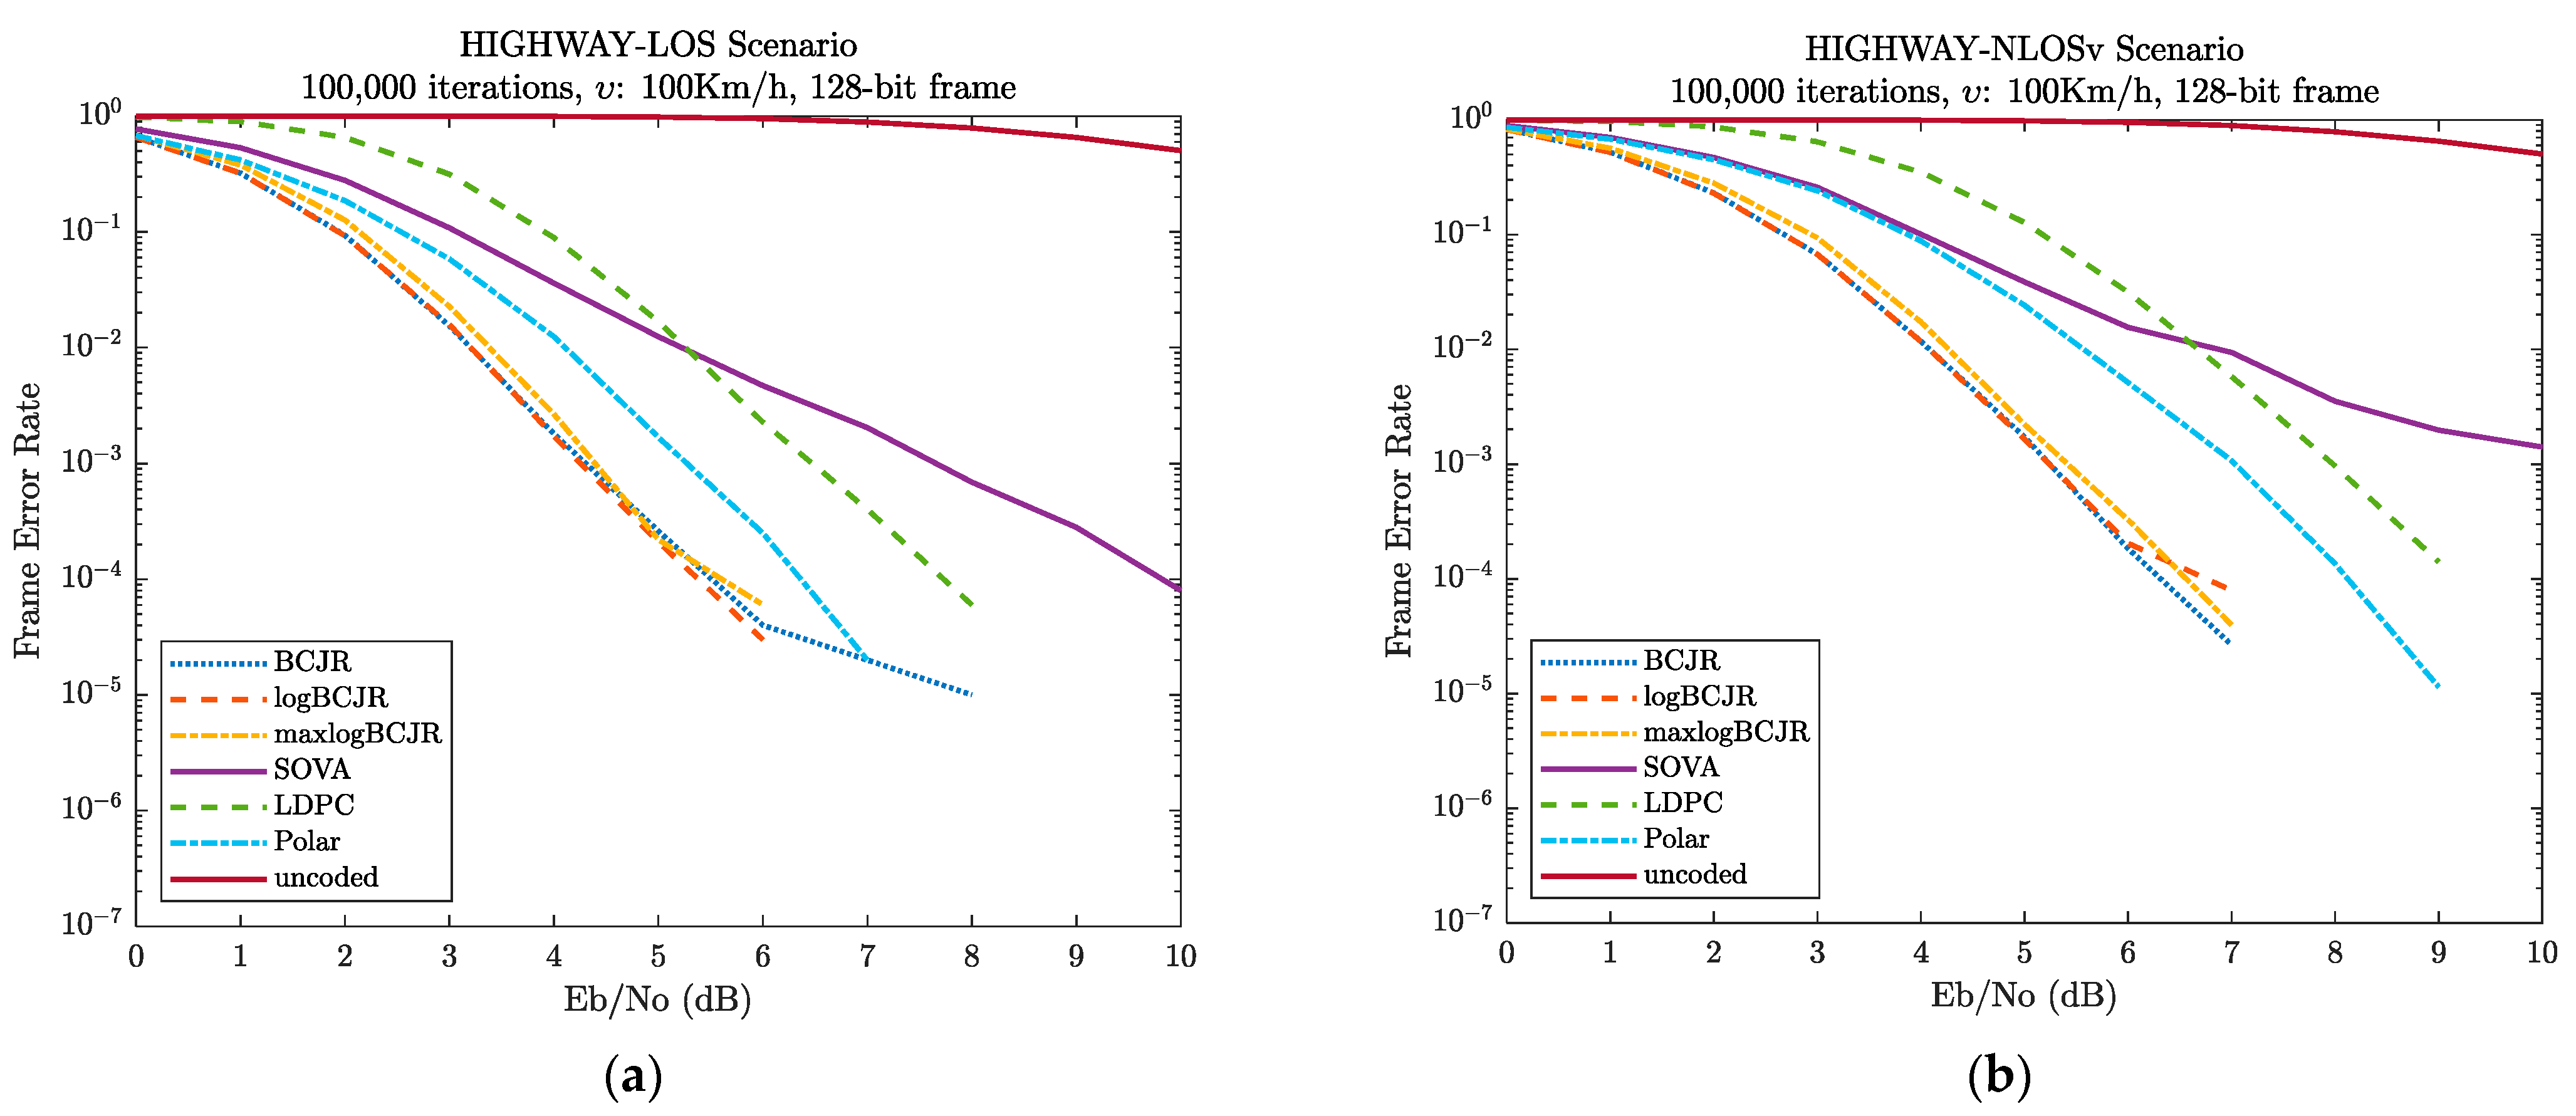
In
Figure 2, the FER performance of the simulated system model, i.e., for scenarios S1–S5 in
Table 1 is shown. We observe that each decoding algorithm improves the FER as the SNR increases at a rate greater than the uncoded case. Additionally, BCJR and logBCJR have almost the same performance, while the suboptimal maxlogBCJR has a loss of 0.2–0.3 dB [
52]. All three BCJR-based algorithms have the same convergence rate, causing FER to null very fast, and this is the main reason why the error floor [
53] is not fully revealed, although it is present in the simulation scenarios for the BCJR-based algorithms.
The SOVA is also suboptimal compared to the BCJR-based algorithms [
54] and its low rate of convergence prevents it from zeroing in the SNR range between 0 and 10 dB. Furthermore, it has better performance compared to LDPC in the low and middle SNR regions, but eventually, it becomes the worst algorithm in the high SNR region due to its slow convergence rate.
The FER in LDPC has a very slow rate of convergence initially, but as the SNR increases, the rate increases vastly. Although the slope of the convergence rate in LDPC is comparable to that of the BCJR-based algorithms at the middle SNR region, it slowly diminishes and diverges, specifying the presence of an error floor [
55,
56]. This error floor is negligible, and it is more clearly visible in both LOS scenarios.
Contrariwise, there is no error floor in polar coding [
57]. Polar coding has an FER similar to the SOVA algorithm initially, but as the SNR increases, the FER diminishes rapidly in all scenarios. Eventually, the rate of convergence becomes better in polar coding than in the BCJR-based algorithms, but it is not enough for polar coding to obtain optimal performance, since FER in the BCJR-based algorithms nulls very quickly.
These FER performance results can be fully explained through the theoretical operation framework and characteristics of each coding scheme. According to [
36], turbo codes are more effective in small data frames, since the convolutional coding results in dense-information parity bits, unlike LDPC, where block coding creates parity bits with less information. Further, in [
36], the authors concluded that polarization is not fully revealed in small data frames, and as a result, polar coding is subordinate to turbo coding. Finally, among the turbo coding schemes, the authors in [
52,
54] proved and explained in detail the suboptimality of maxlogBCJR and SOVA, respectively, compared to the optimal performance of the BCJR and logBCJR algorithms.
From
Figure 2, and from the above analysis, we can deduce that the BCJR-based algorithms are the best choice regardless of the FER value we want to achieve and for every system model simulation scenario.
5.2. Impact of Vehicle Speed on V2X System Model
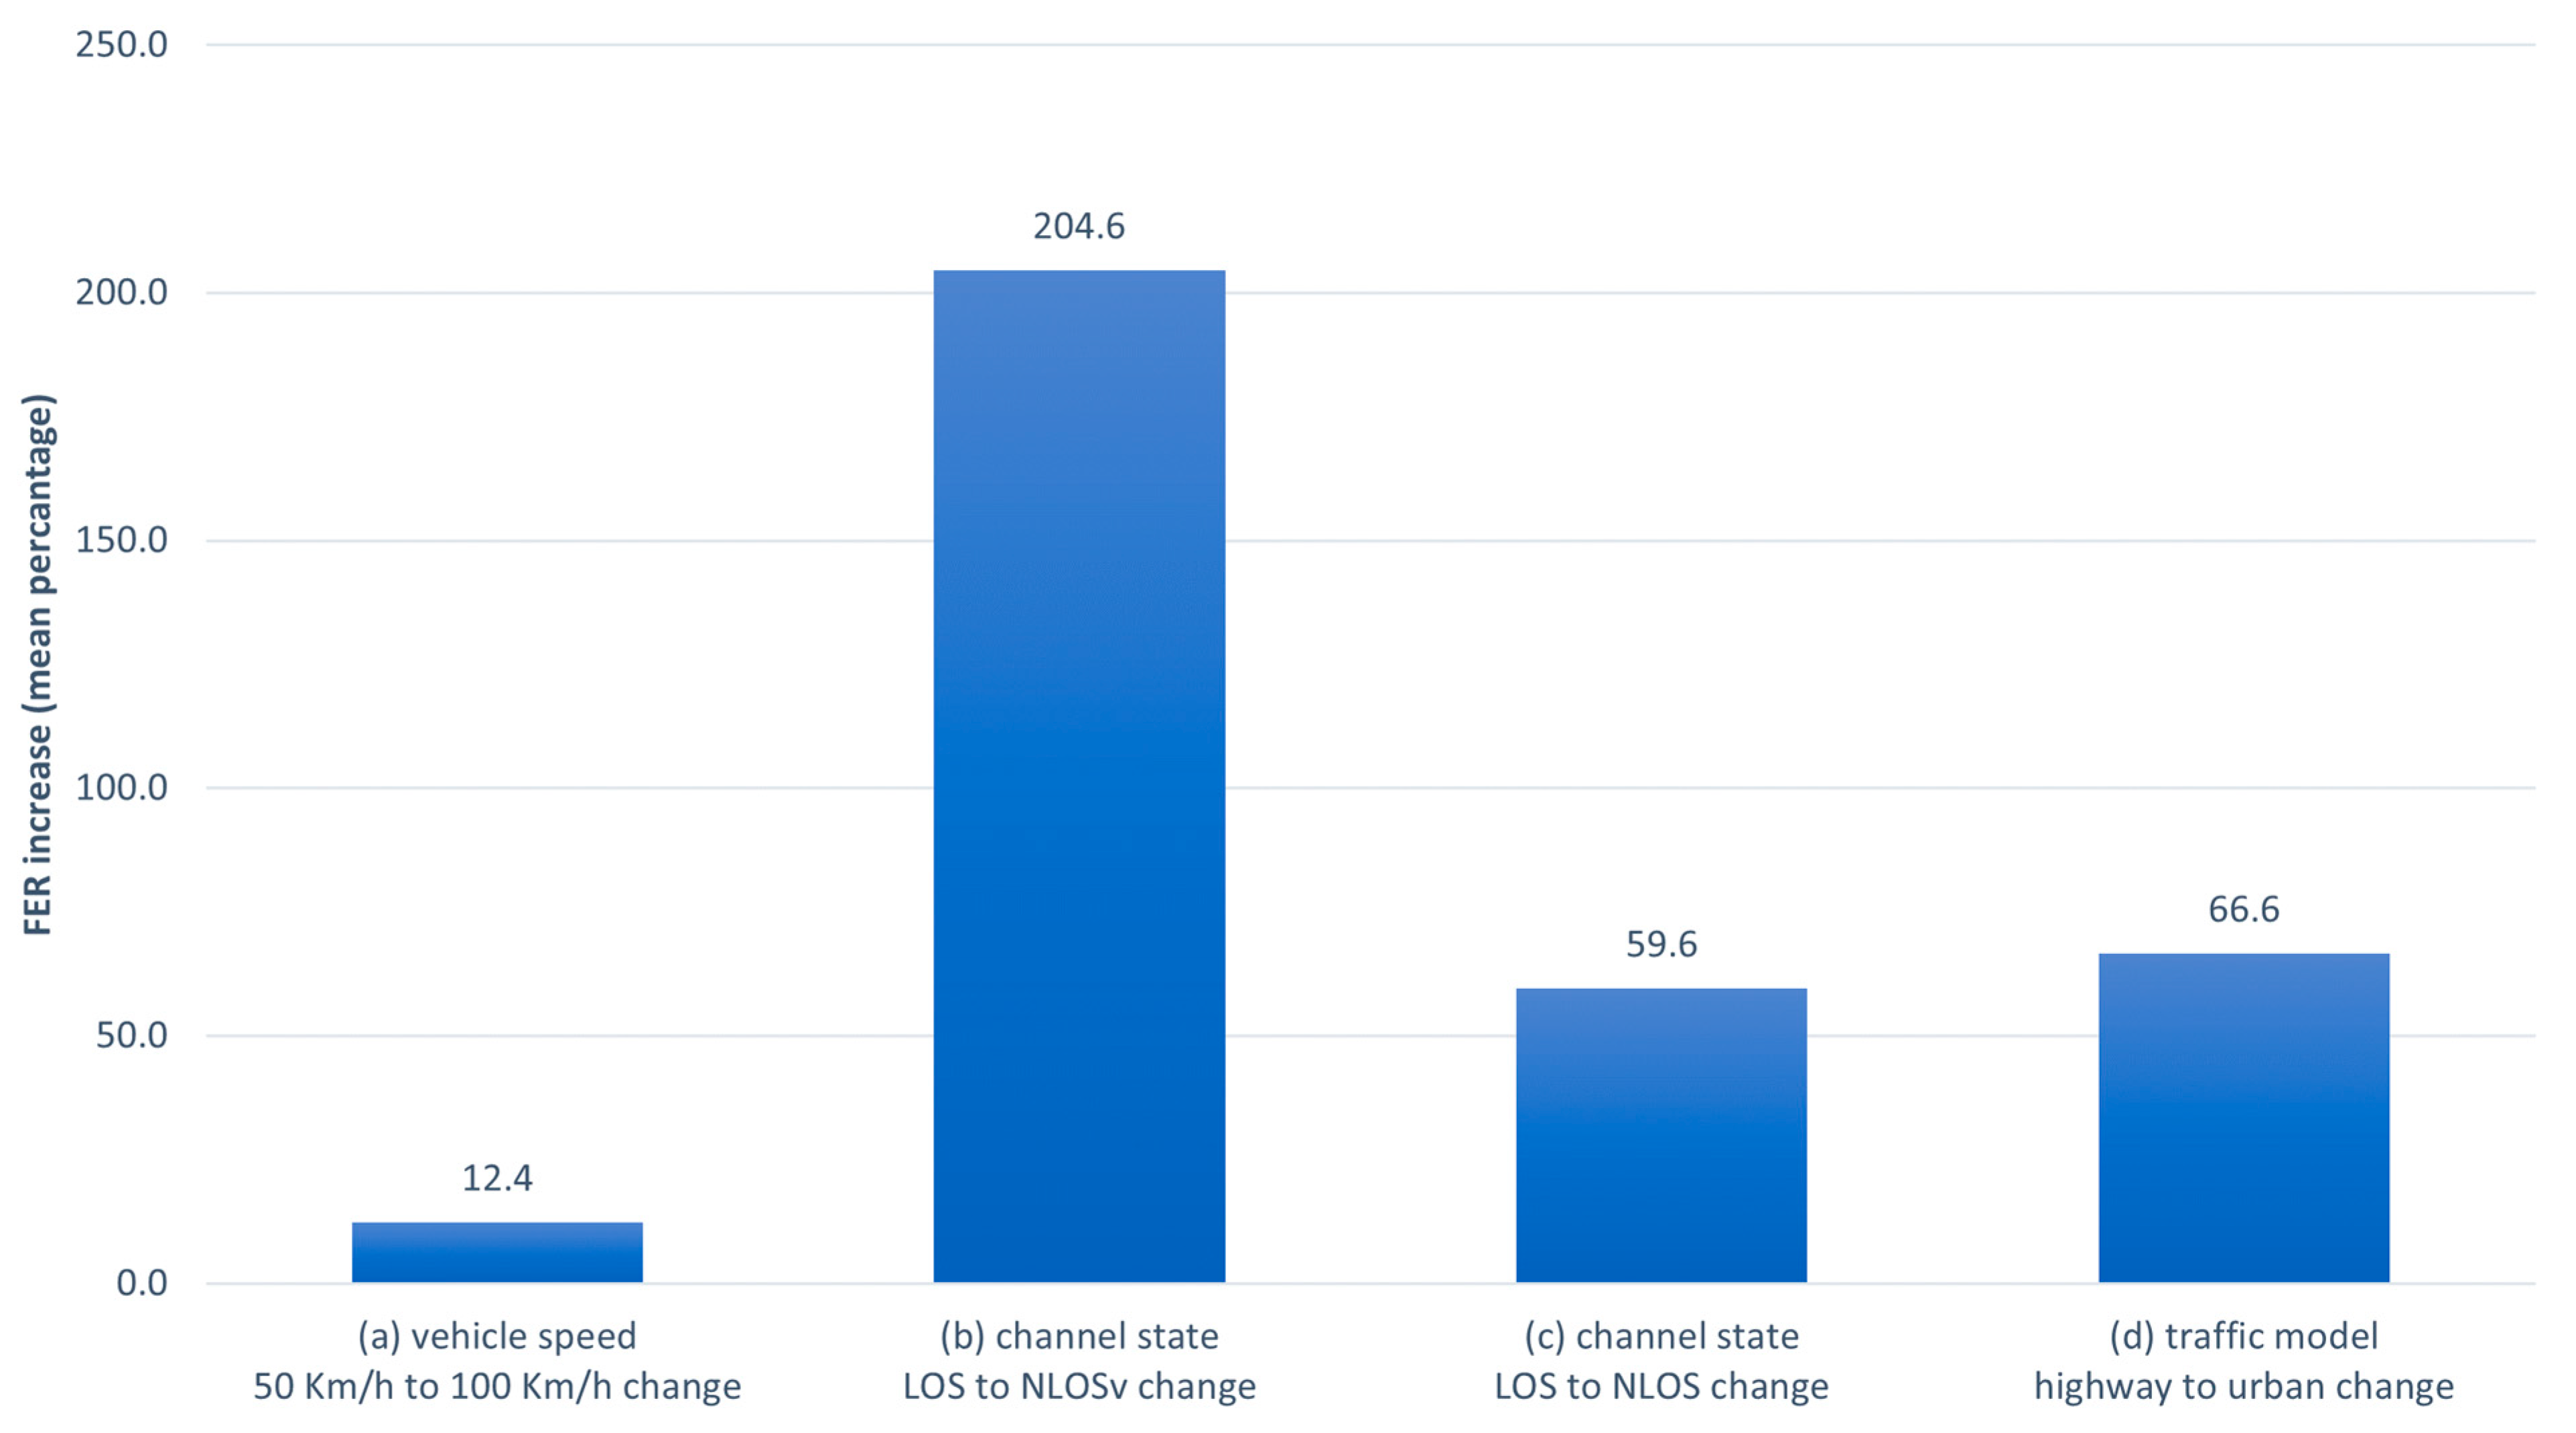
Scenarios S2 and S5 are based on the NLOSv channel state and different traffic scenarios. These two scenarios are the best representatives of examining the impact of vehicle speed on the system performance, since both scenarios have common small-scale characteristics, except for the Doppler effect, which is affected by vehicle speed. In these two scenarios, the vehicle speed increases from 50 to 100 km/h, i.e., it doubles. In
Figure 3a, we show the mean percentage FER increase when the vehicle speed changes from 50 to 100 km/h. For our calculations, we took into account only the SOVA algorithm, considering it as the most representative of all, since it is the only one that has a non-zero FER in the entire range of SNRs between 0 and 10 dB. From
Figure 3a, our hypothesis that stronger Doppler effects create a worse channel, and therefore a worse FER, becomes apparent, and this information is also quantified since we can conclude that FER is worse at 100 km/h than at 50 km/h by 12.4% on average. From
Figure 2b,e, we can also observe that the FER difference gradually rises as the SNR increases. This phenomenon is analyzed in [
37], where the authors determined that at the low SNR region, the influence of the Doppler effect is small since the bad large-scale features suppress the system performance. As the SNR becomes higher, the channel performance improves, and the small-scale differences intensify the FER difference between the two scenarios.
5.3. Impact of Channel State on V2X System Model
Figure 3b illustrates the increase in FER when the channel state changes from LOS to NLOSv for the SOVA algorithm. This measurement has been calculated both when the channel state change occurs in urban environments, i.e., scenarios S3 and S5, and in highway traffic environments, i.e., scenarios S1 and S2. In urban environments, FER becomes worse by 355.5%, and in highway environments, by 53.7%, resulting in an overall average FER increase of 204.6%, as shown in
Figure 3b. As a result, we can deduce that the LOS channel state is much more efficient than NLOSv, especially in the highway traffic model, where the presence of scatterers affects the reliability of the channel less. In
Figure 3c, we also present the behavior of the FER when there is a channel change from LOS to NLOS, where this change concerns only an urban environment, i.e., scenarios S3 and S4. We can observe that the absence of a line-of-sight signal deteriorates the performance of the communication system by 66.6%, which is greater than the LOS-to-NLOSv change in an urban environment.
5.4. Impact of Traffic Model on V2X System Model
From scenarios S1 and S3 for the LOS channel state and scenarios S2 and S5 for the NLOSv channel state, we can extract a quantitative measure of the impact of the traffic model change on the system performance. This measure is illustrated in
Figure 3d. From the simulations, we observe that when the model changes from highway to urban, the FER worsens by 120.9% in the case of the LOS channel state and by 12.4% in the case of the NLOSv channel state, concluding that changing the traffic model from highway to urban results in a 66.6% deterioration in system performance on average. We also observe that there is a huge difference between the traffic model change that occurs in the LOS channel state versus the NLOSv channel state. This is because NLOSv performs poorly and cannot be greatly improved by the traffic model, whereas, in the LOS state, the traffic model and the number of scatterers play a decisive role in the performance of the system.
5.5. Required SNR for Minimum Reliability
Figure 4 shows the minimum required SNR to achieve the minimum reliability for each QoS scenario of
Table 2 and for all system model simulation scenarios of
Table 1. As expected, the BCJR and logBCJR algorithms have the best performance, which are almost identical. The maxlogBCJR algorithm needs a 0.2–0.3 dB higher SNR to reach the same performance as BCJR for each QoS scenario and for all system model simulation scenarios, whereas the SOVA algorithm requires 1.1–2.6 more dB to achieve the same reliability. The polar algorithm appears to behave slightly better than SOVA, but the difference in performance is large compared to the BCJR-based algorithms. Finally, LDPC is the worst algorithm in terms of SNR since it has a difference of 1.9–2.7 dB.
Furthermore, we observe that the transition from 90% to 95% reliability requires an increase in SNR of 0.4–0.8 dB, while the transition from 95% to 99% reliability requires an increase in SNR of 0.8–1.5 dB. This is because 90% and 95% reliability are achieved at relatively low SNR before error floor phenomena occur, while 99% reliability is in many cases achieved while the error floor effects that delay the convergence of the BCJR-based algorithms are present.
Polar coding has higher SNR requirements to achieve the same reliability metrics compared to the BCJR-based algorithms. This is clearly due to the slower convergence that polar coding has because the frame size is too small to exploit the polarization [
37].
Figure 4 also makes it clear not only the slow rate of convergence of SOVA but also that LDPC starts to become efficient in large SNRs. If we compare these two algorithms, we observe that SOVA at 90% and 95% reliability has a clearly superior behavior than LPDC, but at 99%, their performances are clearly comparable. Concluding,
Figure 4 reveals the superiority of BCJR-based algorithms for 128-bit frames in terms of SNR that is required to achieve reliable communication in a 5G V2X channel.
5.6. Required Transmitter Power for Minimum Reliability
The knowledge of SNRs is very useful since it determines the power requirements of the receiver relative to the inherent noise of the receiver circuits in order to achieve reliable communication. Another useful and decisive parameter in a 5G V2X communication system is the transmitter power. The specifications for 5G V2X [
9] (p. 9) define that for communications below 6 GHz (case under study), the transmitter power is 23 dBm both in urban and in highway traffic environments.
In this section, we study the minimum transmitter power
required to achieve the minimum reliability requirements of each QoS scenario of
Table 2 for each system simulation scenario of
Table 1 and for each coding scheme. The transmitter power is calculated from the equation:
where
is the path loss of the environment and
is the receiver power.
The path loss in dB is calculated according to [
37] (pp. 4–5), which was extracted from [
9] and is shown in
Table 3. In the above equations,
is the three-dimensional (3D) distance between the two vehicles in meters and
is the carrier frequency in GHz. Additionally,
is a log-normal random variable that models the shadowing effect in dB, which affects all channel states. Apart from that, an additional blockage loss in dB is added to the path loss when a V2X link is in the NLOSv state. This loss
models the presence of partial blocking between the transmitter and the receiver and is implemented as a log-normal random variable, with mean
and standard deviation
,
, and it is presented in
Table 4.
In our simulations, we are interested in the average behavior of the path loss. Thus, since shadowing has a zero-mean value on all V2X channel states, we conclude that it does not affect the average path loss. In contrast, in the case of the NLOSv channel state, the existence of additional blockage loss affects the average path loss since there are non-zero mean cases. In our simulations, we assume that each NLOSv case is equiprobable [
37]. Therefore, since the longest possible distance in all QoS scenarios is 500 m, the average blockage loss in the NLOSv channel state is 4.67 dB. In
Table 5, we present the average path loss for each system model simulation scenario.
In an ideal receiver, the power
is given from the formula
, where
is the energy per bit at the receiver and
is the data rate. In order to be able to calculate
and at the same time relate it to system reliability, we reveal the energy per bit to noise power spectral density ratio
in the above formula. Therefore,
In real communication systems, there is always a difference between the actual and the ideal receiver, which is modeled as an extra factor of degradation of the
at the receiver, called the noise figure
. In 5G V2X communication systems, the noise figure is set to 9 dB [
9]. Additionally, the noise power spectral density
for thermal white noise is −174 dBm. Taking these values into account and presenting Equation (2) in dBm, it follows that:
As a result, using the relation (1), the transmitted power in dBm is:
where
is calculated from
Table 5 for each system model simulation scenario.
Equation (4) is used to calculate the minimum required transmitter power that achieves the minimum reliability requirements for each QoS scenario. In Equation (4), we assume that the transmitter and receiver have the maximum possible distance and data rate, according to the specifications of each QoS scenario. Also, the is the minimum that satisfies the reliability requirements according to the previous subsection.
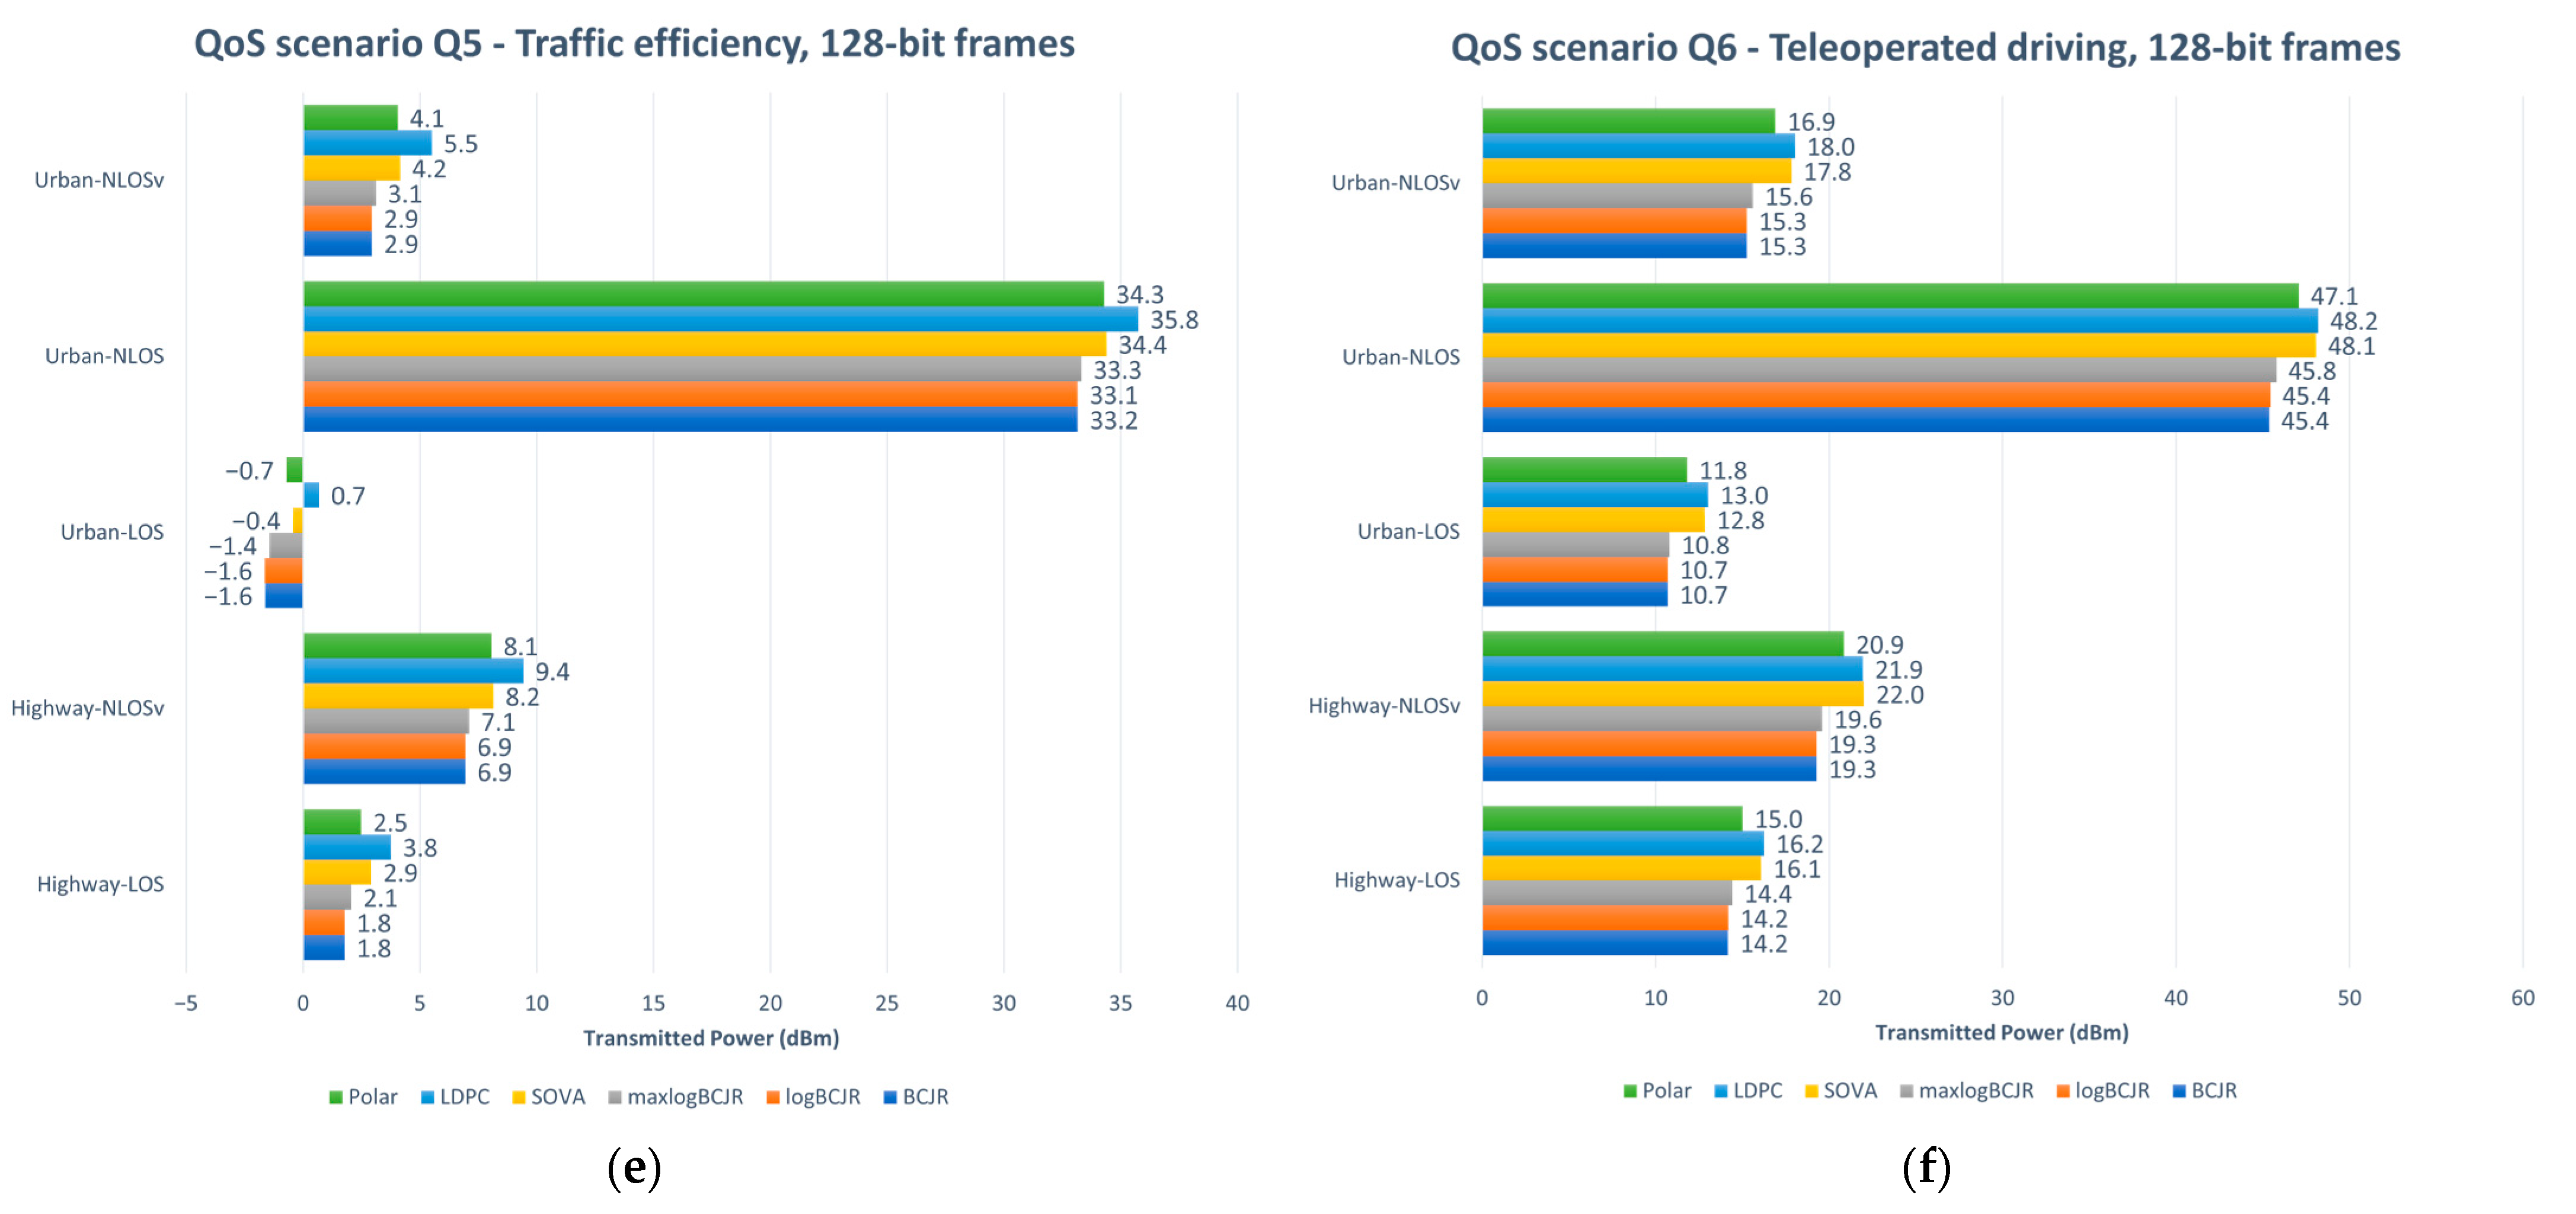
Figure 5 presents the minimum power requirements for each QoS scenario of
Table 2 for all system model simulation scenarios of
Table 1 and for all coding schemes. From this figure, we deduce that all system model scenarios, except S4 (urban–NLOS), satisfy the reliability criterium in practice since they require a transmitter power of less than 23 dBm, which is the specified power for 5G V2X communications below 6 GHz. System scenario S4 requires power less than 23 dBm only in QoS scenario Q4 (
Figure 5d), mainly because of the small data rate and the short distance between the transmitter and the receiver. In all other QoS scenarios, the required power of system scenario S4 is much larger, indicating the inability of the NLOS channel to respond over long distances, which is expected, since in an NLOS environment, communication is possible over very short distances. Therefore, the minimum transmitted requirements are reached in the urban–NLOS scenario only for small distances.
Q1 and Q4 are the most power-effective QoS scenarios, mainly because they have small data rates and low-to-medium reliability requirements. Additionally, QoS scenario Q5 has small power needs, due to its low reliability requirements, although it has high data rate requirements and a long range. QoS scenarios Q2 and Q3 have almost the same minimum power requirements, although they have different QoS specifications. The main factor affecting power in Q2 is a high data rate, and in Q3, it is high reliability. Finally, the combination of high reliability, a high data rate and a long range makes the QoS scenario Q6 the most-power-consuming scenario.
Regarding the coding schemes, from
Figure 5 we can deduce the superiority in power of the BCJR-based algorithms. BCJR and logBCJR need less 0.2–0.3 dBm and 0.8–2.7 dBm power than maxlogBCJR and SOVA, respectively, for all QoS scenarios and system simulation scenarios. Moreover, polar needs more 1.1–2.2 dBm power than the BCJR-based algorithms. In terms of power, the worst algorithm is LDPC, which requires 1.5–3 more dBm than the BCJR-based algorithms.
5.7. Maximum Range for Minimum Reliability
In the previous subsections, we presented the effect of reliability on the SNR and the transmitter power. Another aspect that we can examine includes the impact of reliability on the maximum range between two vehicles. For this purpose, we studied the maximum distance two vehicles can have in order to achieve the minimum required reliability, as defined by each QoS scenario. For the calculations, we assume that the transmitter power is 23 dBm and the noise figure at the receiver is 9 dB [
9] (p. 9). Additionally, we assume that the vehicles transmit at the highest possible rate for each QoS scenario and that the
at the receiver is the minimum required to achieve the minimum tolerable reliability of each QoS scenario.
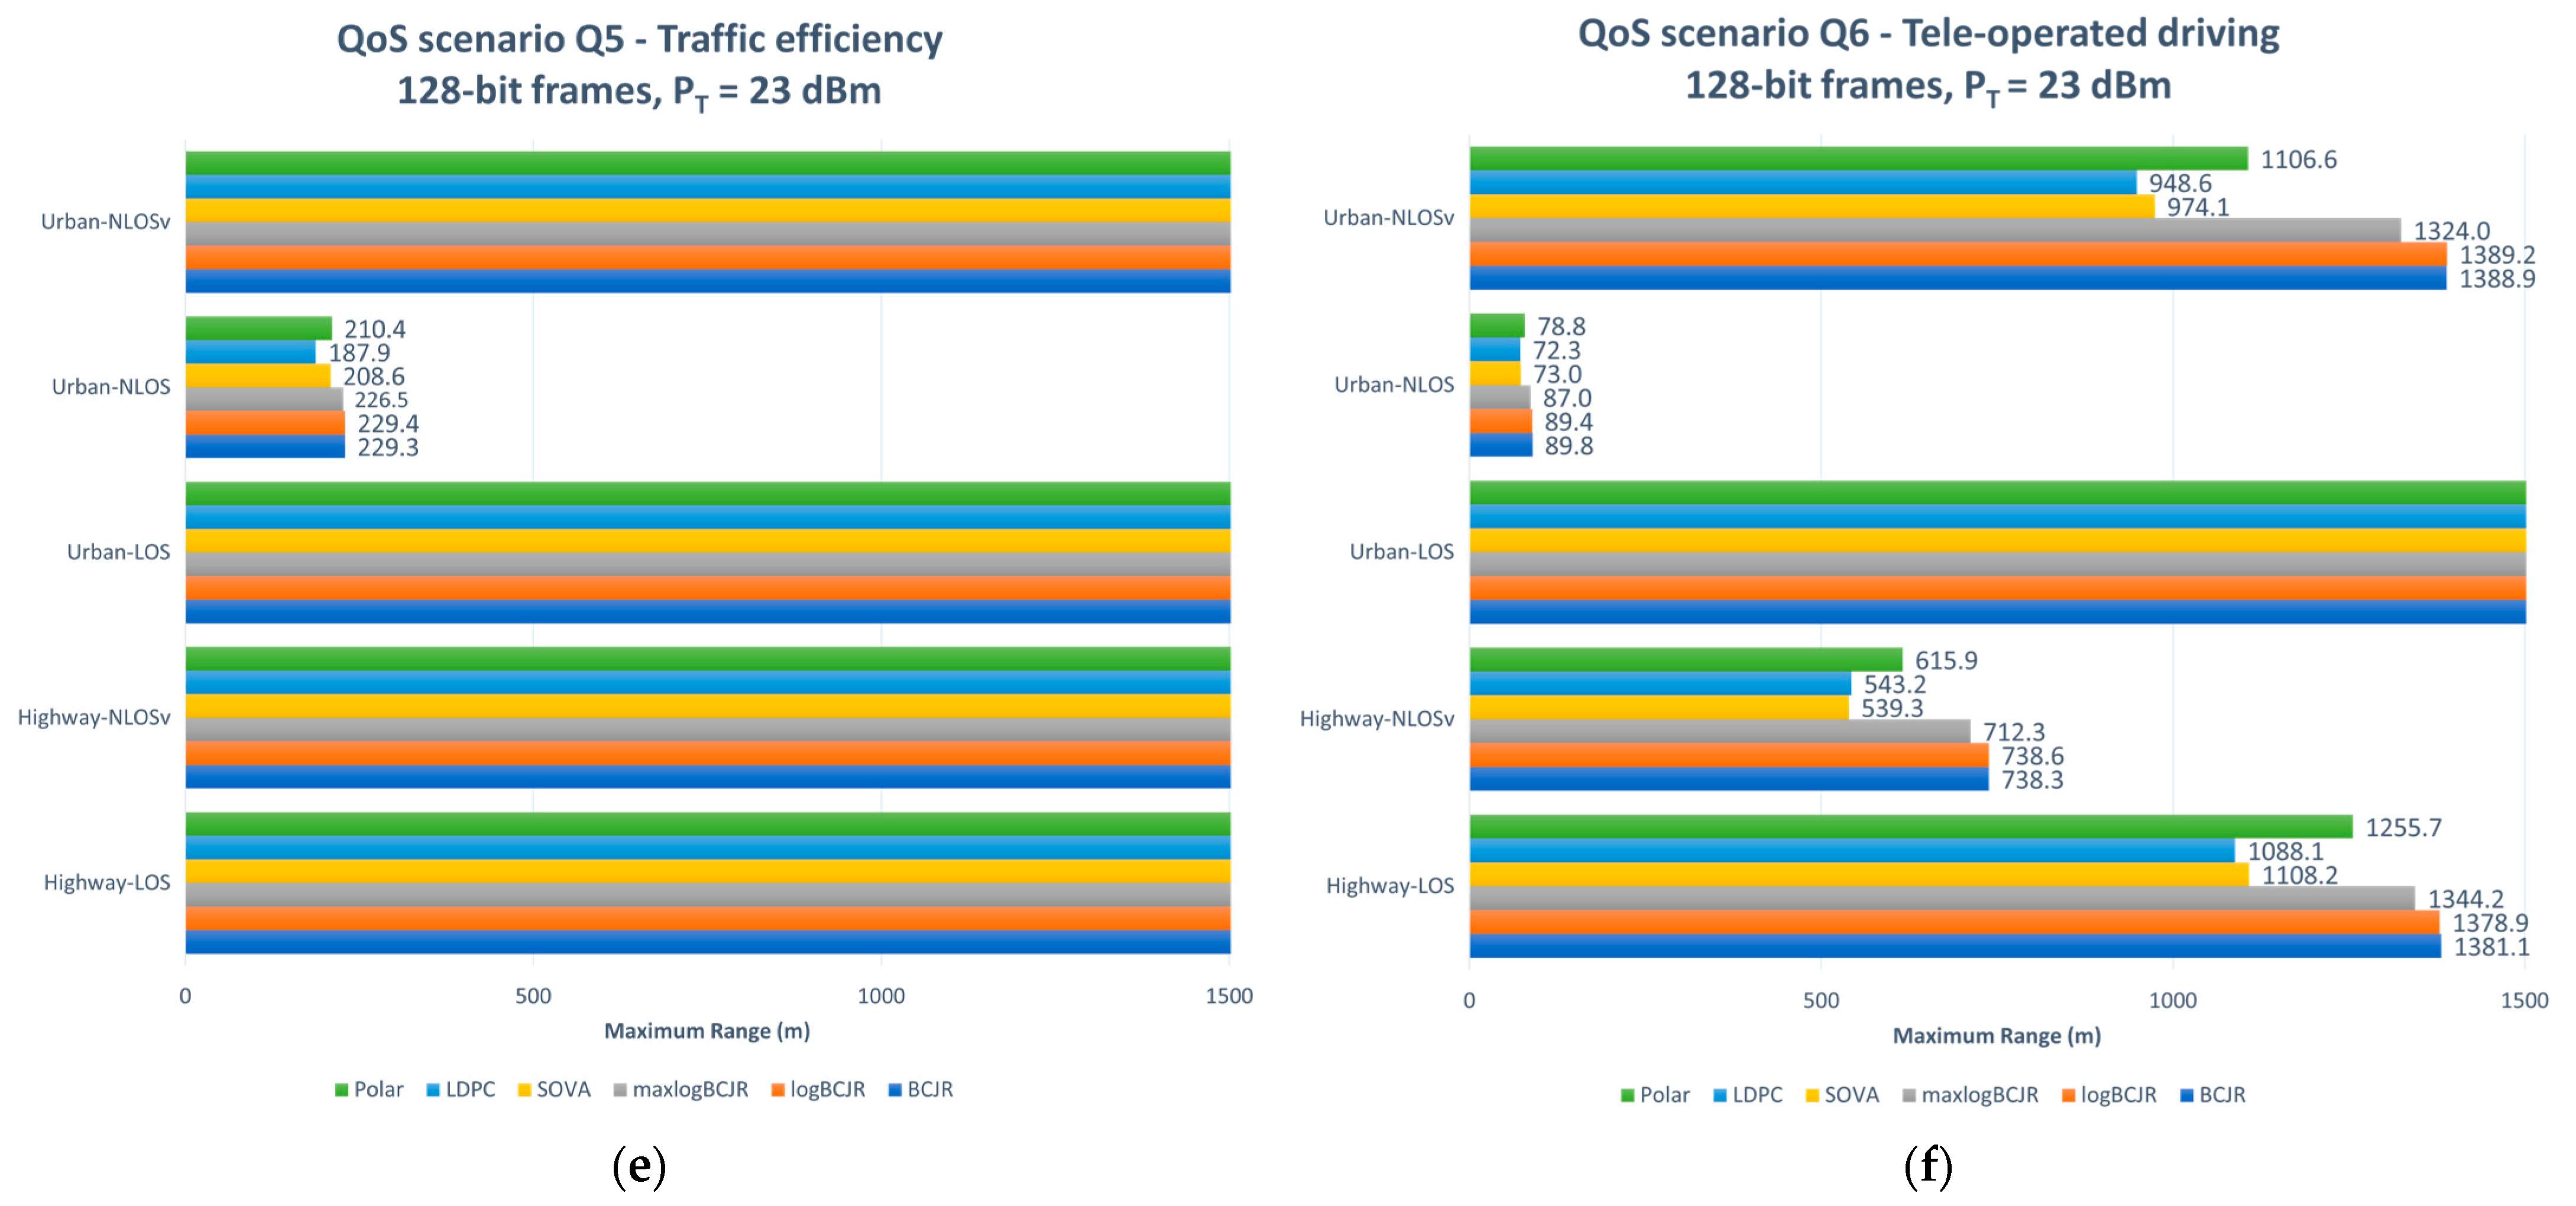
Figure 6 presents the maximum range per QoS scenario, simulation scenario and coding scheme where we have limited our scope to a 1500 m maximum range, which is three times bigger than the maximum typical range of
Table 2.
QoS scenarios Q1 and Q4 are the most range-effective scenarios. QoS scenarios Q1 and Q4 have a maximum typical range at 350 and 200 m, respectively, and from
Figure 6a,d, we can observe that the minimum reliability requirements are fulfilled for all simulation scenarios and coding schemes. This fact is true not only for the maximum typical range scenario but also for much longer distances.
QoS scenarios Q2, Q3 and Q5 achieve the 200, 350 and 500 m thresholds, respectively, in all simulation scenarios and for all coding schemes, except scenario S4 (urban–NLOS). The urban–NLOS scenario in these QoS scenarios indicates that the coding schemes achieve reliable communication at 42 to 48% of the maximum typical range depending on the coding scheme. Nevertheless, from the urban–NLOS cases, the superiority of the BCJR-based algorithms becomes apparent, since they have the maximum range among all the coding schemes.
The QoS scenario that has the worst range in all system simulation scenarios and coding schemes is Q5. Although only simulation scenario S4 fails to reach the maximum typical range fulfilling the reliability requirements, it has become obvious that the dynamics of scenario Q5 are smaller. The distances for Q5 in all system simulation scenarios have been shortened, with a characteristic example being the highway–NLOSv scenario, where the specifications of the distance are marginally met.
In conclusion, we observe that all simulation scenarios, except urban–NLOS, achieve the range required by each QoS scenario. For cases where this range is not reached, BCJR-based coding schemes have the widest possible range, polar has a range comparable to SOVA and LDPC has the worst range.
5.8. Throughput for Minimum Reliability
In this section, we study the throughput (in Kbps) of the 5G V2X communication system for each coding scheme and QoS scenario, as defined in [
35]. For the calculation of the throughput, we assumed that the transmitter power is 23 dBm [
9] (p. 9), the distance between the transmitter and the receiver is computed according to the specifications of each QoS scenario (
Table 2) and the minimum reliability requirements are fulfilled. Additionally, we limited our observation to the maximum possible throughput that each QoS scenario can achieve. The results are presented in
Table 6 for each QoS scenario.
Table 6 shows that the maximum possible throughput in QoS scenarios Q1 and Q4 is achieved for all simulation scenarios and coding schemes. From the same table, we conclude that the urban–NLOS scenario fails totally for QoS scenarios Q2, Q3, Q5 and Q6 since the distance is too long for non-line-of-sight signals to meet the reliability requirements. Apart from that, these QoS scenarios behave excellently in all other simulation scenarios. Scenario Q6 is the worst throughput-effective scenario, being the only one that cannot reach the maximum throughput in the highway–NLOSv scenario, but its performance marginally reaches the optimum.
5.9. End-to-End Latency
In our simulations, we assume that the end-to-end latency is mostly affected by the propagation delay , i.e., the amount of time required for a signal to be received after it has been sent, and the delay caused by the decoding process. We focus on these two latency parameters mainly because they are the only parameters that depend on the QoS scenarios and the decoding algorithm and because the other latency parameters are considered to be negligible compared to them.
The propagation delay is calculated from the equation , where is the distance between the transmitter and the receiver and is the speed of light.
To formulate the decoding delay, we first define the decoding complexity
. The decoding complexity for SOVA, logBCJR and maxlogBCJR is fully described in [
33,
34,
35] and [
22], where the authors proved that for a memory of the turbo decoder
, the computational complexity is
,
and
operations/bit/iteration, respectively. Following the same methodology as in [
22], we calculated the complexity of BCJR and found that it requires
operations/bit/iteration. In [
48,
58], the authors examined the computational complexity of LDPC, and they proved that it is calculated using the formula:
where
is the coding rate,
is the mean column weight and
is the mean row weight of the base matrix. In our simulations, we assume that
. Additionally, according to the 5G NR standard [
59] and the base matrix that is compatible with the frame length we use in our simulations, we can deduce that
and
. Therefore, we can derive that the LDPC decoding delay in our simulations is
operations/bit/iteration. From the above analysis, it is obvious that the maxlogBCJR, logBCJR and BCJR are 1.8, 2.8 and 3 times more complex per bit and iteration, respectively, than SOVA, while LDPC is 0.57 times more complex per bit and iteration than SOVA. Polar is the only non-iterative decoding algorithm, and taking into account the extensive research conducted in [
60], we conclude that it requires in total
operations/bit in our simulations, and it is
more complex than SOVA per bit and iteration. Considering the computational complexity from the above analysis, the formulas for the end-to-end latency for SOVA (
), BCJR (
), logBCJR (
), maxlogBCJ (
), LDPC (
) and polar (
) are given in
Table 7, using the same approach as in [
33].
In the above equations, is the frame size, is the data rate, is the number of iterations for SOVA- and the BCJR-based algorithms (4 iterations in our simulations) and is the number of iterations for the LDPC decoder (12 iterations in our simulations).
From
Table 7, we can deduce that the end-to-end latency for a specific data frame length depends on the distance, the data rate and the number of decoding iterations. As a result, the end-to-end latency varies for all QoS scenarios of
Table 2. In
Table 8, we present the end-to-end latency in ms for each decoding algorithm per QoS scenario, assuming that we have the maximum typical range and data rate for each QoS scenario. From the results presented in
Table 8, it is obvious that SOVA and polar have almost the same latency and are by far the best algorithms. LDPC and maxlogBCJR have similar latencies, which are approximately 1.7–2 times higher than SOVA and polar. Finally, BCJR and logBCJR have the highest delay, as expected, since they are the most complex algorithms. However, the main conclusion taken from the table below is that the end-to-end latency does not exceed the maximum latency specified by the specifications of each QoS scenario. From this conclusion, we can infer that, in terms of latency, the BCJR-based algorithms are suitable for 128-bit frame V2X communications.
5.10. Maximum Number of Vehicles
The results derived from
Table 8 can be used in order to find the maximum number of vehicles that can communicate simultaneously in a worst-case scenario, i.e., achieving the minimum end-to-end latency at the maximum typical range for each QoS scenario as presented in
Table 2. First, we determine the maximum number of vehicles that can be in the maximum typical range of each QoS scenario. For this purpose, we use the road configuration parameters for urban and highway traffic [
9] (p. 36), i.e., we assume that there are four and six lanes in total in urban and highway traffic, respectively. Additionally, we assume that there are only Type 2 vehicles [
9] (p. 10), i.e., 5 m length vehicles. Finally, we assume that the distance between the rear bumper of a vehicle and the front bumper of the following vehicle is the minimum possible, i.e., 2 m, according to [
9] (p. 10). Taking these parameters into consideration, we determine the maximum number of vehicles using the equation:
In
Table 9, we present the maximum numbers of vehicles for each QoS scenario in the maximum possible range. These values will be used as an upper bound in the analysis that will follow in this section.
Using the results of
Table 8 and
Table 9, we can find the maximum number of vehicles that can communicate simultaneously without exceeding the maximum end-to-end latency requirements for each QoS scenario and decoding algorithm. The results are shown in
Table 10 and
Table 11 for urban and highway environments, respectively. These results clearly show that scenarios Q1, Q2, Q3 and Q5 achieve the maximum possible number of vehicles of
Table 9, whereas scenarios Q1 and Q4 fail to achieve the upper bound of
Table 9.
In scenarios Q1 and Q4, the superiority of the SOVA and polar decoding schemes becomes apparent, since the number of vehicles that can communicate without exceeding the maximum end-to-end latency is three times the number of vehicles compared to the BCJR and logBCJR algorithms. The maxlogBCJR and LDPC algorithms behave similarly and can serve just over half as many vehicles compared to polar coding. The results in a highway environment are similar, except for scenario Q6, where BCJR and logBCJR cannot reach the maximum possible vehicle bound of
Table 9.
5.11. Vehicle Density
Apart from the maximum number of vehicles, another important QoS parameter that can be affected by the decoding algorithm is the vehicle density in terms of vehicles/km [
35]. Similar to the previous subsection, we first calculate the maximum possible vehicle density for each QoS scenario in urban and highway traffic environments according to the 5G V2X specifications [
9], which are shown in
Table 12. As expected, the maximum vehicle density is common for all QoS scenarios since it is a QoS parameter independent of the range of the scenario.
In
Table 13 and
Table 14, we show the maximum vehicle density in urban and highway traffic environments, respectively, in which the maximum end-to-end latency requirements of
Table 2 are achieved for each QoS scenario and decoding algorithm. QoS scenarios Q2, Q4, Q5 and Q6 achieve the maximum possible number of vehicles (
Table 12) that can communicate at the same time in an urban traffic environment, whereas in scenarios Q1 and Q4, this cannot be achieved. The superiority of polar coding in the latency parameter is again evident in scenarios Q1 and Q4. Additionally, scenario Q4 highlights the effect of the low transmission rate on the delay and the limitation of simultaneous transmissions that a receiver can accept within the maximum end-to-end latency requirements. However, BCJR-based algorithms can serve enough vehicles simultaneously and respond efficiently to medium-density urban traffic environments for the Q4 scenario and to high-density urban traffic environments for the other QoS scenarios. The behavior of vehicle density in a highway traffic environment is similar to that of an urban traffic environment, with the only difference that in QoS scenario Q6, the BCJR and logBCJR algorithms cannot reach the maximum possible limit since they have the greatest complexity and since the maximum end-to-end latency requirements are very short. However, these two algorithms achieve a very large upper bound in scenario Q6, which is acceptable in real-life traffic cases.
5.12. Overall QoS Evaluation
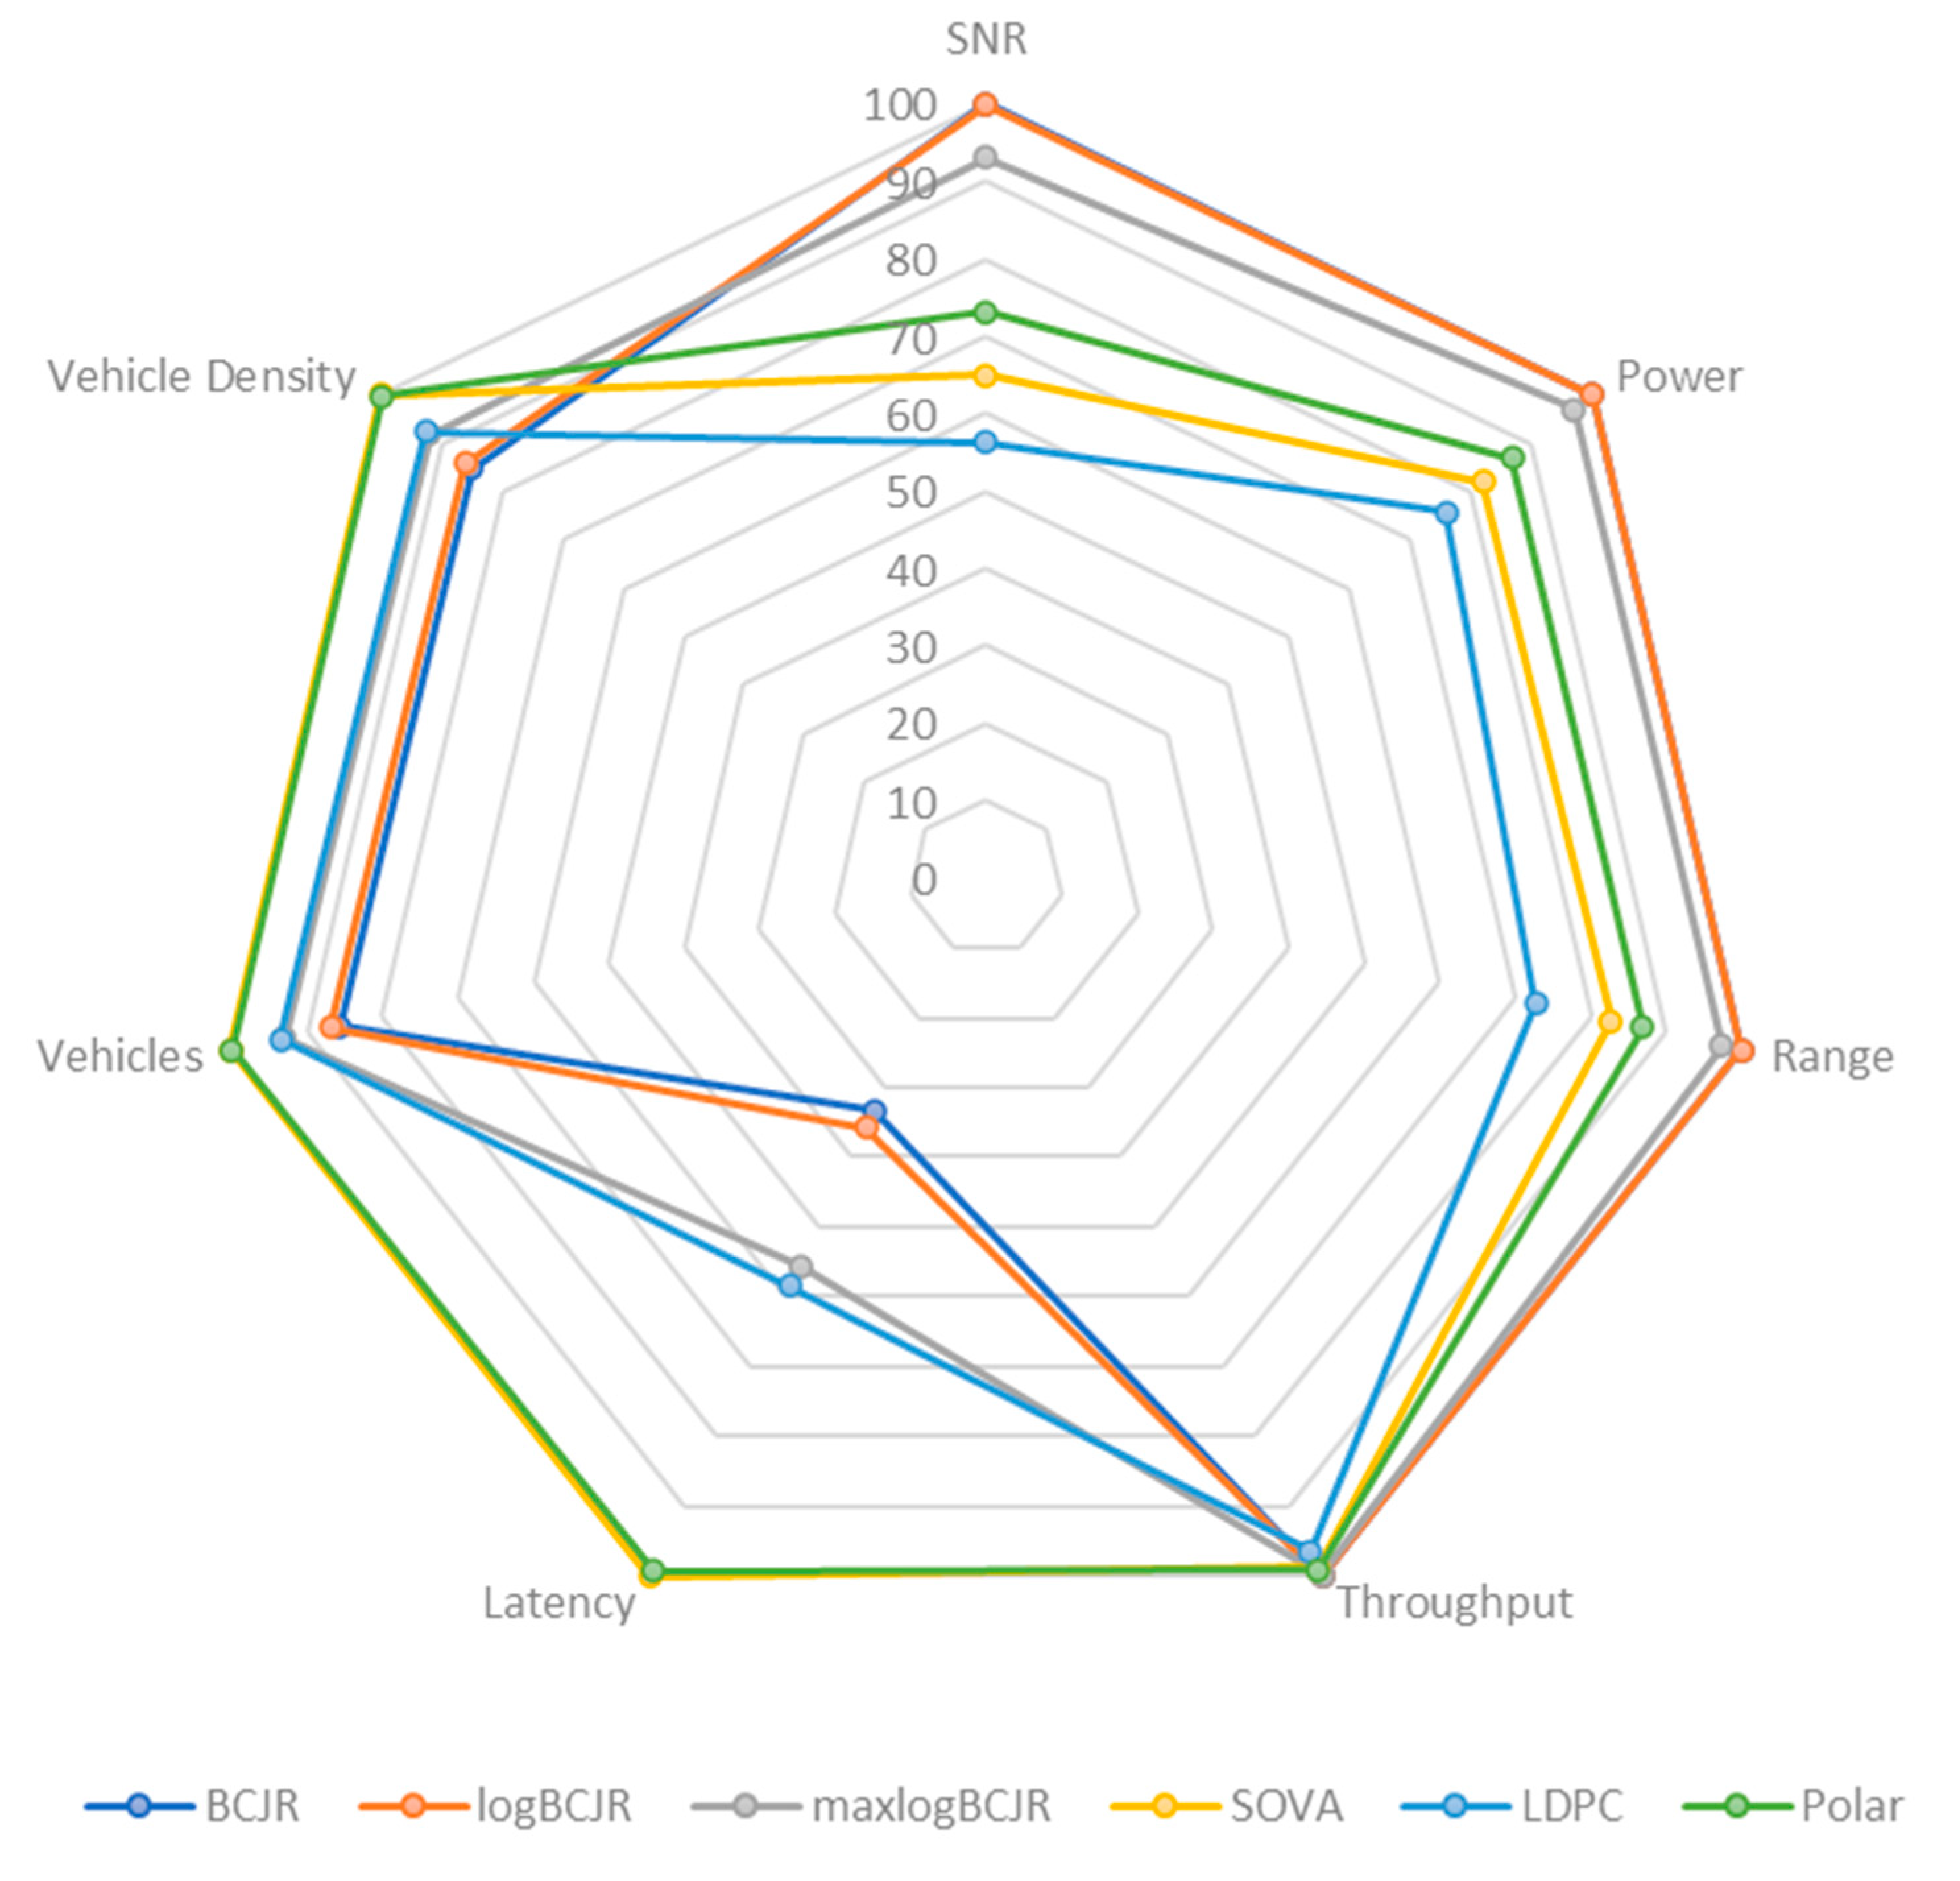
By studying the QoS parameters, namely, SNR, power, range, performance, end-to-end latency, number of vehicles and vehicle density, we can draw conclusions about the most effective coding scheme for each parameter separately. The most important thing, however, is to make a comprehensive evaluation of these parameters and study the influence these coding schemes have on them. For this purpose, we measured the average performance of each parameter for each coding scheme and then normalized these measurements in the range of 0–100 so that reliable comparisons can be made. The maximum of the rating scale corresponds to the optimal performance value for each parameter, meaning that for SNR, power and end-to-end latency, it corresponds to the minimum value, and for range, throughput, vehicle numbers and vehicle density, it corresponds to the maximum value.
Figure 7 shows the overall performance of each encoding scheme based on the QoS parameters that we have examined. From this figure, we observe that maxlogBCJR and polar have the best overall performance, but they have different fields of optimal performance since maxlogBCJR is better in reliability-based parameters (SNR, power, range, throughput) and polar in latency-based parameters (density, vehicles, latency). SOVA and LDPC have inferior QoS performance in reliability-based parameters, but they reach optimality in latency-based parameters, whereas BCJR and logBCJR have the exact opposite QoS behavior.
5.13. Comparison of the Proposed Approach with Published Literature
In
Table 15, we compare the proposed approach presented in this article with the recently published literature (since 2019). From the comparison presented in this figure, only our proposed approach examines both 4G LTE and 5G NR coding schemes for all 5G V2X release 16 channel scenarios and for a 128-bit frame length. In addition, our contribution to the study of QoS parameters in 3GPP 5G V2X channels becomes evident, as this article is the only one from
Table 15 that examines in detail the effect of all the QoS parameters in
Table 2, as well as other parameters such as velocity, SNR, power, throughput, vehicle density and the number of vehicles for each QoS scenario, on all possible V2X channels and for all 4G LTE and 5G NR coding schemes.
6. Conclusions and Future Work
V2X systems have been very popular in the research community in the last few years and attracted great interest both in the academic community and in the industry. Briefly, 3GPP 5G V2X systems are quite demanding systems since they require low latency and very high reliability in high-density and high-mobility communication environments. Based on this reasoning, it is necessary to have a coding scheme that is sufficiently efficient to meet the reliability requirements of the communication system and at the same time be complexity efficient to meet the latency requirements set by the communication environment.
In this article, we implement five different stochastic 5G V2X propagation models, namely, highway–LOS, highway–NLOSv, urban–LOS, urban–NLOS and urban–NLOSv. Based on these models, we investigate all the 4G-based and 5G-based coding schemes, i.e., BCJR, logBCJR, maxlogBCJR, SOVA, polar and LDPC, and examine their performance in terms of FER vs. SNR for 128-bit frames. From our simulation results, we prove the FER superiority of the BCJR-based algorithms. A 128-bit frame size was used as a representative sample of small-data frames to draw conclusions for small-frame 5G V2X services. In addition to the FER performance of the coding schemes, we thoroughly analyzed the impact of the velocity, channel state and traffic model on the V2X telecommunication systems and showed that a highway environment is more sensitive to traffic and channel changes. Additionally, we examined the 5G V2X QoS characteristics that were defined by 3GPP and 5GAA, i.e., reliability, power, range, vehicle speed, throughput, end-to-end latency, number of vehicles and vehicle density, and investigated their behavior for each QoS scenario, propagation model and coding scheme in order to derive the most efficient coding scheme for each QoS parameter.
This approach and analysis are the novelty of this work, where all possible 3GPP 5G V2X propagation models, all 4G and 5G coding schemes, as well as 3GPP and VGAA QoS features, are combined in order to extract in-depth conclusions on the performance and QoS efficiency of the coding schemes. Our analysis shows that BCJR-based coding algorithms are the best choice for the reliability-based QoS parameters and that polar and SOVA are the best choices for the latency-based QoS parameters. Finally, we extracted and determined an overall QoS evaluation, and we concluded that polar and maxlogBCJR have the best overall QoS efficiency, although the optimal feature field differs for these two algorithms.
This study is part of extensive research on the utilization of turbo coding in small-frame 5G V2X communications, in terms of FER performance and QoS efficiency. Thus, in future work, the behavior of FER vs. SNR performance as well as the QoS performance of the turbo codes in a dynamic communication system, where the communication model and channel state vary in time according to some probabilistic criteria, will be examined. In that way, we will investigate if turbo coding is a 5G-V2X-compatible coding solution in more realistic communication scenarios, where the channel state changes dynamically between LOS, NLOS and NLOSv and the traffic model changes in time between urban and highway in a real-time communication scenario. Furthermore, smaller V2X frame lengths can be investigated in order to investigate massive machine-type communication (mMTC)-compatible communications. Finally, our ultimate future objective is an extensive investigation of a holistic and dynamically reconfigurable coding scheme that uses FER performance and QoS features for choosing the most suitable decoder. Such a design could be supported by artificial intelligence principles, and trade-offs should be determined among performance, QoS and computational complexity.


 ,
, 


