4.1. Backup Route Collection Build
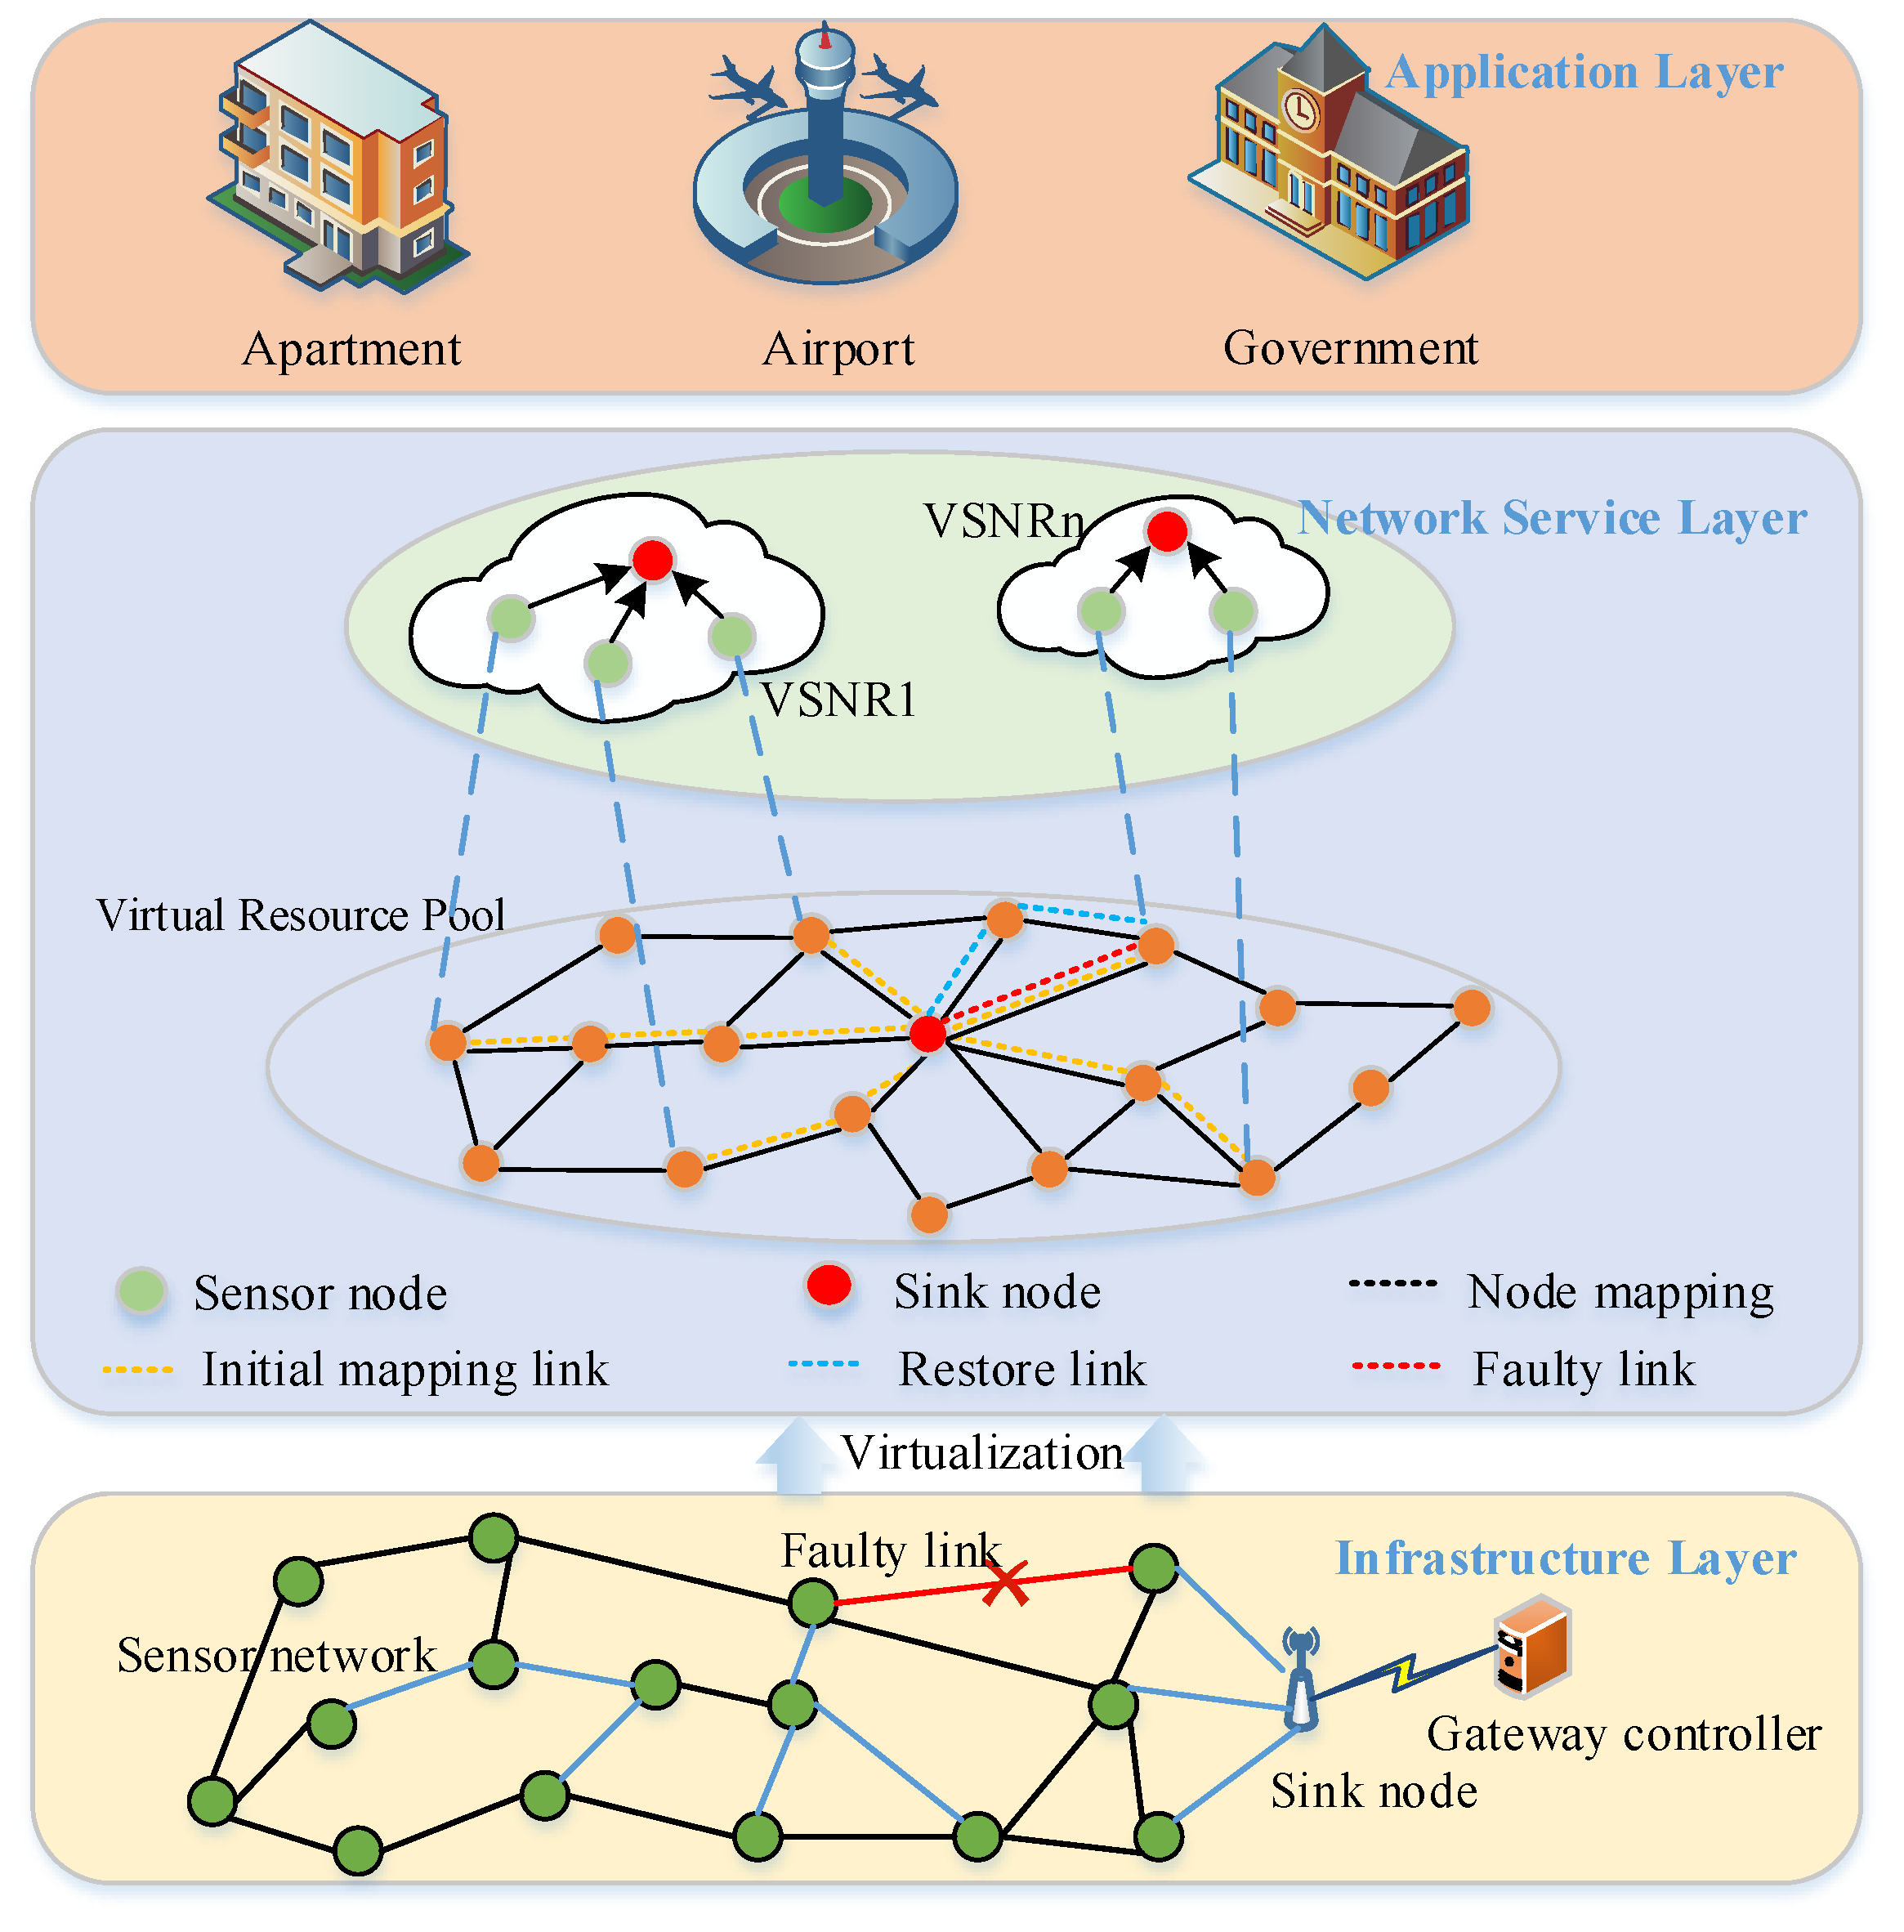
In the virtual wireless sensor network environment, the virtual to physical mapping issue can be settled by performing node mapping and link mapping. Firstly, in the node mapping phase, the most suitable physical sensor node is selected for the virtual node as the source node for mapping to discover the physical path between the source and the sink node. Node mapping helps to select suitable physical sensor nodes in the WSN perception tasks; thus, it should consider whether the current physical sensor nodes meet the request of virtual node resources while also taking into account the current node mapping after follow-up in terms of the influence of the virtual network, so that every node mapping instance can be used to consider the various aspects of performance, meet the overall delay, reduce resources and adhere to other requirements. To evaluate the suitability of candidate mapping physical sensor nodes, the distance among the mapped physical sensor nodes with the sink nodes should be taken into account.
Resources are limited because the physical sensor nodes in WSNs can undergo physical sensor node death due to rapidly depleted resources when multiple VSNs share the same physical sensor nodes, leading to virtual network service failure and to multiple virtual nodes competing for the same physical link resources, meaning the survivability of virtual networks cannot be guaranteed. Therefore, to prolong the lifetime of WSN and ensure load balance, selecting active nodes with a greater number of remaining resources can help to effectively alleviate this situation. Thus, the activity degree
of each physical sensor node is:
where
u represent the number of virtual nodes on the physical node,
,
is the physical node mapped successfully, and
denotes the amount of hops among the source nodes with the sink node.
After the virtual node is successfully mapped to the physical node, a physical communication route to the sink node will be found for the physical sensing node. To improve the survivability of the virtual sensor network, the backup strategy of passive recovery is adopted for the underlying physical links. Compared with active mapping, which allocates an end-to-end backup route for every last virtual request link, passive mapping performs link remapping only when a link fails.
Due to the complexity of the path selection algorithm, the remapping of faulty links leads to a considerable delay, generating damage in user data. To enhance the service experience of users, and on the basis of the shortest path algorithm, a multi-path selection algorithm is proposed in this paper. Before the virtual sensor network request arrives, the multi-path selection algorithm is used to calculate the backup paths for every last underlying link, construct a backup routing set and shorten the link remapping delay. The multi-path selection algorithm considers multiple resource constraints in the specified path hops and the link mapping process contrasts the shortest path algorithm. By searching each physical link, it finds multiple paths that meet the constraints and forms a backup route set.
When the underlying physical link fails, a backup path must be provided for the virtual link to ensure service continuity. The backup path has the same source node as the faulty link. Due to the connectivity of the network, a virtual link has multiple backup routes to option from. On the underlying physical network, each additional hop consumes a greater bandwidth and introduces greater delay. Therefore, hop counts are used as an indicator to measure the merits of a backup path, and the paths that meet the hop count standard are included in the backup route set as follows:
We define a function , then, this function represents the path set that has the same source node as a physical link , does not intersect with the link , and hops from the source node to the sink node through .
Therefore, the backup route set meeting the conditions can be defined as . This function represents the set of all paths that have the same source node as a link , are disjointed with the link , and can reach the sink node from the source node within a specified h hop.
4.2. Link Survivability Probability Model
When the underlying physical link fails, whether the virtual link can be successfully remapped depends on the resource status of the backup route set of the underlying physical link. If the paths of the backup route set have enough available resources and are in good working status, the probability of successful remapping is high when a link fails. If the backup route set does not have enough resources to reroute traffic for the underlying link, the probability of successful rerouting of the underlying link is low. Therefore, during link mapping, mapping critical links to the underlying links of the backup routing set with a good resource status will improve the recovery rate of link faults.
Define the probability of survival of a physical link
and indicate the probability of recovery by remapping when a link fails. During link mapping, the link survival probability
is calculated to select the physical communication path with a higher survival probability and to boost the link survivability of virtual sensor network mapping. The size of
depends on the relationship between the remaining communication link resources
in the backup route set of a physical link
and the used communication link resource
. If
is much larger than
, when the physical link
fails, its backup routing set can meet the re-routing requirements of the physical link
, that is, the survival probability of the physical link
is high.
and
are calculated as follows:
where
represent the virtual link, and
is mapped to the physical link
.
and
denote the physical link
which carries the active bandwidth required by the virtual link and the standby bandwidth used for link remapping, respectively;
is the sum of those.
indicates the minimum bottleneck bandwidth of each path in the path set that can be used for link remapping. When the underlying physical link
fails and the available communication link resource
of a standby path of the physical link
is much greater than the used communication link resource
of the physical link
, the fault recovery rate of the physical link
is 1. Otherwise, the fault recovery rate of the physical link
is 0. Therefore, the normalized link survival probability
is defined as:
According to the backup route set constructed, before virtual sensor network mapping, the backup link set
with a hop limit of
h hops is calculated for the physical link
. Each backup path
in
x provides the remapping service for physical links. Therefore, the survival probability
of the underlying physical link
is calculated as follows:
If the backup link set of the physical link is empty, the link survival probability is 0 because no backup link can offer rerouting for the physical link . When the network request for the virtual sensor is achieved, the value of the update will be calculated first to provide a more accurate probability value for the virtual network mapping.
4.3. Link Remapping
The pseudo-code of the link failure-oriented survivable virtual sensor network mapping algorithm is shown in Algorithm 1. When the virtual sensor network reach, select the physical node to be mapped based on node activity , and then map the virtual node to the physical node. Then link mapping is performed and the backup routing set of physical link is calculated based on the multi-path selection algorithm. If the physical link is not faulty, the link with the highest survival probability is selected for mapping based on the link survival probability model. If the physical link fails, the statistics are influenced by the physical link set of virtual links, and the virtual link request link resources in descending order will result in the collection and calculation of the balance link resources, virtual link, in turn, heavy mapping in the link from the collective resources to balance the route of the largest.
When the underlying link fails, the link remapping algorithm is used to reroute the traffic from the faulty to the backup link set. Because one underlying link may carry multiple virtual requests, the failure of one underlying link will cause multiple virtual requests to be unavailable. The remapping algorithm is used to migrate the traffic of the virtual requests affected by the fault. However, if the backup route of the physical link cannot restore all the virtual links, some virtual requests still cannot run normally, which will result in a penalty. To minimize the loss of the underlying facility provider, the virtual links that generate more penalties should be remapped preferentially during link remapping. Based on this, the link resource balance degree is defined as:
where
and
indicate the minimum and maximum of the remaining real-time backup communication link resource links of physical path
,
is any path in the backup routing set of faulty link
. The link resource degree of equilibrium is applied to equilibrium for the link resource consumption of physical links and lessens the feasibility of resource debris. The larger the link resource balance is, the less likely the resource fragmentation is to occur, thus improving the utilization of physical resources.
| Algorithm 1 Survivable virtual sensor network mapping algorithm for link failure |
| Input: , ; |
| Output: Mapping results |
| 1: for each virtual network request do |
| 2: for virtual network requests virtual nodes do |
| 3: Select a mapping node based on node activity |
| 4: end for |
| 5: Calculate a backup routing set of physical link based on the multipathing selection algorithm |
| 6: if the physical link is not faulty during virtual link mapping then |
| 7: According to the link survival probability model, the link with the highest survival probability is selected for mapping |
| 8: end if |
| 9: if the physical link is faulty then |
| 10: The system collects statistics on the set of virtual links impacted by physical link and sorts the link resources requested by the virtual links in descending order. The result is saved to set |
| 11: for the physical link is faulty do |
| 12: Backup routing set based on the physical link |
| 13: for set of all paths do |
| 14: The link resource balance degree is calculated, and the virtual links in set are successively remapped to the path with the largest link resource balance degree |
| 15: end for |
| 16: end for |
| 17: end if |
| 18: end for |
| 19: return |


