Article

Millimeter-Wave Dual-Band MIMO Channel Capacity Analysis Based on Climate Data: A Samsun Province Case Study

1
Department of Electrical and Electronics Engineering, Samsun University, Samsun 55420, Turkey
2
Department of Electrical and Electronics Engineering, Ondokuz Mayıs University, Samsun 55139, Turkey
3
SenComm Research Lab, School of Engineering, Ulster University, Belfast BT15 1AP, UK
*
Author to whom correspondence should be addressed.
Electronics 2023, 12(10), 2273; https://doi.org/10.3390/electronics12102273
Submission received: 26 April 2023 / Revised: 13 May 2023 / Accepted: 15 May 2023 / Published: 17 May 2023

Abstract

:
The analysis of multiple-input multiple-output (MIMO) channel capacity is important for developing and optimizing high-speed wireless communication systems that can meet the growing demand for data-intensive applications. This study aims to analyze the 4 × 4 MIMO channel capacity of outdoor urban and rural environments using the NYUSIM simulator. The channel models are designed for 28 GHz and 39 GHz frequencies for both line-of-sight (LOS) and non-line-of-sight (NLOS) conditions. Realistic channel models are simulated using annual climate data collected in Samsun province, Turkey in three different environments: urban microcell (UMi), urban macrocell (UMa), and rural macrocell (RMa) areas. According to the annual average channel capacity analysis, it is observed that there is a very small capacity difference between UMi and UMa areas at 28 GHz and 39 GHz frequencies in the LOS region, while the RMa area is found to have a very low capacity compared to the UMi and UMa areas. The channel capacity for RMa is found to be approximately eight times smaller than UMi and UMa. In the NLOS region, channel capacities decrease significantly (between 312 and 3953 times) compared to the LOS region, with the UMa area having the greatest capacity and the UMi area having the lowest capacity. Compared to the UMi channel capacity, the RMa channel capacity is 1.36 times higher for 28 GHz and 1.28 times higher for 39 GHz. When the monthly changes in channel capacity are examined, it is discovered that the amount of precipitation has the greatest impact on channel capacity, and the capacity decreases as the rain rate increases. The highest correlation between channel capacity and rain rate was −0.97 for RMa, with a 28 GHz frequency and LOS conditions. Additionally, it becomes clear that channel capacities increase in the summer months as the temperature rises and humidity and pressure fall.

1. Introduction

The rapid development of technology and the corresponding need for data rates have begun to be met with fifth-generation (5G) mobile wireless technology and have motivated the development of a sixth-generation system, 6G. While 5G is still being rolled out, researchers and engineers are already working on 6G to build on the capabilities of 5G and address the limitations that come with it. The 6G system is expected to be even faster and more reliable than the 5G system, with data transfer speeds of up to 1 terabyte per second and latency as low as 1 microsecond. This technology is expected to enable new use cases and previously impossible applications, such as ultra-high-definition immersive virtual reality, real-time remote surgeries, and autonomous vehicles.
Increasing numbers of users, data requirements, and mobile traffic have resulted in much higher data speed requirements for communication. Thanks to smart home technologies, it is now possible to communicate between mobile phones or PCs and home appliances such as air conditioners, refrigerators, and ovens. The Internet of Things (IoT) (augmented reality (AR), medical imaging, virtual reality (VR), etc.), cloud technologies, high-definition multimedia, and other requirements have increased the need for communication between people and devices. As a result, every advancement in the communication channel generates new bits, generating new performance requirements. It has been demonstrated that the existing infrastructure is incapable of meeting the demands of this rapidly evolving technology. The ITU has identified new frequency regions in extreme high-frequency (EHF) zones, since sub-6 GHz frequency regions, such as radio frequencies, mobile communication, satellite, Wi-Fi, and TV frequencies, cannot provide sufficient bandwidths for 6G systems. The millimeter-wave (mmWave) frequency region has been chosen due to its unlicensed use, atmospheric effects, and its ability to provide wide bandwidths. Different studies on the scope of MIMO and the mmWave band have been performed relating channel modeling [1,2,3,4], channel measurements [5,6,7,8], estimation methods, and the use of AI for path loss prediction [9], technologies which are being developed to overcome emerging communication challenges related to future wireless networks. The summary of these studies is provided in Table 1.
The mmWave is also a good candidate for military and civilian satellite communication systems applications, attracting great attention [10,11,12,13]. Compared to previous-generation communication technologies, 6G is expected to provide very high data rates, higher capacity, and ultra-low latency. Sixth-generation technologies have the potential to provide data transfer rates of 100 Gbps–1 Tbps by utilizing the 30 GHz–300 GHz frequency band with a multi-band system [14]. However, the transition to this new technology is not without challenges. MIMO technologies, which have smaller antenna sizes and a greater number of antennas, will see new developments in both production and software. Furthermore, by using the EHF region, signal strengths will decrease and communication distances between antennas will be reduced. Because mmWaves are highly affected by atmospheric attenuation, the communication quality in 6G systems will be greatly affected depending on the weather. All of this will make it impossible to use the old channel models that served as the foundation for communication, necessitating the development of new channel models. Channel modeling for 6G systems is still challenging, as these systems are highly weather-sensitive and require a direct line of sight (LOS) [15]. The search for the best channel models is ongoing, and communication simulators can be used to examine different channel models in mmWave communication, compare their performance, and investigate their behavior under various conditions. Various simulation programs have been used in the literature to evaluate channel models for mmWave communication. SANSA is a channel model simulator for multi-antenna communication that models existing infrastructures in three dimensions and was developed in 2017 [16]. QuaDRiGa generates realistic channel impulse responses at the system level [17]. WinProp simulates electromagnetic wave propagation and can implement various communication scenarios, including indoor, outdoor, and vehicle communication [18]. NYUSIM was developed in 2017 by NYU Tandon’s School of Engineering [19] and was updated in 2019 to create double-selective channels [20].

1.1. Related Work on NYUSIM

When the studies in the literature were examined, it was discovered that channel modeling simulation programs such as SANSA, QuaDRiGa, WinProp, and NYUSIM have been evaluated in various studies [21,22]. Several studies compared NYUSIM channel models to those of the Third Generation Partnership Project (3GPP) [23,24,25,26]. NYUSIM has been widely used in the literature for channel modeling, generating power delay profile (PDP) and path loss outputs, with many studies varying the channel parameters [27,28,29]. These studies have been conducted at various frequencies, including 28 GHz [30], 38 GHz [31], 73 GHz [32], and combinations of different frequencies [33,34]. In [35], comparisons of channel models were made in different environmental scenarios.

1.2. Research Gaps of Previous Work on Channel Capacity Based on Climate Data

According to the literature review, channel capacity analysis is widely used to evaluate channel performance. In a study, the performances of Rician and Rayleigh channels, depending on the number of antennas, were evaluated by calculating the channel capacity [36]. In another study, the performances of LOS and NLOS channels for 3.5 and 28 GHz were evaluated by capacity analysis [37]. In [38], comparisons of WINNER and Weichselberger channel models mentioned in the literature were performed with the same method. The NYUSIM program was used to conduct capacity analyses for various scenarios. The effects of different antenna arrays and polarization on channel capacity were investigated in a study [39]. Another study compared channel capacities at various frequencies and rain rates [40], while another study examined the effect of atmospheric parameters on path loss at different frequencies [41]. Some studies showed the impact of temperature [42,43], rain rate [44,45], humidity percentage [42], and barometric pressure [46] on the channel. Another study investigated the effects of transceiver distance, temperature, and humidity on received power for different frequencies [47]. A study also examined the effect of humidity on the channel [48]. Similarly, annual rainfall data were collected in the Malaysian region, and the impact of rainfall on the channel was investigated [49]. The effects of 28 GHz and 73 GHz frequencies, the number of transmitting and receiving antennas, and LOS/NLOS parameters on channel capacity were investigated using the NYUSIM channel simulator [50].
Table 2 shows previous studies in the literature and a comparison of them with the proposed study. Some important studies using NYUSIM, similar to the proposed study, are listed in the table. One study conducted simulations using real-world measurements but only evaluated annual rain data for a single scenario without any comparison. Many studies did not use real-world measurements but evaluated climate data at intervals allowed by the simulation program. Some studies evaluated the effects of frequency on the channel, while others assessed the impact of distance on the channel using path loss, received power, and outage probability analysis. Many studies did not investigate climate variables but instead included channel parameters such as frequency, LOS/NLOS condition, distance, and the number of antennas. In contrast, this study used climate data based on real field measurements and created various environmental scenarios. The simulation program evaluated the effects of climate data and various other channel parameters by assessing LOS/NLOS states with different frequencies and distances.
In addition, we are proposing a hybrid approach by integrating channel data (based on channel impulse response) generated by the NYUSIM simulator and real-world climate data collected in Samsun province, Turkey. This approach can overcome challenges associated with long-term measurement-based studies in similar scenarios, such as measurement setup (e.g., channel sounding system, antennae, link distance, etc.), data collection, and synchronization of climate and channel data during harsh environmental conditions (e.g., rain, wind, and snow) [49], while providing baseline results. Considering that no detailed climate data-dependent study is available for Samsun province, this approach can provide a baseline to understand channel capacity local to the area and build further analysis for upcoming 5G/6G deployment in Turkey. In addition, this hybrid approach can be used in other countries or regions to analyze, test, develop, and evaluate the performance of wireless communication systems based on local climate data.

1.3. Contribution of This Paper

Calculating the MIMO channel capacity is important to determine the theoretical upper limit of the data rate that can be achieved over a wireless communication link using MIMO technology. Channel capacity is a key feature of MIMO and is heavily influenced by changes in channel parameters between the transmitter and receiver. The MIMO communication channel capacity depends on the number of transmitting and receiving antennas, the signal-to-noise ratio (SNR), and the channel state. Changes to any of these sub-systems can significantly impact the channel capacity. The MIMO channel capacity is essential for designing efficient systems and optimizing the available bandwidth. Real-time climate data is important for accurate and reliable MIMO channel capacity analysis, which is crucial for designing and deploying efficient and reliable wireless communication systems. This study focuses on factors that may affect the MIMO channel capacity, such as frequency, LOS/NLOS, transceiver distances, and climate parameters. Locations were selected to simulate the UMi, UMa, and RMa channels in three different Samsun districts. The climate parameters of the locations were obtained from Samsun Meteorology’s 10th Regional Directorate. The effects of climate parameters (e.g., rain rate, humidity, pressure, and temperature), LOS/NLOS, and frequency on MIMO channel capacity were determined using the NYUSIM simulator. The main contributions of this study can be summarized as follows:
  • We proposed a hybrid approach by integrating channel data (based on channel impulse response) generated by the NYUSIM simulator and real-world climate data collected in Samsun province, Turkey to understand channel capacity local to the area. In addition, this hybrid approach can be used to get early or baseline results in other countries or regions to analyze, test, develop, and evaluate the performance of wireless communication systems based on local climate data.
  • The MIMO channel capacities were calculated using annual climate data and realistic channel models for urban microcell (UMi), urban macrocell (UMa), and rural macrocell (RMa) areas.
  • The effects of 28 GHz and 39 GHz frequencies and both line-of-sight and non-line-of-sight conditions on channel capacity have been studied in detail.
  • The channel models were designed for 28 GHz and 39 GHz frequencies and both line-of-sight (LOS) and non-line-of-sight (NLOS) conditions.
  • It was determined which of the rain rate, temperature, humidity, and pressure parameters had the greatest effect on the channel capacity.
  • The results obtained in this study can assist system designers in analyzing the performance of MIMO systems, determining the maximum data rate that can be supported under different channel conditions, and optimizing system parameters to achieve the desired performance.

2. Background

Wireless communication basically consists of a transmitter, a receiver, and a channel. The channel can vary depending on the communication type, location, and external factors, but it comprises pulse response and noise. Various factors, such as fading, reflection, interference, and scattering, affect the communication quality within the channel. Additionally, free space propagation and atmospheric effects can cause distortions. All these factors contribute to forming a multipath channel in the receiver. The signal received is the sum of all the delayed incoming signals from different paths, resulting in corruption. An example channel created using NYUSIM is shown in Figure 1. Figure 1 was obtained with NYUSIM for 28 GHz UMi LOS conditions with a 200 m transmitter and receiver distance. The figure depicts these distorted signals with their delay and attenuation. In the communication between the fixed location transmitter and receiver, signals with varying delays and strengths reaching the receiver caused channel distortions.
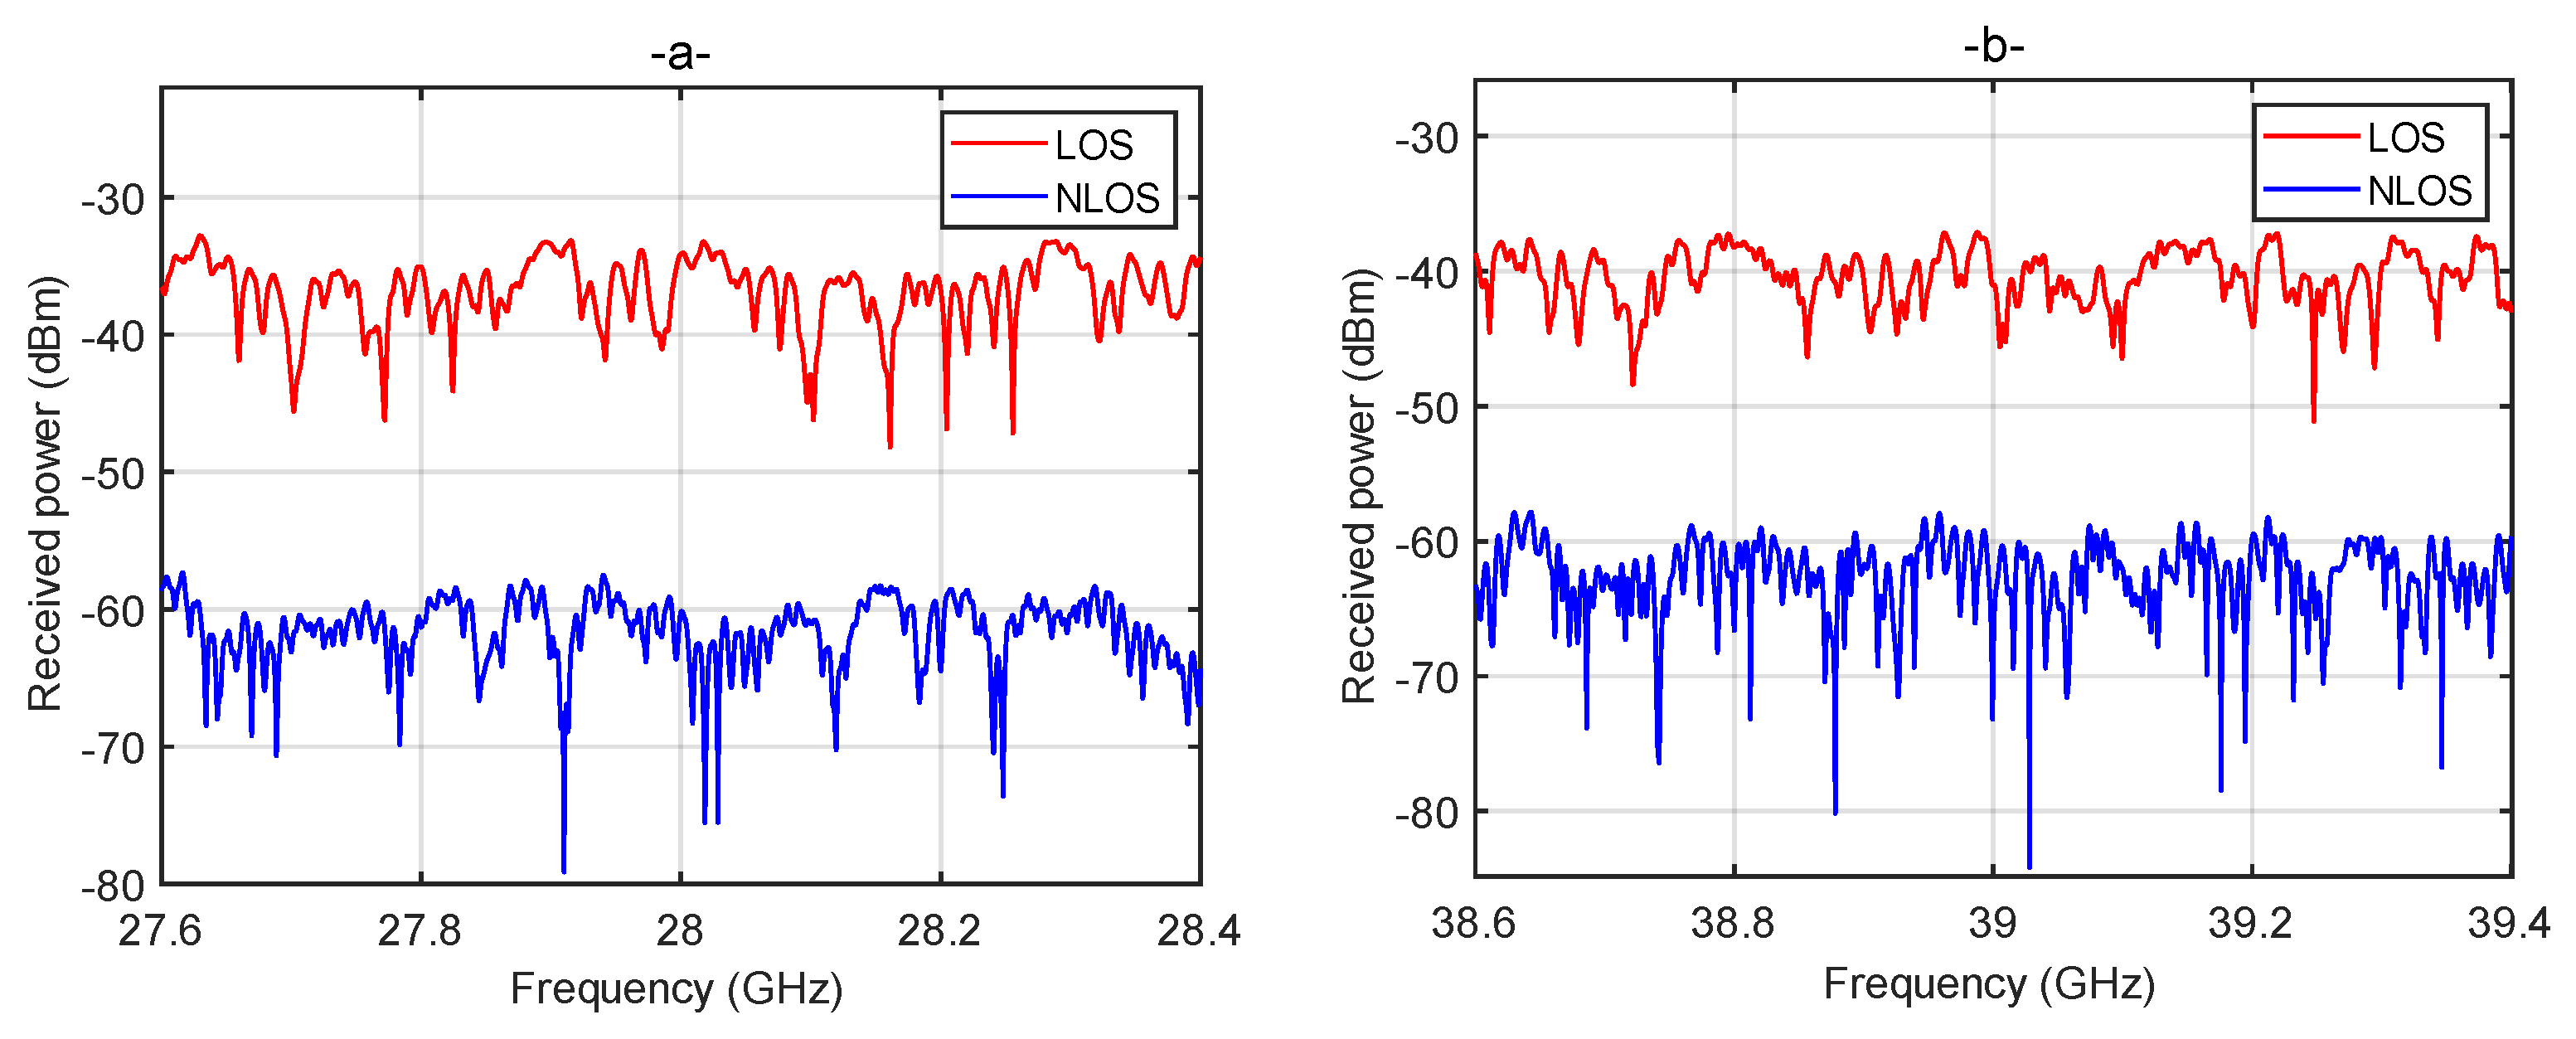
An example of the channel frequency response of a channel created with NYUSIM is given in Figure 2. As seen in Figure 2, there are different attenuation (fading) values at different frequencies, which can be classified into two main categories: flat fading and selective fading. Flat fading occurs when the attenuation and phase shift of the signal are constant across the bandwidth of the channel, and all frequency components of the signal experience the same amount of attenuation and phase shift. Flat fading typically occurs in line-of-sight (LOS) scenarios or when the signal passes through a small-scale, stationary, and homogeneous environment. Selective fading occurs when different frequency components of the signal experience different amounts of attenuation and phase shift. This usually happens in non-line-of-sight (NLOS) scenarios or when the signal passes through a large-scale, non-stationary, and heterogeneous environment. Understanding the frequency-domain properties of flat and selective fading is important for designing robust wireless communication systems that can operate reliably in various environments.
In wireless communication, fading can also be classified as fast or slow depending on the rate of change in the channel. Fast fading occurs when the wireless channel changes rapidly over time, typically due to multipath propagation. Slow fading occurs when the wireless channel changes slowly over time, typically due to changes in the environment or the movement of the transmitter or receiver. Slow fading refers to a channel occasionally affected by high buildings and environmental factors. When these disruptive effects change quickly within the channel, the channel is referred to as fast fading. The Rayleigh and Rician distributions are used to model this fading. When many objects cause the radio signal to scatter, Rayleigh fading is a reasonable model. Furthermore, if there is an NLOS path between the receiver and transmitter, Rayleigh fading can be used. When there is a dominant LOS path between the receiver and transmitter, Rician fading is more appropriate. The fading statistics of mmWave channels are expected to deviate more and more from the Rayleigh distribution to the Rice distribution as system bandwidth increases.
Communication systems can be expressed by Equation (1).
y t = x t h ( t ) + n ( t )
Here, y denotes the received signal, x denotes the transmitted signal, h represents the communication channel, and n represents the zero-mean Gaussian noise in the time domain. The channel matrix formed by an nxn MIMO communication is expressed by Equation (2).
H N x N = h 11 h 12 h 21 h 22 h n n
The channel between the first transmitter and the first receiver in a MIMO channel is represented by h11. Similarly, h12 represents the channel between the first transmitter and the second receiver, and h21 represents the channel between the second transmitter and the first receiver. This method represents as many channels as the number of antennas in the receiver and transmitter. With HNxN, the combination of all of these channels is expressed as a matrix representation. Each sub-channel of this matrix will be created with the NYUSIM simulator according to the parameters used in this study, and their analyses will be performed using Equation (2).
Attenuation effects at high frequencies are one of the significant challenges for communication. When the transmitted power and gains are kept constant, the increase in frequency and distance results in significant distortions in the received signal. As the frequency increases significantly, the distance cannot increase or remain stable in the mmWave region. Therefore, mmWaves are unlikely to be used in long-distance communications. Another attenuation effect is that mmWaves have difficulty penetrating objects such as house walls. Because the objects are subjected to significant attenuation, reducing the NLOS lines while increasing the LOS lines is necessary, thereby increasing the number of antennas. Atmospheric damping is particularly important in this frequency band. This study observed that atmospheric damping has an attenuation effect throughout the extremely high-frequency region, and we attempted to determine the usable frequency ranges for 6G and subsequent systems based on these effects [51]. In mmWave frequency bands, atmospheric attenuation is primarily due to molecular absorption, which occurs as a result of signal energy being absorbed by atmospheric gases such as oxygen and water vapor. While atmospheric attenuation is a challenge for mmWave communication at higher frequencies, the use of frequencies such as 28 GHz and 39 GHz can help mitigate atmospheric attenuation effects and enable reliable communication over short to medium distances.

2.1. NYUSIM Channel Simulator

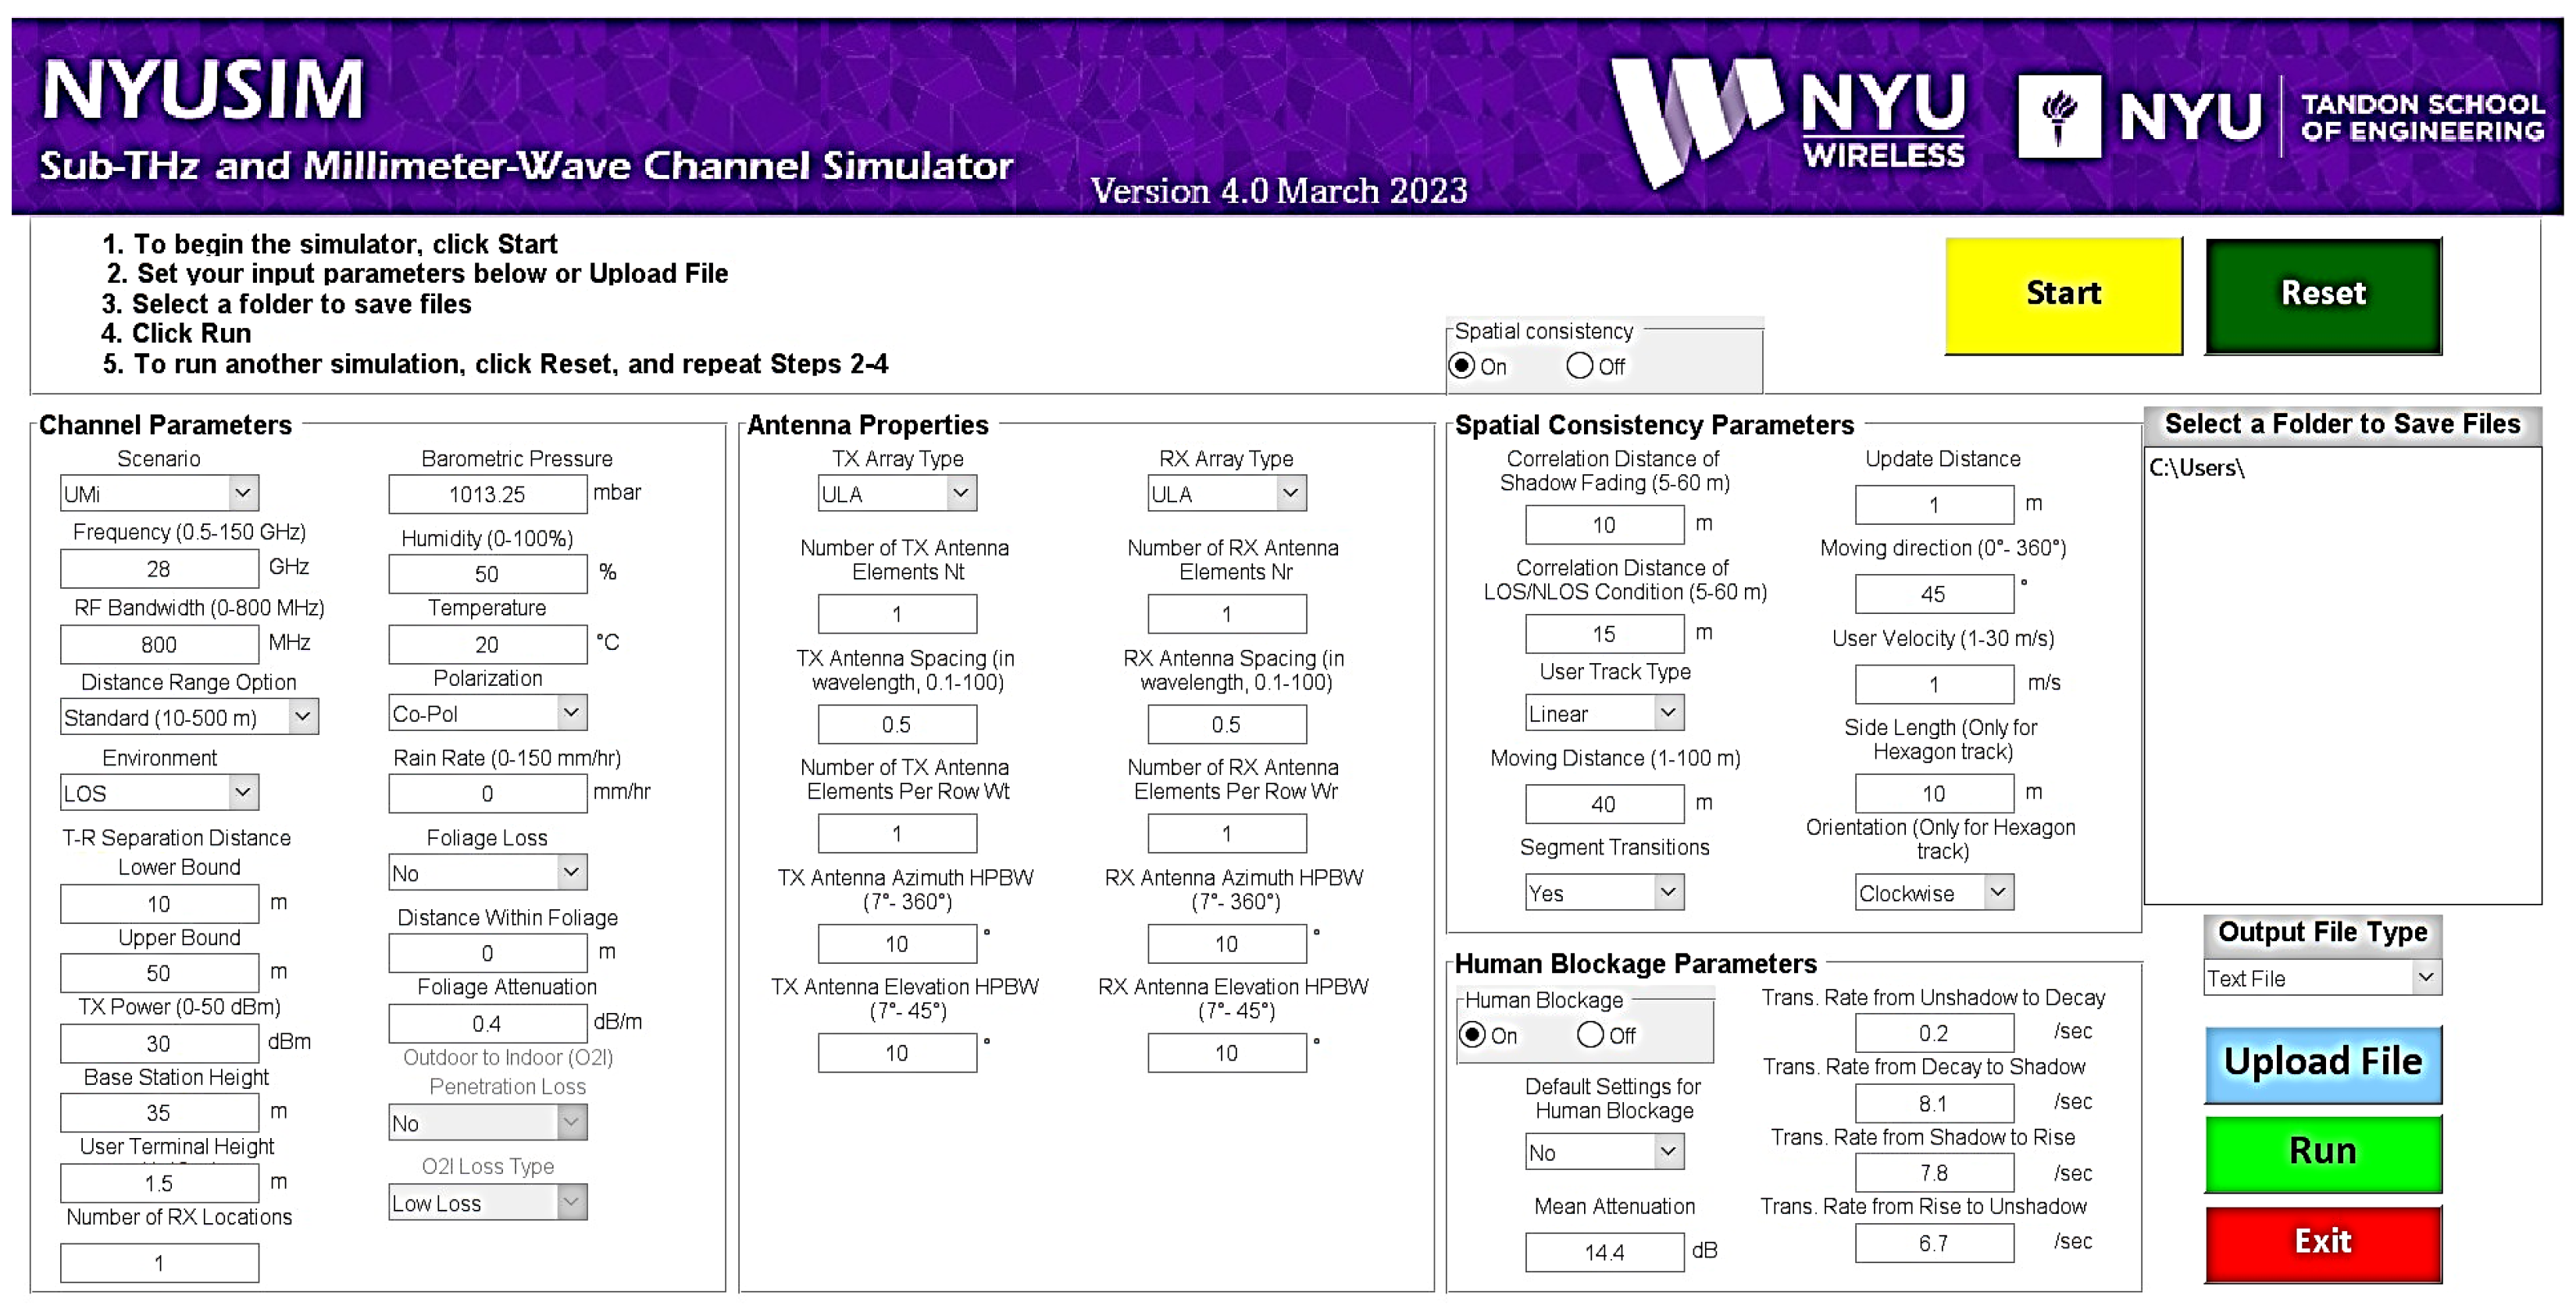
NYUSIM simulates wireless channels for a wide range of applications, including MIMO systems, mmWave communication systems, and vehicle-to-vehicle communication systems. NYUSIM is a widely used channel simulator that provides accurate and flexible wireless channel modeling for a wide range of applications. NYUSIM provides realistic modeling of wireless channels by considering a wide range of factors, such as the propagation environment, antenna characteristics, and spatial correlation. Compared to other simulators (e.g., SANSA, QuaDRiGa, WinProp), NYUSIM offers several advantages including accurate modeling of wireless channels, measurement-based models, a broad range of frequencies, realistic antenna models, and open-source code, making it a popular choice for researchers working in the wireless communication field to simulate and evaluate the performance of desired scenario. The NYUSIM channel simulator was created in 2017 as a MATLAB GUI file and made available for open access. The NYUSIM channel simulator interface is given in Figure 3. In this study, version 3.1 of the NYUSIM simulator was used. The NYUSIM channel simulator performs Monte Carlo simulations. In this study’s spatial coherence off mode, the simulator generates a time-selective channel with delayed and fading reflections independent of channel Doppler shift. NYUSIM uses statistical spatial consistency models (SSCM) based on 28 GHz–73 GHz measurements in various outdoor scenarios. For these reasons, the NYUSIM simulator creates random channel models. The channel model uses the concepts of time clusters (TC) and spatial lobes (SL) to create a channel impulse response (CIR) by dividing time and spatial statistics. TCs consist of a multipath carrier (MPC) that moves closely in time and may arrive from various angular directions in a short frame of over-delay time. The TCSL approach extracts TC and SL statistics by implementing a physically based clustering scheme derived from field observations. When creating power delay profiles (PDF), the Rician distribution model is used.
The NYUSIM simulator has channel parameters that can be adjusted based on the type of environment where the communication occurs. The three environment types are urban microcell (UMi), urban macrocell (UMa), and rural macrocell (RMa). The frequency is one of the most important parameters, ranging from 500 kHz to 100 GHz. Therefore, this channel emulator can simulate the mmWave band used in 6G. The distance between the transmitting and receiving antennas can be adjusted by selecting the distance range and upper-lower limit options. Bandwidth can be adjusted up to 800 MHz. The environmental adjustment option allows for changing the LOS/NLOS status.

2.1.1. Path Loss Model

The close-in free space reference distance (CI) path loss model used by NYUSIM, also known as the large-scale path loss model, is expressed in Equation (3); this model varies at a distance of one meter and depends on various atmospheric conditions. NYUSIM uses both the CI parameter and the path loss exponent to ensure greater stability under different environmental conditions.
P L C I f , d = F S P L f , 1 m d B + 10 n log 10 d + A T d B + X σ
The path loss exponent is represented by n, which is set to two for free space. The distance between the transmitter and the receiver is represented by d. Xσ is known as shadow fading. This value is modeled as a log-normal random variable with a standard deviation of one dB and a mean of zero. Equation (4) expresses the free space path loss (FSPL) with a reference distance of one meter.
F S P L f , 1 m d B = 20 log 10 4 π f × 10 9 c
Here, f is the carrier frequency in GHz and c is the speed of light. Equation (5) depicts atmospheric attenuation, where α represents the attenuation coefficient regarding air dryness, humidity, rain, oxygen, and steam.
A T d B = α d B / m + d m
The strength of the received signal is directly related to the Friis equation and is related to the path loss, as shown in Equation (6) [52].
P r d B m = P t d B m + G t d B + G r d B + P L [ d B ]
Here, P t denotes transmitting antenna power, while G t and G r denote transmitting and receiving antenna gains, respectively. The mean path loss is denoted by P L .
NYUSIM determined the maximum possible P L for channels modeled for distances less than 500 m to be 190 dB. This value was calculated using real field measurements.

2.1.2. MIMO-OFDM

The channel capacity of MIMO-OFDM depends on several factors, including the number of transmitting and receiving antennas, the channel conditions, the amount of available spectrum, and the wireless environment. It is more convenient to calculate capacity with the entire frequency range at once rather than separately performing analysis for each reflection. Equation (7) is used in the NYUSIM simulator to estimate the channel coefficient of each MIMO-OFDM subcarrier.
h m , k ( f ) = p α m , k , p e j Φ e j 2 π f τ e j 2 π d T m s i n ( ) e j 2 π d R k s i n ( φ )
Here, m represents the transmitting antenna, k represents the receiving antenna number, and f represents the subcarrier frequency.
In NYUSIM, multipath components with powers less than −160 dBm are ignored for the standard distance range option (this threshold is used for all environments). Specified significant multipath components are denoted by p. α represents the antenna gain amplitude, Φ represents the phase of each multipath component, τ represents the reflections delay, and d T and d R represent the distance between each antenna in the antenna groups. ∅ and φ also represent the antennas’ departure and arrival azimuth angles (AOD, AOA). The resulting h m , k matrix is used as the channel matrix.

2.2. MIMO Channel Capacity

The capacity of a communication channel is the maximum rate at which information can be reliably transmitted over the channel. Channel capacity analysis can assess the impact of the communication channel on communication quality. Channel capacity is expressed as Shannon capacity in single-input, single-output (SISO) systems, as shown in Equation (8).
C = W log 2 ( 1 + S N R )
Here, C represents the capacity in b/s/Hz, W represents the channel bandwidth, and SNR represents the signal-to-noise ratio.
The maximum data rate of a channel is proportional to the channel’s bandwidth and SNR. The extremely high-frequency region was established to support wider bandwidths. The SNR can be increased by boosting the received power ( P R ), which is governed by the Friis transmission.
Although improving other parameters affecting the received power is possible, such improvements are usually limited. One way to significantly boost the received power is by using multiple-input multiple-output (MIMO) technology. MIMO is a technology that uses multiple antennas on both the transmitter and receiver sides of a communication system to improve the quality and capacity of wireless communication. With MIMO, the power received by a user can be exponentially increased for each communication channel. MIMO-OFDMA (orthogonal frequency division multiple access) technology has been identified as the key communication technique for 6G systems, as it can support high data rates, low latency, and efficient use of the available spectrum.
The channel capacity for MIMO channels is calculated theoretically by comparing the transmitter ( N t ) and receiver ( N r ) numbers and multiplying the SISO capacity by the smaller of the two. However, it is not a realistic approach under real-world conditions. Equation (9) has been used to replace the capacity formula for MIMO channels.
C = B log 2 [ d e t ( I m + S N R . H . H ) ]
Here, H denotes the channel matrix and H denotes the conjugated transpose of the channel matrix. The identity matrix with dimensions N t × N r is represented by I m .
The channel capacity of a MIMO system is a function of the number of antennas at the transmitter and receiver, the channel matrix, and the signal-to-noise ratio.
The capacity analysis in the frequency domain was carried out in this study according to Equation (10).
C = 1 N 1 N log 2 1 + S N R . λ i 2
Here, λ i 2 represents the eigenvalues of the H H matrix.
Capacity analysis can be carried out in either the time or frequency domain. Analyzing each delayed signal, capacity can be calculated in the time domain. It is possible to calculate capacity in the frequency domain by analyzing all OFDM subcarriers, and this method was used in this study.

3. Simulation Setup

The MIMO channel capacity can be affected by a variety of factors related to the transmission medium and climate parameters. The analysis of MIMO channel capacity should consider these factors to accurately predict the system’s performance under different conditions and optimize the system’s design for maximum capacity and efficiency. This study investigated the effects of rain rate, barometric pressure, humidity, temperature, and frequency on 4 × 4 MIMO channel capacity using the NYUSIM channel simulator for LOS/NLOS conditions. The analysis calculated the capacities of the channels created with NYUSIM at 28 GHz and 39 GHz frequencies. Since the 28 GHz band (also referred to as the n257 band) is widely used in trials and tested as a 5G NR band and the 39 GHz band (also referred to as the n260 band) is also considered as a potential band, MIMO channel capacity analyses were performed for both 28 GHz and 39 GHz frequencies in this study. As the NYUSIM channel modeler produces a random model, each scenario is repeated 2000 times, and the result is obtained by averaging the capacity of each channel produced. Table 3 outlines the parameters used in the simulations.
This study used climate data from the observation networks located in the Atakum, Bafra, and Ondokuzmayıs districts of Samsun province. These regions have been selected in order to simulate the type of communication mediums as UMi, UMa, and RMa. The environment types in Samsun city were adjusted according to the NYUSIM scenarios, and three different scenarios were analyzed: UMi for Atakum, UMa for Bafra, and RMa for Ondokuzmayıs. For simplicity, in the rest of this paper, simulation environments UMi, UMa, and RMa will be used instead of Atakum, Bafra, and Ondokuzmayıs districts, respectively. The locations of the observation networks in each of the three districts are marked with an asterisk in Figure 4. Detailed information about the stations can be found at [53]. Rain rate, temperature, humidity, and barometric pressure values measured for each day in 2021 were used in NYUSIM simulations. For the simulation results, the measurement points of the climatic parameters taken by the Samsun Meteorology 10th Regional Directorate were used to create the scenarios. The bandwidth was set to 800 MHz. The environmental adjustment option allows for changing the LOS/NLOS status. The user and base station heights were set at 15 m and 1.5 m, respectively.
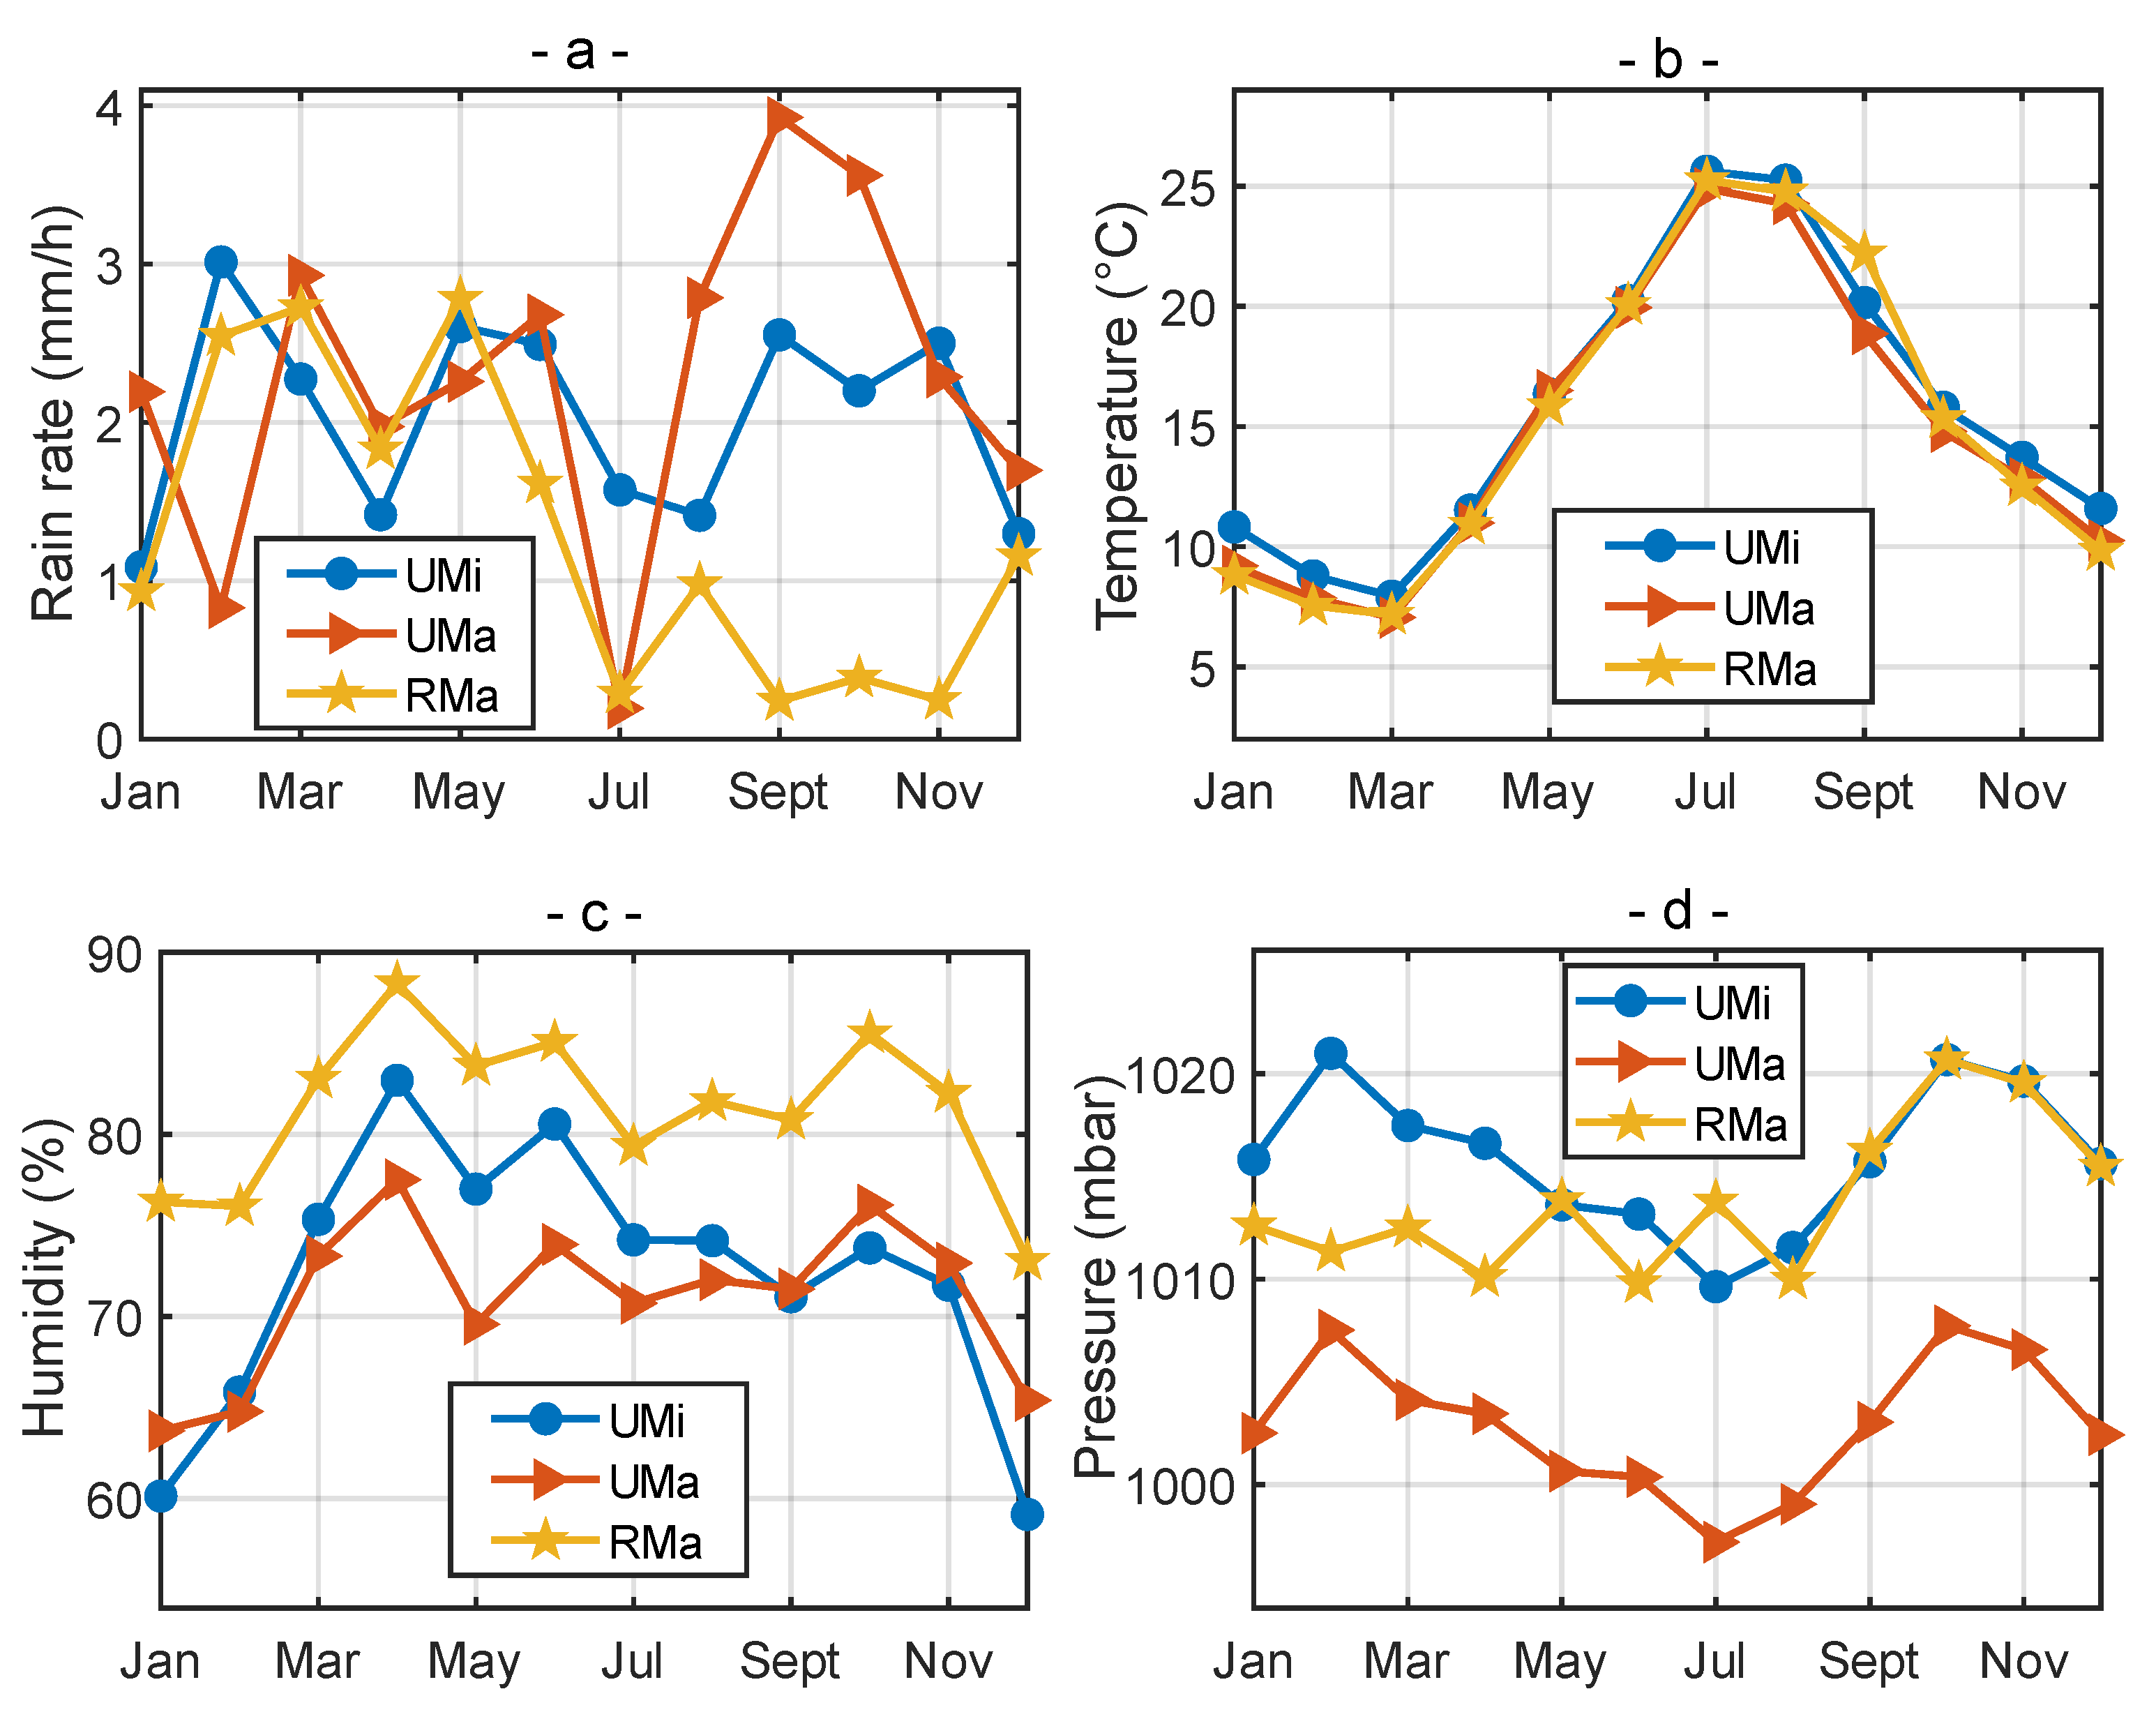
Using real-time climate data for MIMO channel capacity analysis is important because environmental factors, including climate conditions such as rain rate, temperature, humidity, and barometric pressure, heavily influence the wireless channel. The performance of wireless communication systems can vary significantly depending on the current weather conditions; therefore, accurate climate data is essential for reliable and accurate MIMO channel capacity analysis. The Meteorology Directorate’s measurement points of climatic parameters were used to create the scenarios for the simulation results. Rain rate, temperature, humidity, and barometric pressure data recorded by the Meteorology Directorate are taken as monthly averages, and their changes during the year are shown in Figure 5. In the figure, UMi’s measurements are represented by a blue line with a circle mark, UMa’s measurements are represented by a red line with a triangle mark, and RMa’s measurements are represented by a yellow line with a star mark.
Correlation coefficients between climate parameters for UMi, UMa, and RMa are given in Table 4. The correlation coefficient between the temperature values at the measurement locations is the highest recorded, with a value of 0.99. Similarly, there is a high correlation coefficient value of 0.99 between the pressure values of UMi-UMa locations. It can be said that there is a high correlation between humidity values (0.86–0.93) at measurement locations. The lowest correlation is between rain rate values at measurement locations.
The statistical evaluations of the climate parameters for the three regions are given in Table 5. The annual average rain rate for the UMi region is 2.03 mm/h, with an average temperature of 15.65 °C, an average humidity of 72.16%, and an average pressure of 1015.98 mbar. The average rain rate for the UMa region is 2.27 mm/h, with an average temperature of 14.78 °C, an average humidity of 70.96%, and an average pressure of 1002.93 mbar. For the RMa region, the rain rate is 1.31 mm/h, with an average temperature of 15.02 °C, an average humidity of 81.29%, and an average pressure of 1013.82 mbar.

4. Results and Discussion

4.1. Capacity Analysis Results for UMi

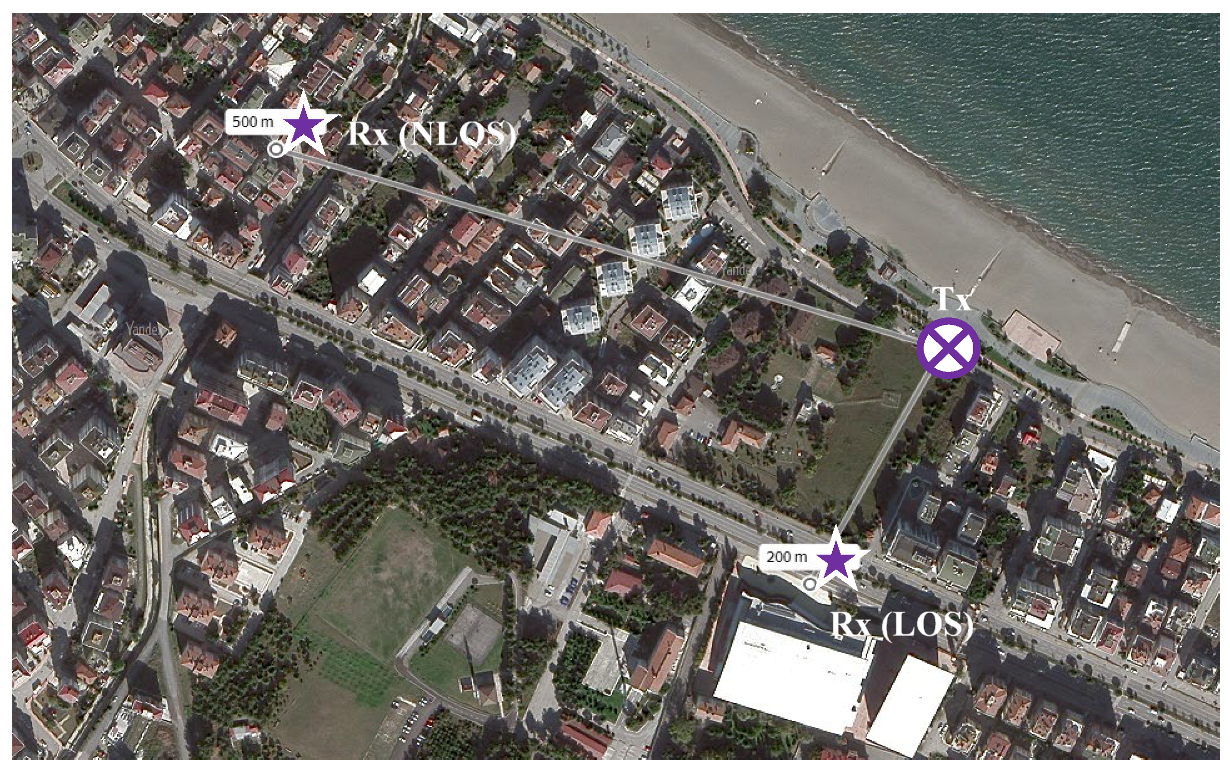
Figure 6 depicts the transceiver settlement points to be used for the scenario to be realized in the simulation program using Yandex Maps. A direct line of sight is established between the receiver and transmitter at a distance of 200 m for the LOS situation. In accordance with the UMi scenario, a scenario with dense buildings and a distance of 500 m has been prepared for the NLOS condition. The round symbol represents the transmitting antenna and the star symbol represents the receiving antenna. The figure also shows the transceiver distances for LOS and NLOS, using Yandex Maps’ ruler feature.
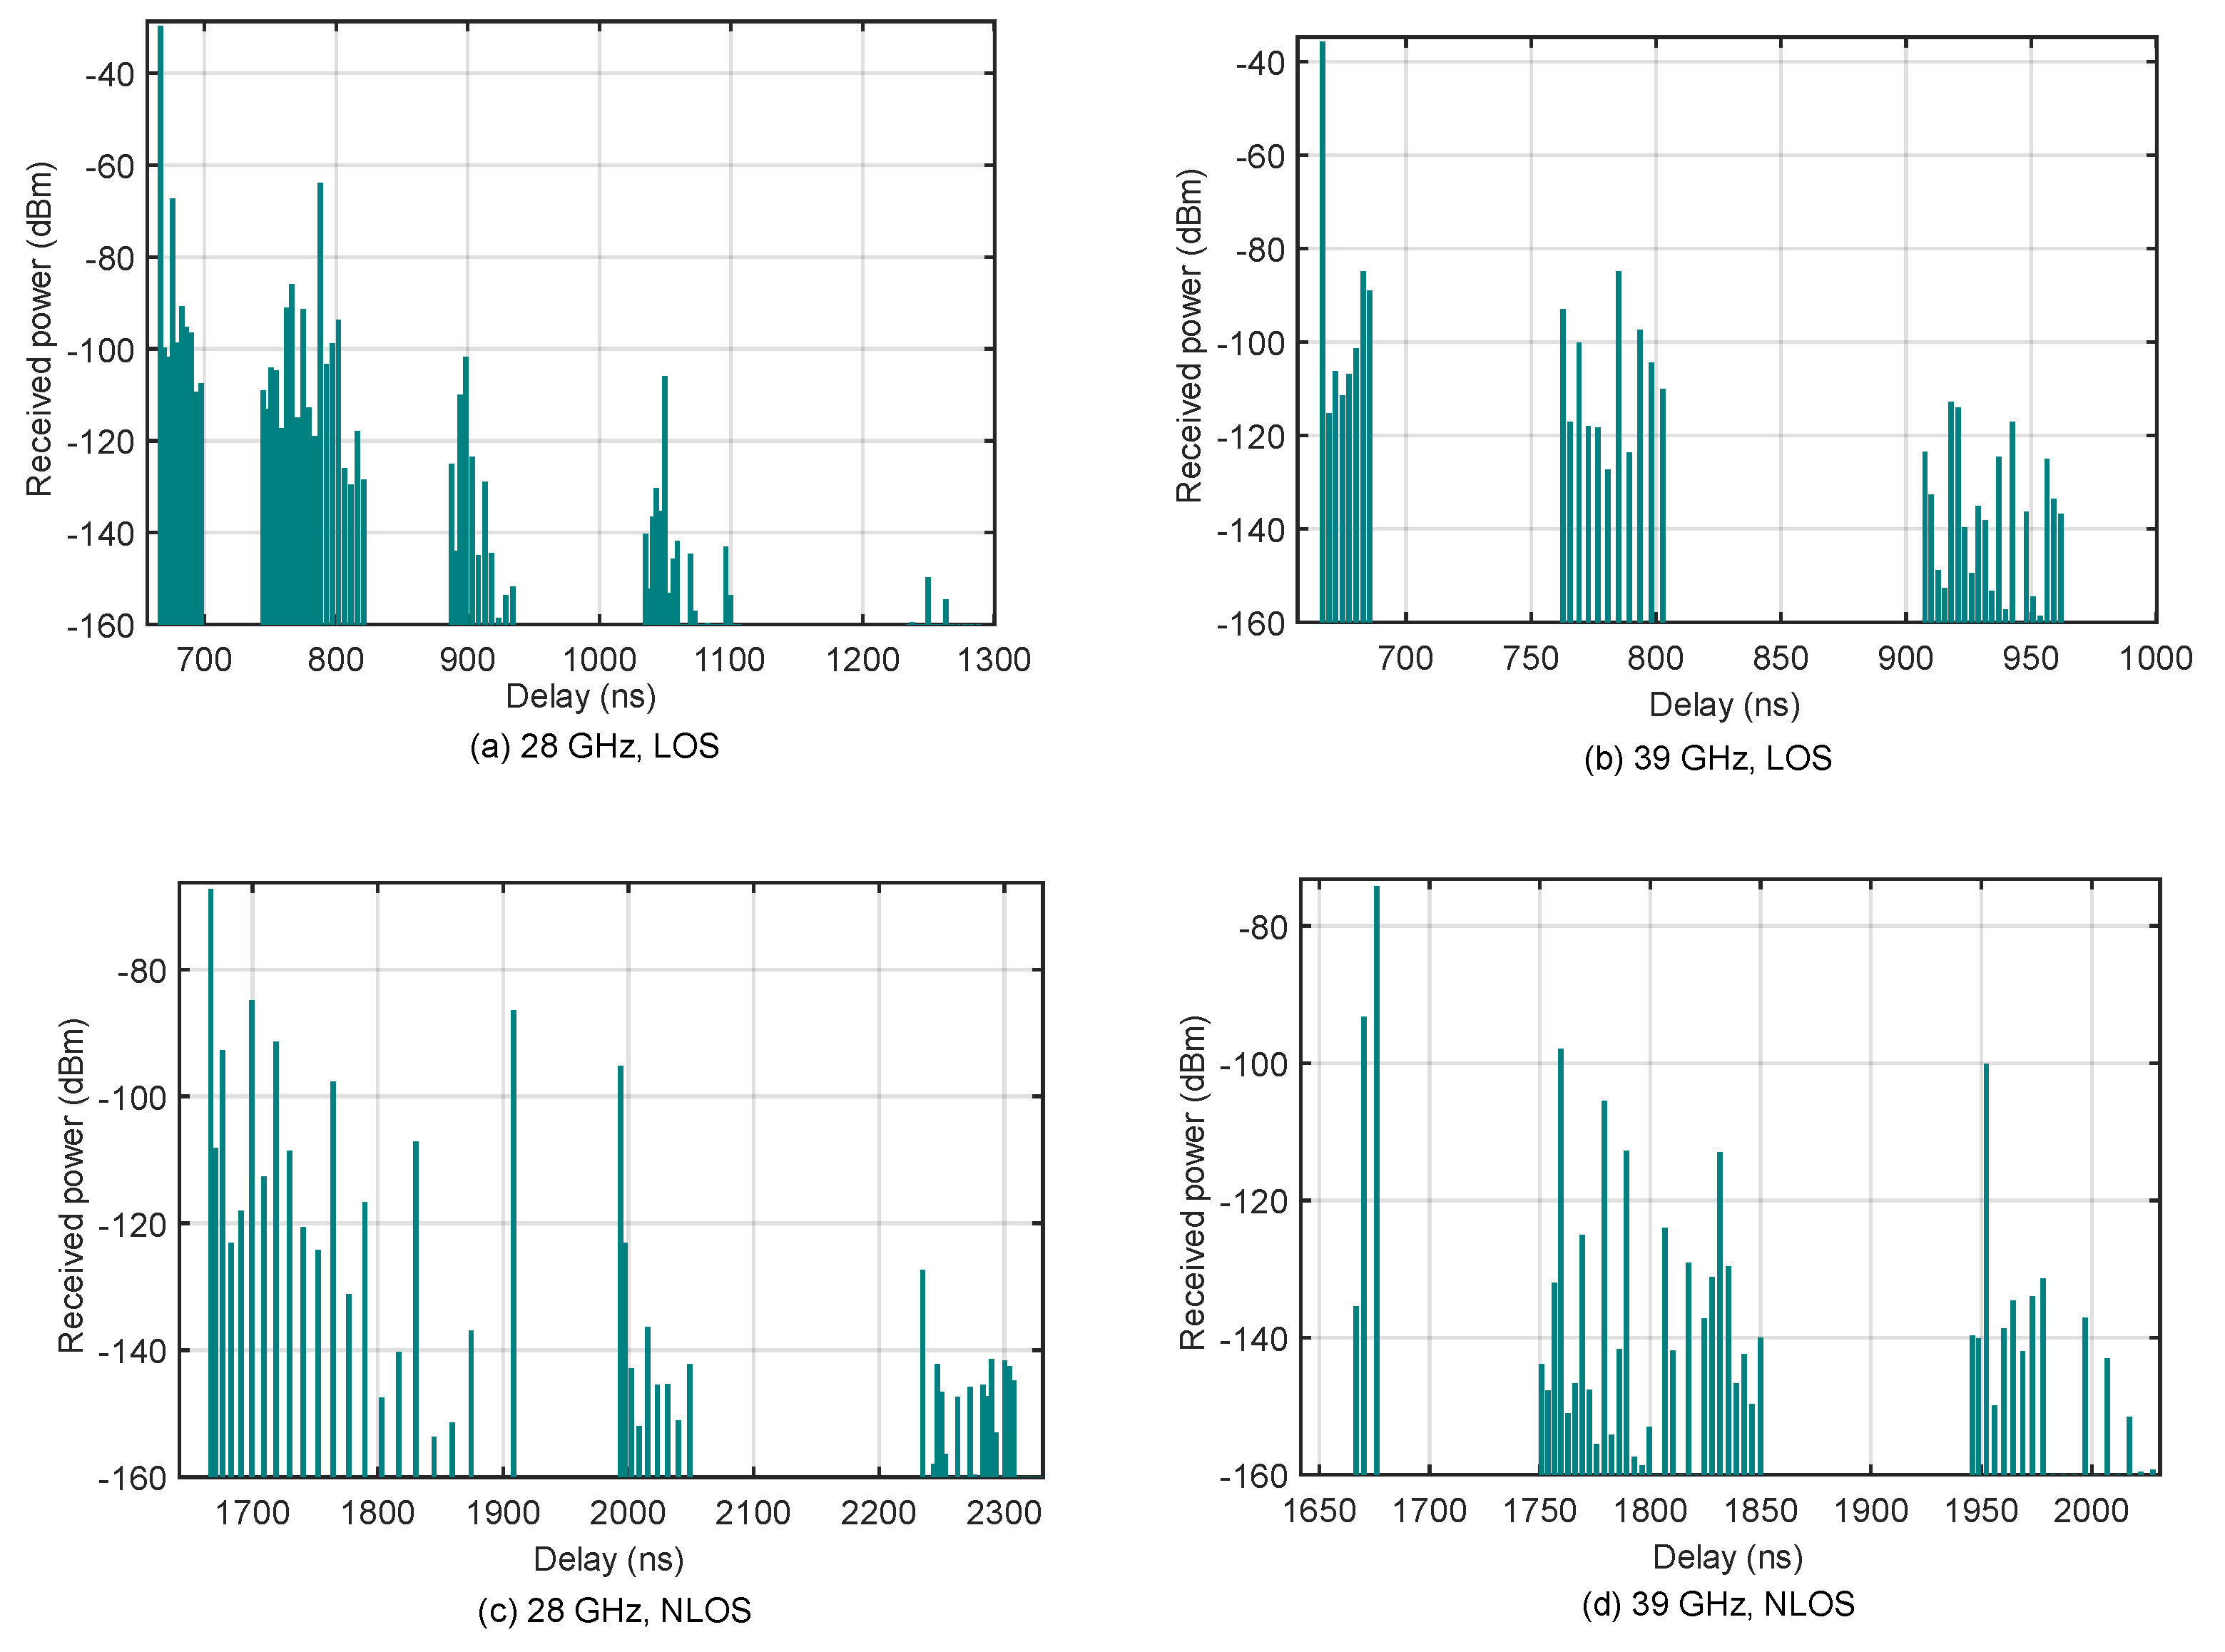
The sample PDPs of the channels produced by NYUSIM are shown in Figure 7 for LOS/NLOS and 28/39 GHz. PDPs have many multipath components due to many reflective surfaces and a large number of disruptive and refractive effects for the UMi scenario. In the case of LOS, the strongest path is −29.74 dBm for 28 GHz and −35.75 dBm for 39 GHz. In the case of NLOS, the strongest path is −67.35 dBm for 28 GHz and −74.19 dBm for 39 GHz. It can be seen from the figure that the strongest path for the NLOS case arrives at the receiver much later than for the LOS case, and the path delays are higher.
The channels’ frequency domain responses are given in Figure 8. For UMi and the 28 GHz frequency, the average power is −36.85 dBm in the LOS condition and −61.62 dBm in the NLOS condition. While there is a difference of −15.41 dBm between the strongest and weakest frequencies in the LOS condition, this difference is −21.80 dBm in the case of NLOS. The average power for the 39 GHz frequency is −40.44 dBm in LOS and −62.63 dBm in NLOS. In the case of LOS, there is a difference of −13.99 dBm between the strongest frequency and the weakest frequency, while in the case of NLOS this difference is −26.35 dBm.
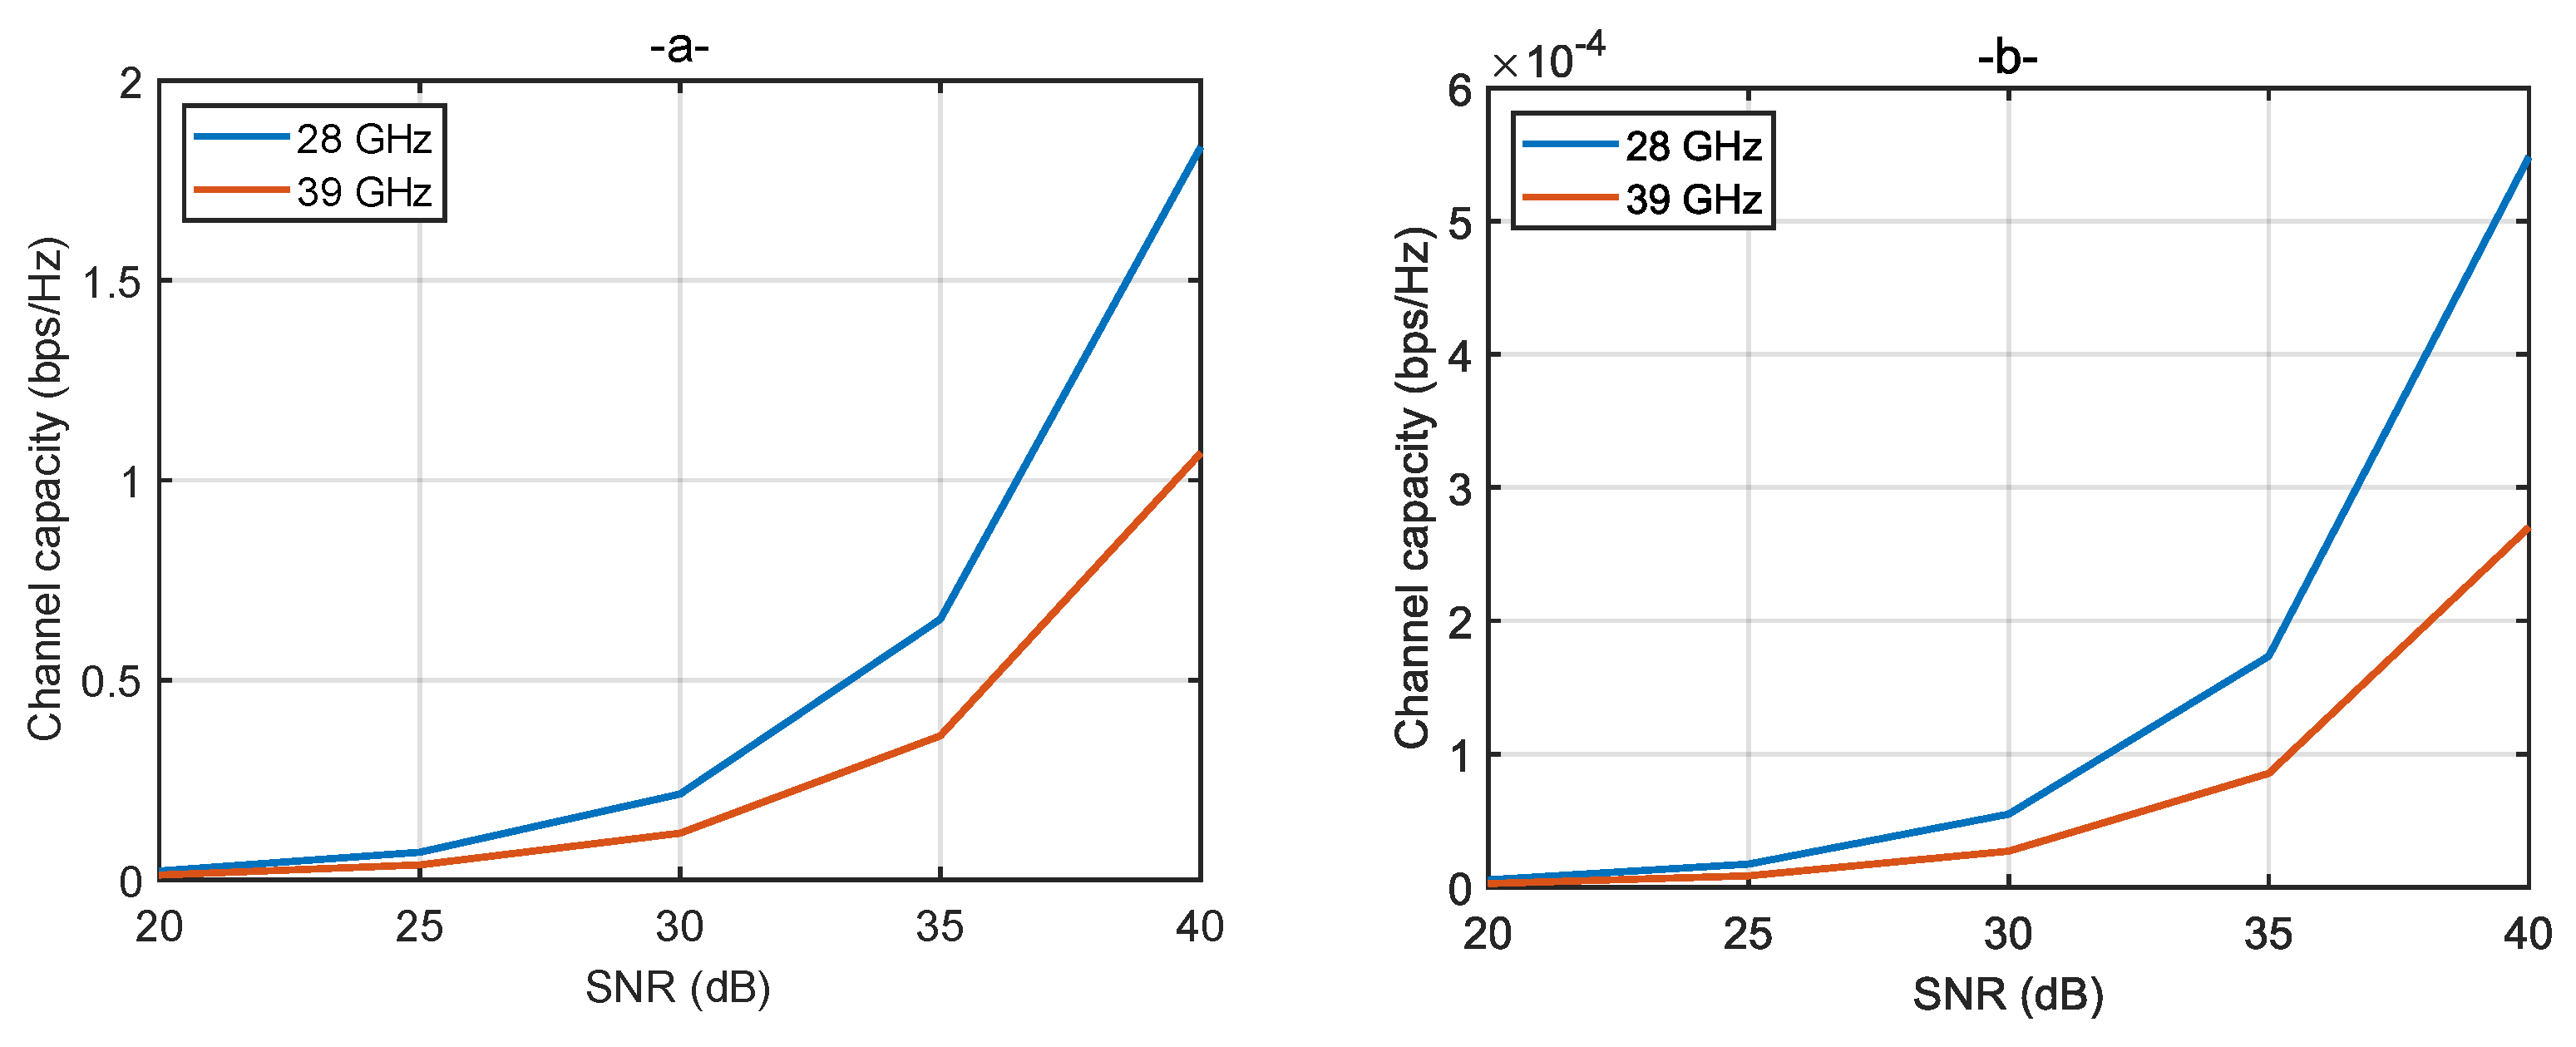
In this study, we calculated daily MIMO channel capacities using daily climate data for UMi/UMa/RMa environments, 28/39 GHz frequencies, and LOS/NLOS scenarios with NYUSIM for SNR values between 20–40 dB. The obtained channel capacities were averaged monthly and annually. Figure 9 presents the annual average channel capacities for the 4 × 4 MIMO channel structure created for UMi. Channel capacities are calculated together with the frequency responses of the other 15 channels in the 4 × 4 MIMO structure shown in Figure 8. Various factors related to the transmission medium and climate parameters can affect the MIMO channel capacity. In the case of LOS for UMi, the channel capacity of 28 GHz frequency is calculated as 1.8339 for 40 dB SNR and 1.0682 for 39 GHz frequency. In the case of NLOS, while the capacity is 0.5483 × 10 3 for 28 GHz and 40 dB SNR, it is 0.2702 × 10 3 for 39 GHz. The frequency of 28 GHz is 1.72 and 2.03 times higher in capacity than 39 GHz for the LOS and NLOS states, respectively.
Determining the impact of climate parameters on MIMO channel capacity is important for designing and optimizing MIMO systems for different environments and weather conditions. In this study, calculations were made for all SNR values in order to compare channel capacities with annual climate data, but monthly averages for only 40 dB SNR were used in the analyses. The monthly averages of the channel capacities for 40 dB SNR are shown in Figure 10. Climate parameters can affect the propagation of electromagnetic waves in the atmosphere, which can significantly impact the MIMO channel capacity. When the figures are compared with the monthly average meteorological data of the UMi area (Atakum), it is observed that the rain rate and the channel capacities change inversely. At the same time, an increase in the channel capacity was observed in the summer months when the rain rate decreased, the temperature increased, the pressure decreased, and the humidity decreased locally. In the annual data, in the case of LOS, the highest channel capacity for 28 GHz was calculated as 1.8681 in July and the lowest as 1.8179 in February. For 39 GHz, the highest channel capacity was 1.0803 in July and the lowest was 1.0520 in September. In the case of NLOS, the highest channel capacity for 28 GHz was 0.5628 × 10 3 in August and the lowest was 0.5278 × 10 3 in September. For 39 GHz, the highest channel capacity was calculated as 0.2757 × 10 3 in April, while the lowest was 0.2603 × 10 3 in February.
Table 6 provides correlation coefficients between channel capacity and climate parameters for UMi. The table shows that the rain rate negatively correlates with channel capacity. While the correlation between channel capacity and rain rate is similar for both the 28 GHz and 39 GHz frequencies in the LOS case, it is closer in the NLOS case. It is also apparent that the rain rate affects channel capacity more in the NLOS case than in the LOS case. Furthermore, pressure affects channel capacity, with a similar correlation for all cases. While the correlation between channel capacity and temperature is high for 28 GHz and LOS conditions, it is lower for other conditions. For UMi, the correlation between channel capacity and humidity is quite low, although it has been observed that humidity affects channel capacity.

4.2. Capacity Analysis Results for UMa

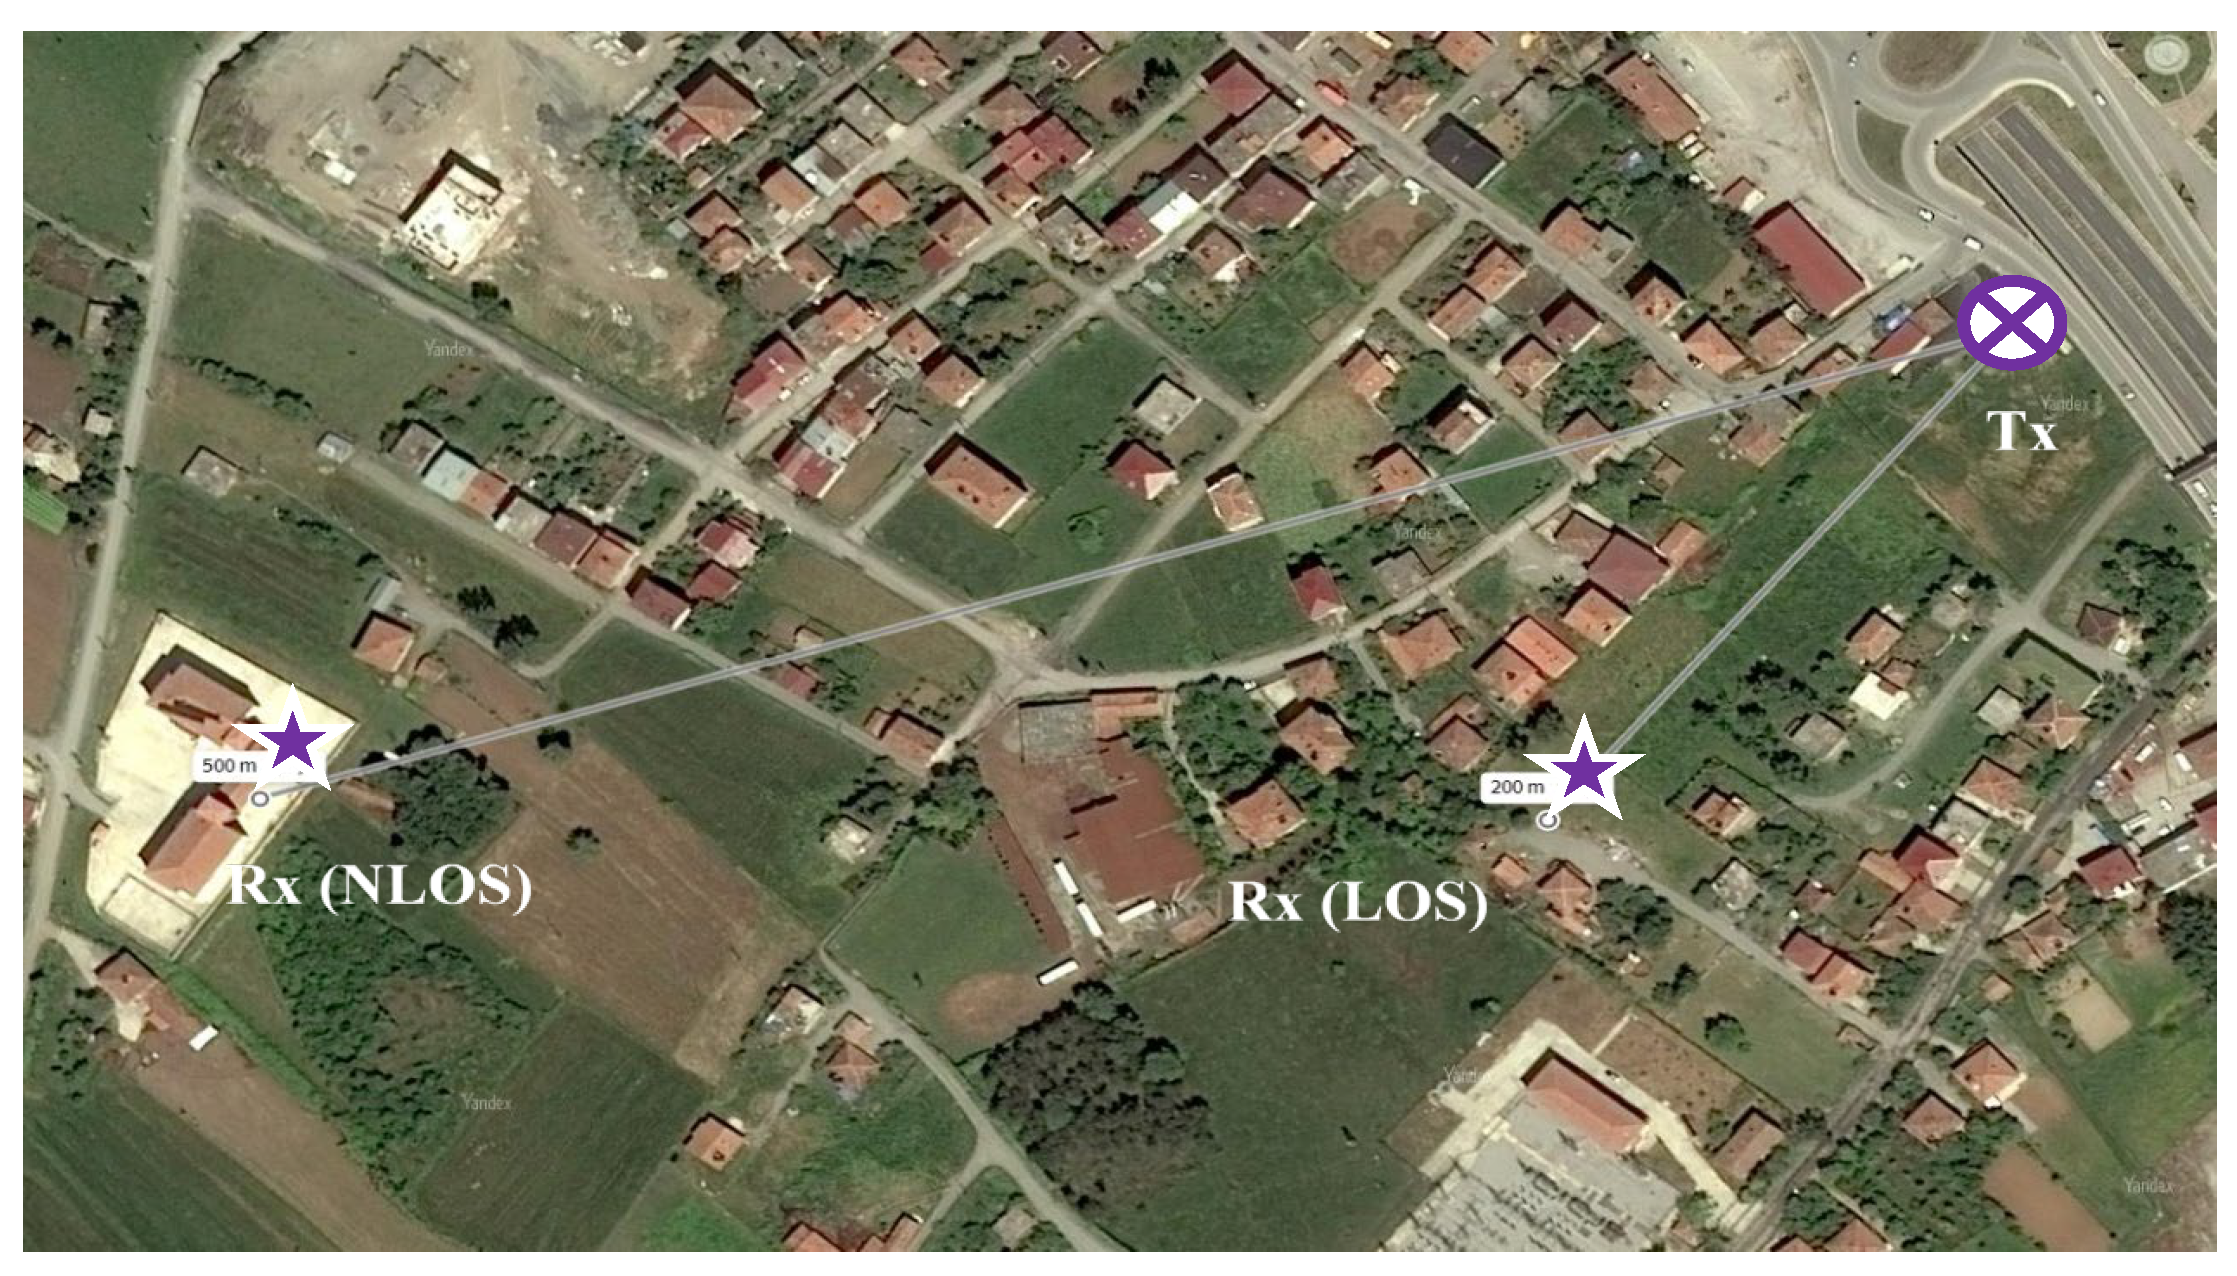
The transceiver placement points for the UMa scenario to be used in the simulation are shown in Figure 11. For the LOS condition, a direct line of sight was established between the transmitter and receiver at a distance of 200 m. For the NLOS condition, a scenario was prepared with relatively less dense buildings and a distance of 500 m, as per the UMa scenario.
All the processing steps for channel capacity for UMi are also done for UMa and RMa. However, for the sake of simplicity, only the monthly average capacity evaluations for 40 dB SNR are included in the paper. The monthly averages of channel capacities for the UMa area are shown in Figure 12 for 40 dB SNR. The annual data demonstrated that the highest channel capacity was in July and the lowest was in October for all four scenarios. In the case of LOS, the highest channel capacity for 28 GHz was 1.8699, while the lowest was 1.8300. For 39 GHz, the highest channel capacity was 1.0910 and the lowest was 1.0643. In the case of NLOS, the highest channel capacity for 28 GHz was 3.6757 × 10 3 , while the lowest was 3.3893 × 10 3 . For 39 GHz, the highest channel capacity was calculated as 1.8627 × 10 3 and the lowest capacity was calculated as 1.7127 × 10 3 . When the channel capacities are compared with the monthly average meteorological data of the UMa area (Bafra), it is clearly seen that the rain rate affects the capacity significantly. The channel capacities tend to increase during the summer as the temperature rises and the pressure and humidity fall.
Table 7 provides correlation coefficients between channel capacity and climate parameters for UMa. In Table 7, for the 28 GHz and LOS conditions, the highest correlation (−0.87) is between channel capacity and rain rate, while the lowest (−0.03) is with temperature. In the 28 GHz and NLOS conditions, the highest correlation (−0.70) is between channel capacity and pressure, while the lowest correlation (0.29) is with temperature. For both LOS and NLOS cases at 39 GHz, the highest correlation is between channel capacity and rain rate, while the lowest is with temperature.

4.3. Capacity Analysis Results for RMa

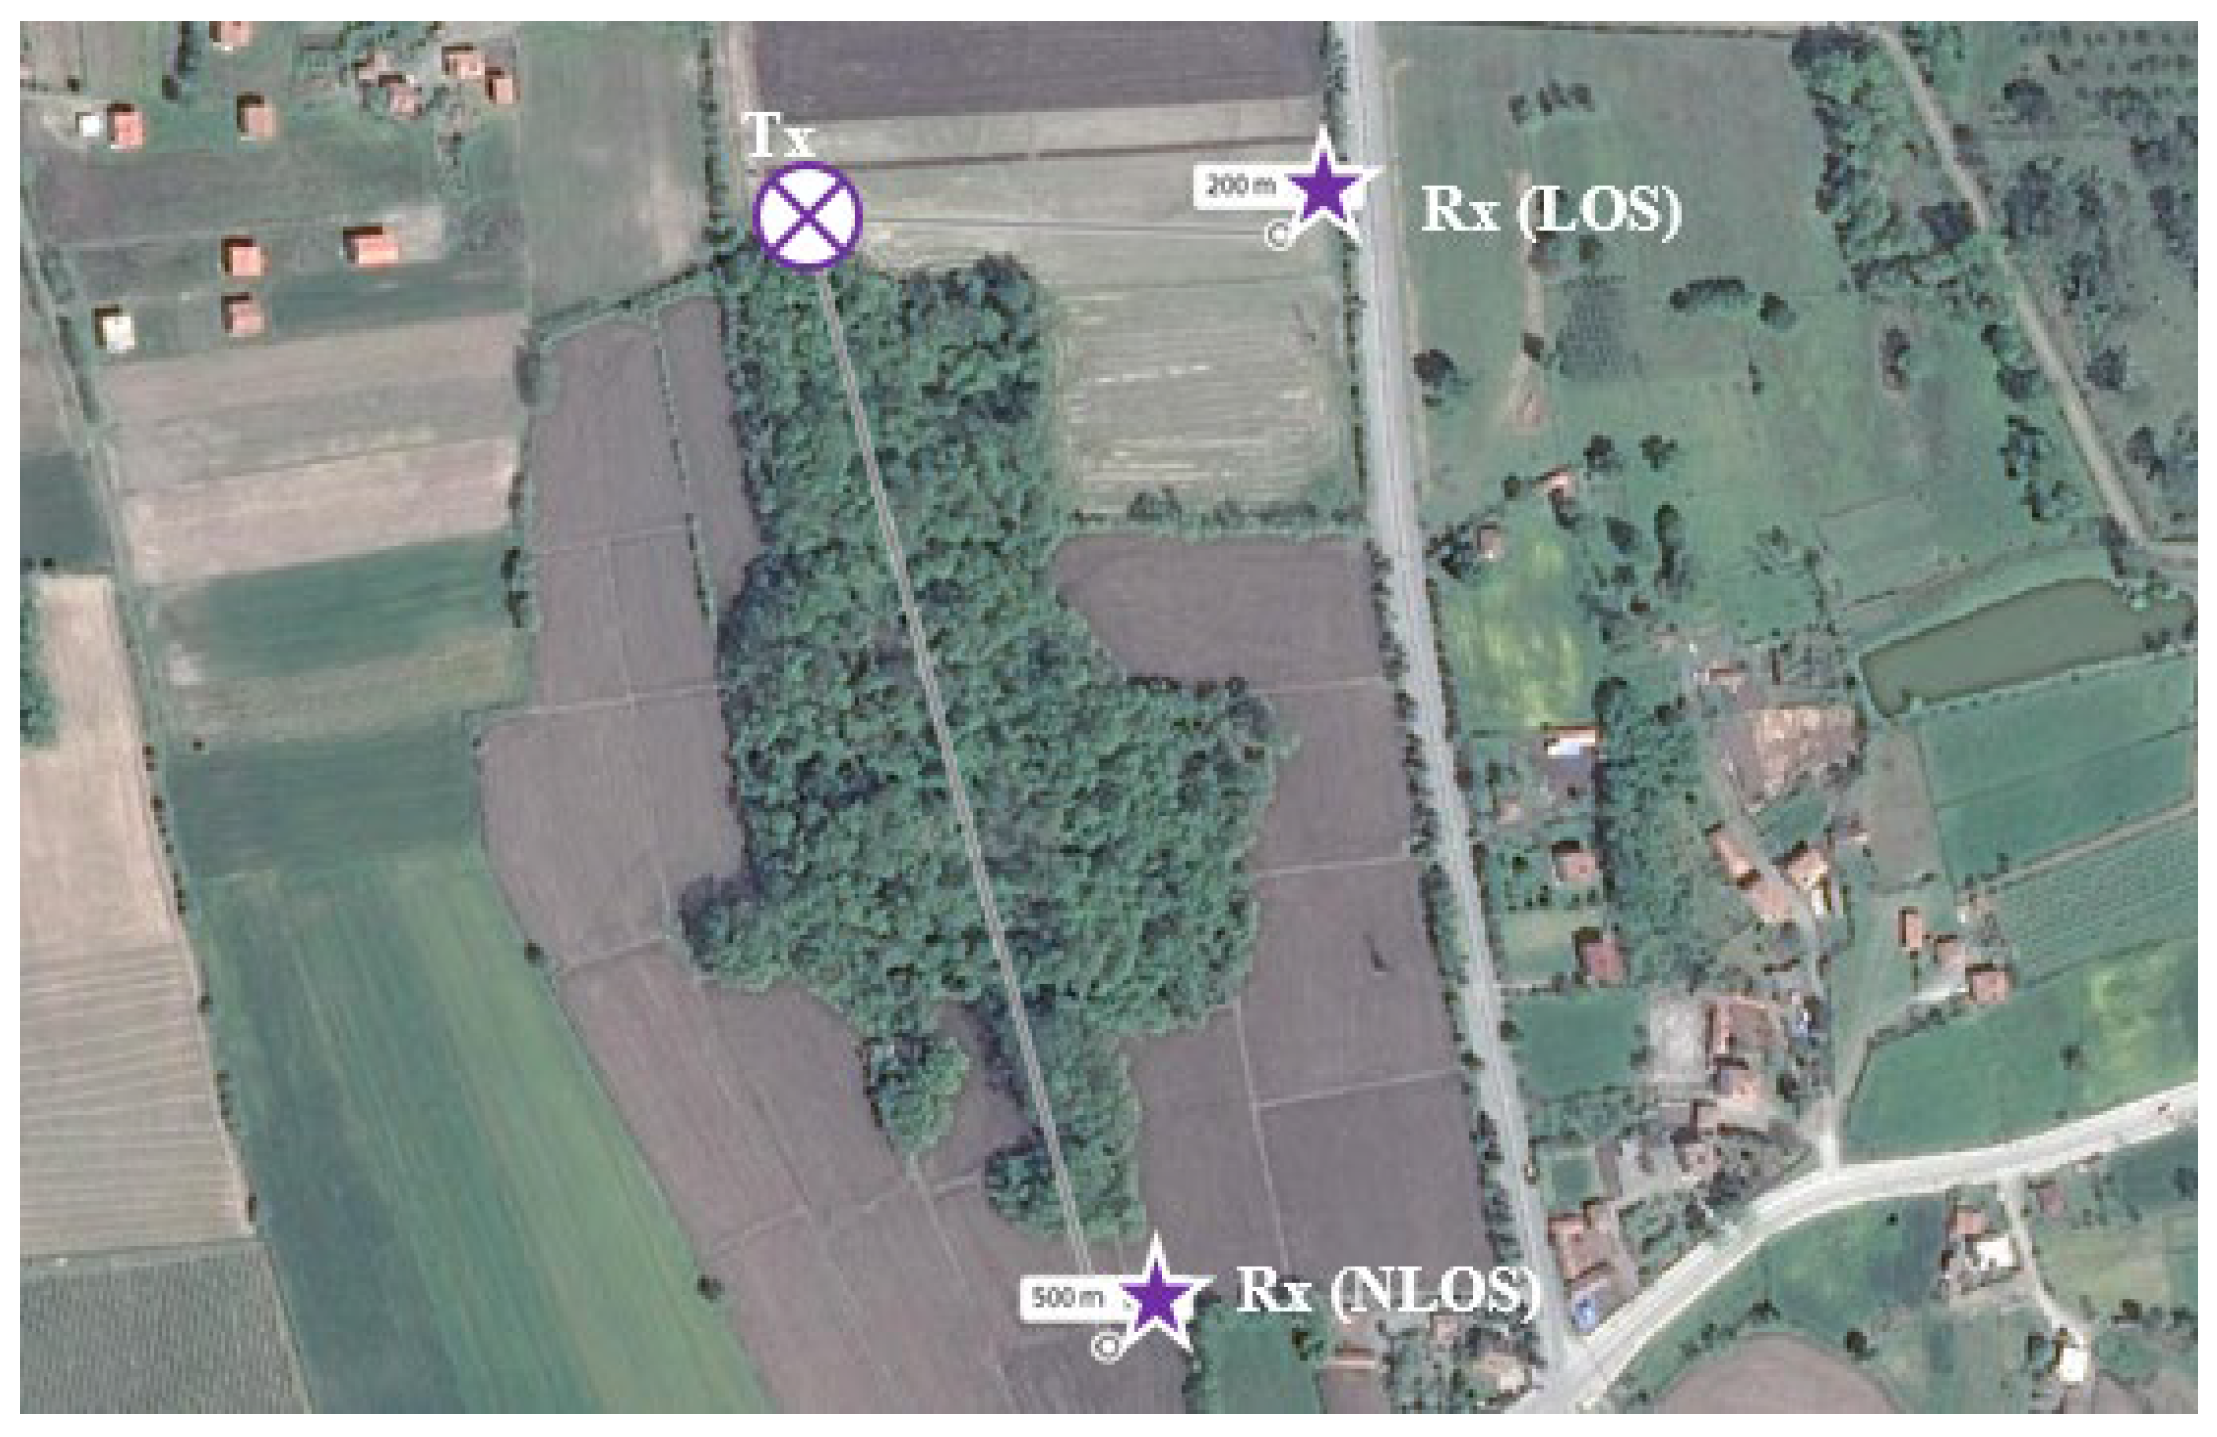
Figure 13 shows the transceiver location for the RMa scenario in the simulation. A direct view is also set at 200 m for the LOS situation. A scenario was prepared for the NLOS situation in which there are no buildings, the NLOS situation is created with trees, and the distance is 500 m. The transmitting antenna is represented by a round symbol, a star symbol represents the receiving antennas, and the transceiver distances are shown.
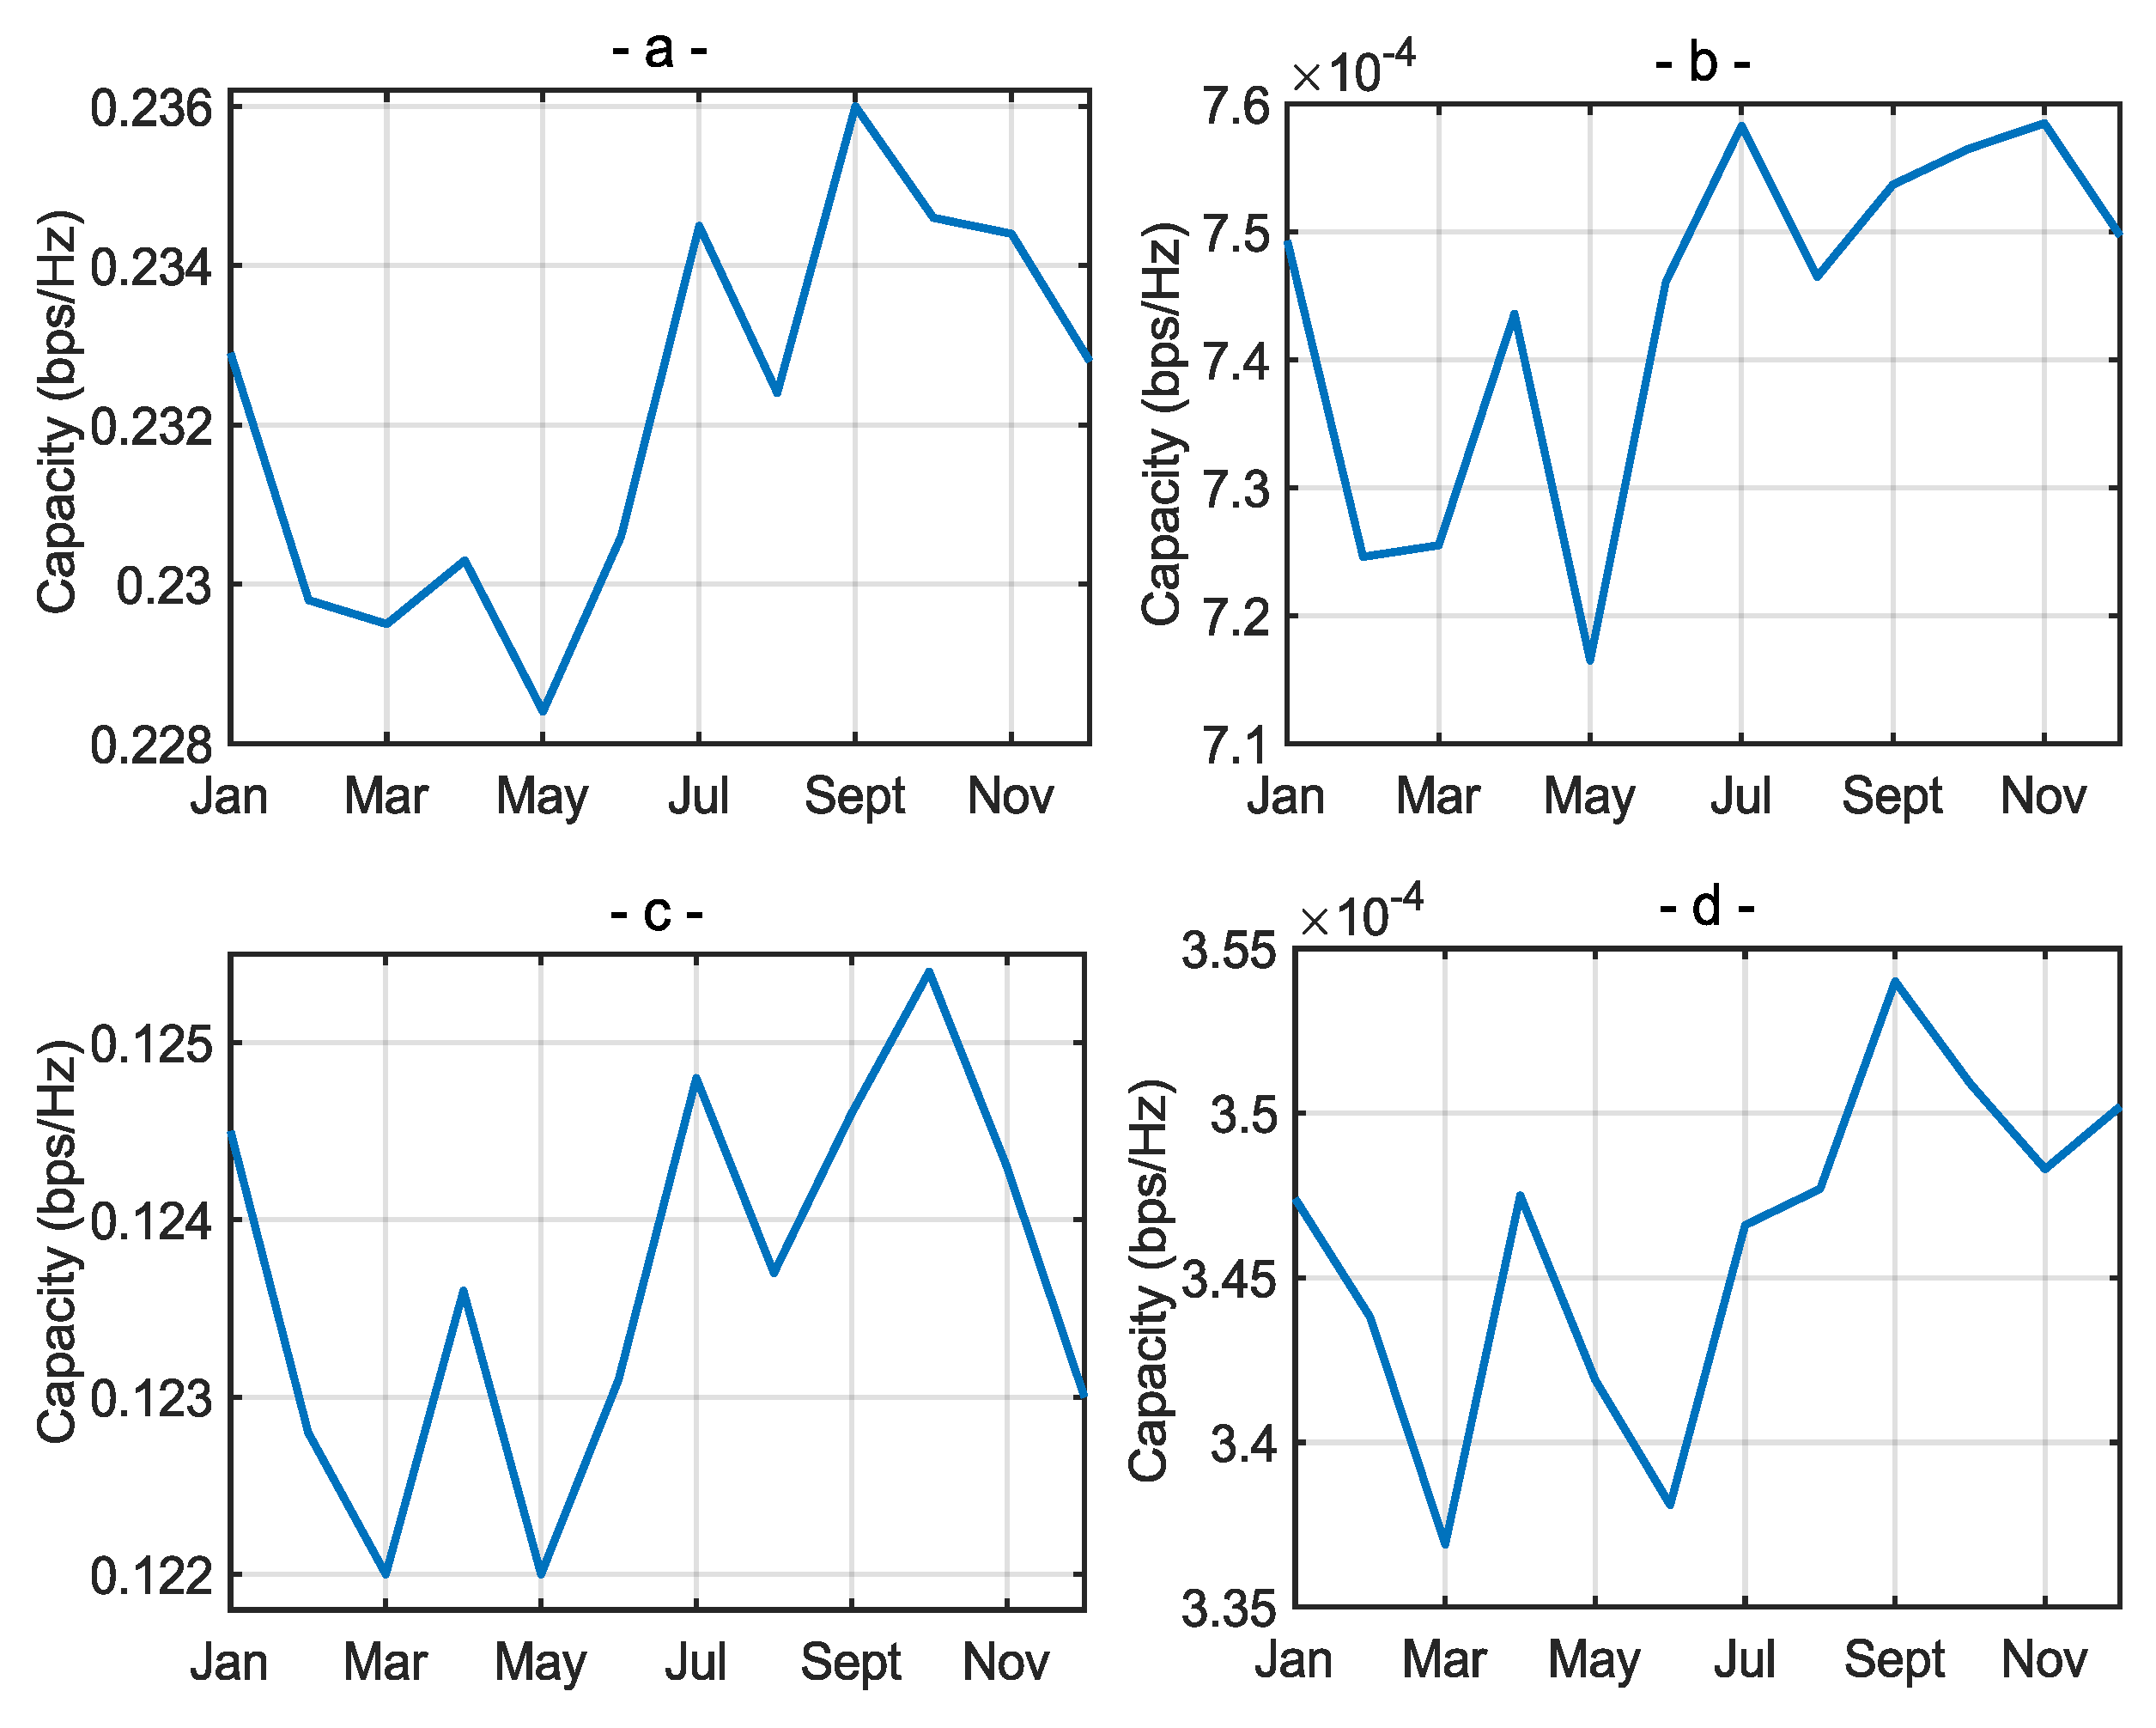
Monthly averages of RMa channel capacities for 40 dB SNR, as in other regions, are shown in Figure 14. In the case of LOS, the highest channel capacity for 28 GHz was 0.2360 in September, while the lowest one was 0.2384 in May. For 39 GHz, the highest channel capacity was 0.1254 in October and the lowest capacity was 0.1220 in both March and May. In the case of NLOS, the highest channel capacity for 28 GHz was 0.7585 × 10 3 in November and the lowest was 0.7165 × 10 3 in May. For 39 GHz, the highest channel capacity was calculated as 0.3540 × 10 3 in September and the lowest as 0.3369 × 10 3 in March. As in other regions, the channel capacity tends to increase in the summer months, mostly affected by rain.
Table 8 presents correlation coefficients between channel capacity and climate parameters for RMa. The highest correlation between channel capacity and climate parameters is with rain rate for all frequencies and LOS/NLOS states in RMa. The correlation between channel capacity and humidity is the lowest for all cases. The correlation between channel capacity and pressure is the second highest after rain rate and is approximately the same for all cases. For RMa, the correlation between channel capacity and humidity is the smallest.

4.4. Comparison of Annual Average Channel Capacity Analysis in All Environments

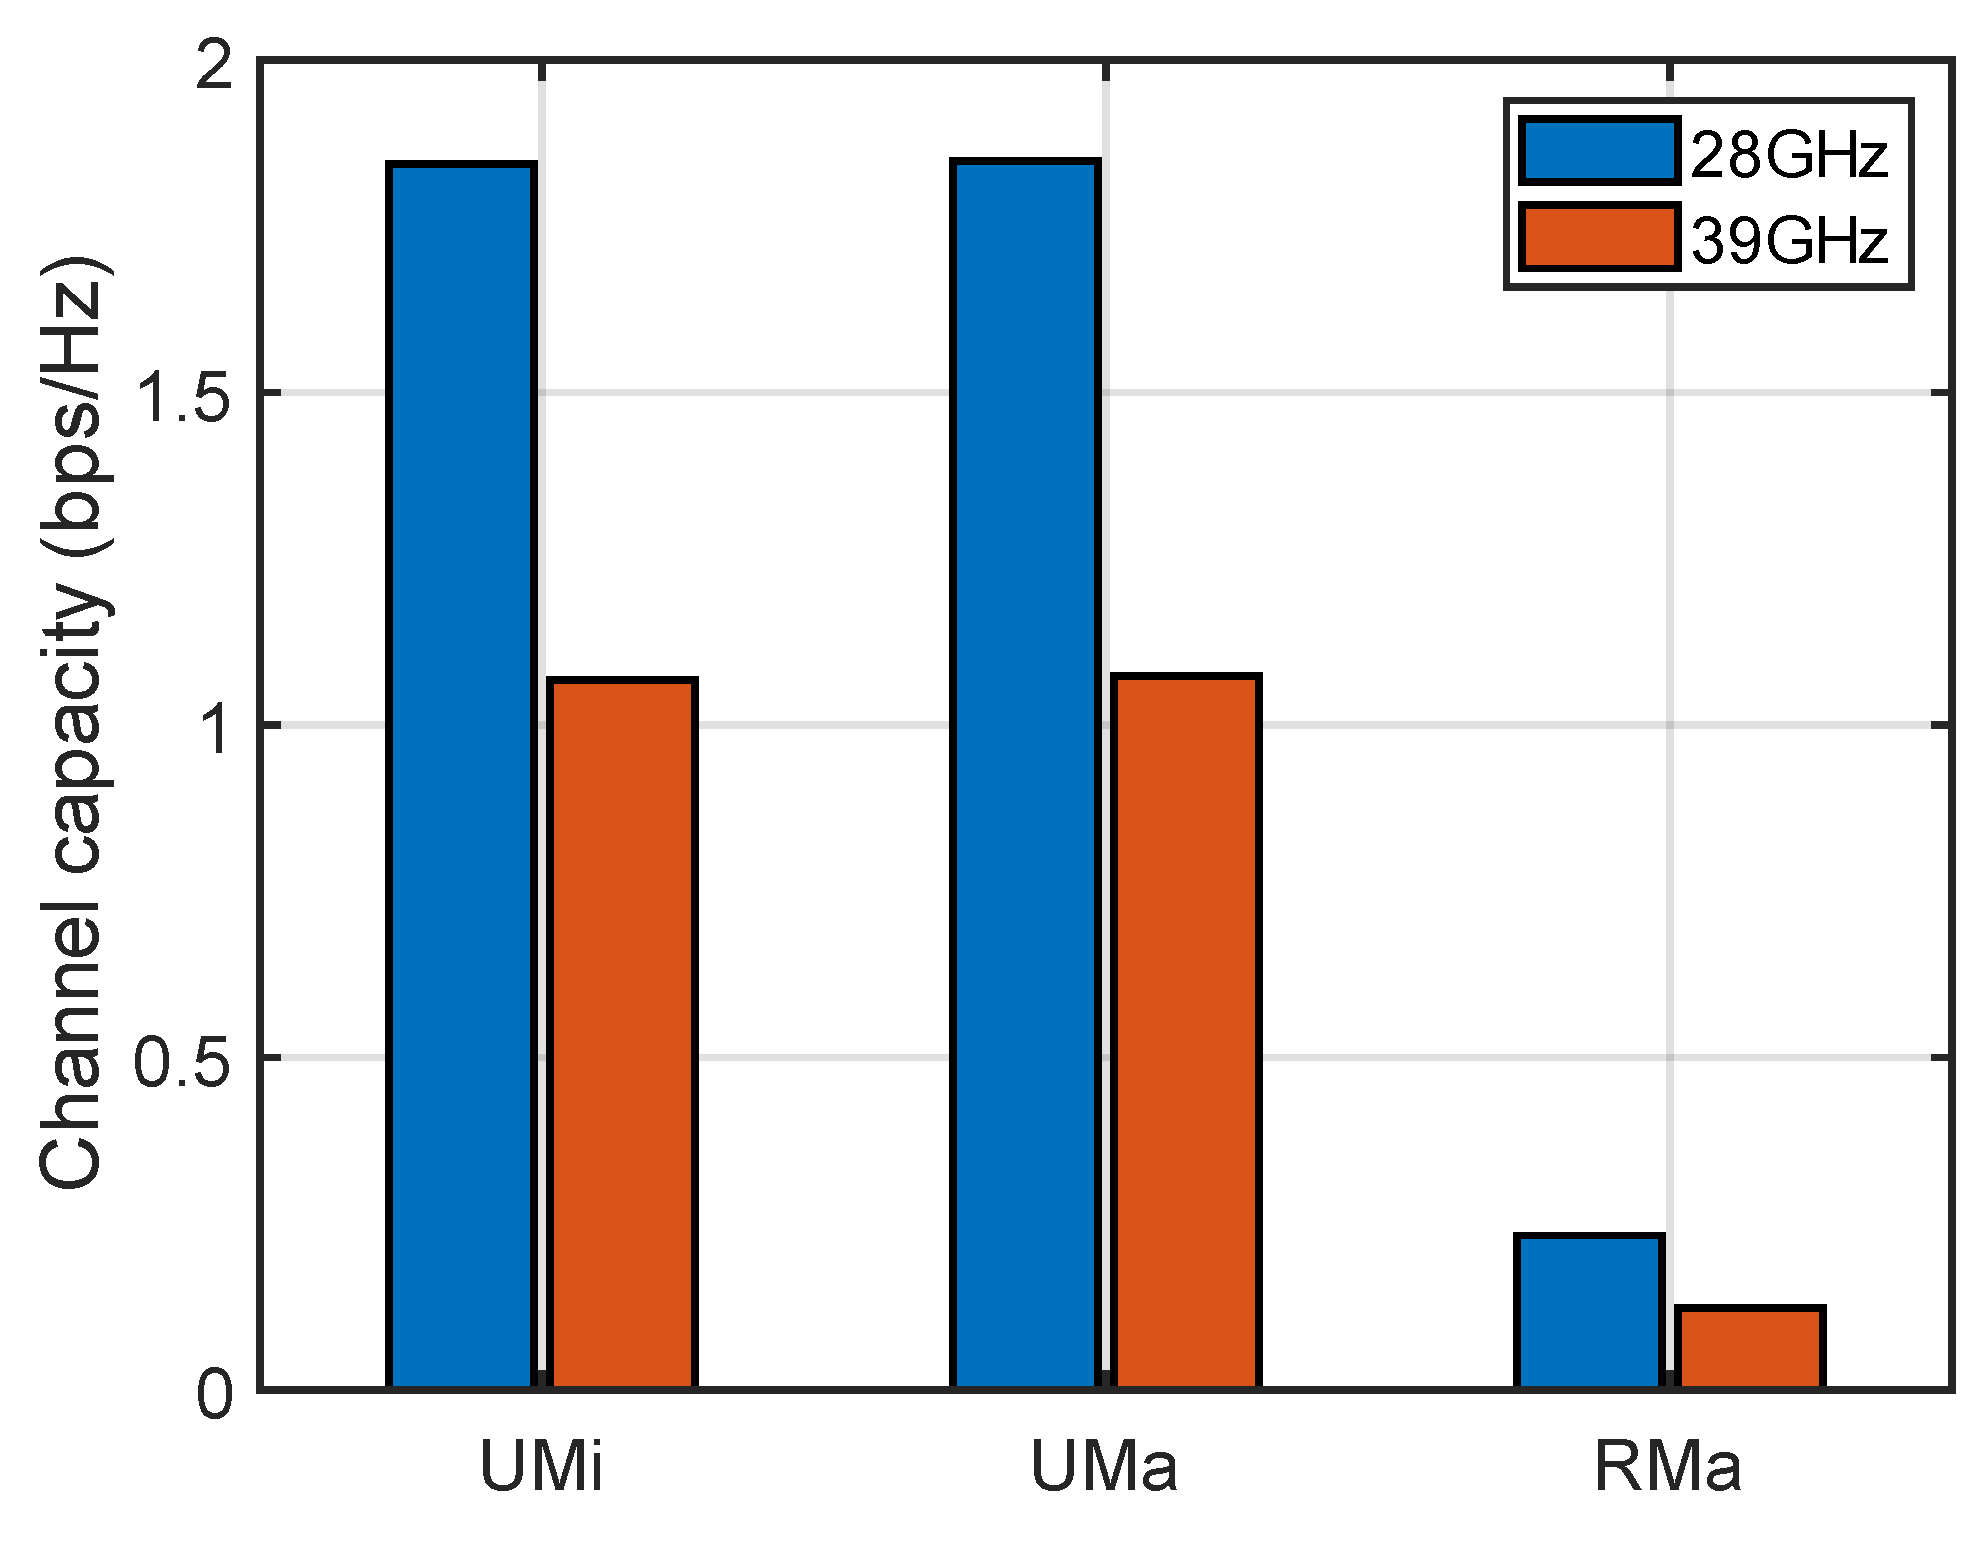
The overall channel capacities for the three different measurement locations, assuming 40 dB SNR and LOS status, are given in Figure 15. For UMi, channel capacity was calculated as 1.8339 at 28 GHz and 1.0682 at 39 GHz. Capacity was measured for UMa as 1.8481 for 28 GHz and 1.0737 for 39 GHz. The capacity for RMa is 0.2322 for 28 GHz and 0.1237 for 39 GHz. For 28 GHz, there is a small capacity difference between UMi and UMa, while there is a 7.90 times difference between RMa and UMi and 7.96 times difference between RMa and UMa. These rates are 8.64 and 8.68 for 39 GHz, respectively.
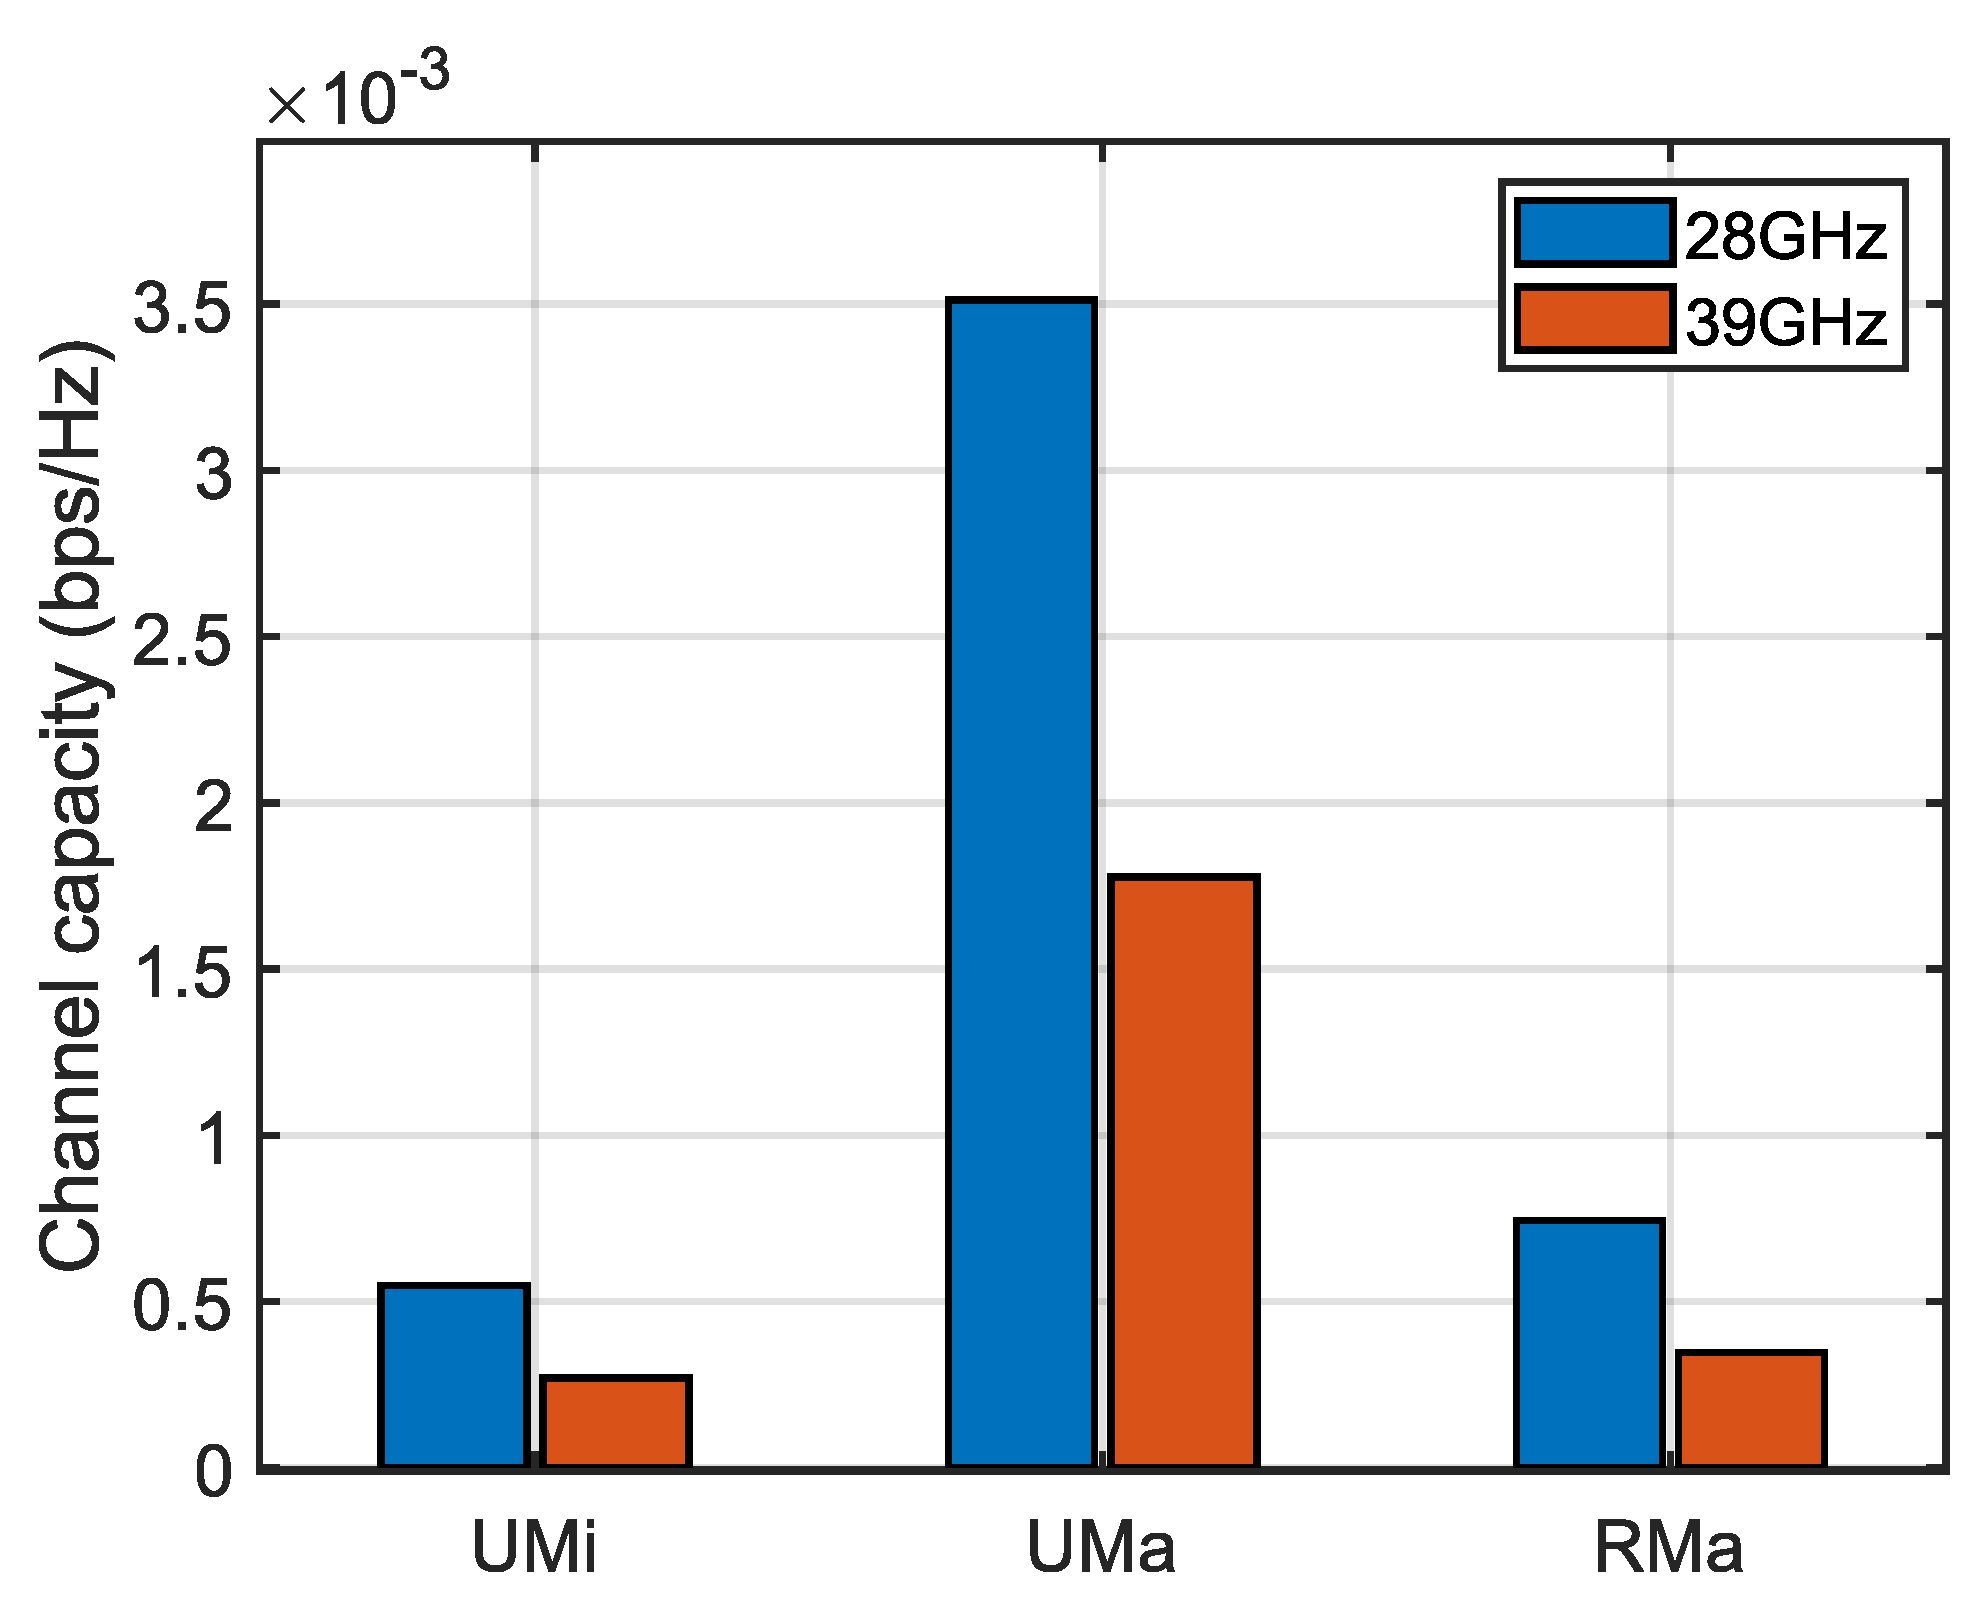
Figure 16 depicts the annually averaged channel capacities for the NLOS situation. In the UMi area for 40 dB SNR, the channel capacity was calculated as 0.5483 × 10 3 at 28 GHz and 0.2702 × 10 3 at 39 GHz. The capacity in the UMa area was 3.5126 × 10 3 for 28 GHz and 1.7762 × 10 3 for 39 GHz, while for the RMa area, the capacity was 0.7441 × 10 3 for 28 GHz and 0.3461 × 10 3 for 39 GHz.
Unlike the LOS scenario, there is a 6.41 times difference between UMi and UMa for 28 GHz in the case of NLOS. It has been calculated that the duct capacity measured for RMa and UMa differs by 4.72 times. The difference, which was 7.96 for LOS, was significantly reduced for NLOS. While RMa has 7.94 times the capacity of UMi in the LOS case, the capacity calculated for UMa in the NLOS case is 1.36 times larger. Similarly, there is a 6.57 times difference in channel capacity between UMi and UMa at 39 GHz, while RMa is 1.28 times larger than UMi and 5.13 times smaller than UMa.
For 28 GHz frequency, the channel capacity is 3363 times larger than the NLOS situation in the UMi area, while this value is calculated as 3953 for 39 GHz. For the UMa area, these values were calculated as 526 and 604 for 28 GHz and 39 GHz, respectively. For the RMa area, the capacity calculated in the NLOS case is 312 times smaller than the LOS case when using the 28 GHz frequency. For 39 GHz, this value is 357 times. The results indicate that the 39 GHz frequency is slightly more affected than the 28 GHz frequency in each case by the transition from the LOS to the NLOS state. Simultaneously, the UMi area was the measurement center most affected by the change in sight line, while the RMa area was the least affected.
In addition, comparisons were made based on parameters such as analysis; operating frequency; scenario, such as LOS or NLOS; and key results based on MIMO, and results are given in Table 9.

5. Conclusions

The analysis of MIMO channel capacity allows the development of new and innovative approaches to understand and optimize the performance of existing (5G) modern wireless communication systems (6G). In this study, 4 × 4 MIMO channel capacity analyses at 28 GHz and 39 GHz are performed based on the climate data of three regions in Samsun, which are characterized as urban microcell, urban macrocell, and rural macrocell environments using the NYUSIM simulator. The simulation results show that environments with LOS links have very high channel capacity for urban areas, while the rural region is found to have very low capacity. The capacities of UMi and UMa are very close to each other for 28 GHz, while there is a 7.94 times difference between RMa and UMi, and a 7.96 times difference between RMa and UMa. For 39 GHz, these rates are 8.64 and 8.68, respectively. In contrast, channel capacity significantly decreases in NLOS situations. In the case of NLOS for the 28 GHz frequency, the channel capacity is 3363 times lower in UMi compared to LOS, while this value is calculated as 3953 for 39 GHz. For UMa, these values were calculated as 526 and 604 for 28 GHz and 39 GHz, respectively. For RMa, the values were calculated as 312 and 357 for 28 GHz and 39 GHz, respectively. In the case of NLOS, the highest channel capacity was obtained for UMa and the lowest for UMi. The capacity for UMa at 28 GHz is 6.41 times higher than for UMi, while this value is 6.57 times for 39 GHz. The UMa channel capacity is 4.72 times higher than RMa for 28 GHz and 5.13 times higher for 39 GHz. The capacity calculated for RMa in the NLOS case is 1.36 times higher than UMi at 28 GHz and 1.28 times higher than UMi at 39 GHz. In the case of NLOS, channel capacity can be increased by taking measures such as increasing the number of transceiver antennas and reducing the transceiver distance in densely urbanized areas. In rural areas, channel capacity can be increased by increasing the number of antennas and improving antenna placement.
Considering the results, it can be concluded that the climate parameter with the most impact on MIMO channel capacity is the rain rate. It is observed that channel capacity significantly decreases with an increase in rain rate. For all cases except RMa at 28 GHz and LOS, the highest negative correlation (−0.97) between channel capacity and rain rate is observed. After rain rate, barometric pressure is the second most important climate parameter impacting channel capacity. It is observed that humidity had the least impact on channel capacity for UMi and RMa, while for UMa temperature is the key parameter to be considered during network planning and optimization.
The results given here include only the Samsun province and 28/39 GHz frequency analysis. For future works, further MIMO channel capacity analyses can be made by using climate parameters and different frequencies in different cities in Turkey.

Author Contributions

Conceptualization, A.F.K., Ç.K. and A.A.C.; methodology, A.F.K., Ç.K. and A.A.C.; software, A.F.K. and Ç.K.; validation, A.F.K., Ç.K., A.A.C. and A.R.; formal analysis, A.F.K.; investigation, A.F.K.; resources, A.F.K., Ç.K., A.A.C. and A.R.; data curation, A.F.K. and Ç.K.; writing—original draft preparation, A.F.K., Ç.K. and A.A.C.; writing—review and editing, A.F.K., Ç.K., A.A.C. and A.R.; visualization, A.F.K. and Ç.K.; supervision, Ç.K. and A.A.C. All authors have read and agreed to the published version of the manuscript.

Funding

This research received no external funding.

Data Availability Statement

The data that support the findings of this study are available from the corresponding author upon reasonable request.

Acknowledgments

The authors thank the Samsun Meteorology 10th Regional Directorate, which supported the study by sharing the 2021 annual climate data within the scope of the study.

Conflicts of Interest

The authors declare no conflict of interest.

References

  1. Xiong, B.; Zhang, Z.; Jiang, H.; Zhang, J.; Wu, L.; Dang, J. A 3D Non-Stationary MIMO Channel Model for Reconfigurable Intelligent Surface Auxiliary UAV-to-Ground mmWave Communications. IEEE Trans. Wirel. Commun. 2022, 21, 5658–5672. [Google Scholar] [CrossRef]
  2. Huang, Z.; Cheng, X. A 3-D Non-Stationary Model for Beyond 5G and 6G Vehicle-to-Vehicle mmWave Massive MIMO Channels. IEEE Trans. Intell. Transp. Syst. 2021, 23, 8260–8276. [Google Scholar] [CrossRef]
  3. Hemadeh, I.A.; Satyanarayana, K.; El-Hajjar, M.; Hanzo, L. Millimeter-Wave Communications: Physical Channel Models, Design Considerations, Antenna Constructions, and Link-Budget. IEEE Commun. Surv. Tutor. 2017, 20, 870–913. [Google Scholar] [CrossRef]
  4. Yuan, Z.; Zhang, J.; Ji, Y.; Pedersen, G.F.; Fan, W. Spatial Non-Stationary Near-Field Channel Modeling and Validation for Massive MIMO Systems. IEEE Trans. Antennas Propaga. 2022, 71, 921–933. [Google Scholar] [CrossRef]
  5. Al-Saman, A.; Cheffena, M.; Elijah, O.; Al-Gumaei, Y.A.; Rahim, S.K.A.; Al-Hadhrami, T. Survey of Millimeter-Wave Propagation Measurements and Models in Indoor Environments. Electronics 2021, 10, 1653. [Google Scholar] [CrossRef]
  6. Zhang, P.; Li, J.; Wang, H.; You, X. Millimeter-Wave Space-Time Propagation Characteristics in Urban Macrocell Scenarios. In Proceedings of the ICC 2019—2019 IEEE International Conference on Communications (ICC), Shanghai, China, 20–24 May 2019; pp. 1–6. [Google Scholar] [CrossRef]
  7. Huang, J.; Wang, C.-X.; Chang, H.; Sun, J.; Gao, X. Multi-Frequency Multi-Scenario Millimeter Wave MIMO Channel Measurements and Modeling for B5G Wireless Communication Systems. IEEE J. Sel. Areas Commun. 2020, 38, 2010–2025. [Google Scholar] [CrossRef]
  8. Wang, Y.; Zhang, Z.; Liao, X.; Tian, Y.; Zhou, J.; Zhang, J. Propagation Measurement and Channel Characteristics of Small Office OAM Communication at 30 GHz. IEEE Antennas Wirel. Propag. Lett. 2022, 22, 839–843. [Google Scholar] [CrossRef]
  9. Nguyen, C.; Cheema, A.A. A Deep Neural Network-Based Multi-Frequency Path Loss Prediction Model from 0.8 GHz to 70 GHz. Sensors 2021, 21, 5100. [Google Scholar] [CrossRef]
  10. Lin, Z.; Lin, M.; Champagne, B.; Zhu, W.-P.; Al-Dhahir, N. Secrecy-Energy Efficient Hybrid Beamforming for Satellite-Terrestrial Integrated Networks. IEEE Trans. Commun. 2021, 69, 6345–6360. [Google Scholar] [CrossRef]
  11. Lin, Z.; Niu, H.; An, K.; Wang, Y.; Zheng, G.; Chatzinotas, S.; Hu, Y. Refracting RIS-Aided Hybrid Satellite-Terrestrial Relay Networks: Joint Beamforming Design and Optimization. IEEE Trans. Aerosp. Electron. Syst. 2022, 58, 3717–3724. [Google Scholar] [CrossRef]
  12. An, K.; Lin, M.; Ouyang, J.; Zhu, W.-P. Secure Transmission in Cognitive Satellite Terrestrial Networks. IEEE J. Sel. Areas Commun. 2016, 34, 3025–3037. [Google Scholar] [CrossRef]
  13. An, K.; Liang, T.; Zheng, G.; Yan, X.; Li, Y.; Chatzinotas, S. Performance Limits of Cognitive-Uplink FSS and Terrestrial FS for Ka-Band. IEEE Trans. Aerosp. Electron. Syst. 2018, 55, 2604–2611. [Google Scholar] [CrossRef]
  14. Saad, W.; Bennis, M.; Chen, M. A Vision of 6G Wireless Systems: Applications, Trends, Technologies, and Open Research Problems. IEEE Netw. 2019, 34, 134–142. [Google Scholar] [CrossRef]
  15. Al-Falahy, N.; Alani, O.Y. Millimetre wave frequency band as a candidate spectrum for 5G network architecture: A survey. Phys. Commun. 2019, 32, 120–144. [Google Scholar] [CrossRef]
  16. Ntaikos, D.; Gizas, B.; Papageorgiou, G.; Papadias, C.B. Channel Model Simulator for Multi-Antenna Terrestrial Links. In Proceedings of the 2017 IEEE International Conference on Communications Workshops (ICC Workshops), Paris, France, 21–25 May 2017. [Google Scholar]
  17. Jaeckel, S.; Raschkowski, L.; Borner, K.; Thiele, L. QuaDRiGa: A 3-D Multi-Cell Channel Model With Time Evolution for Enabling Virtual Field Trials. IEEE Trans. Antennas Propag. 2014, 62, 3242–3256. [Google Scholar] [CrossRef]
  18. Hoppe, R.; Wolfle, G.; Jakobus, U. Wave propagation and radio network planning software WinProp added to the electromagnetic solver package FEKO. In Proceedings of the 2017 International Applied Computational Electromagnetics Society Symposium-Italy (ACES), Firenze, Italy, 26–30 March 2017. [Google Scholar] [CrossRef]
  19. Sun, S.; MacCartney, G.R.; Rappaport, T.S. A novel millimeter-wave channel simulator and applications for 5G wireless communications. In Proceedings of the 2017 IEEE International Conference on Communications (ICC), Paris, France, 21–25 May 2017; pp. 1–7. [Google Scholar] [CrossRef]
  20. Ju, S.; Kanhere, O.; Xing, Y.; Rappaport, T.S. A Millimeter-Wave Channel Simulator NYUSIM with Spatial Consistency and Human Blockage. In Proceedings of the 2019 IEEE Global Communications Conference (GLOBECOM), Waikoloa, HI, USA, 9–13 December 2019; pp. 1–6. [Google Scholar] [CrossRef]
  21. He, Y.; Zhang, Y.; Zhang, J.; Pang, L.; Chen, Y.; Ren, G. Investigation and Comparison of QuaDRiGa, NYUSIM and MG5G Channel Models for 5G Wireless Communications. In Proceedings of the 2020 IEEE 92nd Vehicular Technology Conference (VTC2020-Fall), Vietual Conference, 18 November–16 December 2020. [Google Scholar]
  22. Lübke, M.; Dimce, S.; Schettler, M.; Lurz, F.; Weigel, R.; Dressler, F. Comparing mmWave channel simulators in vehicular environments. In Proceedings of the 2021 IEEE 93rd Vehicular Technology Conference (VTC2021-Spring), Virtual Conference, 25 April–19 May 2021. [Google Scholar]
  23. Alizadeh, A.; Vu, M.; Rappaport, T.S. A Study of Interference Distributions in Millimeter Wave Cellular Networks. In Proceedings of the 2019 IEEE International Conference on Microwaves, Antennas, Communications and Electronic Systems (COMCAS), Tel-Aviv, Israel, 4–6 November 2019; pp. 1–6. [Google Scholar] [CrossRef]
  24. Rappaport, T.S.; Sun, S.; Shafi, M. Investigation and Comparison of 3GPP and NYUSIM Channel Models for 5G Wireless Communications. In Proceedings of the 2017 IEEE 86th Vehicular Technology Conference (VTC-Fall), Toronto, ON, Canada, 24–27 September 2017; pp. 1–5. [Google Scholar] [CrossRef]
  25. Sun, S.; Rappaport, T.S.; Shafi, M.; Tang, P.; Zhang, J.; Smith, P.J. Propagation Models and Performance Evaluation for 5G Millimeter-Wave Bands. IEEE Trans. Veh. Technol. 2018, 67, 8422–8439. [Google Scholar] [CrossRef]
  26. Zeman, K.; Masek, P.; Stusek, M.; Hosek, J.; Silhavy, P. Accuracy comparison of propagation models for mmWave communication in NS-3. In Proceedings of the 2017 9th International Congress on Ultra Modern Telecommunications and Control Systems and Workshops (ICUMT), Munich, Germany, 6–8 November 2017. [Google Scholar]
  27. Hasan, R.; Mowla, M.; Hoque, N. Performance Estimation of Massive MIMO Drop-based Propagation Channel Model for mmWave Communication. In Proceedings of the 2020 IEEE Region 10 Symposium (TENSYMP), Dhaka, Bangladesh, 5–7 June 2020; pp. 461–464. [Google Scholar] [CrossRef]
  28. Mowla, M.; Dutty, H.B.H.; Ahmad, I. A Statistical mmWave Channel Modeling for Backhaul Networks in 5G Communications. In Proceedings of the 2019 International Conference on Computer, Communication, Chemical, Materials and Electronic Engineering (IC4ME2), Rajshahi, Bangladesh, 11–12 July 2019; pp. 1–4. [Google Scholar] [CrossRef]
  29. Zekri, A.B.; Ajgou, R. Study of mmWave channels for different scenarios. In Proceedings of the 2019 6th International Conference on Image and Signal Processing and their Applications (ISPA), Mostaganem, Algeria, 24–25 November 2019. [Google Scholar]
  30. Lodro, M.M.; Majeed, N.; Khuwaja, A.A.; Sodhro, A.H.; Greedy, S. Statistical channel modelling of 5G mmWave MIMO wireless communication. In Proceedings of the 2018 International Conference on Computing, Mathematics and Engineering Technologies (iCoMET), Sukkur, Pakistan, 3–4 March 2018; pp. 1–5. [Google Scholar] [CrossRef]
  31. Rahayu, Y.; Pohan, I.A. 38 GHz Channel Modeling for 5G Communication at Pekanbaru City. In Proceedings of the 2021 IEEE Symposium on Future Telecommunication Technologies (SOFTT), Bandung, Indonesia, 6–7 December 2021. [Google Scholar]
  32. Momo, S.H.A.; Mowla, M. Statistical Analysis of an Outdoor mmWave Channel Model at 73 GHz for 5G Networks. In Proceedings of the 2019 International Conference on Computer, Communication, Chemical, Materials and Electronic Engineering (IC4ME2), Rajshahi, Bangladesh, 11–12 July 2019; pp. 1–4. [Google Scholar] [CrossRef]
  33. Hasan, R.; Mowla, M.; Rashid, A.; Hosain, K.; Ahmad, I. A Statistical Analysis of Channel Modeling for 5G mmWave Communications. In Proceedings of the 2019 International Conference on Electrical, Computer and Communication Engineering (ECCE), Cox’s Bazar, Bangladesh, 7–9 February; pp. 1–6. [CrossRef]
  34. Ilyas, R.; Malik, A.; Alammari, A.A.; Sharique, M. 5G and mmWave MIMO Channel Models: Simulations and Analysis. In Proceedings of the 2021 Sixth International Conference on Wireless Communications, Signal Processing and Networking (WiSPNET), Chennai, India, 25–27 March 2021. [Google Scholar]
  35. Játiva, R.; Salazar, A.; Toscano, W. Reference models for 5G wireless communications channels. In Proceedings of the 2019 IEEE Fourth Ecuador Technical Chapters Meeting (ETCM), Guayaquil, Ecuador, 13–15 November 2019. [Google Scholar]
  36. Samimi, M.K.; Sun, S.; Rappaport, T.S. MIMO channel modeling and capacity analysis for 5G millimeter-wave wireless systems. In Proceedings of the 2016 10th European Conference on Antennas and Propagation (EuCAP), Davos, Switzerland, 10–15 April 2016; pp. 1–5. [Google Scholar] [CrossRef]
  37. Zhang, K.; Zhang, R.; Wu, J.; Jiang, Y.; Tang, X. Measurement and modeling of path loss and channel capacity analysis for 5G UMa scenario. In Proceedings of the 2019 11th International Conference on Wireless Communications and Signal Processing (WCSP), Xi’an, China, 23–25 October 2019. [Google Scholar]
  38. Zhai, M.; Li, J.; Liang, Y.; Li, T.; Gui, G.; Li, F. A novel coupling mode based 3D MIMO channel modeling and capacity analysis for 5G. In Proceedings of the 2016 IEEE International Conference on Ubiquitous Wireless Broadband (ICUWB), Nanjing, China, 16–19 October 2016; pp. 1–4. [Google Scholar] [CrossRef]
  39. Abdullah-Al-Nahid, S.; Khan, T.A.; Taseen, M.A.; Tasnim, S.; Marium, T.; Baki, A.K.M. Comparison of Condition Numbers and Ranks of the MIMO Channel at 77 GHz Carrier Frequency. In Proceedings of the 2021 5th International Conference on Electrical Engineering and Information & Communication Technology (ICEEICT), Dhaka, Banglades, 18–20 November 2021. [Google Scholar]
  40. Hikmaturokhman, A.; Suryanegara, M.; Ramli, K. A comparative analysis of 5G channel model with varied frequency: A case study in Jakarta. In Proceedings of the International Conference on Smart Computing & Communications, Sarawak, Malaysia, 28–30 June 2019. [Google Scholar]
  41. Squali, L.; Riouch, F. Atmospheric parameters influence on mm-wave propagation in 5G communication. In Proceedings of the 2019 7th Mediterranean Congress of Telecommunications (CMT), Fes, Morocco, 24–25 October 2019. [Google Scholar] [CrossRef]
  42. Kurniawan, A.; Danisya, A.R.; Isnawati, A.F. Performance of mmWave Channel Model on 28 GHz Frequency Based on Temperature Effect in Wonosobo City. In Proceedings of the 2020 IEEE International Conference on Communication, Networks and Satellite (Comnetsat), Batam, Indonesia, 17–18 December 2020; pp. 37–41. [Google Scholar] [CrossRef]
  43. Rahman, M.N.; Anwar, K.; Nur, L.O. Indonesia 5G Channel Model Considering Temperature Effects at 28 GHz. In Proceedings of the 2019 Symposium on Future Telecommunication Technologies (SOFTT), Kuala Lumpur, Malaysia, 18–19 November 2019. [Google Scholar] [CrossRef]
  44. Budalal, A.A.; Rafiqul, I.; Habaebi, M.; Rahman, T.A. The effects of rain fade on millimetre wave channel in tropical climate. Bull. Electr. Eng. Inform. 2019, 8, 653–664. [Google Scholar] [CrossRef]
  45. Prasetyo, A.H.; Suryanegara, M.; Asvial, M. Evaluation of 5G Performance at 26 GHz and 41 GHz frequencies: The Case of Tropical Suburban Areas in Indonesia. In Proceedings of the 2019 IEEE 14th Malaysia International Conference on Communication (MICC), Selangor, Malaysia, 2–4 December 2019; pp. 101–105. [Google Scholar] [CrossRef]
  46. Larasati, S.; Yuliani, S.R.; Danisya, A.R. Outage Performances of 5G Channel Model Influenced by Barometric Pressure Effects in Yogyakarta. J. Infotel 2020, 12, 25–31. [Google Scholar] [CrossRef]
  47. Al-Shuwaili, A.; Jamel, T.M. 5G Channel Characterization at Millimeter-Wave for Baghdad City: An NYUSIM-based Approach. In Proceedings of the 2021 18th International Multi-Conference on Systems, Signals & Devices (SSD), Monastir, Tunisia, 22–25 March 2021; pp. 468–473. [Google Scholar] [CrossRef]
  48. Alfaresi, B.; Nawawi, Z.; Malik, R.F.; Anwar, K.; Nur, L.O. Humidity Effect to 5G Performances under Palembang Channel Model at 28 GHZ. Sinergi 2019, 24, 49–56. [Google Scholar] [CrossRef]
  49. Budalal, A.A.; Shayea, I.; Islam, R.; Azmi, M.H.; Mohamad, H.; Saad, S.A.; Daradkeh, Y.I. Millimetre-Wave Propagation Channel Based on NYUSIM Channel Model With Consideration of Rain Fade in Tropical Climates. IEEE Access 2021, 10, 1990–2005. [Google Scholar] [CrossRef]
  50. Kola, A.F.; Kurnaz, Ç. Analysis of MIMO Channel Capacity at 28/73 GHz with NYUSIM Channel Simulator. Int. J. Eng. Res. Dev. 2023, 15, 212–218. [Google Scholar] [CrossRef]
  51. Roy, P.; Vishwakarma, R.K.; Jain, A.; Singh, R. Multiband millimeter wave antenna array for 5G communication. In Proceedings of the 2016 International Conference on Emerging Trends in Electrical Electronics & Sustainable Energy Systems (ICETEESES), Sultanpur, India, 11–12 March 2016. [Google Scholar]
  52. Lassabe, F.; Canalda, P.; Chatonnay, P.; Spies, F.; Baala, O. A Friis-based calibrated model for WiFi terminals positioning. In Proceedings of the Sixth IEEE International Symposium on a World of Wireless Mobile and Multimedia Networks, Giardini Naxos, Italy, 13–16 June 2005. [Google Scholar]
  53. Available online: https://samsun.mgm.gov.tr/istasyonlar.aspx (accessed on 14 May 2023).
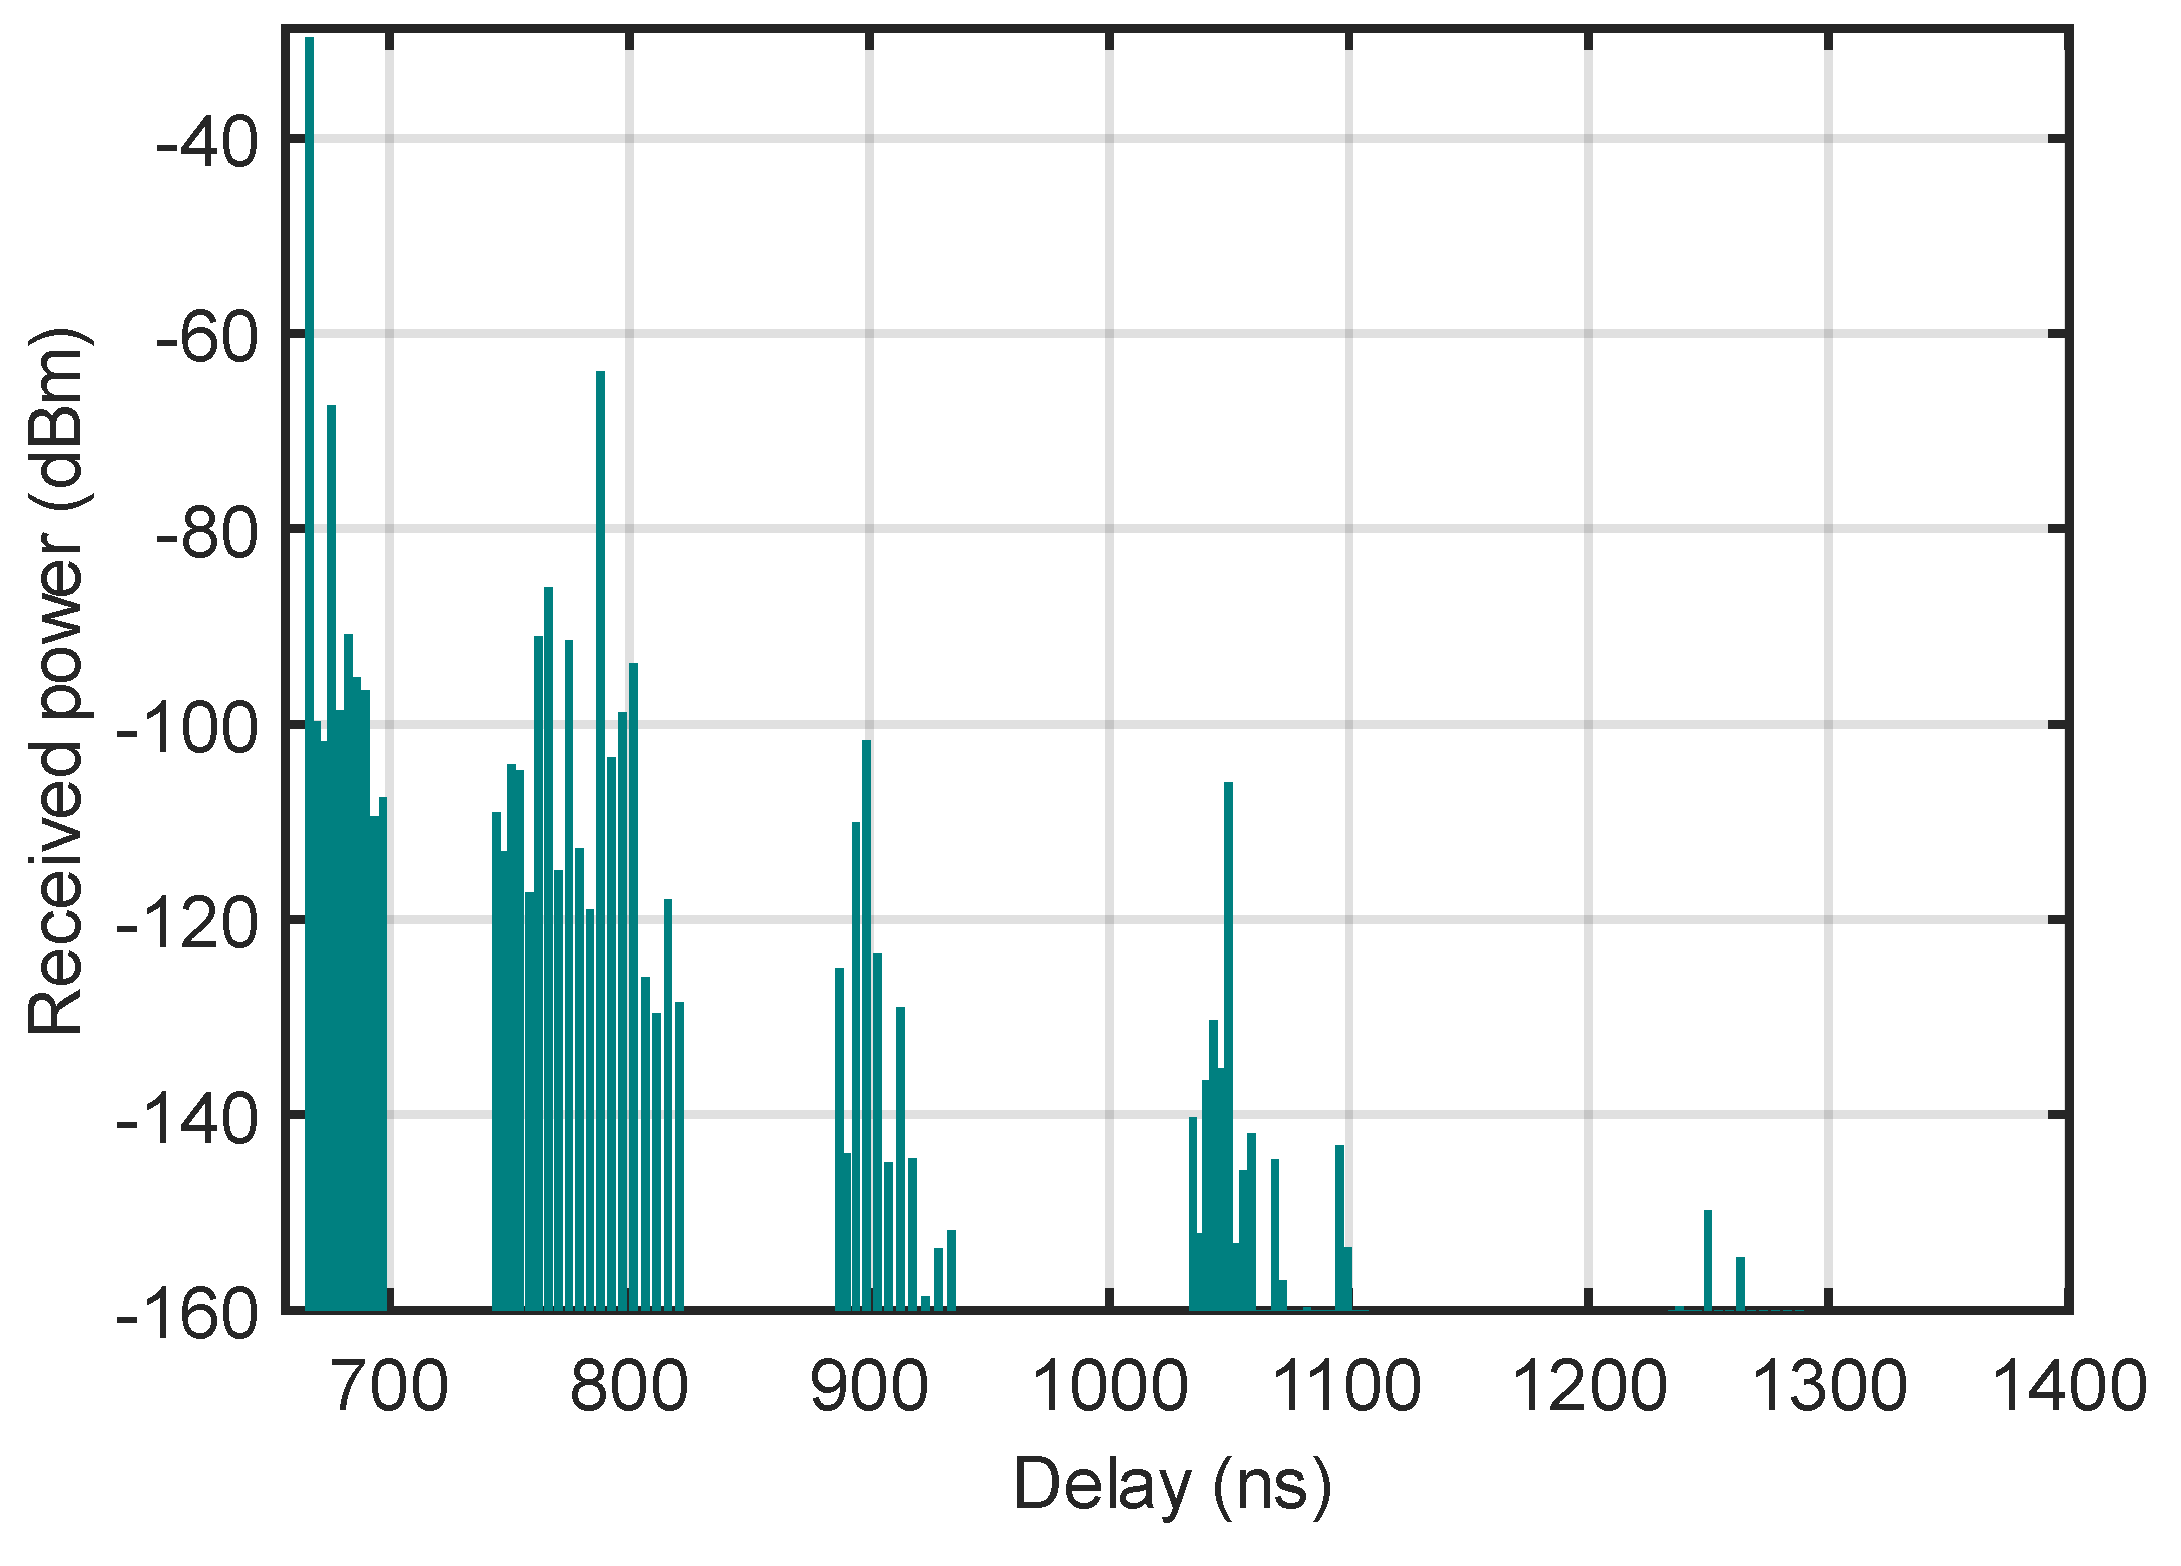
Figure 1. A sample of power delay profile.
Electronics 12 02273 g001
Figure 2. Frequency response of the PDP in a UMi environment with 28 GHz and LOS conditions.
Electronics 12 02273 g002
Figure 3. NYUSIM simulator interface for illustration only.
Electronics 12 02273 g003
Figure 4. Locations of annual climate data in Samsun, Turkey.
Electronics 12 02273 g004
Figure 5. Annual climate data: (a) rain rate, (b) temperature, (c) humidity, (d) barometric pressure.
Electronics 12 02273 g005
Figure 6. Transceiver placement for LOS/NLOS situations in the UMi area.
Electronics 12 02273 g006
Figure 7. PDFs for Umi: (a) 28 GHz/LOS, (b) 39 GHz/LOS, (c) 28 GHz/NLOS, (d) 39 GHz/NLOS.
Electronics 12 02273 g007
Figure 8. Frequency responses of channels for LOS and NLOS states for Umi: (a) 28 GHz, (b) 39 GHz.
Electronics 12 02273 g008
Figure 9. Annual average channel capacities for the UMi Region: (a) LOS, (b) NLOS.
Electronics 12 02273 g009
Figure 10. UMi monthly capacity change for 40 dB SNR: (a) 28 GHz/LOS, (b) 39 GHz/LOS, (c) 28 GHz/NLOS, (d) 39 GHz/NLOS.
Electronics 12 02273 g010
Figure 11. Transceiver placement for LOS/NLOS situations in the UMa area.
Electronics 12 02273 g011
Figure 12. UMa monthly capacity change for 40 dB SNR: (a) 28 GHz/LOS, (b) 39 GHz/LOS, (c) 28 GHz/NLOS, (d) 39 GHz/NLOS.
Electronics 12 02273 g012
Figure 13. Transceiver placement for LOS/NLOS situations in the RMa area.
Electronics 12 02273 g013
Figure 14. RMa monthly capacity change for 40 dB SNR: (a) 28 GHz/LOS, (b) 39 GHz/LOS, (c) 28 GHz/NLOS, (d) 39 GHz/NLOS NYUSIM.
Electronics 12 02273 g014
Figure 15. In the case of LOS, the annual average channel capacities of the three measurement centers are at 28 and 39 GHz frequencies.
Electronics 12 02273 g015
Figure 16. In the case of NLOS, the annual average channel capacities of the three measurement centers are at 28 GHz and 39 GHz frequencies.
Electronics 12 02273 g016
Table 1. A Summary of MIMO and mmWave studies presented in the literature.
Ref.ScenarioFrequency (GHz)Key Highlights
[1]UAV-to-Ground Communications28A three-dimensional non-stationary wideband channel model
[2]Vehicle-to-vehicle MIMO communication28A three-dimensional non-stationary irregular-shaped geometry-based stochastic model
[3]Future wireless communication systems28, 38, 60, 73Propagation characteristics (i.e., path loss, atmospheric and rain attenuation)
[4]Massive MIMO-based indoor communication26.5 to 32.5Multipath propagation mechanisms (i.e., LOS blockage, reflection, and diffraction)
[5]Future wireless communication systems28 to 100The path loss model
and analysis of path loss and delay spread
[6]Urban macrocell28, 39Delay and angular spreads based on channel
[7]Vehicular communication28, 32, 39The human body, vehicle blockage, outdoor path loss, and V2V measurements
[8]Indoor communication30The path loss, K-factor, and rms delay spread
[9]Cellular Communication0.8–70AI-based path loss modeling
Table 2. Existing studies in the literature and comparison with proposed work.
ReferenceFrequencies (GHz)ScenariosEnvironmentDistances (m)Bandwidth (MHz)AntennaClimate DataReal Field Measurements
for Climate Data
Analysis
[29]38, 60, 73UMiLOS
NLOS
1008001 × 1NoNoPath Loss
[34]28UMiLOS10, 50, 100, 3008001 × 1NoNoPDF, BER
[35]28UMi, UMaLOS, NLOS200
200, 500
200-NoNoRMS Delay Spread, Received Power
[39]77UMiNLOS2008002 × 2,
4 × 4
NoNoPath Loss, Channel Capacity
[40]3.5, 26, 28UMiNLOS200200-Rain RateNoOutage Probability
[41]6, 28, 38, 60, 73, 100UMi-10–500--Rain Rate, Humidity,
Temperature, Pressure
NoPath Loss
[42]28 GHzUMiNLOS-200-TemperatureNoOutage Probability
[45]26, 41UMiNLOS100, 500, 100020064 × 64Rain RateNoOutage Capacity
[47]28, 45, 60, 73UMaLOS508002 × 2Humidity,
Temperature
NoReceived Power
[48]28UMiNLOS200400-HumidityNoOutage Probability
[49]38UMiLOS300 m8001 × 1Rain RateYesPath Loss, Received Power
[50]28, 73UMiLOS, NLOS200 m8002 × 2,
4 × 4
8 × 8
16 × 16
32 × 32
64 × 64
Rain Rate, Humidity,
Temperature, Pressure
NoChannel Capacity
This work28, 39UMi, UMa, RMaLOS, NLOS200
500
8004 × 4Rain Rate, Humidity,
Temperature, Pressure
YesChannel Capacity
Table 3. Channel Parameters.
Channel ParametersScenarios
SamsunBafraOndokuzmayıs
ScenarioUMiUMaRMa
Frequency28/39 GHz
EnvironmentLOS/NLOS
Distances200 m (LOS)/500 m (NLOS)
Bandwidth800 MHz
MIMO4 × 4
Tx Power30 dB
BS Height20 m
User Height1.5 m
Table 4. Correlation coefficients between climate parameters and locations.
Correlation CoefficientRain RateTemperatureHumidityPressure
UMi-UMa0.180.990.860.99
UMi-RMa0.310.990.930.46
UMa-RMa−0.160.990.920.49
Table 5. Statistical values of annual climate data.
UMiUMaRMa
Rain rate (mm/h)Max3.013.922.78
Min1.080.190.24
Average2.032.271.31
Temperature (°C)Max25.6124.9025.24
Min7.937.057.17
Average15.6514.7815.02
Humidity (%)Max82.9777.5288.31
Min59.1363.7273.07
Average72.1670.9681.29
Pressure (mbar)Max1020.981007.721020.68
Min1009.63997.201009.98
Average1015.981002.931013.82
Table 6. Correlation coefficients between climate parameters and capacity for UMi.
Correlation CoefficientRain RateTemperatureHumidityPressure
Channel capacity28 GHzLOS−0.740.66−0.04−0.61
NLOS−0.900.16−0.14−0.49
39 GHZLOS−0.750.200.05−0.58
NLOS−0.830.340.06−0.54
Table 7. Correlation coefficients between climate parameters and capacity for UMa.
Correlation CoefficientRain RateTemperatureHumidityPressure
Channel capacity28 GHzLOS−0.87−0.03−0.47−0.45
NLOS−0.660.29−0.43−0.70
39 GHZLOS−0.800.16−0.43−0.53
NLOS−0.760.19−0.42−0.54
Table 8. Correlation coefficients between climate parameters and capacity for RMa.
Correlation CoefficientRain RateTemperatureHumidityPressure
Channel capacity28 GHzLOS−0.970.43−0.200.63
NLOS−0.960.41−0.040.44
39 GHZLOS−0.910.390.030.51
NLOS−0.750.23−0.230.54
Table 9. Comparison of this work with existing studies.
Ref.YearAnalysisFrequency (GHz)LOS/NLOSMIMOResults
[3]2017Received Power, Number of Antenna Elements28, 38, 60, 73LOS/NLOS-As frequencies go up, the number of antennas needed grows exponentially. Frequencies of 57, 60, and 64 GHz are not suitable for outdoor use
[29]2019Path Loss38, 60, 73LOS/NLOS1 × 160 GHz is more impacted by environmental changes, whereas 38 GHz is more resilient to environmental factors.
[40]2019Outage Probability26, 28--Rainfall of 150 mm/hour results in signal loss of 5.4894 dB at 28 GHz, 5.1135 dB at 26 GHz, and 2.0533 dB at 3.5 GHz.
[47]2021Received Power28, 45, 73LOS2 × 2At 28 GHz, power efficiency is highest, while at 45 GHz, resistance to seasonal atmospheric changes is strongest.
[49]2021Path Loss, Received Power38LOS1 × 1Rain attenuation exceeds 15 dB at 38 GHz and has an impact of over 1 dB within 200 m transceiver distances.
[50]2023Channel Capacity28, 73LOS/NLOS2 × 2
to
64 × 64
Increasing from 2 × 2 to 64 × 64 results in a 36.88× capacity increase, using 28 GHz instead of 73 GHz provides a 12.56× increase, and switching from NLOS to LOS leads to a 307.7× increase in channel capacity.
This Study2023Channel Capacity28, 39LOS/NLOS4 × 4UMi and UMa have higher channel capacity than RMa for LOS, while for NLOS, UMa has the highest capacity and UMi has the lowest. There is a strong negative correlation between channel capacity and rain rate.
Disclaimer/Publisher’s Note: The statements, opinions and data contained in all publications are solely those of the individual author(s) and contributor(s) and not of MDPI and/or the editor(s). MDPI and/or the editor(s) disclaim responsibility for any injury to people or property resulting from any ideas, methods, instructions or products referred to in the content.