Abstract
With the increasing requirements for unmanned aerial vehicle (UAV) communication in various application scenarios, the UAV-assisted emergency communication in urban transportation scenario has received great attention. In this paper, a novel UAV-assisted UAV-to-vehicle (U2V) geometry-based stochastic model (GBSM) for the urban traffic communication scenario is proposed. The three-dimensional (3D) multi-mobilities of the transmitter (Tx), receiver (Rx), and clusters are considered by introducing the time-variant acceleration and velocity correspondingly. The velocity variation of the clusters is used to simulate the motion of vehicles around the Rx. Moreover, to describe the vehicles’ moving states, Markov chain is adopted to analyze the changes in cluster motion states, including survival, death, dynamic, and static states. By adjusting the scenario-specific parameters, such as the vehicle density () and dynamic–static ratio (), the model can support various urban traffic scenarios. Based on the proposed model, several key statistical properties, namely the root mean square (RMS) delay spread, temporal autocorrelation function (ACF), level-crossing rate (LCR), power delay profile (PDP), and stationary interval, under different clusters and antenna accelerations are obtained and analyzed. The accuracy of the proposed model is verified by the measured data. The results demonstrate the usability of our model, which can be provided as a reference for the design, evaluation, and optimization of future communication networks between UAV and vehicles in urban transportation emergency communications.
1. Introduction
In addition to enhancing the performance indexes of fifth-generation (5G) communication and studying its channel characteristics, the future sixth-generation (6G) communication will attach more importance to the flexibility and dimensionality of the network and realize space–air–ground–sea networks by integrating unmanned aerial vehicles (UAVs) with satellite, ground, and ocean communication technologies [1,2,3,4,5]. As an important part of 6G communication, UAV communication can serve as mobile base station to provide extensible network coverage [6]. It has gained widespread usage in various application scenarios, including ground communication, environmental monitoring, disaster rescue, and military operations.
Due to their advantages of flexible deployment, strong adaptability, and wide coverage, UAVs are considered in emergency communication [7]. UAVs, as base stations, can increase the service ranges of cellular networks and provide high-quality communications [8,9]. They can not only resolve the limitations of facilities construction caused by terrain, climate, and natural disasters, but also effectively guarantee the popularization of emergency communication services [10,11,12]. Meanwhile, they can further improve the capacity and level of emergency communication and make the communication services more stable. As a typical application scenario, UAV-assisted urban transportation emergency communication has attracted increasing attention. For instance, traffic congestion impedes signal transmission, leading to difficulties in normal data transmission. Additionally, during urban transportation communication, the buildings and vehicles around the cars may interfere with vehicle-to-vehicle (V2V) communication. Therefore, it is meaningful to develop UAV-assisted emergency communication in urban transportation. To better design the future UAV-assisted emergency communication system, an accurate UAV-assisted multi-mobility channel model that can describe the real propagation characteristics is essential.
1.1. Related Works
Currently, a multitude of studies have been conducted on UAV air-to-ground (A2G) channel measurements and modeling [13,14,15,16]. Based on the measurement method, the characteristics of UAV channels are studied according to a large number of UAV channel measurement data. In [17], the UAV A2G channel measurement was carried out at 5120 MHz with a 20 MHz bandwidth. For different scenarios, the parameters of the aircraft motion state and transmitter–receiver ranges, as well as the influence of shadowing caused by wings and engines, and the root mean square (RMS) delay spread were presented. The results indicated that in a topography characterized by medium mountainous regions, the channel is primarily influenced by line-of-sight (LoS) propagation, accompanied by moderate levels of multipath effects. In [18], an airport surface area channel measurement at the 5 GHz band was conducted and the power delay profiles (PDPs) were studied. In [19], channel measurements at the center frequencies of 2.585 GHz and 3.5 GHz in a hilly scenario were presented. The key channel characteristics were analyzed, including the path loss (PL), shadow fading (SF), Rician K-factor, RMS delay spread, and temporal autocorrelation function (ACF). The results can guide the construction of future UAV communication systems in hilly scenarios. Channel measurement is the most intuitive method of studying wireless channels. Databases are often used to develop empirical models or for comparison to analyze and validate models. However, the establishment of databases is expensive and time-consuming.
There are two simulation-based methods, namely the deterministic modeling method and stochastic modeling method. Ray tracing (RT) is an important deterministic modeling technique that accurately illustrates the electromagnetic wave propagation behavior. In [20], an urban UAV-to-UAV (U2U) communication at 1420 MHz scenario was studied through measurement and RT methods. The delay and power distribution of the multipath components (MPCs) were investigated. In [21], RT simulations at 28 GHz and 60 GHz were used to analyze the behavior of an A2G millimeter-wave (mmWave) system. However, the use of the deterministic method to simulate time-varying channels can cause significant computational complexity and inconvenience for research and optimization. In stochastic channel modeling, a channel model is established by describing the propagation channel as a random process. Considering the unique channel characteristics of air-to-air (A2A) channels, a series of A2A geometry-based stochastic models (GBSMs) have been investigated. In [22], a three-dimensional (3D) non-stationary A2A GBSM considering a Markov mobility model is proposed. It mainly focuses on the study of UAV movement in 3D space. In [23], a 3D non-stationary wideband A2A GBSM is proposed, which introduces the velocity and trajectory changes of the transmitter (Tx) and receiver (Rx). By introducing 3D arbitrary movement and time-domain non-stationarity, a 3D non-stationary wideband A2A GBSM is proposed [24]. Based on the proposed models, some typical characteristics are further investigated. In [25], a geometric-based mobile-to-mobile channel model for mmWave communications was proposed. The cluster-based non-isotropic scattering at both ends of the radio link was abstracted as a two-ring model, and some typical statistical properties were investigated. Based on the standardized modeling method, a 3D non-stationary wideband multiple-input multiple-output (MIMO) channel model was proposed. Key statistical properties, such as the spatial cross-correlation function (CCF), temporal ACF, Doppler power spectral density (PSD), level-crossing rate (LCR), average fading duration (AFD), and stationary interval, were investigated and analyzed [26,27]. In [28], a 3D non-stationary wideband end-to-end channel model was presented. Important statistical properties of the channel model were analyzed, including the Doppler PSD, RMS delay spread, stationary interval, temporal ACF, and spatial CCF. In [29], a 3D GBSM for A2A communications was presented. Based on the proposed model, some essential channel characteristics were analyzed, such as the space–time correlation function (STCF), Doppler PSD, RMS delay spread, and stationary interval. In [30], a space–time–frequency (STF) non-stationary UAV channel model with a 3D continuously arbitrary trajectory as well as self-rotation was proposed. Some important channel characteristics were analyzed, such as the STCF, Doppler PSD, PDP, and stationary interval. It was shown that a increase in acceleration causes a lower temporal correlation, higher spatial correlation, flatter distribution of Doppler PSDs, and smaller stationary intervals. In [31], a 3D V2V GBSM was proposed. Important statistical properties, such as the STCF, CCF, ACF, and Doppler PSD, were analyzed. Simulation results showed that the vehicular traffic density (VTD) had an important influence on the statistical properties of the channel model.
There are some studies that have conducted wireless channel modeling for urban transportation. For instance, in [32], a UAV-assisted A2G MIMO channel model for urban environments was provided. The channel capacity and channel correlation were investigated. In [33], the narrow-band characteristics of A2G propagation in UAV-assisted communication systems was explored. In [34], a mmWave A2G channel model for low-altitude urban areas was studied. Some typical channel characteristics were obtained by measuring the influence of rotating the directional horn antennas in both the azimuth and elevation angles. In [35], the characteristics of electromagnetic wave propagation were considered, and the electromagnetic field distribution of mobile communication base stations in complex urban environments was simulated using the RT method and high-frequency asymptotic method.
1.2. Motivation and Contributions
Many existing channel models focus on UAV A2G communication in common scenarios, such as suburban environments and campuses, and rarely consider the propagation channel of urban transportation in emergency situations. Moreover, most of the conducted research works consider the influence of UAVs’ movement and the static scatterers between the Tx and Rx. For urban transportation emergency communication, the unique characteristics of the propagation channel should be considered, such as the vehicle density around the Rx, multi-mobility, and vehicle moving state. We still lack an accurate U2V channel model to describe the UAV-assisted urban transportation communication channel. The main contributions of this work are listed below.
(1) A novel UAV-assisted multi-mobility channel model is proposed, which involves the acceleration of the Tx, Rx, and clusters around the Rx. Meanwhile, the velocity variation of clusters is considered to simulate the motion of vehicles around the Rx.
(2) For the UAV-assisted communication in urban transportation scenario, Markov chain is introduced to describe the vehicles’ moving states, which can make the evolution process of clusters more realistic.
(3) The impacts of scenario-specific factors such as vehicle density , the dynamic–static ratio , and the acceleration of clusters, on channel characteristics are introduced and analyzed. Moreover, the statistical properties of the U2V channel model, including the temporal ACF, time-variant PDP, stationary interval, LCR, and RMS delay spread, are studied and the simulation results are verified through analysis results and measurement data.
The rest of this article is organized as follows. In Section 2, the proposed channel model is described in detail, including the birth and death process of clusters along with the evolution of the Markov chain. Some statistical properties, such as the temporal ACF, RMS delay spread, time-variant PDP, stationary interval, and LCR, are derived in Section 3. In Section 4, the simulation results for various statistical characteristics are analyzed. Finally, the conclusions and future work are given in Section 5.
2. A Novel UAV-Assisted Communication Channel Model for Urban Transportation
2.1. UAV-Assisted Communication Architecture for Urban Transportation Scenario
A novel UAV-assisted communication network architecture for urban transportation emergency communication is shown in Figure 1. To better serve the intelligent urban transportation network and improve the communication quality during traffic jams, a UAV is introduced to serve as a mobile station to provide auxiliary communication. The UAV is set as Tx and the vehicle is set as Rx. When transmitted through the propagation channels, the signal is affected by two factors. One is the fixed obstacles and irregularly moving objects, including the urban streets and the buildings along them, and the other is regular mobile obstacles, such as the moving vehicles around the Rx. For the regular mobile vehicle obstacle, it also contains several cases, such as the acceleration process of the vehicle, the deceleration process of the vehicle, and the static state of the vehicle. Moreover, the moving direction relative to the Rx in the same direction or in reverse on the same road should be considered. Based on the basic UAV-assisted communication network architecture, the channel model and characteristics are further investigated.
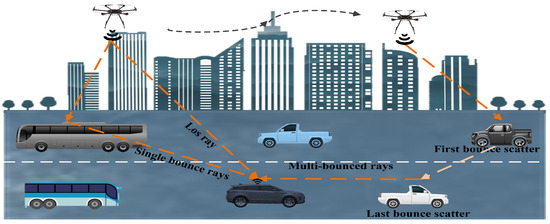
Figure 1.
The framework of UAV-assisted communication in urban transportation.
2.2. UAV-Assisted Communication Multi-Mobility Channel Model
The propagation channel between the Tx and Rx can be described as a multi-mobility MIMO channel model, considering the mobility of the Tx, Rx, and moving vehicles around the Rx. During the modeling process, the fixed obstacles and irregular moving objects between the Tx and Rx are abstracted as a twin-cluster model to depict the multi-bounce (MB) propagation path, as shown in Figure 2a. The mobile obstacles with regular moving trajectories are abstracted as a single-cluster model to mimic the single-bounce (SB) propagation path, as shown in Figure 2b. The MB paths are mainly caused by the pedestrians around the road, vehicles changing direction, buildings, trees, etc. The SB path describes propagation paths mainly caused by moving objects with regular trajectories, which are mainly vehicles moving in the same direction or in reverse on the same road near the vehicle.
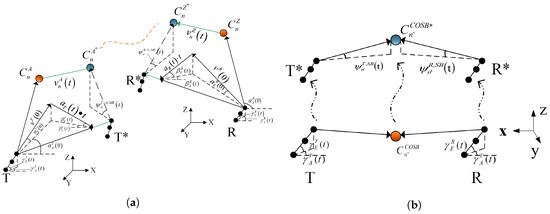
Figure 2.
A 3D non-stationary U2V GBSM with multi-mobility of Tx, Rx, and clusters. (a) The multi-bounce case of the propagation channel and (b) the single-bounce case of the propagation channel.
Figure 2a depicts the MB path within the model. To simplify the description of the model, only the nth (n = 1, …, (t)) cluster is illustrated in detail, in which (t) is the total cluster number between the Tx and Rx at the time instant t. In the nth cluster, denotes the first bounce cluster, and denotes the last bounce cluster. and constitute their respective positions after undergoing a shift for a given period. The propagation path between and is abstracted as a virtual link with a given delay. has a velocity of (t) and has a velocity of (t). The initial velocity of Tx is (0), while the acceleration of Tx is (t). Symmetrically, the initial velocity of Rx is (0) and the acceleration of Rx is (t). Additionally, (t) and (t) refer to the unit vectors that extend from Tx to and Rx to , respectively.
Figure 2b displays the SB path within the model. Referring to the MB path, only the n′th (n′ = 1, …, (t)) cluster is illustrated in detail. designates the single cluster, and constitutes their respective positions after undergoing a shift for a given period. Similar to the MB path, the Tx, Rx, and can move with a certain acceleration and initial velocity. (t) is the velocity of . Additionally, (t) and (t) encompass the unit vectors that extend from Tx, Rx to , respectively. The unit vector that extends from Tx to Rx is (t).
2.2.1. Description of Channel Model
Let us consider a multi-mobility MIMO system deploying pth antenna units at the UAV (Tx) and qth antenna units at the vehicle (Rx), respectively. Then, the channel impulse response (CIR) between the pth Tx antenna element and the qth Rx antenna element, i.e., , can be represented by the superposition of the LoS, the MB, and the SB components. It can be expressed as [36]
where is the K-factor.
The MB and SB parts constitute the NLoS case. The MB and SB components can be established as twin-cluster and single-cluster models, respectively. For the MB component, it mainly considers the influence of some fixed obstacles and irregular moving objects and can be expressed as [37]
For the SB component, it focuses on the influence of regular mobile obstacles around the Rx and can be expressed as
where and are the antenna patterns of Tx/Rx for vertical and horizontal polarizations. , , , and are modeled as random variables uniformly distributed over , which are initial phases for four different polarization combinations. is the cross-polarization power ratio. represents the power of the mth ray of the nth cluster between the pth Tx antenna and the qth Rx antenna. The meanings of the similar variables in (3) are the same as those above, so we will not repeat them here. Furthermore, and , respectively, represent the phase shift caused by the relative movement of multiple clusters/single clusters with antennas. In the MB case, the clusters A and Z represent the nearest clusters to the Tx and Rx antennas, respectively. The represents the phase shift caused by the mth ray of the nth cluster pair, i.e., cluster A and cluster Z (), which is expressed as [38]
where denotes the initial phase, which is a random constant uniformly distributed over the interval (0,2). Furthermore, denotes the Doppler frequency component corresponding to the motion of the Tx antenna and cluster A. denotes the Doppler frequency component corresponding to the motion of the Rx antenna and cluster Z. These components can be expressed as follows [39]:
Note that can be determined as in the above formula to substitute for , for , and for . represents the carrier wavelength, which can be approximated as a constant. Moreover, and denote the velocities of the Tx and Rx antenna arrays, respectively. and correspond to the velocities of clusters A and Z, respectively. The calculation of these velocity parameters is provided below. Additionally, , denote the unit vectors in the departure and arrival directions, respectively. It can be expressed using the following formula:
where can be determined by substituting for and for . , represents the coordinates of clusters A and Z at time t, respectively, while (t) denotes the coordinates of the pth Tx antenna and qth Rx antenna at time t. Regarding the velocities of the antenna arrays and clusters, X can be described as {T, R, A, Z, COSB (cluster of SB)}. The expression of the velocity can be obtained as follows:
It should be noted that represents the magnitude of velocity at time t = 0 s and represents the magnitude of acceleration at time t. is the elevation angle of velocity at time t = 0 s and is the azimuth angle. denotes the elevation angle of acceleration and denotes the azimuth angle. Thus, the coordinate of the first antenna of the Tx antenna array and the Rx antenna array can be given by the following formula:
where (, , ) is the initial coordinate of the first antenna. The coordinates of the pth Tx antenna and the qth Rx antenna at time t can be expressed as
Note that represents the distance between adjacent antennas of the Tx and Rx arrays. The elevation angle of the Tx or Rx antenna array at time t is (t), and the azimuth angle of the Tx or Rx antenna array is (t). They can be calculated by , and , respectively. The rotational speeds of the Tx and Rx antenna arrays are and . , , and are the initial distances from the cluster to the antenna. represents the coordinates of the center of cluster A, represents the coordinates of the center of cluster Z, and represents the coordinates of the center of the SB cluster, which can be expressed by the following formula:
The coordinates of rays can be expressed as
where , , and are random variables conforming to a 3D Gaussian distribution. Similar to the MB case, the parameters of the SB case can be obtained. The Doppler shift can be given by the following formula:
where (0) is the initial phase and is a random constant uniformly distributed over (0, 2). and , respectively, represent the Doppler frequencies determined by the movement of the cluster, Tx antenna, and Rx antenna, which can be expressed as
By substituting for and for , can be determined. is the velocity of the cluster. and are the unit vectors of the departure angle and arrival angle, which can be expressed as
Referring to expression (17), can be acquired by substituting for . is the coordinate of the unique cluster. Moreover, the power (t) can be expressed by the following formula [39,40]:
Note that is a cluster shadow in the form of dB. is the delay scalar, is DS, and is the delay of the path, which can be expressed as
where c is the speed of light; denotes the time delay caused by the propagation distance of the virtual link between and and can be expressed as
where is the distance between and , and is a random quantity uniformly distributed within (0, 1) [40]. is the distance between the Tx/Rx antenna and the ray within the cluster, which can be expressed as
For the LOS case, similar to the calculation of the NLOS component, the related expressions of the LOS component can be obtained.
2.2.2. Cluster Evolution with Markov Chain
To describe the dynamic and static states of clusters, and the influence of the cluster density on the channel model, the vehicle density () and dynamic–static ratio () are proposed.
The ratio of the number of dynamic clusters () to the number of static clusters () is expressed as follows:
The statistical average number of cars in the valid observation length (within 20 m of the front and rear of the Rx) at the same time () is expressed as follows:
Due to the continuous movement of the Tx and Rx antenna arrays, as well as the clusters, the clusters that exist at a given moment may not be visible at the next moment, and new clusters may appear at any time. Such a process can be described as the birth and death of clusters. A cluster is deemed to survive only after it is observed by both the Tx and Rx antennas. If the trajectories of the antenna arrays are divided into several short segments, and the channel within each segment is considered constant, then, for a given vehicle track segment , the survival rate of cluster can be expressed as follows [36]:
Note that represents the scene correlation factor in the time domain [37], denotes the scene-dependent correlation factor in the array domain, and is the recombination rate. The change of the motion state of clusters is shown in Figure 3. In the application scenario, the dynamic clusters, such as cars and pedestrians, exhibit two random states of motion, namely a dynamic state and static state. This random process has no memory, meaning that the state at time t + 1 is independent of other random variable conditions, given the state at time t. Therefore, the random process conforms to the Markov property and can be described by the Markov chain model. The Markov chain is a random process with the Markov property and exists within a discrete exponential set and state space. It comprises a state space, initial state, and state transition probability matrix. The state space refers to the set of all possible states, while the initial state is the state of the system at time 0. The state transition probability matrix denotes the probability of the system transitioning from one state to another state at any given time. The conditional probability of the Markov chain satisfies the following relationship [41]:
where X is a Markov chain. According to the Markov chain, the flowchart to determine the state of the cluster is as given in Figure 4.
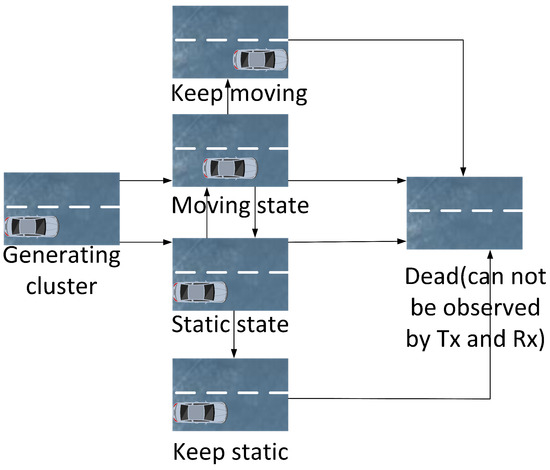
Figure 3.
State transition diagram of a cluster in a Markov chain.
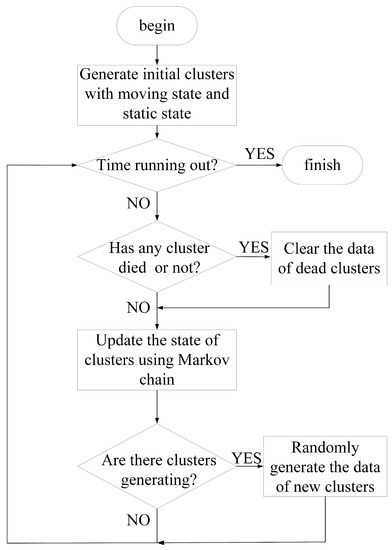
Figure 4.
Markov chain code flowchart.
Here, the probability of the clusters remaining static at time t is as follows:
Among them, are the probability of the cluster being static, the probability of the cluster remaining static, the probability of the cluster remaining dynamic, and the probability of the cluster changing from dynamic to static. The probability of the cluster remaining dynamic at time t is described as follows:
It should be noted that and are the probability of the cluster remaining dynamic and the probability of the cluster changing from static to dynamic, respectively. A summary of the key parameter definitions is given in Table 1.

Table 1.
Summary of key parameter definitions.
3. Typical Statistical Properties of Proposed Model
3.1. Temporal ACF
The temporal ACF reflects the non-stationarity property of the channel in the time domain. Moreover, it can be illustrated by two CIRs in different time instants, namely (t) and (). The specific expression of the temporal ACF is
Substituting (1) into (29), the temporal ACF consists of two parts, i.e., the LoS part and NLoS part:
The NLOS component, including the MB case and SB case, is expressed as
where is the amplitude expressed by and represents the velocity difference between and or and at time 0. The expression of is similar to .
The LOS component is calculated as
3.2. RMS Delay Spread
The RMS delay spread is established to capture the degree of transmitting signal dispersion in the time delay domain. It can be mathematically expressed as follows:
where
3.3. Time-Variant PDP
The time-variant PDP directly reflects the power distribution along the delay of MPCs. This can be mathematically expressed as
The is a time-variant function influenced by the time-variant delays of the rays within clusters. These delays correspond to updates in geometric information within the propagation space. It should be noted that only surviving clusters contribute to the PDP [40]. The change in PDP is a result of the evolution of clusters, which is dependent on the vehicle’s speed and trajectory. Therefore, different trajectories and velocities will result in distinct PDP trends.
3.4. Stationary Interval
The stationary interval is the maximum interval in which the channel remains stationary. The length of the stationary interval is determined by the characteristics of the channel, as well as the requirements of the specific application. In certain cases, a sufficiently long stationary interval is necessary to ensure that the channel’s statistical properties remain stable. However, shorter stationary intervals can be employed in other applications to enable quicker adaptation to changes in the channel. To calculate the stationary interval, the local stationary region (LRS) method is utilized [36]. Initially, the correlation coefficients between two PDPs at time t and are computed, which can be derived as
The stationary interval is the maximum time duration over which the LRS correlation coefficient exceeds a given threshold, i.e., , and can be calculated as
3.5. LCR
The envelope LCR is a fundamental second-order statistical parameter that plays a crucial role in characterizing the envelope fading associated with a signal, by capturing key features of its dynamic temporal behavior. Specifically, the calculation of the LCR enables the estimation of the rate at which the channel undergoes changes over time. The LCR is mathematically defined as the expected number of crossings made by the signal envelope across a predefined threshold from top to bottom (or bottom to top). The calculation of the LCR can be found in [27].
4. Results and Analysis
Figure 5 illustrates the temporal ACFs of the U2V channel model under different moving accelerations of clusters around the Rx. Here, different motion states of the clusters are considered, including static to dynamic, dynamic to static, and dynamic to dynamic. Moreover, the state of dynamic to dynamic contains both increased acceleration and decreased acceleration. In the simulation, we can observe that within a time difference, the analytical results match well with the simulation results, showing the validity of the proposed model under different motion states. In addition, the temporal ACFs present different variation trends under different states, which show that the changes in acceleration will have an influence on the temporal ACFs. During the given time difference, when the cluster moves from a static to a dynamic state with a fixed acceleration 7.5 m/s, the temporal ACF declines the fastest. Meanwhile, when the cluster moves from a dynamic to a static state with a fixed acceleration −7.5 m/s, the temporal ACF falls the slowest. In the case of variable acceleration, the temporal ACF with increased acceleration declines faster than that with decreased acceleration. From the figure, it can be seen that the channel changes faster with the increase in acceleration, which brings a smaller coherence time. The temporal ACFs present a slower variation trend with decreased acceleration. Hence, the moving velocity and motion state of the vehicles around the Rx will have an influence on the temporal ACFs.
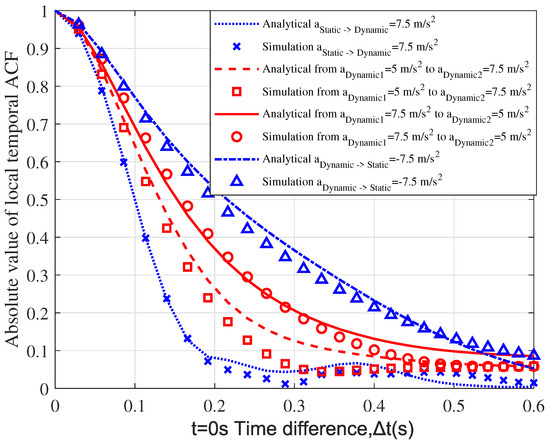
Figure 5.
Absolute value of temporal ACF ((0) = 5 m/s, = 3 m/s, (0) = 3 m/s, = 1 m/s, = 50, = 1).
Figure 6 illustrates the cumulative distribution functions (CDFs) of the stationary interval for clusters with different acceleration. The joint effects of different dynamic–static ratios and accelerations of clusters on the stationary intervals are investigated. From Figure 6, it can be observed that a decreased will lead to a larger stationary interval when all other conditions are kept consistent. denotes the ratio of the cluster number from the dynamic state to static state. With a decreasing ratio, the number of vehicles around the Rx becomes much smaller, and the channel tends to be stable. Moreover, under the same conditions, the stationary interval of the channel in vehicle deceleration motion is larger than that of the acceleration motion case. Hence, the dynamic–static states and the acceleration of clusters around the Rx have some effects on the stationary interval.
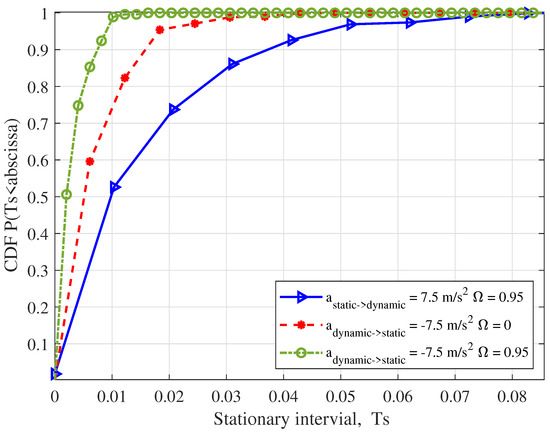
Figure 6.
CDFs of stationary interval with different cluster accelerations, ((0) = 5 m/s, = 3 m/s, (0) = 3 m/s, = 1 m/s, = 0, = 0.7854, = 0.997).
Figure 7 shows the time-varying PDP corresponding to different . The initial velocity of the UAV is set as 1 m/s, and the acceleration is set as 0.5 m/s. The setting of vehicles is the same. For vehicles near the Rx, the acceleration is 2 m/s, the maximum speed is 10 m/s, and random motion states are assigned, e.g., acceleration, deceleration, uniform speed, etc. From Figure 7a–d, we can observe the variations in the cluster parameters, such as the power, the delay, and the phenomenon of clusters’ birth and death. It can be seen that the LoS is the left-most path with the shortest delay and strongest power. As increases, more clusters survive and more possible paths exist, which is consistent with our actual scenarios. Furthermore, the impacts of any 3D UAVs and vehicles can be described by extending the model.
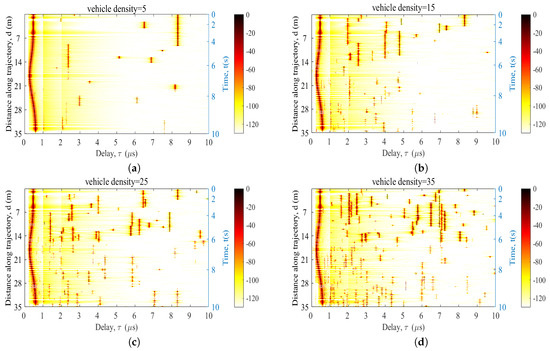
Figure 7.
Time-variant PDPs of the UAV-assisted communication channel model. (a) is 5, (b) is 15, (c) is 25, and (d) is 35. ((0) = (0) = (0) = 10 m/s, = = 0.5 m/s, = 2 m/s, = 2.5, NLOS: = 0.32, LOS: = 0.63).
Figure 8 illustrates the impact on the LCR with different accelerations of the Tx, Rx, and cluster. The initial velocity of the cluster is set as 3 m/s. The initial velocity of the Rx () is set as 1 m/s. The initial velocity of the Tx () is set as 5 m/s. The vehicles move straight while the UAV remains on a circular trajectory. The time is set as t = 1 s. The results show that the peak value of the LCR increases as , , and increase. The channel changes faster over time as the acceleration increases, and the stationarity of the channel decreases. Notably, the impact of the rising on the LCR is more significant than that of or at the same envelope level, which is consistent with reality.
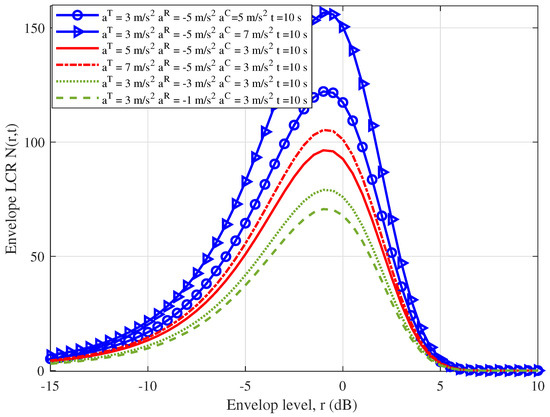
Figure 8.
Envelope LCRs for the UAV-assisted communication channel model ((0) = 5 m/s, (0) = 1 m/s, (0) = 3 m/s, = 50, = 1).
Figure 9 shows the RMS delay spreads with different and . The acceleration of the cluster is set at 5 m/s, with an initial velocity of 0 m/s. The vehicle is set as the Rx moves along a straight-line trajectory, with an initial velocity of = 5 m/s and acceleration of = 0 m/s. Meanwhile, the UAV is implemented as the Tx moves along a straight-line trajectory. The initial velocity of = 5 m/s and acceleration of = 0 m/s are set. The time range analyzed is 0–5 s. From this figure, it can be observed that the RMS delay spread becomes smaller with an increased , indicating that higher leads to more stationary channel conditions. Additionally, the results show that the RMS delay spread increases with a growing cluster density , i.e., traffic density, and a higher can lead to a larger delay spread in the channel. It can be concluded that the traffic density around the Rx will cause more path propagation, which results in a large delay spread.
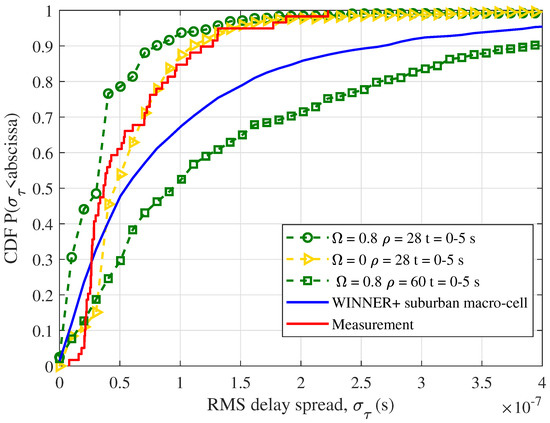
Figure 9.
CDFs of RMS delay spread ((0) = 5 m/s, = 3 m/s, (0) = 3 m/s, = 1 m/s, = 0, = 0.7854, = 0.997).
In Figure 9, the CDFs of the RMS delay spread utilizing the corresponding measured data and WINNER+ suburban macro-cell scenario for reference are provided. By setting the same parameters as in the real measurement, the CDFs of the delay spread in the case of = 0 and = 28 match well with the measurement data, which shows that the introduction of and ρ makes the channel model more practical.
5. Conclusions
In this paper, a novel UAV-assisted U2V channel model for the urban traffic communication scenario has been proposed. The model supports 3D multi-mobilities of UAVs, vehicles, and clusters between the Tx and Rx. The scenario-specific parameters, such as the vehicle density and dynamic–static ratio, have also been introduced to mimic various urban traffic scenarios. Moreover, the joint cluster evolution mechanisms, including the birth–death process and dynamic–static Markov chain, have been developed to present the motion state changes of vehicles around the Rx. Based on the proposed model, the most important statistical properties, such as the PDP, stationary interval, temporal ACF, LCR, and RMS delay spread, have been derived and analyzed. The influence of the motion states of the clusters, including acceleration, , and , on the channel characteristics have been studied correspondingly. To mimic the non-stationarity of the U2V channel, related channel statistical properties have been investigated. When the cluster moves from a static to a dynamic state with fixed acceleration, the temporal ACF declines faster, and when the cluster moves from a dynamic to a static state, the temporal ACF declines slower. Meanwhile, for the variable acceleration cases, the temporal ACF with increased acceleration declines faster than that with decreased acceleration. Furthermore, with a decrease in the dynamic–static ratios of clusters around the Rx, the stationary interval becomes larger, and with an increase in vehicle density, the delay spread tends to be larger. Finally, the simulation results have shown good agreement with the measurement data, verifying the correctness and availability of the proposed model.
Author Contributions
Conceptualization, Y.L.; formal analysis, J.L. and Y.L.; funding acquisition, Y.L.; investigation, J.L., X.H. and Q.X.; methodology, J.L., X.H. and J.Z.; resources, Y.L.; software, J.L., X.H. and J.Z.; supervision, Y.L.; validation, Y.L., J.L., X.H., J.H. and J.Z.; writing—original draft, J.L. and X.H.; writing—review and editing, Y.L., J.L., X.H., J.Z., J.H. and Q.X. All authors have read and agreed to the published version of the manuscript.
Funding
This work was supported by the National Natural Science Foundation of China (NSFC) under Grant 62001269, the State Key Laboratory of Rail Traffic Control and Safety (Contract No. RCS2022K009), Beijing Jiaotong University, and the Future Plan Program for Young Scholars of Shandong University.
Data Availability Statement
Not applicable.
Conflicts of Interest
The authors declare no conflict of interest.
References
- Wang, C.X.; Lv, Z.; Gao, X.; You, X.; Hao, Y.; Haas, H. Pervasive wireless channel modeling theory and applications to 6G GBSMs for all frequency bands and all scenarios. IEEE Trans. Veh. Technol. 2022, 71, 9159–9173. [Google Scholar] [CrossRef]
- Wang, C.X.; You, X.; Gao, X.; Zhu, X.; Li, Z.; Zhang, C.; Wang, H.; Huang, Y.; Chen, Y.; Haas, H.; et al. On the road to 6G: Visions, requirements, key technologies and testbeds. IEEE Commun. Surv. Tutor. 2023, 25, 905–974. [Google Scholar] [CrossRef]
- He, R.; Schneider, C.; Ai, B.; Wang, G.; Zhong, Z.; Dupleich, D.A.; Thomae, R.S.; Boban, M.; Luo, J.; Zhang, Y. Propagation channels of 5G Millimeter-Wave Vehicle-to-Vehicle communications: Recent advances and future challenges. IEEE Veh. Technol. Mag. 2020, 15, 16–26. [Google Scholar] [CrossRef]
- Liu, Y.; Wang, C.X.; Chang, H.; He, Y.; Bian, J. A novel non-stationary 6G UAV channel model for maritime communications. IEEE J. Sel. Areas Commun. 2021, 39, 2992–3005. [Google Scholar] [CrossRef]
- Li, B.; Fei, Z.; Zhang, Y. UAV communications for 5G and beyond: Recent advances and future trends. IEEE Int. Things J. 2019, 6, 2241–2263. [Google Scholar] [CrossRef]
- Ouamri, M.A.; Singh, D.; Muthanna, M.A.; Bounceur, A.; Li, X. Performance analysis of UAV multiple antenna-assisted small cell network with clustered users. Wirel. Netw. 2023, 29, 1859–1872. [Google Scholar] [CrossRef]
- Wang, C.; Huang, J.; Wang, H.; Gao, X.; You, X.; Hao, Y. 6G oriented wireless communication channel characteristics analysis and modeling. arXiv 2020, arXiv:2007.13958. Available online: https://arxiv.org/ftp/arxiv/papers/2007/2007.13958.pdf (accessed on 20 February 2023).
- Alkama, D.; Ouamri, M.A.; Alzaidi, M.S.; Shaw, R.N.; Azni, M. Downlink performance analysis in MIMO UAV-cellular communication with LOS/NLOS propagation under 3D beamforming. IEEE Access 2022, 10, 6650–6659. [Google Scholar] [CrossRef]
- Ouamri, M.A.; Oteşteanu, M.-E.; Barb, G.; Gueguen, C. Coverage Analysis and Efficient Placement of Drone-BSs in 5G Networks. Eng. Proc. 2022, 14, 18. [Google Scholar] [CrossRef]
- Lin, X.; Yajnanarayana, V.; Muruganathan, S.D.; Gao, S.; Asplund, H.; Maattanen, H.L.; Bergstrom, M.; Euler, S.; Wang, Y.P.E. The sky is not the limit: LTE for unmanned aerial vehicles. IEEE Commun. Mag. 2018, 56, 204–210. [Google Scholar] [CrossRef]
- Hayat, S.; Yanmaz, E.; Muzaffar, R. Survey on unmanned aerial vehicle networks for civil applications: A communications viewpoint. IEEE Commun. Surv. Tutor. 2016, 18, 2624–2661. [Google Scholar] [CrossRef]
- Zhang, Z.; Xiao, Y.; Ma, Z.; Xiao, M.; Ding, Z.; Lei, X.; Karagiannidis, G.K.; Fan, P. 6G wireless networks: Vision, requirements, architecture, and key technologies. IEEE Veh. Technol. Mag. 2019, 14, 28–41. [Google Scholar] [CrossRef]
- Kawamoto, Y.; Mitsuhashi, T.; Kato, N. UAV-Aided information diffusion for Vehicle-to-Vehicle (V2V) in disaster scenarios. IEEE Trans. Emerg. Top. Comput. 2022, 10, 1909–1917. [Google Scholar] [CrossRef]
- Huang, Z.; Cheng, X. A 3-D Non-Stationary model for beyond 5G and 6G Vehicle-to-Vehicle mmWave massive MIMO channels. IEEE Trans. Intell. Transp. Syst. 2022, 23, 8260–8276. [Google Scholar] [CrossRef]
- Stefanovic, C.; Panic, S.; Bhatia, V.; Kumar, N. On Second-Order Statistics of the Composite Channel Models for UAV-to-Ground Communications With UAV Selection. IEEE Open J. Commun. Soc. 2021, 2, 534–544. [Google Scholar] [CrossRef]
- Hua, B.; Ni, H.; Zhu, Q.; Wang, C.X.; Zhou, T.; Mao, K.; Bao, J.; Zhang, X. Channel modeling for UAV-to-Ground communications with posture variation and fuselage scattering effect. IEEE Trans. Commun. 2023, 71, 3103–3116. [Google Scholar] [CrossRef]
- Kunisch, J.; de la Torre, I.; Winkelmann, A.; Eube, M.; Fuss, T. Wideband time-variant air-to-ground radio channel measurements at 5 GHz. In Proceedings of the Proceedings of the 5th European Conference on Antennas and Propagation (EUCAP), Rome, Italy, 11–15 April 2011; pp. 1386–1390. [Google Scholar]
- Matolak, D.W.; Sen, I.; Xiong, W. The 5-GHz airport surface area channel—Part I: Measurement and modeling results for large airports. IEEE Trans. Veh. Technol. 2008, 57, 2014–2026. [Google Scholar] [CrossRef]
- Yu, C.; Liu, Y.; Chang, H.; Zhang, J.; Zhang, M.; Poechmueller, P.; Wang, C. AG channel measurements and characteristics analysis in hilly scenarios for 6G UAV communications. China Commun. 2022, 19, 32–46. [Google Scholar] [CrossRef]
- An, H.; Guan, K.; Li, W.; Zhang, J.; He, D.; Zhu, F.; Chen, L. Measurement and Ray-tracing for UAV Air-to-air channel modeling. In Proceedings of the 2022 IEEE 5th International Conference on Electronic Information and Communication Technology (ICEICT), Hefei, China, 21–23 August 2022; pp. 415–420. [Google Scholar] [CrossRef]
- Khawaja, W.; Ozdemir, O.; Guvenc, I. UAV Air-to-Ground channel characterization for mmWave systems. In Proceedings of the 2017 IEEE 86th Vehicular Technology Conference (VTC-Fall), Toronto, ON, Canada, 24–27 September 2017; pp. 1–5. [Google Scholar]
- Ma, Z.; Ai, B.; He, R.; Wang, G.; Niu, Y.; Zhong, Z. A wideband non-stationary air-to-air channel model for UAV communications. IEEE Trans. Veh. Technol. 2019, 69, 1214–1226. [Google Scholar] [CrossRef]
- Ma, Z.; Ai, B.; He, R.; Zhong, Z. A 3D air-to-air wideband non-stationary channel model of UAV communications. In Proceedings of the 2019 IEEE 90th Vehicular Technology Conference (VTC2019-Fall), Honolulu, HI, USA, 22–25 September 2019; pp. 1–5. [Google Scholar]
- Zhang, Y.; Zhou, Y.X.; Ji, Z.J.; Lin, K.; He, Z.W. A Three-Dimensional Geometry-based Stochastic Model for Air-to-Air UAV Channels. In Proceedings of the 2020 IEEE 92nd Vehicular Technology Conference (VTC2020-Fall), Victoria, BC, Canada, 4–7 October 2020; pp. 1–5. [Google Scholar]
- He, R.; Ai, B.; Stüber, G.L.; Wang, G.; Zhong, Z. Geometrical-Based modeling for Millimeter-Wave MIMO Mobile-to-Mobile channels. IEEE Trans. Veh. Technol. 2018, 67, 2848–2863. [Google Scholar] [CrossRef]
- Bian, J.; Wang, C.X.; Gao, X.; You, X.; Zhang, M. A general 3D non-stationary wireless channel model for 5G and beyond. IEEE Trans. Wirel. Commun. 2021, 20, 3211–3224. [Google Scholar] [CrossRef]
- Bian, J.; Sun, J.; Wang, C.X.; Feng, R.; Huang, J.; Yang, Y.; Zhang, M. A WINNER+ based 3-D Non-Stationary wideband MIMO channel model. IEEE Trans. Wirel. Commun. 2018, 17, 1755–1767. [Google Scholar] [CrossRef]
- Xiong, B.; Zhang, Z.; Jiang, H.; Zhang, J.; Wu, L.; Dang, J. A 3D Non-Stationary MIMO channel model for reconfigurable intelligent surface auxiliary UAV-to-Ground mmWave communications. IEEE Trans. Wirel. Commun. 2022, 21, 5658–5672. [Google Scholar] [CrossRef]
- Mao, X.; Wang, C.X.; Chang, H. A 3D Non-Stationary Geometry-Based stochastic model for 6G UAV Air-to-Air channels. In Proceedings of the 2021 13th International Conference on Wireless Communications and Signal Processing (WCSP), Changsha, China, 20–22 October 2021; pp. 1–5. [Google Scholar] [CrossRef]
- Bai, L.; Huang, Z.; Cheng, X. A Non-Stationary 6G UAV channel model with 3D continuously arbitrary trajectory and Self-Rotation. IEEE Trans. Wirel. Commun. 2022, 21, 10592–10606. [Google Scholar] [CrossRef]
- Bai, L.; Huang, Z.; Du, H.; Cheng, X. A 3-D nonstationary wideband V2V GBSM with UPAs for massive MIMO wireless communication systems. IEEE Int. Things J. 2021, 8, 17622–17638. [Google Scholar] [CrossRef]
- Elsagher, M.; Al-Hourani, A.; Wang, K.; Choi, J. A study on MIMO gain of UAV-to-Ground channel in urban environments. In Proceedings of the 2021 IEEE VTS 17th Asia Pacific Wireless Communications Symposium (APWCS), Osaka, Japan, 30–31 August 2021; pp. 1–5. [Google Scholar]
- Arpaio, M.J.; Vitucci, E.M.; Barbiroli, M.; Degli-Esposti, V.; Masotti, D.; Fuschini, F. Ray-Launching narrowband analysis of UAV-to-Ground propagation in urban environment. In Proceedings of the 2019 International Symposium on Antennas and Propagation (ISAP), Xi’an, China, 27–30 October 2019; pp. 1–3. [Google Scholar]
- Vitucci, E.M.; Semkin, V.; Arpaio, M.J.; Barbiroli, M.; Fuschini, F.; Oestges, C.; Degli-Esposti, V. Experimental characterization of Air-to-ground propagation at mm-Wave frequencies in dense urban environment. In Proceedings of the 2021 15th European Conference on Antennas and Propagation (EuCAP), Dusseldorf, Germany, 22–26 March 2021; pp. 1–5. [Google Scholar]
- Wang, X.Y.; Mei, N.; Fan, X.; Wang, X.; Gao, H.; Huang, Y.D. Wireless channel modeling in complex urban environment based on high frequency asymptotic method. In Proceedings of the 2022 International Applied Computational Electromagnetics Society Symposium (ACES-China), Xuzhou, China, 9–12 December 2022; pp. 1–3. [Google Scholar]
- Chang, H.; Wang, C.X.; Liu, Y.; Huang, J.; Sun, J.; Zhang, W.; Gao, X. A novel nonstationary 6G UAV-to-Ground wireless channel model with 3-D arbitrary trajectory changes. IEEE Int. Things J. 2021, 8, 9865–9877. [Google Scholar] [CrossRef]
- Kyösti, P.; Meinilä, J.; Hentila, L.; Zhao, X.; Jämsä, T.; Schneider, C.; Narandzic, M.; Milojević, M.; Hong, A.; Ylitalo, J.; et al. WINNER II channel models. In IST-4-027756 WINNER II D1.1.2 V1.2; John Wiley & Sons: Hoboken, NJ, USA, 2008. [Google Scholar]
- Zhu, Q.; Li, H.; Fu, Y.; Wang, C.X.; Tan, Y.; Chen, X.; Wu, Q. A novel 3D Non-Stationary wireless MIMO channel simulator and hardware emulator. IEEE Trans. Commun. 2018, 66, 3865–3878. [Google Scholar] [CrossRef]
- Meinila, J.; Kyosti, P.; Hentila, L.; Jamsa, T.; Suikkanen, E.; Kunnari, E. WINNER+ Final Channel Models, v1.0, Document D5.3, June 2010. Available online: https://www.docin.com/p-511893710.html (accessed on 20 February 2023).
- Wu, S.; Wang, C.X.; Alwakeel, M.M.; You, X. A general 3-D Non-Stationary 5G wireless channel model. IEEE Trans. Commun. 2018, 66, 3065–3078. [Google Scholar] [CrossRef]
- Serfozo, R. Basics of Applied Stochastic Processes; Springer Science & Business Media: Berlin/Heidelberg, Germany, 2009; pp. 1–99, 241–242. [Google Scholar]
Disclaimer/Publisher’s Note: The statements, opinions and data contained in all publications are solely those of the individual author(s) and contributor(s) and not of MDPI and/or the editor(s). MDPI and/or the editor(s) disclaim responsibility for any injury to people or property resulting from any ideas, methods, instructions or products referred to in the content. |
© 2023 by the authors. Licensee MDPI, Basel, Switzerland. This article is an open access article distributed under the terms and conditions of the Creative Commons Attribution (CC BY) license (https://creativecommons.org/licenses/by/4.0/).