1. Introduction
This section presents the framework and importance of the problem under study. The motivation and objectives of the work are highlighted. Finally, the structure of this paper is presented.
Several methods can be used in the industry for yarn production which will affect various yarns parameters [
1,
2]. During the yarn production process, factors such as irregularities and dirt on the machine rolls can impair the quality of the yarn produced throughout the system. In the textile industry, the quality of the fabrics is directly related to the quality of the yarn, and thus, costs and claims due; for example, the existence of foreign fibers can be avoided by creating a quality management system to eliminate or minimize this number. Continuous inspection guarantees constant and satisfactory quality of the fabrics. Thus, yarn quality control is of upmost importance in controlling the processes for obtaining fabrics. There is commercial equipment that measures the quality of the yarn, which is based on sensors of different types, highlighting the products of the USTER company, namely its latest models USTER Tester 5 and 6 [
3]. This equipment is characterized by its high size and cost, as well as for performing the analysis of few parameters of yarn, namely the mass parameters.
In recent years, research work has been carried out to obtain more precise parameters of yarn quality, using image processing [
4,
5,
6,
7,
8]. Thus, there is the need to implement these technological advances in a physical prototype to fill the existing gap in the industry. Despite the high technology already available, there are still some challenges, namely in the identification, characterization, and analysis of the characteristics and hairiness in yarn, which are little explored. From our research, it was observed that there is currently no system that, through image processing, obtains and characterizes the hairiness present in the yarn. It is relevant to develop specific equipment for this purpose. In this context, the design, development, and construction of a mechatronic prototype using artificial intelligence seems to be justified to provide data regarding the quality of the yarn through the analysis of its main mass characteristics and the characterization of hairiness. This can enable companies to implement a quality improvement in their fabrics. This prototype system should be a simple, portable, and low-cost system that allows the collection of several parameters of yarn quality by image processing automatically, using artificial intelligence algorithms. This prototype allows its integration into an industrial environment, which will allow companies to assess the quality of the textile yarn to minimize the financial losses resulting from poor quality of the textile yarn used in the manufacture of textile fabrics.
The objective of this prototype is to develop control algorithms and use artificial intelligence techniques that allow the identification and characterization of yarn mass parameters. To this end, the following tasks were defined:
Development of a mechatronic device that allows winding and unwinding wires to perform these analyses on different types of raw material.
Development of a more economical, non-destructive, and easily reproducible yarn winding and unwinding prototype.
Development of algorithms for acquisition, processing, and analysis of images in textile yarn.
Development/optimization of artificial intelligence algorithms for analysis of images obtained from the yarn. In this case, the system will allow:
- ○
Identifying the hairiness of the yarn;
- ○
Classifying the type of hairiness—loop/protruding;
- ○
Classifying the positioning/spatial distribution of hairiness and defects/irregularities.
Development of an application capable of providing, in real time, a set of statistical data on the analyzed wires, generating a report for immediate or later analysis. With this tool, it is possible to present information in a readable and intuitive way for the user. The characteristics to obtain are:
- ○
Characterizes yarn defects: fine points, neps, thin places, and thick places;
- ○
It presents the complete characterization of the yarns in a production report with an intuitive and friendly interface.
Construction of a database (dataset) to store all the information that will “feed” all artificial intelligence approaches.
This system must be able to provide a better quality to the fabrics, due to the high parameterization evaluating the quality of the thread to be used.
This paper is organized in six sections. The second section presents a review of the literature on research in the area. The third section presents the theoretical concepts related to the analysis and characteristics of the yarn, necessary to understand the designed system. The fourth section presents the entire development of the designed prototype, including the mechanical part, as well as the implemented computer vision system, electronics, and system automation. The application of techniques associated with the implementation of artificial intelligence techniques in the system are also presented. The fifth section presents the experimental results. Here, a comparison of the results obtained with an example of a test obtained on the USTER Tester 3 commercial equipment is done. Finally, in the sixth section, the main conclusions and future work that can be implemented as an improvement to the prototype are described.
2. Literature Review
Technological evolution has reached important proportions in terms of systems obtaining characteristics that measure yarn quality. Thus, this section presents some solutions and projects that explore technologies to obtain yarn characteristics. It is of utmost importance to analyze what the scientific community has explored, the challenges encountered, and the problems still to be solved to better design/improve a proper project approach. The most relevant works of the last 6 years will be presented in each subsection, and which are the most important to assess what has been done on this topic so far.
2.1. Use of Image Processing and Computer Vision in Yarn Analysis
In the computer vision system of Zhisong Li et al. (2020) [
6], from now on called System B, an assessment of the yarn quality was carried out, in which the following parameters were obtained:
Yarn diameter;
Defects;
Hairiness.
All these characteristics were achieved using computer vision and image processing techniques. In this prototype (
Figure 1), the diameter image processing unit (DIPU) and a series of sampling points, which are selected from the moving yarn, are first defined. The DIPU corresponding to each sampling point is segmented from the captured yarn images. The average DIPU diameter is used to represent the yarn diameter of the test points. When extracting yarn images, the DIPU is divided into:
The unknown region is further processed with the Poisson Matting method, in which the yarn image and the background image are completely separated by a defined connectivity classifier. After the yarn core is extracted by the classifier, the hairiness is divided using image subtraction. Finally, to further assess the yarn quality, yarn defects were analyzed by statistical methods. In this designed system, a closed box is used as an image capture platform to protect from stray light disturbance. A white diffused glass is adopted to eliminate reflected light and shadows. In addition, for the yarn movement, a driver and voltage controller are used to obtain a better simulation.
Figure 2 shows the integrated structure of this system. The yarn image capture system is mainly composed of three parts:
Imaging system, including sensor, camera lens and light source, among which the CCD image sensor is used to collect the sequence of images from the yarn;
Imaging lens with a large depth of field to ensure that hairiness in different positions can be clearly analyzed.
Images were acquired by a SONY C Zoom lens with a focal length of 12.5 to 75 mm connected to a charge-coupled device (CCD) camera (Basler acA2040-180 km/kc, pixel size 5.5 µm, resolution of 2048 × 2048 pixels, sampling rate of 180 fps, and a personal computer with an image processor.
Yarn hairiness refers to the number of fibers projecting out of the yarn core, which has a direct effect on yarn properties, weaving efficiency, and fabric appearance. As an important indicator, yarn hairiness index was included in yarn quality requirements in this project. The authors state that the thread can be divided into thread core and hairiness. Through the method described above, the DIPU was extracted from the yarn core based on the connectivity of pixels for each image. Thus, the hairiness pixels can also be obtained by the image subtraction method.
Figure 3 shows hair removal using the image subtraction method [
6].
The authors did not propose improvements or future work with this project. They only state that the proposed method and the corresponding detection system facilitates automation and industrialization in the detection of yarns in online mode [
6]. A few more authors developed works in the field of image processing in textile yarn, but without innovations to what had been done so far [
7,
8,
9].
A system was also developed by Noman Haleem et al. (2021) [
10], from now on called System C, in which the authors stated that yarn testing in online mode can reduce latency in process control, providing fast information on yarn quality and leading to yarn production of top-quality yarn. These authors mention that both widely used capability-based uniformity test equipment and emerging image-based uniformity test systems are largely used in offline mode. According to them, there is still no adequate online system that can be used to test the quality of a variety of yarns under normal industrial processing conditions. Thus, the authors in this project proposed an online uniformity test system for measuring a certain type of yarn defect called nep. For this, they used image processing techniques and computer vision. The developed system (
Figure 4) directly captures the yarn images on a rotating frame and uses the Viola–Jones object detection algorithm for the real-time detection of nep defects. The validation of the nep detection algorithms and the comparison of the new method with an existing uniformity test equipment, in terms of nep count, was demonstrated to have a reasonable defect detection accuracy and promising potential for application in the yarn spinning industry. The results were validated by comparison with USTER’s existing commercial uniformity testing equipment (Tester). Image collection (
Figure 4) was performed by a Basler 1440–220 μm digital camera (Basler, Germany) equipped with a 50 mm lens.
The authors used three computer vision models (named A, B, and C) based on the Viola–Jones algorithm. This was developed using the OpenCV computer vision library in Python programming language. These models are essentially image classifiers, which varied in terms of the input data used in their training phase. The training data were composed of positive and negative images in a 2:1 ratio and these images were resized by factors of 0.2 and 0.1, respectively, to optimize the training time. The number of training cycles was 10 for each model.
Figure 5 shows three concatenated images of yarns with the defect called nep, acquired using the proposed image acquisition configuration during the yarn spinning process. Furthermore, the authors found that, in an analysis of a series of images of continuous shape of yarn, the size of the field of view was substantial to accommodate lateral oscillations of the yarn during the spinning process [
10].
As future works, the authors suggest that [
10]:
High-quality yarn online images can be acquired using an imaging system with an ultra-low exposure time, combined with external lighting and proper optical setup;
The online yarn uniformity measurement system can be used to detect other types of yarn defects as well as necessary additions to the image processing module to produce a complete yarn quality testing solution in an industrial environment.
2.2. Use of Artificial Intelligence Techniques in Yarn Analysis
Regarding the modeling of yarn tensile properties using artificial intelligence, Adel El-Geiheini et al. (2020) [
11], from now on called System D, stated that the use of artificial intelligence technologies can lead to more objective yarn testing systems with specifications of products with higher quality that meet the demands of the manufacture and the end user. This work was carried out with the objective of using image processing and artificial neural networks to model the tenacity and percentage of elongation of yarns for different types of yarns using a viable method in cost and time. Feed-forward neural networks trained with the back propagation rule were adopted. Two systems were developed; the first was used to evaluate the percentage of elongation and tenacity of the cotton threads and the second was used to evaluate the parameters of the mixed threads. By applying image enhancement combined with a multilayer neural network, good results were obtained to estimate different yarn parameters. In this project, images of samples were collected with a digital camera. The MATLAB 2015 software was used for the respective image collection and data pre-processing, and for the development of the two neural networks. Filtering and scaling were applied, and two adjustments were also made to the artificial neural networks trained with the Levenberg–Marquardt back propagation algorithm. In training the networks, 80% of the dataset were used, while validation and testing used 20%. For the first model, which was the cotton yarn model, the images were enhanced by applying Gaussian filtering and then transformed to grayscale and scaled to 250 × 250 pixels. Subsequently, the target data were encoded, and the data vectors were defined and used as the inputs to the neural network. A total of 152 samples were introduced to train and validate a feed-forward back propagation neural network. This network consisted of an input layer, a hidden layer with 15 neurons, and an output layer with two outputs, which are the tenacity (RKM) and the percentage elongation at break of the cotton threads. The second model was used to understand the tensile properties of mixed yarns. Like the first model, the images were enhanced using the Gaussian filter and then they were converted to grayscale and resized to 250 × 250 pixels; in addition, the target data were encoded. A four-layer feed-forward artificial neural network was also developed. The number of neurons in the two hidden layers was 20 and 10, respectively.
Figure 6 and
Figure 7 illustrate the implemented neural network by Adel El-Geiheini et al. (2020) for the first and second models, respectively. The authors also stated in this work that the combination of image processing and neural networks can be used effectively to evaluate various properties of the textile yarn.
At the level of artificial neural networks Manal R. Abd-Elhamied et al. (2022) [
12], from now on called System E, developed a project that allows a prediction of the characteristics of cotton thread by image processing and ANN (artificial neural network). It should be noted that the yarn characteristics obtained were taken with the USTER Tester 3, USTER Tester 5 and TENSORAPID4 machines. This research work used image processing and artificial neural networks to evaluate yarn tenacity, percentage elongation, coefficient of mass variation and percentage of yarn imperfections for spun and compact cotton yarns.
Figure 8 shows the steps used to analyze the acquired images and to feed the acquired data into the neural network.
Twelve inputs were used in the neural network, namely: diameter, coefficient of variation of diameter (CVD), height, coefficient of variation of hairiness (CVH), curvature, short fiber, count, torsion, revolving draft, spindle speed, ring size, and number of hairs were the network inputs, while the output of the neural network was the hairiness index. At the level of the neural network used (
Figure 8), the authors devised a network structure to assess tenacity and percentage of elongation for the ring textile yarn system. This consisted of an input layer, a hidden layer with 15 neurons, and an output layer. For the second system (
Figure 9), two hidden layers were used, and the number of neurons was 20 and 10, respectively. For the coefficient of variation of yarn mass (CVm%), the same topology was used for both systems, where neurons in the first hidden layer were set to 20 and in the second layer were set to 8. For the thin places of the yarn, thick places and neps, two different topologies were used for each system. The ring yarn system had two hidden layers (20–8 neurons), and in addition, the compact system had only one layer with 12 neurons, as shown in
Figure 9.
This study investigated the estimation of tenacity, percentage elongation, percentage CVm%, and imperfections for cotton yarns produced by ring spinning and compact spinning. Each model consisted of three units for each thread parameter and was constructed incorporating image processing. As future work, Manal R. Abd-Elhamied et al. (2022) propose the modeling of textile yarns with different properties, using artificial intelligence techniques, which can be successfully performed.
2.3. Comparison with Similar Cases
According to our research, there are few reported cases of other yarn prototypes systems with data that allow comparison with our case study, from now on called System A.
Table 1 summarizes some of the characteristics of the previously proposed solutions compared to the case study proposed in the present research (Textile Yarn Prototype).
Comparing all the above-mentioned solutions, it can be stated that not all of them respond to a set of important specifications. The solution developed called System A presents some differentiating factors, as follows:
System A allows image and video-based yarn analysis while system E does not;
System A can obtain the inherent characteristics of textile yarn imperfections through image processing and artificial intelligence. Furthermore, the System E can only arrive at values using artificial intelligence, but the characteristics of the textile yarn are obtained through an existing commercial machine based on optical sensors, which is the USTER TESTER 5;
System A has a lower cost, which differentiates it from the other commercial prototypes developed so far;
System A is non-destructive, in addition to allowing image analysis and winding and unwinding of any type of textile thread.
Systems B, C, and D have many gaps. It should be noted that System D has the advantage of obtaining tenacity as well as elongation of the textile yarn.
In summary, Systems A and E have few similarities, but System A stands out for its ability to obtain immense features compared to the others, as well as its integration into industrial production lines.
The differentiating factor and novelty of the system A from the others is the fact that it has an innovative method that allows obtaining and classifying hairiness in real time and efficiently. It also has the capability of interconnection between the created image processing algorithm and the artificial intelligence algorithm.
2.4. Literature Review Analysis
As a summary of the literature review performed, we can state that applying the use of image processing and artificial intelligence allows to improve the evaluation for the different properties of the textile yarn. Considering the research previously carried out, there is no solution capable of contemplating all the questions proposed in the scope of this project, namely, an automatic system for collecting and analyzing yarn images that allows classifying the types of hairiness of them as loop fibers and protruding fibers. That is, it appears that there are tools or systems that can help directly or indirectly in the identification of wire characteristics but are not focused on this goal. In this case, the objective is to develop a low-cost system, capable of obtaining, identifying, and characterizing hairiness using artificial intelligence and other more important characteristics of the yarn, such as mass, hairiness, defects, and production characteristics, to assess the quality of the same using image processing.
3. Theoretical Concepts
In this section, the various parameters associated with the yarn characterization will be exposed to offer a theoretical context as a basis for understanding the system in question that was developed. Moreover, the artificial intelligence concepts required to understand their use on the project are also described.
3.1. Yarn Characterization
The yarn characteristics of linear mass, diameter, specific volume, hairiness, twist orientation and step, defects, and some statistical parameters are presented in this section [
13].
3.1.1. Linear Mass and Diameter
The relationship between the diameter of the textile yarn and its linear mass is one of the most relevant foundations in yarn analysis, as it simplifies its characterization. If the yarn adopts a cylindrical shape, it is geometrically considered that the yarn diameter is proportional to the square root of its linear mass [
14].
Figure 10 illustrates a yarn configuration, and it is possible to verify the correlation between the two mentioned parameters.
The linear mass is expressed in tex (g/km), and can be determined by Equation (1) [
14,
15]:
where:
d is the wire diameter (cm);
tex is the linear mass of the yarn (g/km);
ϕ is the porosity;
ρ is the density of the yarn material (expressed in g/km3).
3.1.2. Specific Volume
The packaging of the fibers is translated through the specific volume of the yarn, which depends on the volume of the fibers and the space between them. Obtaining this parameter is possible through its relationship with the linear mass of the textile yarn, as can be seen in Equation (2) [
15]:
where:
R is the textile yarn radius (mm);
N is the linear mass of the textile yarn (g/km);
Vt is the specific volume (cm3/gm).
3.1.3. Yarn Hairiness
Hairiness arises when some fibers protrude from the body of the yarn, that is, some fibers arch in loops, emerging from the core of the yarn. It is a property that affects the appearance, feel, and use of the textile, which is crucial for the final quality of the product. A complex analysis is required for the detection and measurement of this parameter, which generally does not make it possible to define it by a single indicator. Generally, it is measured through fibers that extend out of the yarn core per unit length. In addition, its measurement allows to quantify several statistical parameters that are important in the characterization of yarn quality and, consequently, of fabrics. Among others, it refers, for example, to the coefficient of variation, the average deviation of the mass, the hairiness index, and the average deviation of hairiness. The representation of these fibers along the textile yarn are described in
Figure 11. These can be further classified by protruding fibers and loop fibers (hairiness wound on the body of the yarn) [
16,
17].
3.1.4. Yarn Twist, Twist Orientation, and Twist Step
The twist of a yarn is based on the number of turns per unit length. This is the result of the relative rotation of the ends of the yarn, and the twisting orientation can adopt two different types, type Z and type S. Type Z is suitable when the inclination of the fibers in relation to the axis of the yarn coincides with the central part of the letter Z. On the other hand, type S is applied when the fibers are inclined with respect to the axis of the yarn according to the central part of the letter S.
Figure 12 allows to graphically visualize the concepts mentioned.
The yarn twist is represented in the tex system in turns per centimeter or per meter and its amount varies depending on the linear mass of the yarn, the length and fineness of the fiber, and its purpose. The twist step represents the thickness of the fiber assembly that is being interlaced to form the core of the yarn. This characteristic has the same importance as its meaning. The higher the twist step, the fewer the existing twists.
Figure 13 represents the basis of this feature [
18].
3.1.5. Defects of the Yarn
These faults can be distinguished into three groups [
18,
19]:
Thick places: there is an increase in the linear mass of the thread compared to the average value (usually less than 100% of its sensitivity). The appearance of these defects follows the lack of force applied to the wire during its production;
Thin places: there is a decrease in the linear mass of the yarn compared to the average value. These arise when particles of waste appear during the manufacturing process that compress the yarn;
Neps: there is a severe oscillation of the linear mass of the textile yarn (equal to or greater than 100% of its sensitivity) over a short distance.
Figure 14 illustrates examples of the different yarn imperfections.
3.2. Statistical Parameters of Yarn
Some relevant statistical parameters are presented in this section, in particular the mean deviation of mass (U%), the coefficient of variation (CV%), the hairiness coefficient (H), the absolute deviation of the hairiness coefficient (UH%), and the standard deviation of the hairiness coefficient (sH%). All the mathematical calculations presented will be later applied for data extraction [
20].
3.2.1. Mean Deviation of Mass
Equation (3) shows the mean deviation of mass representing the proportionality of the variation of the mass of the samples in relation to the average, independent of the time of the analysis, if the variation of the mass is distributed uniformly it approaches a normal distribution.
where:
—instantaneous mass; —average mass during the test time; T—acquisition time.
3.2.2. Coefficient of Variation
The relationship between the mean value and the standard deviation is called the coefficient of variation (CV%), shown in Equation (4) [
21].
3.2.3. Hairiness Coefficient
Mathematically, Equation (5) presents the relationship of the loose ends along the length of one meter of yarn (hairiness coefficient) [
21].
where:
—total length of the hairiness (m); —yarn length (m)
3.2.4. Hairiness Mean Deviation
The deviation of hairiness from the mean value is called the absolute mean deviation of the hairiness coefficient and it is represented in Equation (6).
where:
Hi—current sample of hairiness value; —average hairiness during analysis; N—number of samples.
3.2.5. Hairiness Standard Deviation
Equation (7) defines the standard deviation of the hairiness coefficient [
22].
3.3. Spectral Analysis
The spectral analysis consists of the study of the frequency spectrum contained in a set of discrete data and collected with a uniform periodicity. With it, we try to find periodical irregularities in the yarn. These irregularities manifest themselves as energy spikes in the analyzed frequency. To detect these peaks, a spectrogram is constructed that demonstrates the variation of wave energy along various lengths of yarn periodicity. To perform a spectral analysis, a Fourier transform is used, which reveals the frequency component of a signal, representing it in frequency domain. As there are several Fourier transforms, the one used in this project was the fast Fourier transform (FFT). This approach is done with a narrowband definition to aggregate all harmonics, as the information is highly concentrated in the spectrum. To calculate the range of energy bands per decade, Equation (8) is used [
23]:
where:
ni—number of intervals;
di—decade index (−3, −2, …, 4);
I—interval index (0, …, I).
This equation considers a logarithm with base 10 and with it the coordinates of the X axis (int(I)) are obtained. These coordinates establish an equal division for the number of desired intervals over a decade. All wavelengths detected in each energy band are summed and multiplied by the number of intervals, obtaining the final value of the energy band. This operation is described in Equation (9).
where:
k—number of wavelengths detected in the energy band;
w—index of the detected wavelength;
λ—wavelength in the w index.
3.4. Artificial Intelligence Concepts
Artificial intelligence is the ability of a set of devices to search for and develop computing models that can intelligently absorb data and reproduce human skills, such as speaking or listening to solutions to solve complex cases. In short, it is the ability of machines to use algorithms, learn from the data provided, and use what has been learned to make decisions as a human being would.
Machine learning is a subset of artificial intelligence (
Figure 15) where algorithms are created to teach a given machine to perform tasks. A machine learning algorithm uses a set of input data and based on certain patterns found generates the outputs. Each input in this dataset has its own features (attributes associated with the dataset that allow the machine to establish a link between input and output) and having a set of them is the fundamental starting point for any machine learning algorithm.
Machine learning is divided into three categories: supervised learning, unsupervised learning, and reinforcement learning (
Figure 16) [
23,
24].
Supervised learning: When the algorithm has a labeled dataset (data with their respective correct outputs) and learns by comparing the model’s output with the expected output, and its parameters are readjusted, if necessary, until reaching an acceptable threshold and predetermined.
Figure 17 shows the processes in detail [
25].
Supervised learning is divided into two categories: classification or regression. The classification problem is that when an algorithm predicts a discrete value, it identifies the input data as a set of a particular class (such as if a photo has an annotation that has a pre-identification of a specific animal). The algorithm is then evaluated by how accurately it can correctly classify new images according to the annotation made. Regression issues are related to continuous data.
Unsupervised learning: Unlike the previous case, in this category, the data do not receive previous annotations, the algorithm receives a set of data (without annotations) and seeks to find similarities between groups of data.
In unsupervised learning, there is a division: there is the grouping of data, and the extraction of information. In the clustering of data, known as clustering algorithms (
Figure 18), the data are grouped according to the similarities between them. In extracting information (
Figure 19), the algorithm associates the information from other information obtained previously, such as, for example, a recommendation of a movie on a specific website, based on the history of previously watched movies [
26,
27].
Reinforcement learning is the training of machine learning models to make a sequence of decisions from a bonus/punishment perspective. Briefly, the technique seeks to fulfill a certain task, initially with a trial-and-error approach, then the results of each attempt, regardless of its success, are used for training through a reward/punishment system (
Figure 20).
Dataset is a set of data that serve as the basis for the development of an artificial intelligence algorithm or other types of data science projects. Usually, the creation of a dataset is a fundamental and time-consuming step with a direct influence on the performance of the system and can be divided into training, validation, and test datasets (
Figure 21):
Training dataset: Samples used for model formation and convergence;
Validation dataset: Samples used to impartially evaluate a model after training. At this stage, and as a form of adjustment, it is already possible to determine whether or not to change the algorithm’s hyperparameters in the training phase;
Test dataset: Samples used for algorithm testing. It can be used to make a final evaluation of the performance of a model. It is important that the test dataset samples are not used in training or validation in order not to change the result.
3.5. Neural Networks for Object Detection
Computer vision has gained enormous strength. So far, algorithms have been seen that are aimed at classifying images, knowing if, for example, a dog or cat is present in an image, if it is a car or a bicycle, etc. Now, the next step will be object detection. The difference between object detection algorithms and classification algorithms is that in detection algorithms, we try to draw a bounding box (object detector) or a bounding curve (instant segmentation) around the object of interest to locate it in the image, for example. Furthermore, in the same image, there can be several different objects to be detected. A possible solution would be to take different regions of interest in the image and use a convolutional neural network to classify the presence of the object within that region; however this approach is that the objects of interest can have different spatial locations within the image and different proportions and therefore would have to select a large number of regions so that an image with few objects does not have a high computational cost, but in an image of a highway detecting vehicles, this could computationally explode. The solution to these issues was the creation of algorithms R-CNN, Fast R-CNN, Faster R-CNN, R-FCN, YOLO, etc. [
30].
YOLO
YOLO (You Only Look Once) was developed by Joseph Redmon and Ali Farhadi in 2015 during their PhD [
31]. After its launch presentation in 2015, there were evolutions on the initial version, and currently, it is in its seventh version, YOLOv7. YOLO is an object detection algorithm different from the region-based algorithms seen in the previous topics. This is a convolutional network that predicts the bounding boxes and class probabilities for those boxes. YOLO divides the image into N grids, each with an equal-sized SxS dimension. Each of these N grids is responsible for detecting and locating the object it contains. These grids, in turn, predict the coordinates of bounding box B relative to cell coordinates, as well as the item name and the probability of the object being present in the cell. Due to many cells predicting the same item with varying bounding box predictions, this technique considerably reduces computation because both detection and recognition are handled by the cells in the image (
Figure 22) [
31,
32].
YOLO architectures are divided into three components (
Figure 23):
Backbone: Corresponds to a convolutional neural network that forms, and groups feature maps at different points. The Backbone is normally pre-trained on a classification dataset, typically ImageNet;
Neck: Consisting of a series of layers in which the remaining feature maps created in the previous step are mixed and matched and, finally, make the necessary predictions;
Head: This is the part of the network that receives the maps from the previous layer and performs the steps of prediction of the bounding boxes and respective classes. It is guided by the three YOLO loss functions for class, box, and objectivity.
However, this ends up producing many duplicate predictions. To solve this problem, YOLO employs the Non-Maximum Suppression (NMS) method [
33] which consists of suppressing all bounding boxes with lower probability scores. YOLO does this by looking at the probability scores linked to each option and selecting the one with the highest score. The bounding boxes with the highest Intersection over Union (IoU) (
Figure 24) with the current high probability bounding box are then suppressed. The process ends later when there are no more boxes to be deleted (
Figure 25).
YOLO is much faster (45 frames per second) than other object detection algorithms. One of the limitations of the YOLO algorithm is the difficulty of detecting very small objects within the image due to the spatial restrictions of the algorithm itself.
4. Developed Prototype
The mechatronic prototype designed for this project contains a developed image acquisition system and it is intended to be inserted into a designed textile yarn winding and unwinding machine (
Figure 26) [
35].
4.1. Textile Yarn Winding and Unwinding Process
The mechanical system (
Figure 27) that performs the function of unwinding and winding the spool of textile yarn is composed of several components, which are listed in
Table 2.
The mechanical system of this prototype consists of a subsystem (A) that initially pulls the thread, from top to bottom, from the assembled bobbin (2) and guides it inside the machine with the aid of ceramic guides (3). After entering the box, the wire is wound around a positive feeder (4), which together with another one (9) pulls the wire and creates tension in it to minimize oscillations during its movement, providing a more favorable image capture environment. In the space between the two positive feeders, the camera (5) is mounted together with two ceramic guides that ensure that the wire passes in front of its lens to capture the image. This entire process is carried out inside a closed box to prevent the entry of natural light, thus guaranteeing total control over the brightness of the image capture environment. Finally, after the wire passes through the second positive feeder (9), the wire enters the winding phase (C), being led out of the box and into the grooved cylinder (11), which is aligned with the winding spool. winding (12) and winds the yarn around it, controlling the winding direction [
35].
4.2. Subsystems and Kinematic Chains
This prototype is composed of three subsystems: unwinding, conducting, and winding. The most prominent components are those that make up the kinematics chains of each and they are the servomotor (10), the two positive feeders (4) (9), the grooved cylinder (11), and the toothed belt that connects and transmits power, among all others. The two kinematic chains are (
Figure 28):
The connection between the two positive feeders not only allows the control of both using only one servomotor, but also allows the maintenance of wire tension, maintaining the speed ratio of 1 between both positive feeders.
4.3. Software and Hardware
The camera that is used to obtain images and videos of the textile yarn is from the OMRON brand. Therefore, it is necessary to use a SENTECH control software, “StViewer” (
Figure 29). This program controls the way images are captured so that they can then be analyzed.
Before proceeding with the capture, it is possible to change a wide variety of parameters, from exposure time, capture control, to captured images per second. All available parameters must be defined and saved through the software (
Figure 30) so that future captures are consistent.
For the creation of the main program, a programming environment is necessary, and one of the most complete is Microsoft Visual Studio. In it, it is possible to use several programming languages together with several computational libraries, which allow the addition of functionalities to the programming languages. However, what was necessary to start the process of creating the yarn analysis program was the possibility of using image processing in the development of the program, something that is not native to any programming language. For this, it was necessary to resort to a computational library. One of the most complete in this area is OpenCV. To obtain images and videos of the yarn for analysis, the camera (
Figure 31) from OMRON, in the USB3 Vision product range, is used.
Table 3 presents the list of specifications of the model used.
In addition to this camera, a set of magnifying lenses was also used, visible in
Figure 32, with the ability to magnify the original image by a factor of 22×.
4.4. Interface Developed
The program user interface consists of a window, which can be divided into two sections as shown in
Figure 33.
On the left side are all the program’s input parameters, in this case, the initial conditions necessary for any thread test to be carried out, which we will now describe:
Material—The first parameter to be defined is the material of the textile yarn put to the test. It can be chosen between cotton yarn and polyester yarn. This parameter will affect the value of internal variables in the calculation of some yarn parameters, more specifically, the value of material density and porosity. If there is uncertainty about the type of material that makes up the yarn, as can be seen in the image, there is a small “?” help, which, when pressed, changes the “Debug Text” found in the lower right corner, for information about the type of material that makes up each of the wires intended for testing;
File type—The second parameter allows the user to select which type of file he wants to test. Enter a video file or an image file. This input parameter will affect the type of function that will be called at the time of the test, since the file analysis methodology is necessarily different, depending on whether that file is an image or a video, (which is actually composed hundreds of images);
File selection—The third parameter to be selected is, as the name implies, the selection of one of the files present to perform the test. As you can see in the image, beside both the checkboxes for videos and images, there are buttons that help the user. In the case of image selection, the “View” button allows the user to visualize the selected image, before proceeding with the test. In the case of video, the “Check Size” button changes the “Debug Text” so that it makes available to the user the number of “frames”, or images, that make up the selected video;
Tolerance (%)—The next input parameter is directly linked to one of the dimensional output parameters. The tolerance in this case refers to the dimensional tolerance, that is, it will define the point from which a section of wire is determined as a thick or thin section. For example, a selection of tolerance of 10% will make samples that present a difference above or below 10% of the average value be considered thick or thin zones, respectively. For practical reasons, the selection of tolerance in the coarse and fine zone is separated, in order to give the user a greater level of control over the test parameters;
Number of samples—The last parameter will define the total number of samples that the program will collect from the image/video to be analyzed. This parameter has some conditions to be considered by the user before setting it. Initially, in the case of videos, as it is a set of images, the number of samples cannot exceed the number of frames or images that the video contains. For this reason, there is the previously mentioned “Check Size” button, which gives information to the user about that number for each video. Another condition to consider is that this parameter is directly related to the resolution of the analysis. That is, if it required a resolution like the USTER Tester, which takes a sample every 8 mm of yarn, we need to choose a number of samples that considers both the length of yarn to be analyzed and the yarn speed. If a number is not specified in this field, in the case of video analysis, the number of video frames will be assumed as the value of the number of samples. On the right side of the interface, we find all the output parameters, more specifically, all the data that we are looking for with the wire test. These results can be divided into three categories.
The first is formed by all the base parameters of the textile yarn:
Yarn diameter;
Linear mass;
Volume;
Twist step;
Number of cables;
Twist orientation.
The second category encompasses more specific hairiness data:
Hairiness index;
Number of loose fibers (this parameter is only calculated in the analysis of images, since, in the case of video, thanks to the movement of the wire, the calculation of this parameter becomes inconsistent).
The third category contains all the statistical parameters:
Thin places;
Thick places;
Neps;
Mean mass deviation (U%);
Coefficient of mass variation (CV%);
Hairiness standard deviation (sH%) (only calculated for videos, as the hairiness data numbers of a single image are not enough to have an exact result).
After exposing all the parameters, both output and input of the program, we will present the methodology that allows reaching the desired results, using image processing tools combined with programming techniques. As mentioned, image and video analysis methodologies are naturally different, as the former only deals with the analysis of an image, unlike a large number of images, in the case of the latter. However, the methodology for analyzing a single image, whether in the case of video or image, is very similar. The main difference is related to the fact that, in the case of video analysis, the processes must be repeated for each image that composes the video and the results are aggregated at the end. Consequently, we only fully describe the image analysis methodology, periodically mentioning the video analysis methodology when it is sufficiently distinct. Due to the diversity of results that one intends to obtain with just one image, there is no single line of processes that leads to all the data. It takes a multifaceted approach to image processing processes to get three different types of images from which to pull all the data:
Image with insulated yarn core;
Image with isolated hairs;
Image with isolated winding particles.
The following flowchart (
Figure 34) demonstrates the multifaceted approach used to achieve each of the 3 image types.
5. Experimental Results and Discussion
This section presents all the results obtained through the application of the program created for video and image analysis of the yarns considered. First, the yarns considered for the tests will be presented, then the results obtained by the USTER Tester 3 will be used as an evaluation reference. Then, a comparison will be made between both measurements. Finally, a brief analysis of the results obtained from the base parameters will be presented to look for patterns in the detected defects and to assess the repeatability and reliability of the methodology used.
Justifications or explanations of the results obtained are also presented.
5.1. Yarns Tested
When the results are completed, the algorithm returns all its information to the initial window, the “Debug Text” is cleared to signal to the user that the test is over and the fields with the calculated parameters are filled.
For the tests of this system, three different spools of yarn (
Figure 35) were used:
Purple cotton yarn;
Yellow cotton yarn;
White polyester yarn.
The use of these three different types of yarn aimed to test the robustness and reliability of the algorithms developed. Among the three yarn samples, there are differences in several of the parameters to be evaluated: diameter, linear mass, hairiness, number of cables, and material. To create a reference for the data to be evaluated, tests were carried out on the three types of textile yarns with a length of 1 km in USTER Tester 3. An example of the results obtained can be seen in
Table 3.
Some of the parameters are not directly measured by the equipment; however, they can be inferred from others.
Table 4 shows the results obtained and used later as a reference for the parameters of the analyzed threads.
5.2. Results Obtained with Image Processing (in Offline Mode)
The results that will be presented below are the result of analyses performed on images taken from the available yarns. These results will be compared with the reference results obtained USTER Tester 3.
Table 5 details the results obtained through image analysis of a cotton yarn.
Figure 36 presents an image with the result of one of the parts of the implemented algorithm. After obtaining a reduced noise image, the Canny algorithm is applied to perform a contour detection process. The resulting image will be just a silhouette, as can be seen in
Figure 36.
As can be seen in
Figure 36, both the silhouette of the yarn as well as the hairiness are demarcated. The objective from here is to remove the white pixels of this image that correspond to the core of the yarn, to completely isolate its hairiness.
As can be seen in
Table 5, in this comparison, there are data that are not possible to compare directly between the prototype and the USTER equipment, because there are data only provided by one of the machines. In the case of the developed prototype, all characteristics were measured. In the case of USTER equipment, there are several data that are not measured. For this reason, it is not possible to verify the accuracy of these data through direct comparison with baseline results. Regarding the directly comparable results, it is possible to observe that, in the base parameters of the yarn, there is a minimal difference in the results (below 10% relative error). In the case of the hairiness index and even more in the statistical data, it is possible to observe a considerable discrepancy between the results. This difference is explained by the difference in the length of the yarn analyzed in both cases. As mentioned, the results obtained by the USTER equipment are the result of an analysis of 1 km of yarn, while in the case of the prototype, only one image with 2.72 mm of yarn (image size) was analyzed. Furthermore, the reference equipment takes measurements every 8 mm, as opposed to 0.05 mm in this case for the prototype. For these reasons, it was expected that the statistical results measured by the prototype would be higher.
5.3. Results Obtained with Image Processing Using Video Analisys (Online Mode)
In the case of video analysis, we already expect to have a majority of concordant results between the prototype and the USTER Tester 3 equipment. In this case, the results obtained by the prototype are the result of the analysis of 100 m of yarn, with a total of 100,000 samples with 1 mm samples distance.
Table 6 and
Figure 37 presents the results obtained by the prototype and the reference values for comparison. The presented results of the dimensional defects of the prototype were inferred from the results of 100 m obtained.
In
Table 6 and regarding the directly comparable results, it can be observed that the basic yarn parameters were calculated with a relative error of less than 10%, most of them less than 5%. At the level of statistical parameters, like the U, CV, and sH, a variation greater than 10% was observed. This is justified by the presence of a greater number of samples taken by the prototype relative to the results taken from images (
Table 5). It should be noted that it was possible to observe a reduction in the difference in results; compared to those obtained through image analysis, there is still a small discrepancy. This inequality can be explained by the difference in the yarn length analyzed, but more specifically, it comes from the fact that there is a smaller number of samples to be considered in the case of the prototype. The commercial equipment is taking a sample every 8 mm and the prototype every 1 mm and there is a notable difference between the analyzed lengths.
5.4. Results Obtained for Spectrum Analysis
Using this approach (Equation 9), the graph of
Figure 38 was obtained, resulting from a test of 100 m with 100,000 samples of a cotton yarn with an average linear mass of 56.4tex.
These results can be compared to the results obtained by the USTER Tester 3 equipment, represented in
Figure 39.
The first observation to be made in
Figure 38 and
Figure 39 is that the magnitude of wavelengths that both results present is not the same. However, it is possible to make a comparison in the wavelengths that both have. The most notable peak is in the range of 1 m, which can be observed in both results, thus indicating the presence of a periodic imperfection with a uniform periodicity of 1 m. In addition, there is also a small peak in the range between 20 and 30 cm which is also visible in both spectrograms. The results obtained show that the developed image processing algorithms can capture the yarn parameters with a high level of precision and are capable to identify the various types of defects in the textile yarn.
Figure 40 presents the results of spectrum analysis obtained in the user interface so that the prototype user can visualize these same results in real time.
5.5. Preliminary Results Using Artificial Intelligence for Hairiness Identification and Classification
This subsection presents the results obtained in the tasks of training and classifying hairiness in yarn. In this first phase, 50 images were collected, obtained with the vision system implemented and with a good lighting system to obtain the maximum possible quality in the images.
5.5.1. Dataset and Annotations
The dataset was hosted on the Roboflow website [
36] where 50 images (purple cotton textile yarn) were allocated and divided into two classes of annotations: protruding fibers and loop fibers (in each of the images several annotations of protruding and loop fibers were identified, allowing a dataset of hundreds of class annotation, as shown in
Figure 41). With this dataset obtained and annotations made, several tests and training tasks were performed to obtain the most robust model that can be used to identify hairiness and classify them in real time as loop fibers and protruding fibers. In this project, LabelME was used, the annotations were made in polygonal mode. In
Figure 41, there is an example of annotations made in the work dataset made by LabelME.
5.5.2. Data Augmentation
Data augmentation is a set of techniques to artificially increase the amount of data by generating new images from existing images. Its purpose is the quantitative and qualitative increase of the dataset to perform the training, because the bigger and better the dataset, the better the results obtained.
Some techniques are listed below and exemplified in
Figure 42.
Geometric Transformations:
- ○
Flip: Inversion of the image horizontally or vertically.
- ○
Rotation: Image rotation from 0° to 360°.
- ○
Translation: change (displace) the image either to the right, left, up, or down.
- ○
Crop: Crop the image.
- ○
Zoom: Enlarge the image.
- ○
Shear: shear effect, tilt the image.
Photometric Transformations:
- ○
Adding noise: adding digital noise to images, white dots, for example, giving the notion of roughness.
Color space transformation:
- ○
Kernel (or spatial) filtering: Turn off a window over the original image in order to obtain the desired result (convolution), such as removing the R channel from an image, increasing brightness, removing R and G channels, and keeping only the B. Another possibility could be the effect of blurring or sharpening the image.
- ○
Combination of images: Create an image from parts of others.
- ○
Random Erasing: Erase random regions of the image.
In this dataset, more specifically for training, data augmentation was performed through the Roboflow website [
33]. On this site, it is possible to upload the images, annotations of the images, and the data augmentation of the images that were considered: saturation: between −25% and +25%; blur: up to 5px; noise: up to 5% of pixels; bounding box: flip: horizontal and vertical (
Figure 43).
5.5.3. Techniques Used and Obtained Results
Based on the confusion matrix depicted in
Figure 44, this scenario was only able to achieve good results for the classification of protruding fibers and was not able to correctly classify the loop fibers.
The output results for the YOLOv5m algorithm, based on the training dataset, are depicted in
Figure 45. A total of 150 epochs were used to achieve a high precision, recall, and mean average precision (mAP)—additional iterations would not have led to a substantial gain. Among all the identified KPIs, these were the most relevant for our analysis, and their values were obtained using Equations (10)—(12), respectively [
37]:
where:
Precision measures how accurate predictions are;
Recall measures how well all positives are found;
mAP@.5 or mAP@50 or IoU = 0.50 mean average precision with an Intersection over Union threshold of 0.5 or 50%; and
mAP.5:95 means average mAP over different IoU thresholds, from 0.5 to 0.95.
Table 7 presents the results of one configuration, based only on one setup. The calculation was performed on a laptop computer with an Intel Core™ i7-10750H CPU @ 2.60 GHz and 32 GB of RAM.
Figure 46 presents the classification results produced in the first image testing phase of the training process. These results were used to validate and adjust our classification model. As it can be seen, there is some hairiness that has not yet been classified, due to the small dataset that was used at this stage (even considering a dataset of hundreds of class annotations, due to the possible hairiness variation combinations, it must be increased). However, correlating the results with the confusion matrix it can be concluded that the obtained results require more images in the dataset for training (only some of the protruding and loop fibers were identified).
The obtained results with the YOLOv5s are very promising results. We can also conclude that no significant gains were made when using higher versions of YOLOv5, which provide similar accuracy but are more computationally demanding.
6. Conclusions and Future Work
The work presented here is part of an innovative project whose main objective is the development of algorithms that allow the evaluation of yarn quality, using image processing technology through image and video analysis, which aims to meet a growing specific need of the textile industry. In addition, the instruments used in the development of the prototype were exposed, from the software that allowed the capture of images, their processing, and the execution of the developed algorithms, to the hardware responsible for creating a proper image capture environment. The created algorithms were tested, and the obtained results were compared with a reference equipment (USTER Tester 3). This comparison allowed the research team to conclude that the main objective of creating image processing algorithms, capable of evaluating the quality of yarn, was fulfilled, since it was possible verify that the relative error level for most of the results obtained was below 10%.
It is important to emphasize that nothing similar has been done so far. Only works related to the implementation of artificial intelligence were created in the analysis of textile fabric and not in yarn, due to its application complexity.
The scientific contribution of this work consists in the creation of an innovative methodology that allows the analysis of defects in textile yarn with a more precise way.
Regarding future developments of this project, artificial intelligence is being implemented in the algorithms created and the adaptation of the interface to analyze the type of hairiness and perform its automatic classification. At this moment, the use of artificial intelligence in the prototype is a reality, as it has already been possible to obtain significant results in the classification of the type of hairiness in the yarn. Using the created algorithms in this project, it is possible to obtain a large number of images and results that can be used as a basis for training an artificial neural network to identify imperfections in the yarn images. This implementation could not only improve the algorithms in areas where they are less reliable, but also increase their performance and reduce the computational costs of each analysis. In addition, other types of yarns, with different constitutions, could possibly be introduced.
The algorithms implemented with the vision system in the prototype play an important role in the correct identification of objects, and this is only possible due to the contribution of machine learning algorithms. The YOLOv5 algorithm has great potential for this type of recognition tasks (types of hairiness in yarn) as well as for its classification with high precision and repeatability.
Author Contributions
Conceptualization, F.P., J.M., R.V., F.S. and V.C.; methodology, F.P., A.M., L.P., J.M., R.V., F.S. and V.C.; software, F.P., A.M. and L.P.; validation, F.P., J.M., R.V., F.S. and V.C.; formal analysis, F.P., J.M., R.V., F.S. and V.C.; investigation, F.P., A.M., L.P., J.M., R.V., F.S. and V.C.; resources, F.P., A.M., L.P., J.M., R.V., F.S. and V.C; data curation, F.P., J.M., R.V., F.S. and V.C.; writing—original draft preparation, F.P., A.M., L.P., J.M., R.V., F.S. and V.C; writing—review and editing, F.P., J.M., R.V., F.S. and V.C.; visualization, F.P., J.M., R.V., F.S. and V.C; supervision, J.M., R.V., F.S. and V.C.; project administration, J.M., R.V., F.S. and V.C.; funding acquisition, J.M., R.V., F.S. and V.C. All authors have read and agreed to the published version of the manuscript.
Funding
The authors are grateful to FCT—Fundação para a Ciência e Tecnologia (Portugal)—who partially financially supported this work through the RD Units Project Scope: UIDB/04077/2020 and UIDB/00319/2020.
Data Availability Statement
Not applicable.
Acknowledgments
The authors are thankful to engineer Joaquim Jorge, from the textile engineering department at the University of Minho, for all the support and availability given in this project.
Conflicts of Interest
The authors declare no conflict of interest.
References
- Xia, Z.; Zhou, M.; Wang, H.; Wang, K.; Wan, Y. Evaluating the surface hairiness of woven fabric belts with a yarn hairiness tester. J. Text. Inst. 2022, 113, 116–124. [Google Scholar] [CrossRef]
- Idzik, M.; Idzik, M. Image Analysis as a Method of the Assessment of Yarn for Making Flat Textile Fabrics. Autex Res. J. 2022, 22, 201–207. [Google Scholar] [CrossRef]
- USTER Tester Staple Yarn. Available online: https://www.uster.com/en/instruments/staple-yarn-testing/uster-tester-staple-yarn (accessed on 2 December 2021).
- Liang, Z.; Xu, B.; Chi, Z.; Feng, D. Intelligent characterization and evaluation of yarn surface appearance using saliency map analysis, wavelet transform and fuzzy ARTMAP neural network. Expert Syst. Appl. 2012, 39, 4201–4212. [Google Scholar] [CrossRef]
- Abdelkader, M. MATLAB Algorithms for Diameter Measurements of Textile Yarns and Fibers through Image Processing Techniques. Materials 2022, 15, 1299. [Google Scholar] [CrossRef] [PubMed]
- Li, Z.; Zhong, P.; Tang, X.; Chen, Y.; Su, S.; Zhai, T. A New Method to Evaluate Yarn Appearance Qualities Based on Machine Vision and Image Processing. IEEE Access 2020, 8, 30928–30937. [Google Scholar] [CrossRef]
- Xu, B.; Wang, L.; Gao, W. 3D measurement of yarn hairiness via multi-perspective images. Opt. Photonics Digit. Technol. Imaging Appl. V 2018, 10679, 1067916. [Google Scholar] [CrossRef]
- Sun, Y.; Li, Z.; Pan, R.; Zhou, J.; Gao, W. Measurement of long yarn hair based on hairiness segmentation and hairiness tracking. J. Text. Inst. 2016, 108, 1–9. [Google Scholar] [CrossRef]
- Jing, J.; Huang, M.; Li, P.; Ning, X. Automatic measurement of yarn hairiness based on the improved MRMRF segmentation algorithm. J. Text. Inst. 2018, 109, 740–749. [Google Scholar] [CrossRef]
- Haleem, N.; Bustreo, M.; Del Bue, A. A computer vision based online quality control system for textile yarns. Comput. Ind. 2021, 133, 103550. [Google Scholar] [CrossRef]
- El-Geiheini, A.; ElKateb, S.; Abd-Elhamied, M.R. Yarn Tensile Properties Modeling Using Artificial Intelligence. Alex. Eng. J. 2020, 59, 4435–4440. [Google Scholar] [CrossRef]
- Abd-Elhamied, M.R.; Hashima, W.A.; ElKateb, S.; Elhawary, I.; El-Geiheini, A. Prediction of Cotton Yarn’s Characteristics by Image Processing and ANN. Alex. Eng. J. 2022, 61, 3335–3340. [Google Scholar] [CrossRef]
- Mário, A.; de Melo, E.M.C. Manual de Engenharia Têxtil; Fundação Calouste Gulbenkian: Lisbon, Portugal, 1987; Volume II. (In Portuguese) [Google Scholar]
- Carvalho, V.; Vasconcelos, R.M.; Soares, F.O.; Belsley, M. Yarn Diameter and Linear Mass Correlation. J. Nondestruct. Eval. 2009, 28, 49–54. [Google Scholar] [CrossRef][Green Version]
- Carvalho, V.H.; Belsley, M.S.; Vasconcelos, R.M.; Soares, F.O. Automatic Yarn Characterization System: Design of a Prototype. IEEE Sensors J. 2009, 9, 987–993. [Google Scholar] [CrossRef][Green Version]
- Wang, X.-H.; Wang, J.-Y.; Zhang, J.-L.; Liang, H.-W.; Kou, P.-M. Study on the Detection of Yarn Hairiness Morphology based on Image Processing Technique. In Proceedings of the Ninth International Conference on Machine Learning and Cybernetics, Qingdao, China, 11–14 June 2010. [Google Scholar]
- Carvalho, V.H.; Cardoso, P.J.; Belsley, M.S.; Vasconcelos, R.M.; Soares, F.O. Yarn Hairiness Characterization Using Two Orthogonal Directions. IEEE Trans. Instrum. Meas. 2009, 58, 594–601. [Google Scholar] [CrossRef]
- Pinto, R.; Pereira, F.; Carvalho, V.; Soares, F.; Vasconcelos, R. Yarn linear mass determination using image processing: First insights. In Proceedings of the IECON 2019—45th Annual Conference of the IEEE Industrial Electronics Society, Lisbon, Portugal, 14–17 October 2019; pp. 198–203. [Google Scholar] [CrossRef]
- Pereira, F.; Carvalho, V.; Soares, F.; Vasconcelos, R.; Machado, J. Computer Vision Techniques for Detecting Yarn Defects. In Applications of Computer Vision in Fashion and Textiles; Wong, W.K., Ed.; Woodhead Publishing: Sawston, UK, 2018; pp. 123–145. [Google Scholar]
- Carvalho, V.; Cardoso, P.; Belsley, M.; Vasconcelos, R.; Soares, F. Determination of Yarn Hairiness Using Optical Sensors. 2006. Available online: https://repositorium.sdum.uminho.pt/bitstream/1822/9015/1/Determination%2520of%2520yarn%2520hairiness%2520using%2520optical%2520sensors.pdf (accessed on 11 October 2022).
- Carvalho, V.; Gonçalves, N.; Soares, F.; Vasconcelos, R.; Belsley, M. Yarn Parameterization and Fabrics Prediction Using Image Processing. Text. Light Ind. Sci. Technol. 2013, 2, 6–12. [Google Scholar]
- Carvalho, V.; Gonçalves, N.; Soares, F.; Belsley, M.; Rosa. An Overview Over Yarn Mass Parameterization Methods. 2011. pp. 18–24. Available online: https://d1wqtxts1xzle7.cloudfront.net/79100245/download-libre.pdf?1642637901=&response-content-disposition=inline%3B+filename%3DAn_Overview_Over_Yarn_Mass_Parameterizat.pdf&Expires=1672053423&Signature=WWZTyO4~R5xlf-oK1KWDaD9zDwzzgDi3kUI2lVe0HS16t4TecMuFx8bgJooMUllTO1L7R2EuHS7VneevffOjBTIVV6jTQWalUsmYx36GIdeRESRDI-vVWCy71vynWmRFhK81UWSCivwYMyw5idxu-3EWLaQ7yfpp79-jajzZIVNogCcvflp5kEh4g~3BCnaUP~YReflz~IHHaIVQvtMw7vXRykSsnRnHcqf~mC015MjpdJkZIhoXfZG35iByxXRQl6q0pf3pK3CaOJn5B00bUfw4UJks1DP-lJsq9I5RS1JIhR-2yzVFupYaeB0xiYFZMN6g2~y6PwjUf6yUDiBHPw__&Key-Pair-Id=APKAJLOHF5GGSLRBV4ZA (accessed on 11 October 2022).
- Carvalho, V.; Soares, F.; Belsley, M.; Vasconcelos, R.M. Automatic yarn characterization system. IEEE Sens. 2009, 9, 987–993. [Google Scholar] [CrossRef]
- Carvalho, V.; Pinto, J.G.; Monteiro, J.L.; Vasconcelos, R.M.; Soares, F.O. Yarn parameterization based on mass analysis. Sens. Actuators A Phys. 2004, 115, 540–548. [Google Scholar] [CrossRef]
- Manickam, P.; Mariappan, S.A.; Murugesan, S.M.; Hansda, S.; Kaushik, A.; Shinde, R.; Thipperudraswamy, S.P. Artificial Intelligence (AI) and Internet of Medical Things (IoMT) Assisted Biomedical Systems for Intelligent Healthcare. Biosensors 2022, 12, 562. [Google Scholar] [CrossRef]
- raujo-Filho, J.D.A.B.; Júnior, A.N.A.; Gutierrez, M.A.; Nomura, C.H. Artificial Intelligence and Cardiac Imaging: We need to talk about this. Arq. Bras. DE Cardiol. IMAGEM Cardiovasc. 2019, 32, 154–156. (In Portuguese) [Google Scholar] [CrossRef]
- MATLAB & Simulink. What Is Reinforcement Learning? Available online: https://www.mathworks.com/discovery/reinforcement-learning.html (accessed on 11 October 2022).
- Algoritmos de Clustering—Visão Geral. Available online: https://isolution.pro/pt/t/machine-learning-with-python/clustering-algorithms-overview/algoritmos-de-clustering-visao-geral (accessed on 11 October 2022).
- NVIDIA Blog. Difference Between Supervised, Unsupervised, & Reinforcement Learning. Available online: https://blogs.nvidia.com/blog/2018/08/02/supervised-unsupervised-learning/ (accessed on 11 October 2022).
- Obeso, A.M.; Benois-Pineau, J.; Vázquez, M.S.G.; Acosta, A.R. Visual vs internal attention mechanisms in deep neural networks for image classification and object detection. Pattern Recognit. 2022, 123, 108411. [Google Scholar] [CrossRef]
- Redmon, J.; Divvala, S.; Girshick, R.; Farhadi, A. You Only Look Once: Unified, Real-Time Object Detection. 2015. Available online: http://arxiv.org/abs/1506.02640 (accessed on 11 October 2022).
- 11: Yolo V4 Explained in Full Detail-EN—Deep Learning Bible—3: Object Detection—English. Available online: https://wikidocs.net/167833 (accessed on 14 October 2022).
- Sambasivarao, K. Non-Maximum Suppression (NMS). A Technique to Filter the Predictions of Object Detectors. Available online: https://towardsdatascience.com/non-maximum-suppression-nms-93ce178e177c (accessed on 14 October 2022).
- Como Funciona o Rastreamento de Objetos em YOLO e DeepSort. Available online: https://tech-pt.netlify.app/articles/pt514450/index.html (accessed on 14 October 2022). (In Portuguese).
- Caldas, P.; Sousa, F.; Pereira, F.; Lopes, H.; Machado, J. Automatic system for yarn quality analysis by image processing. J. Braz. Soc. Mech. Sci. Eng. 2022, 44, 565. [Google Scholar] [CrossRef]
- Roboflow. Give Your Software the Power to See Objects in Images and Video. Available online: https://roboflow.com/ (accessed on 14 October 2022).
- Sikka, M.P.; Sarkar, A.; Garg, S. Artificial intelligence (AI) in textile industry operational modernization. Res. J. Text. Appar. 2022; ahead-of-print. [Google Scholar] [CrossRef]
Figure 1.
Flowchart of the method for detecting yarn parameters and evaluating yarn quality (Adapted from [
6]).
Figure 1.
Flowchart of the method for detecting yarn parameters and evaluating yarn quality (Adapted from [
6]).
Figure 2.
System device to detect yarn parameters (Adapted from [
6]).
Figure 2.
System device to detect yarn parameters (Adapted from [
6]).
Figure 3.
(
a) New foreground image, (
b) thread core, (
c) hairiness (Adapted from [
6]).
Figure 3.
(
a) New foreground image, (
b) thread core, (
c) hairiness (Adapted from [
6]).
Figure 4.
An example of a yarn image with a nep defect obtained using the image acquisition system (Adapted from [
10]).
Figure 4.
An example of a yarn image with a nep defect obtained using the image acquisition system (Adapted from [
10]).
Figure 5.
Excessive false detections by Model A, in a yarn image of the validation dataset (Adapted from [
10]).
Figure 5.
Excessive false detections by Model A, in a yarn image of the validation dataset (Adapted from [
10]).
Figure 6.
Cotton threads: the architecture of neural network traction properties (Adapted from [
11]).
Figure 6.
Cotton threads: the architecture of neural network traction properties (Adapted from [
11]).
Figure 7.
Mixed yarns: the structure of neural network traction properties (Adapted from [
11]).
Figure 7.
Mixed yarns: the structure of neural network traction properties (Adapted from [
11]).
Figure 8.
Stages of the process performed (Adapted from [
12]).
Figure 8.
Stages of the process performed (Adapted from [
12]).
Figure 9.
The tenacity and % elongation architectures of the neural network: (
a) Ring yarn system (
left), (
b) compact yarn system (
right) (Adapted from [
12]).
Figure 9.
The tenacity and % elongation architectures of the neural network: (
a) Ring yarn system (
left), (
b) compact yarn system (
right) (Adapted from [
12]).
Figure 10.
Textile yarn configuration (Adapted from [
14]).
Figure 10.
Textile yarn configuration (Adapted from [
14]).
Figure 11.
Representation of the yarn core and fibers (Adapted from [
17]).
Figure 11.
Representation of the yarn core and fibers (Adapted from [
17]).
Figure 12.
Illustration of the types of yarn twist orientation (Adapted from [
18]).
Figure 12.
Illustration of the types of yarn twist orientation (Adapted from [
18]).
Figure 13.
Yarn twist step (Adapted from [
18]).
Figure 13.
Yarn twist step (Adapted from [
18]).
Figure 14.
Types of dimensional imperfections (Adapted from [
19]).
Figure 14.
Types of dimensional imperfections (Adapted from [
19]).
Figure 15.
Subsets of artificial intelligence (Adapted from [
23,
24]).
Figure 15.
Subsets of artificial intelligence (Adapted from [
23,
24]).
Figure 16.
Machine learning categories (Adapted from [
23,
24]).
Figure 16.
Machine learning categories (Adapted from [
23,
24]).
Figure 17.
Supervised learning. Steps: (1) made annotations in the dataset; (2) dataset separation; (3) algorithm training; (4) dataset test for algorithm evaluation and performance (Adapted from [
25]).
Figure 17.
Supervised learning. Steps: (1) made annotations in the dataset; (2) dataset separation; (3) algorithm training; (4) dataset test for algorithm evaluation and performance (Adapted from [
25]).
Figure 18.
Clustering algorithm (Adapted from [
27]).
Figure 18.
Clustering algorithm (Adapted from [
27]).
Figure 19.
Unsupervised learning–Information extraction (Adapted from [
28]).
Figure 19.
Unsupervised learning–Information extraction (Adapted from [
28]).
Figure 20.
Unsupervised learning—information extraction (Adapted from [
29]).
Figure 20.
Unsupervised learning—information extraction (Adapted from [
29]).
Figure 21.
Unsupervised learning—information extraction (Adapted from [
29]).
Figure 21.
Unsupervised learning—information extraction (Adapted from [
29]).
Figure 22.
YOLO models the detection as a regression problem. It splits the image into an S × S grid and for each cell of the grid predicts bounding boxes B, confidence for those boxes (thicker lines, higher confidence) and class C probabilities. These predictions are encoded as a tensor S × S × (B × 5 + C) (Adapted from [
31,
32]).
Figure 23.
YOLO architecture and how it works (Adapted from [
33,
34]).
Figure 23.
YOLO architecture and how it works (Adapted from [
33,
34]).
Figure 24.
Intersection over Union—B1: Predication Box and B2: Detection Box (Adapted from [
33,
34]).
Figure 24.
Intersection over Union—B1: Predication Box and B2: Detection Box (Adapted from [
33,
34]).
Figure 25.
Non-Maximum Suppression Process example (Adapted from [
33,
34]).
Figure 25.
Non-Maximum Suppression Process example (Adapted from [
33,
34]).
Figure 26.
Textile yarn winding and unwinding machine.
Figure 26.
Textile yarn winding and unwinding machine.
Figure 27.
Mechatronic system developed (description presented in
Table 2).
Figure 27.
Mechatronic system developed (description presented in
Table 2).
Figure 28.
Kinematic chains ((
A) and (
B) are Servomotors) [
32].
Figure 28.
Kinematic chains ((
A) and (
B) are Servomotors) [
32].
Figure 29.
StViewer software executable.
Figure 29.
StViewer software executable.
Figure 30.
Available parameter categories.
Figure 30.
Available parameter categories.
Figure 31.
Vision system.
Figure 31.
Vision system.
Figure 32.
Lens set already with a textile yarn holder.
Figure 32.
Lens set already with a textile yarn holder.
Figure 33.
User interface.
Figure 33.
User interface.
Figure 34.
Algorithm analysis methodology flowchart.
Figure 34.
Algorithm analysis methodology flowchart.
Figure 35.
Three types of textile yarn tested.
Figure 35.
Three types of textile yarn tested.
Figure 36.
Insulated contours of the textile yarn.
Figure 36.
Insulated contours of the textile yarn.
Figure 37.
Purple cotton yarn video analysis results in user interface prototype.
Figure 37.
Purple cotton yarn video analysis results in user interface prototype.
Figure 38.
Mass spectrogram.
Figure 38.
Mass spectrogram.
Figure 39.
Mass spectrogram graphic obtained by the USTER Tester 3.
Figure 39.
Mass spectrogram graphic obtained by the USTER Tester 3.
Figure 40.
Presentation of spectral analysis results of purple cotton yarn in the user interface.
Figure 40.
Presentation of spectral analysis results of purple cotton yarn in the user interface.
Figure 41.
Annotations of an image of the yarn made by LabelME (loop fibers—green color and protruding fibers—red color).
Figure 41.
Annotations of an image of the yarn made by LabelME (loop fibers—green color and protruding fibers—red color).
Figure 42.
Data augmentation of the dataset used in the project [
33].
Figure 42.
Data augmentation of the dataset used in the project [
33].
Figure 43.
Data augmentation of the dataset used in the project.
Figure 43.
Data augmentation of the dataset used in the project.
Figure 44.
Obtained confusion matrix for this training setup.
Figure 44.
Obtained confusion matrix for this training setup.
Figure 45.
Setup output results using the YOLOv5s algorithm.
Figure 45.
Setup output results using the YOLOv5s algorithm.
Figure 46.
Classification results using the YOLOv5s algorithm.
Figure 46.
Classification results using the YOLOv5s algorithm.
Table 1.
Characteristics of the previously proposed solutions compared to the case study.
Table 1.
Characteristics of the previously proposed solutions compared to the case study.
Characteristics Obtained by the System and Used
Technologies | System A (Proposed) | System B [6] | System C [10] | System D [11] | System E [12] |
|---|
| Mechatronic prototype developed? | YES | YES | YES | YES | NO |
| Non-destructive Prototype? | YES | NO | NO | NO | NO |
| Yarn Winding and Unwinding System? | YES | YES | YES | NO | NO |
| Image or Video analysis in textile yarn? | Image and Video | Image | Image | Image | Image |
| Vision System (VS) or Artificial Intelligence (AI) or Optical Sensors to detect defects in textile fabric or textile yarn? | VS and AI | VS | VS | AI | AI |
| Obtain Yarn twist orientation? | YES | NO | NO | NO | NO |
| Obtain Yarn twist step? | YES | NO | NO | NO | NO |
| Obtain Hairiness Index? | YES | YES | NO | NO | NO |
| Obtain Thick places? | YES | NO | NO | NO | NO |
| Obtain Thin places? | YES | NO | NO | NO | NO |
| Obtain Neps? | YES | NO | YES | NO | NO |
| Obtain Diameter? | YES | YES | NO | NO | NO |
| Obtain Linear Mass? | YES | NO | NO | NO | YES |
| Obtain Volume? | YES | NO | NO | NO | NO |
| Obtain Number of cables? | YES | NO | NO | NO | NO |
| Number of loose fibers? | YES | NO | NO | NO | NO |
| Obtain Mean deviation of mass U (%)? | YES | NO | NO | NO | NO |
| Obtain Coefficient of variation CV (%)? | YES | NO | NO | NO | YES |
| Obtain Hairiness coefficient H? | YES | NO | NO | NO | NO |
| Obtain Hairiness mean deviation UH (%)? | YES | NO | NO | NO | NO |
| Obtain Hairiness standard deviation sH (%)? | YES | NO | NO | NO | NO |
| Classify the type of Hairiness—loop/protruding fibers? | YES | NO | NO | NO | NO |
| Obtain Elongation at break in %? | NO | NO | NO | YES | YES |
| Obtain Tenacity (cN/tex)? | NO | NO | NO | YES | YES |
| Can the developed system be introduced in an industrial environment on production lines? | YES | YES | NO | NO | NO |
| Does the developed system allow you to collect images of the yarn online or offline? | Online and Offline | Offline | Offline | Offline | Offline |
| Obtain Spectral Analysis? | YES | NO | NO | NO | NO |
| Can be used with any kind of yarn? | YES | n.a. | NO | YES | YES |
| System Cost (€) | 1200 € (estimated) | n.a. | n.a. | n.a. | n.a. |
Table 2.
Nomenclature of mechanical system components [
35].
Table 2.
Nomenclature of mechanical system components [
35].
| Alphanumeric Reference | Numerical Reference |
|---|
| (A) Unwinding subsystem | (1) Textile yarn |
| (B) Conduction subsystem | (2) Coil to unwind |
| (C) Winding subsystem | (3) Ceramic guide |
| - | (4) Positive feeder 1 |
| - | (5) Chamber |
| - | (6) Camera lens |
| - | (7) Ring of light |
| - | (8) Ceramic guides |
| - | (9) Positive feeder 2 |
| - | (10) Servomotor |
| - | (11) Grooved cylinder |
| - | (12) Winding spool |
| - | (13) Electrical circuit box |
Table 3.
Camera technical specifications.
Table 3.
Camera technical specifications.
| Model | STC-MBS163U3V |
|---|
| Interface | USB3 Vision |
| Sensor type | CMOS |
| Resolution | 1.6 MP (Megapixels) |
| Resolution (columns x rows) | 1440 × 1080 pixels |
| Pixel Size (L x F) | 3.45 × 3.45 µm |
| Frame rate | 238 FPS (frames per second) |
| Color spectrum | Gray scale |
| Model | USB3 Vision |
| Interface | CMOS |
| Sensor type | 1.6 MP (Megapixels) |
| Resolution | 1440 × 1080 pixels |
Table 4.
USTER Tester 3 equipment results.
Table 4.
USTER Tester 3 equipment results.
| Parameters | Purple Cotton | Yellow
Cotton | White Polyester |
|---|
| Diameter (mm) | 0.270 | 0.175 | 0.175 |
| Linear Mass (tex) | 56.4 | 23.8 | 20.9 |
| Volume (mm3) | 0.156 | 0.0654 | 0.0654 |
| U (%) | 7.01 | 8.78 | 9.18 |
| CV (%) | 8.76 | 11.06 | 11.59 |
| Hairiness Index | 5.48 | 4.77 | 3.61 |
| sH (%) | 1.24 | 1.21 | 0.82 |
| Thick places (+50%) | 6 | 10 | 25 |
| Thick places (+100%) | 0 | 1 | 0 |
| Thin places (−50%) | 0 | 0 | 0 |
| Neps (+140%) | 32 | 44 | 164 |
| Neps (+200%) | 5 | 11 | 48 |
Table 5.
Purple cotton results.
Table 5.
Purple cotton results.
| Parameters | Prototype (Yarn Image Analysis) | USTER Tester 3 (Capacitive and Optical Sensors) |
|---|
| Diameter (mm) | 0.275 | 0.27 |
| Linear mass (tex) | 58.7 | 56.4 |
| Volume (mm3) | 0.1616 | 0.156 |
| Twist Orientation | S | n/a |
| Twist Step (mm) | 1.19 | n/a |
| Number of cables | 2 | n/a |
| Hairiness index | 5.51 | 5.48 |
| Number of loose fibers | 7 | n/a |
| Thin places (−50%) | 0/km | 0/km |
| Thick places (+50%) | 0/km | 38/km |
| Neps (+200%) | 0/km | 5/km |
| U (%) | 2.45 | 7.01 |
| CV (%) | 3.06 | 8.76 |
| sH (%) | 1.07 | 1.24 |
Table 6.
Purple cotton results.
Table 6.
Purple cotton results.
| Parameters | Prototype (Yarn Video Analysis) | USTER Tester (Capacitive and Optical Sensors) |
|---|
| Diameter (mm) | 0.28 | 0.27 |
| Linear mass (tex) | 58.9 | 56.4 |
| Volume (mm3) | 0.125 | 0.156 |
| Twist Orientation | S | n/a |
| Twist Step (mm) | 0.033 | n/a |
| Number of cables | 2 | n/a |
| Hairiness index | 5.33 | 5.48 |
| Number of loose fibers | n/a | n/a |
| Thin places (−50%) | 0/km | 0/km |
| Thick places (+50%) | 560/km | 38/km |
| Neps (+200%) | 60/km | 5/km |
| U (%) | 3.94 | 7.01 |
| CV (%) | 4.94 | 8.76 |
| sH (%) | 0.45 | 1.24 |
Table 7.
Training configuration.
Table 7.
Training configuration.
| | Configuration 1 |
|---|
| Image Size (pixels) | 1280 × 1024 |
| Number of training images | 90 |
| Number of test images | 7 |
| Number of validation images | 4 |
| Method | YOLOv5m |
| Epochs | 150 |
| Batch size | 8 |
| Training time (minutes) | 40 |
| Disclaimer/Publisher’s Note: The statements, opinions and data contained in all publications are solely those of the individual author(s) and contributor(s) and not of MDPI and/or the editor(s). MDPI and/or the editor(s) disclaim responsibility for any injury to people or property resulting from any ideas, methods, instructions or products referred to in the content. |
© 2023 by the authors. Licensee MDPI, Basel, Switzerland. This article is an open access article distributed under the terms and conditions of the Creative Commons Attribution (CC BY) license (https://creativecommons.org/licenses/by/4.0/).

 ,
, 


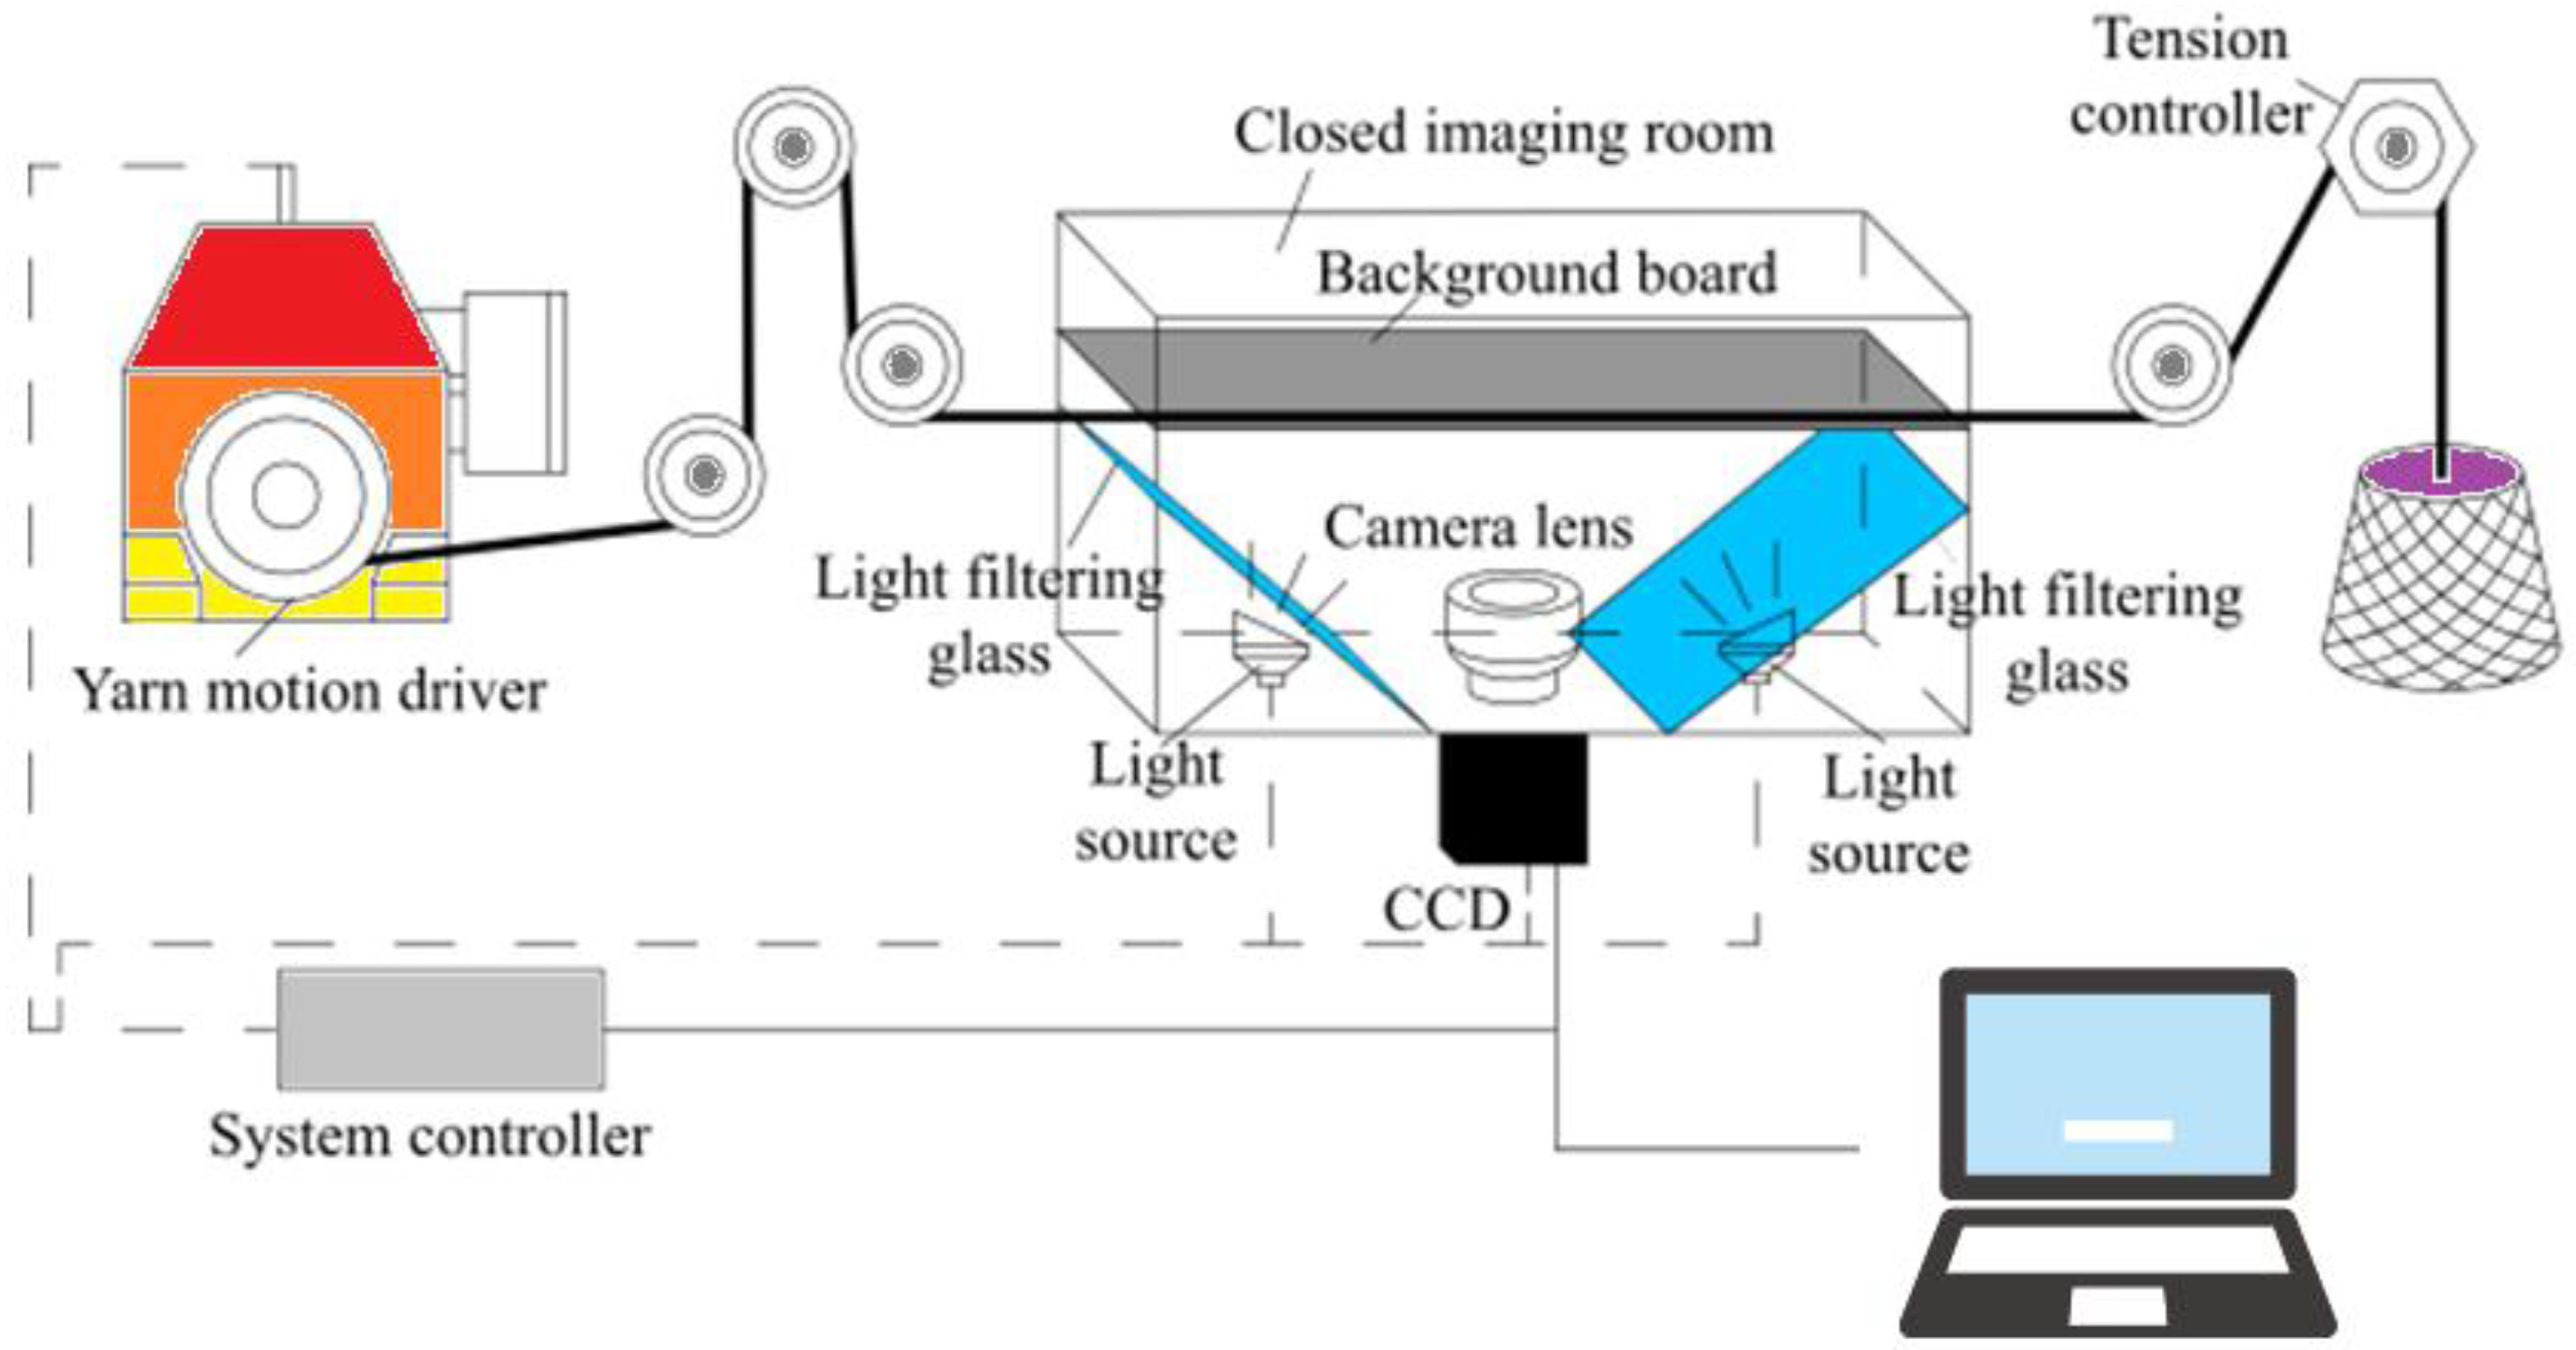
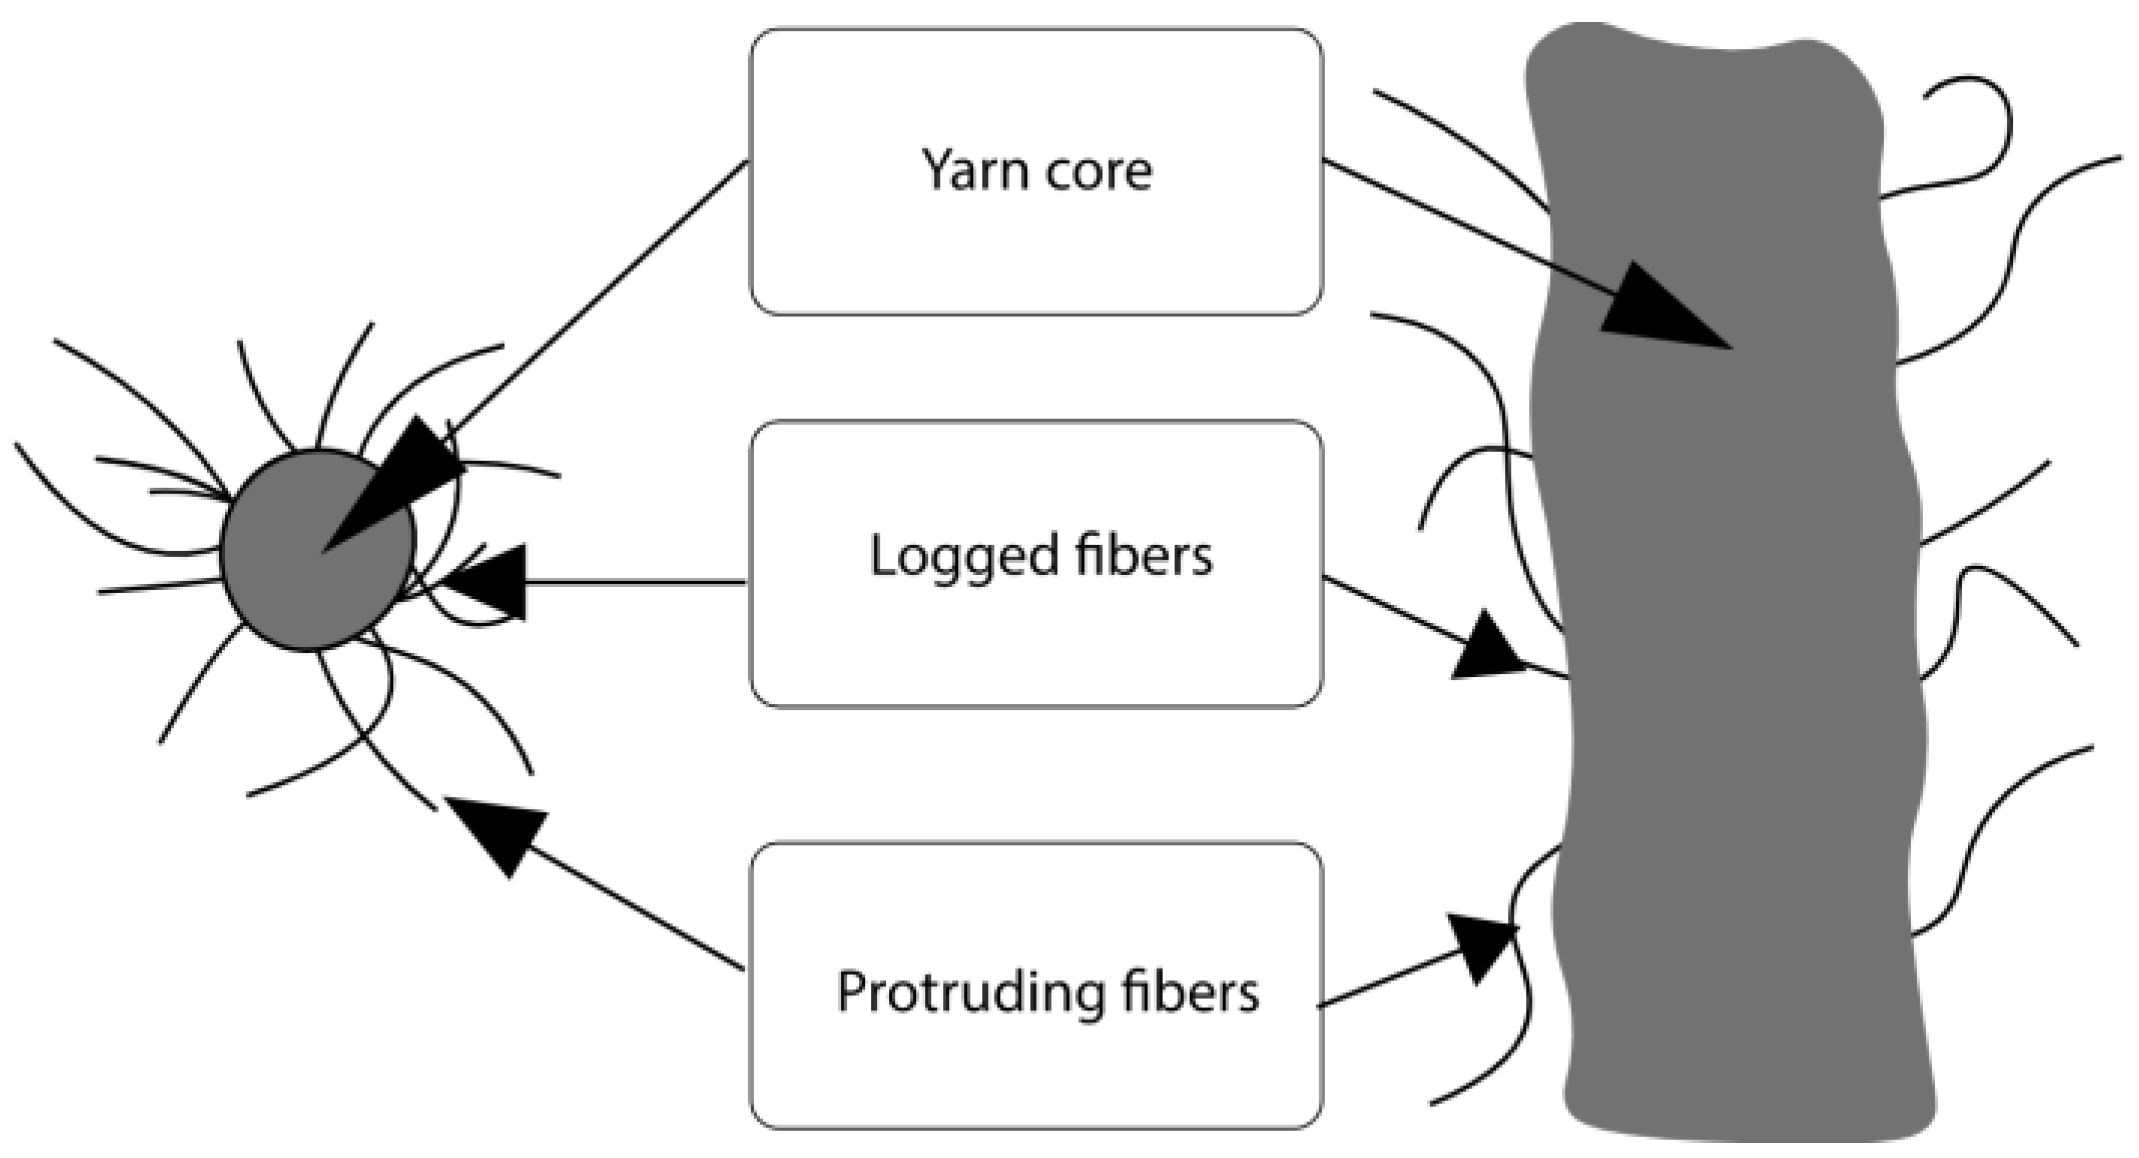
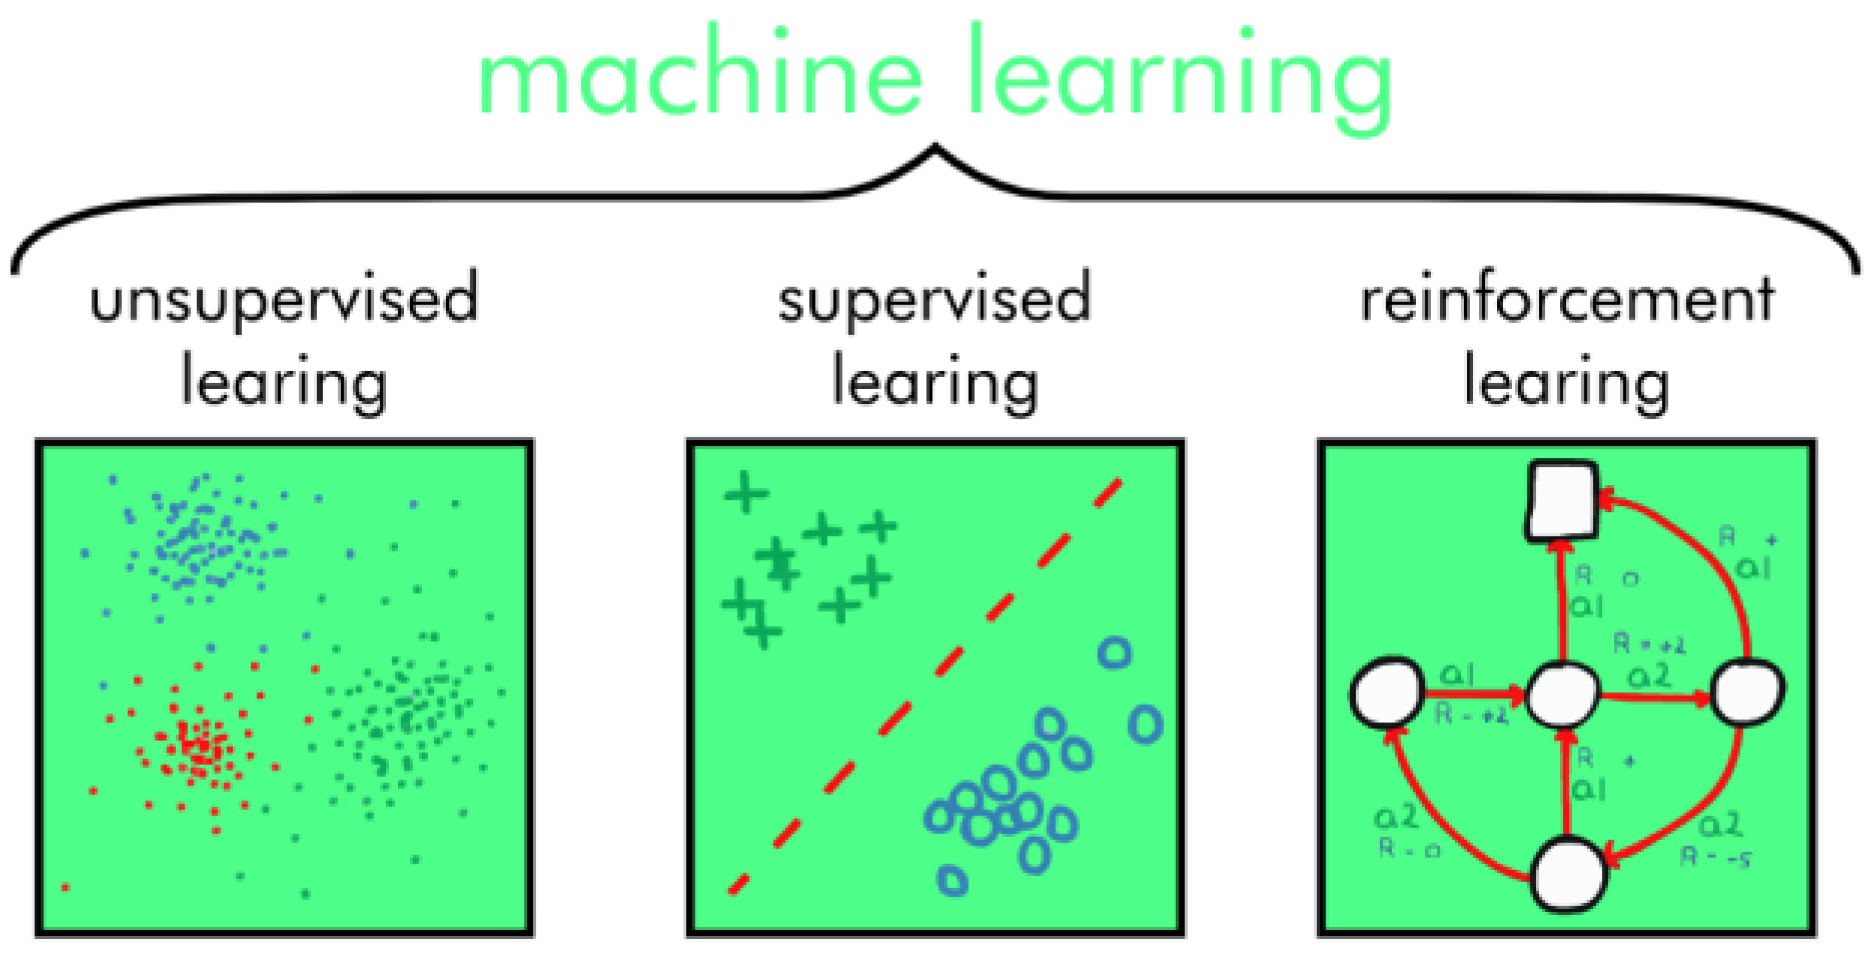
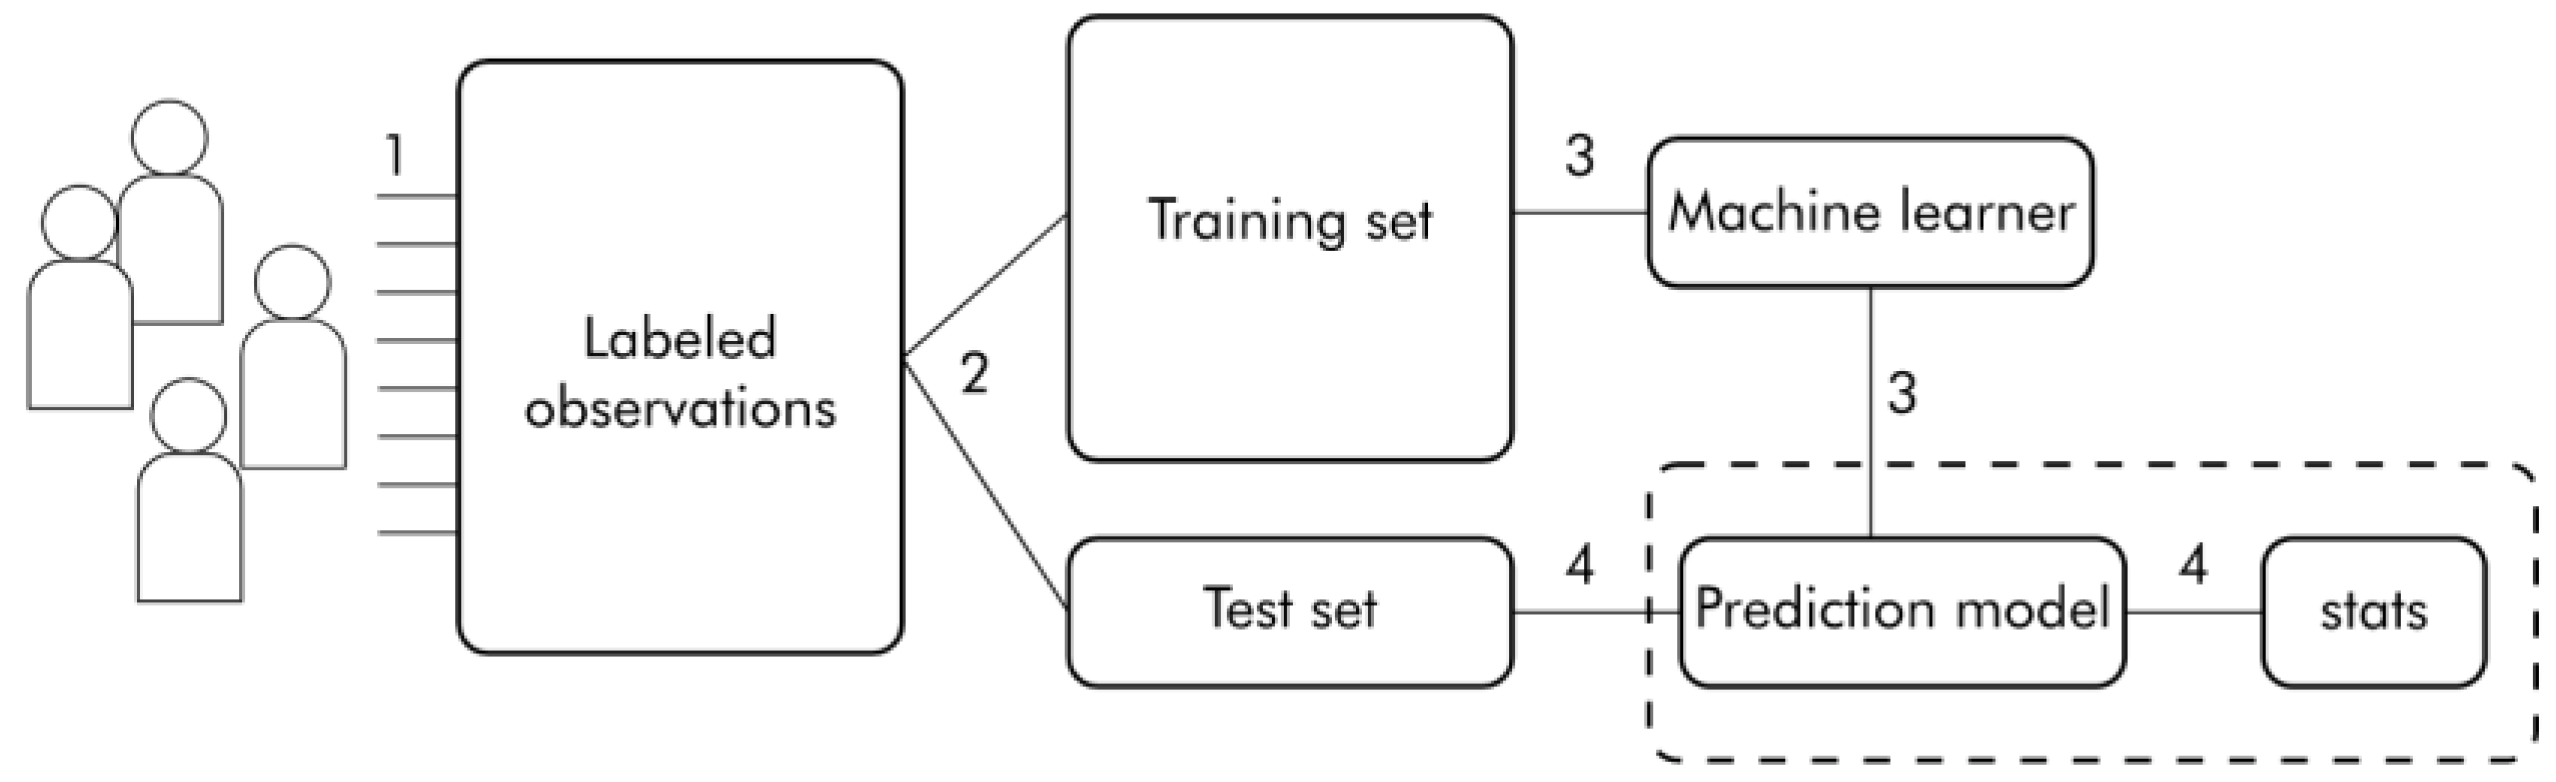
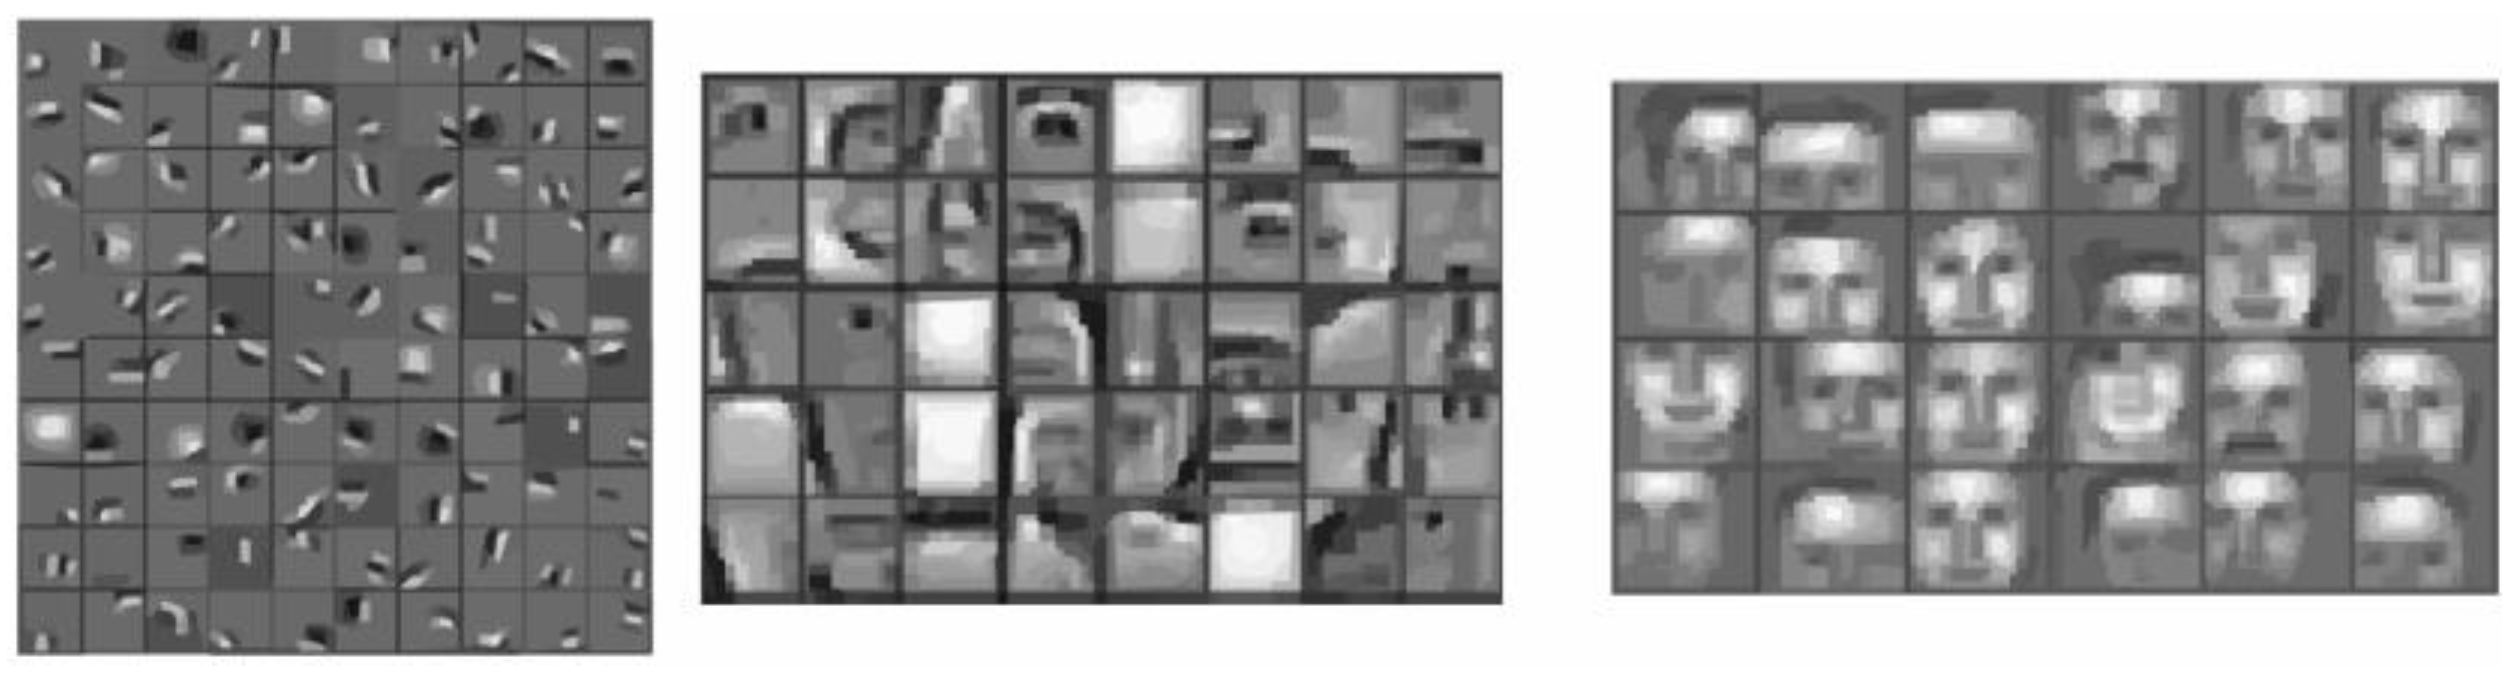
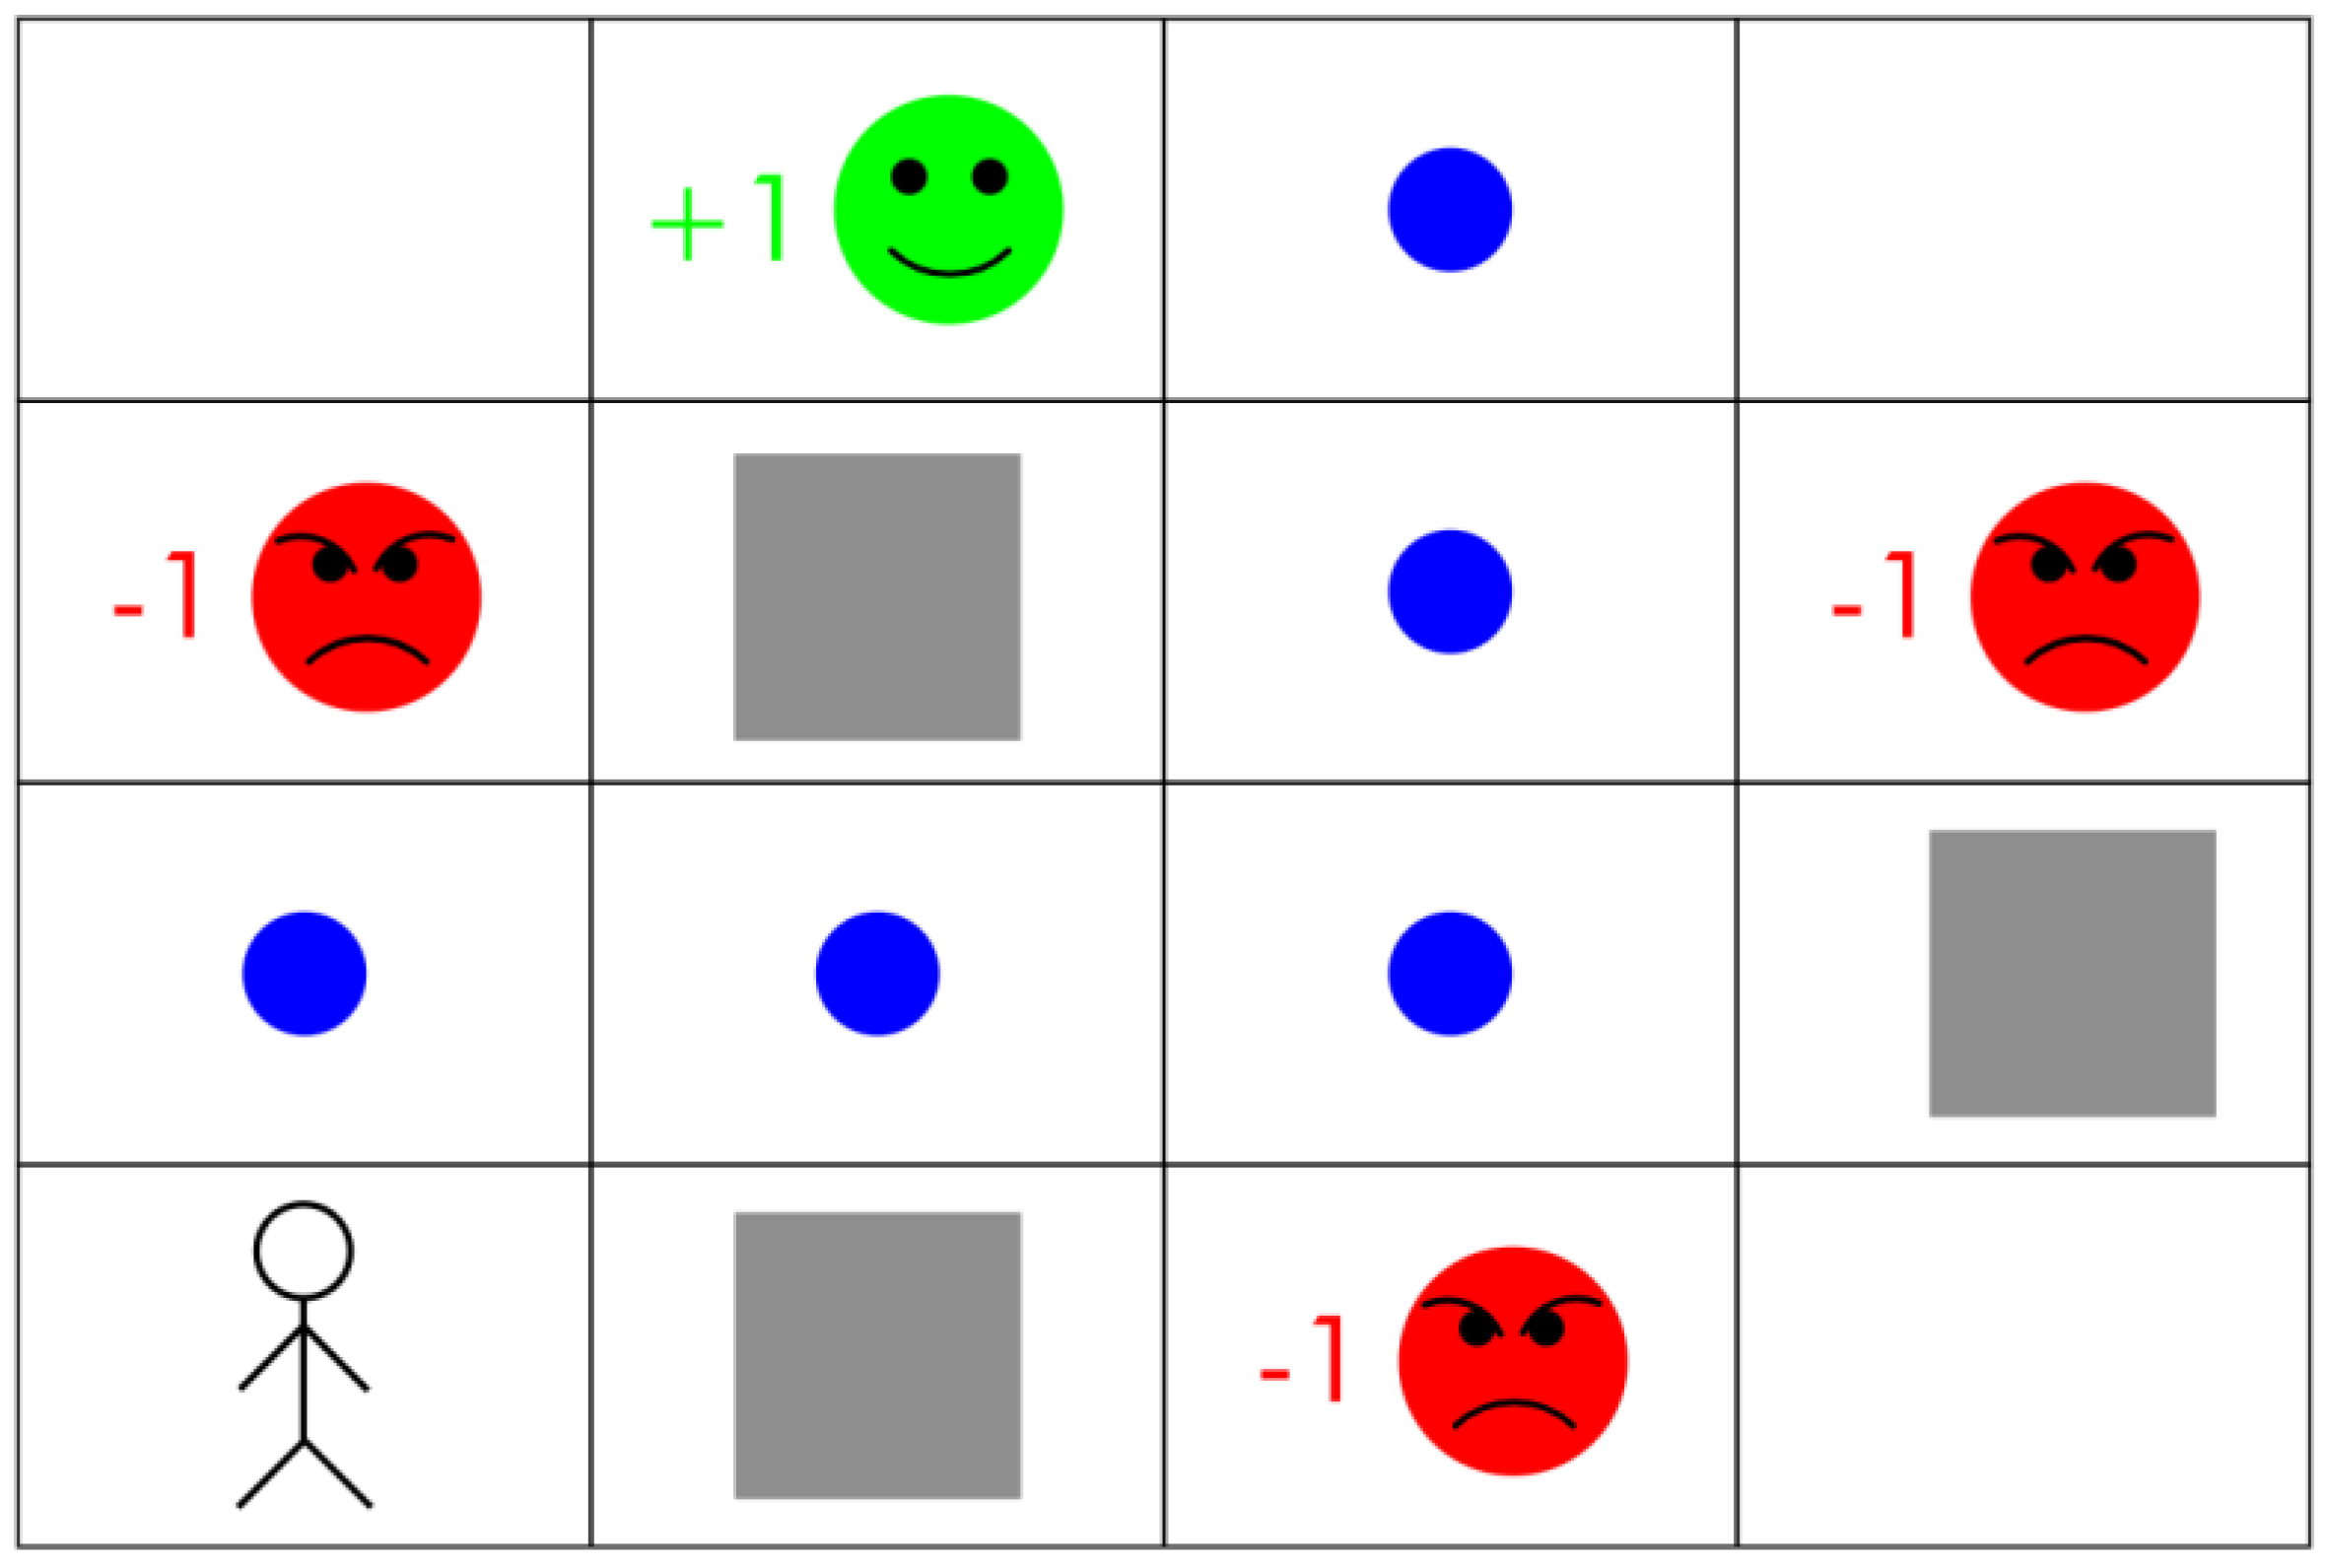
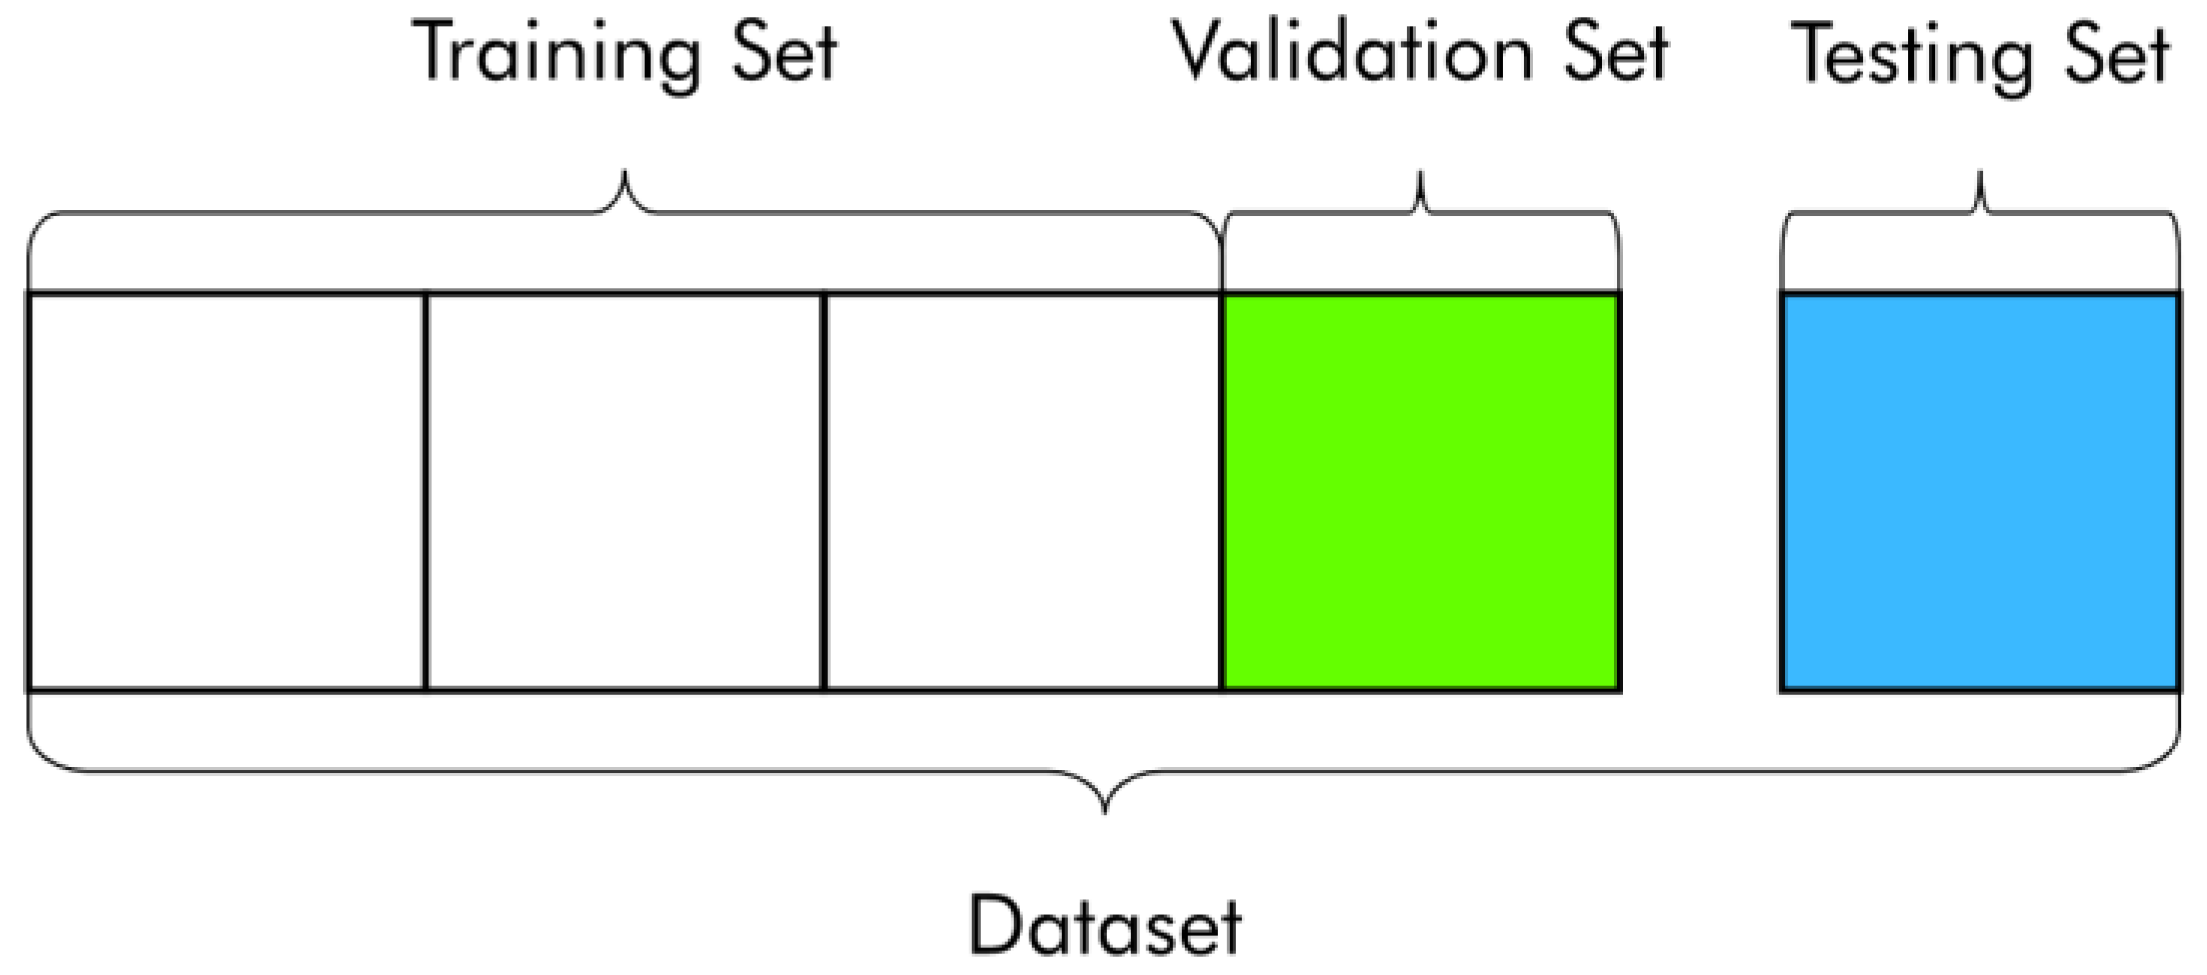
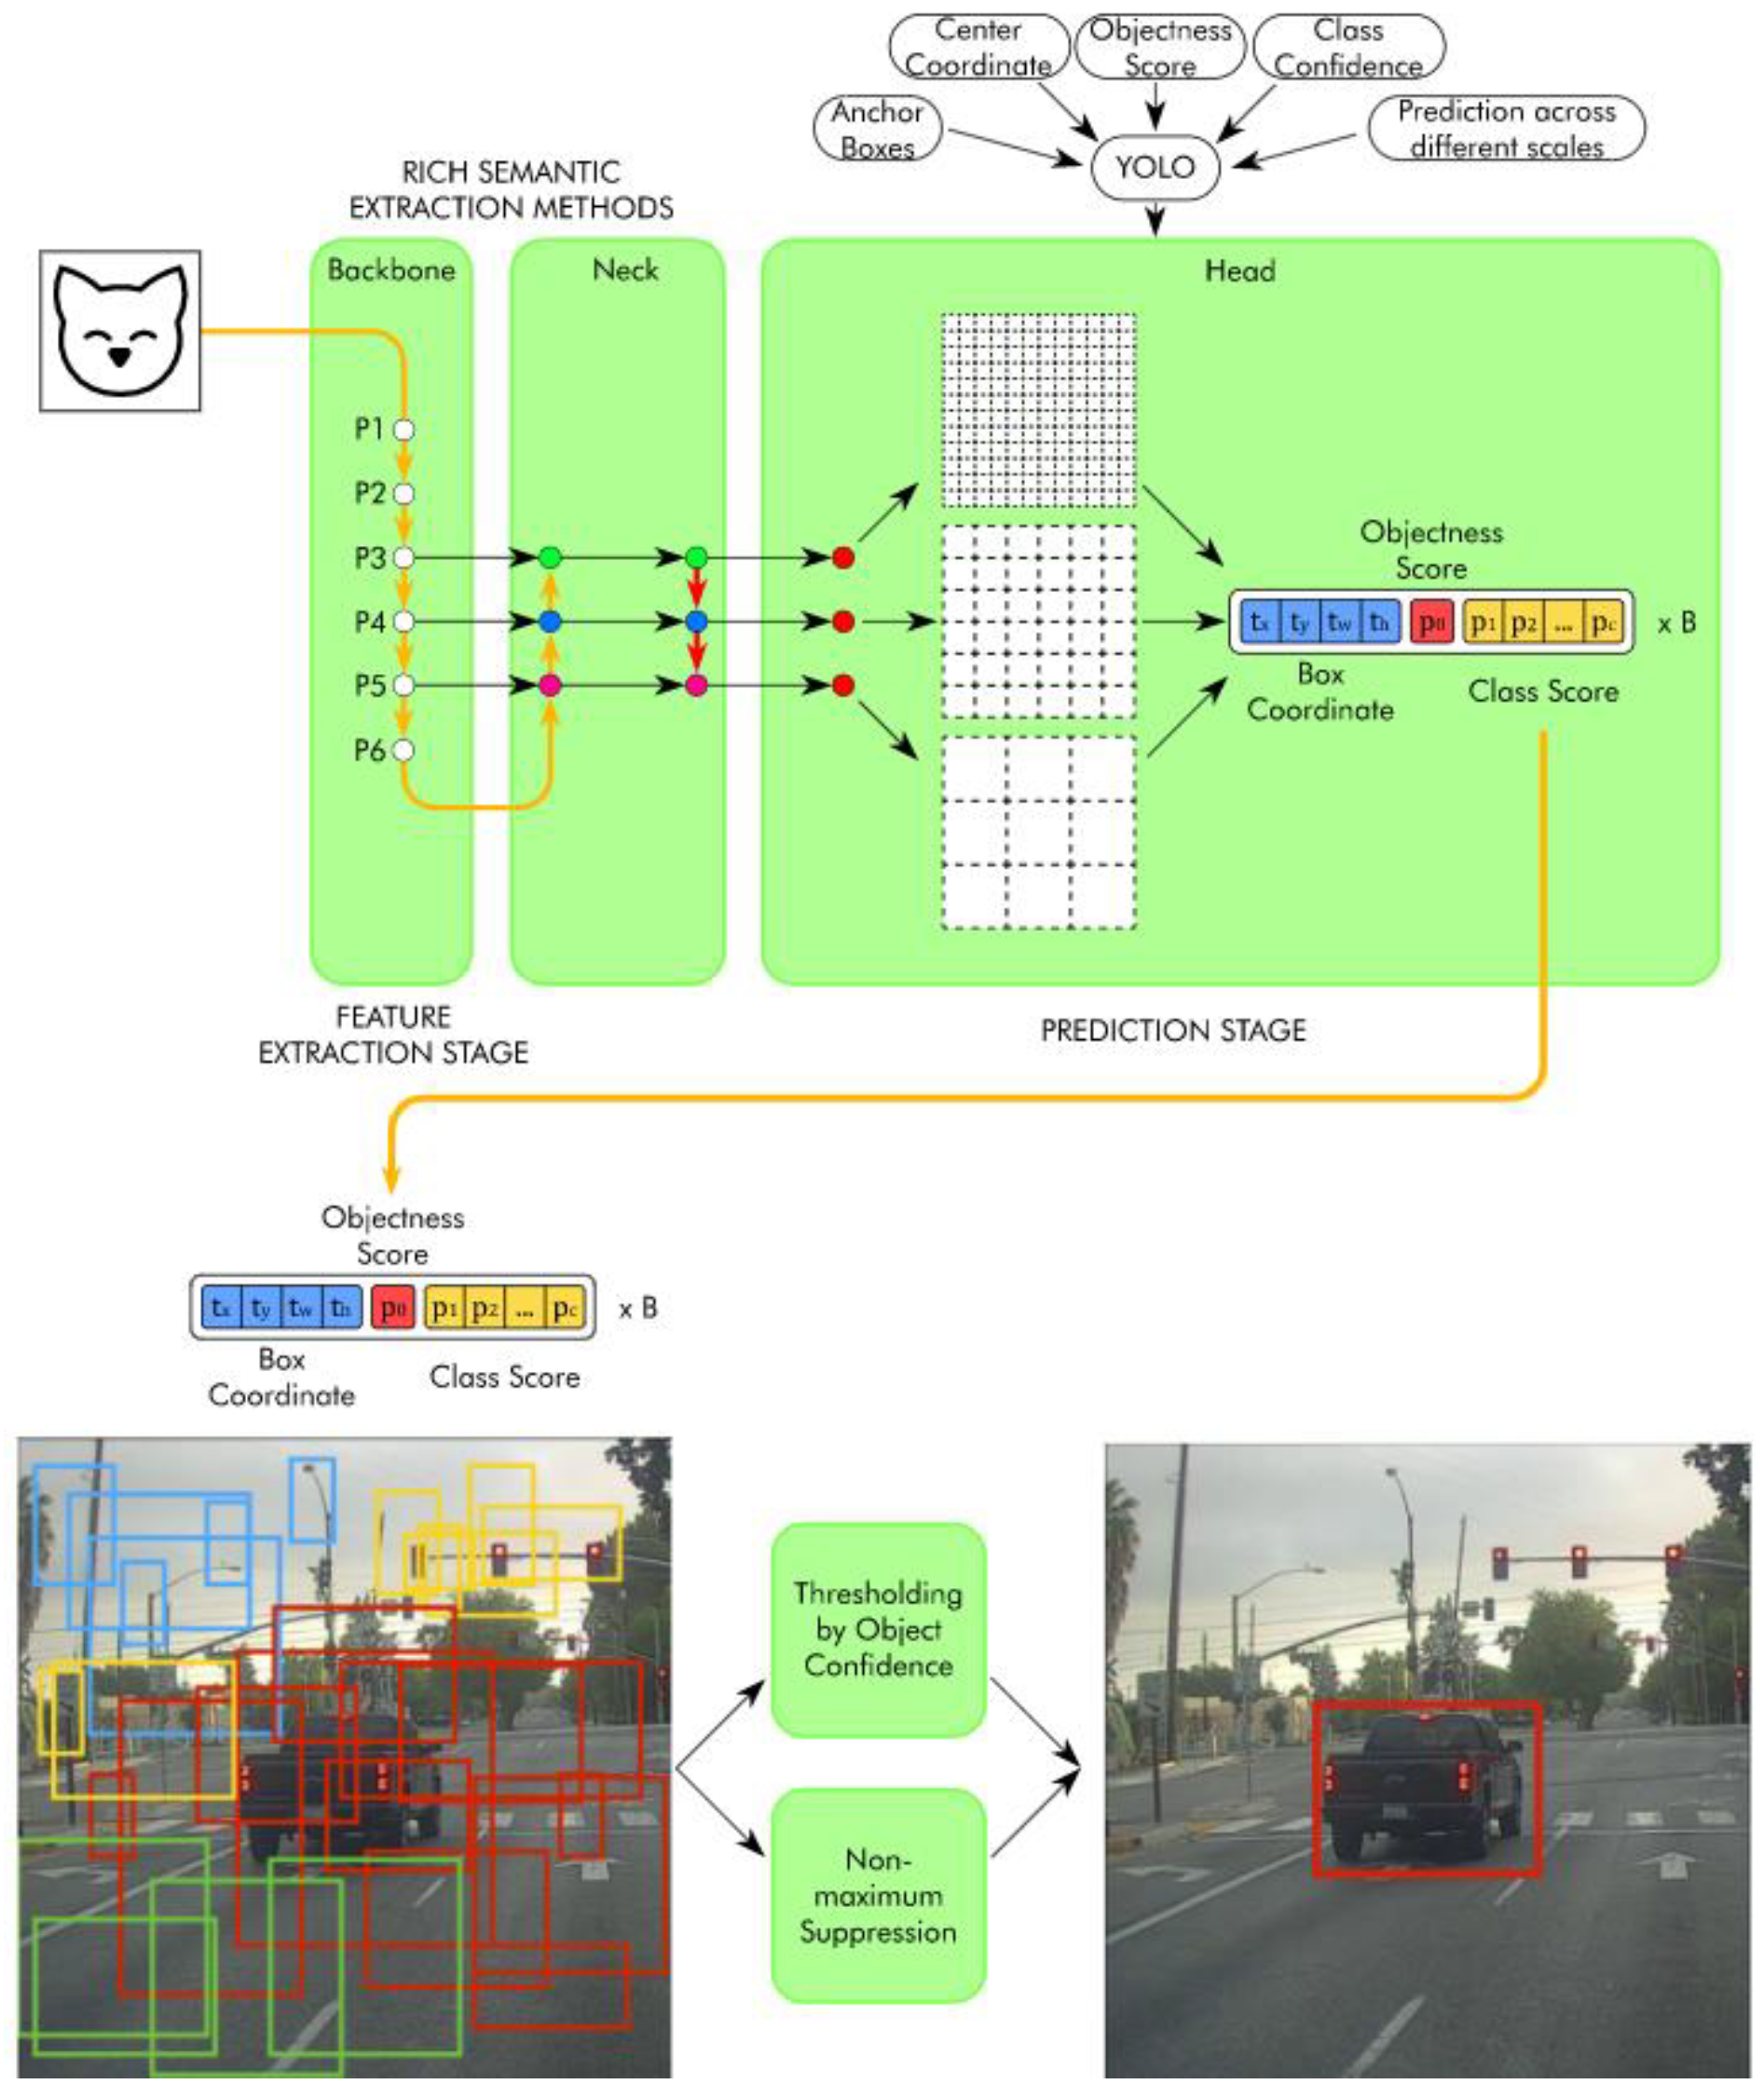
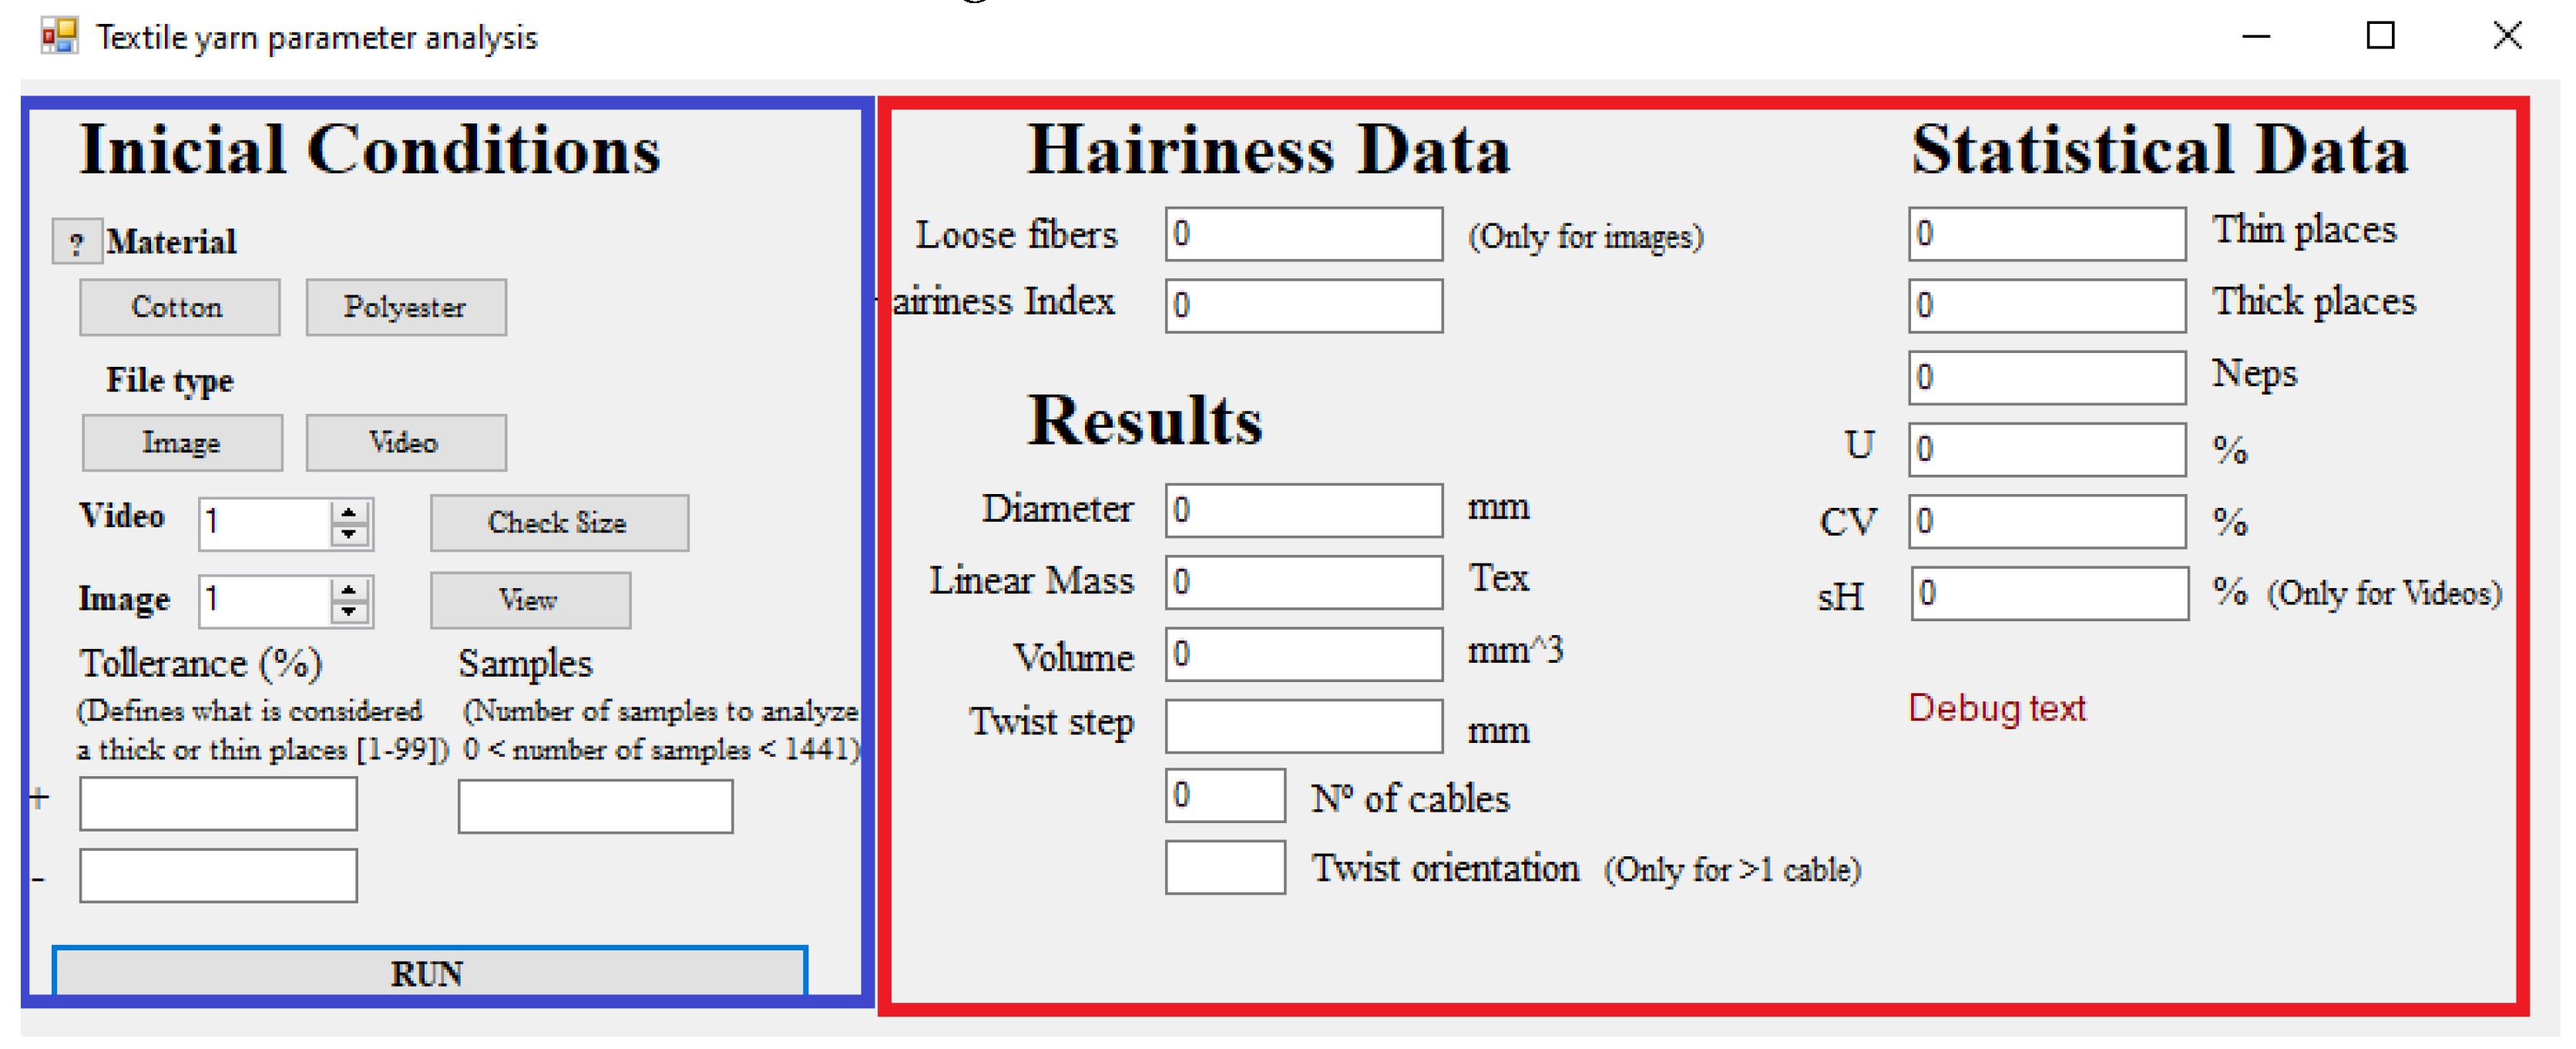
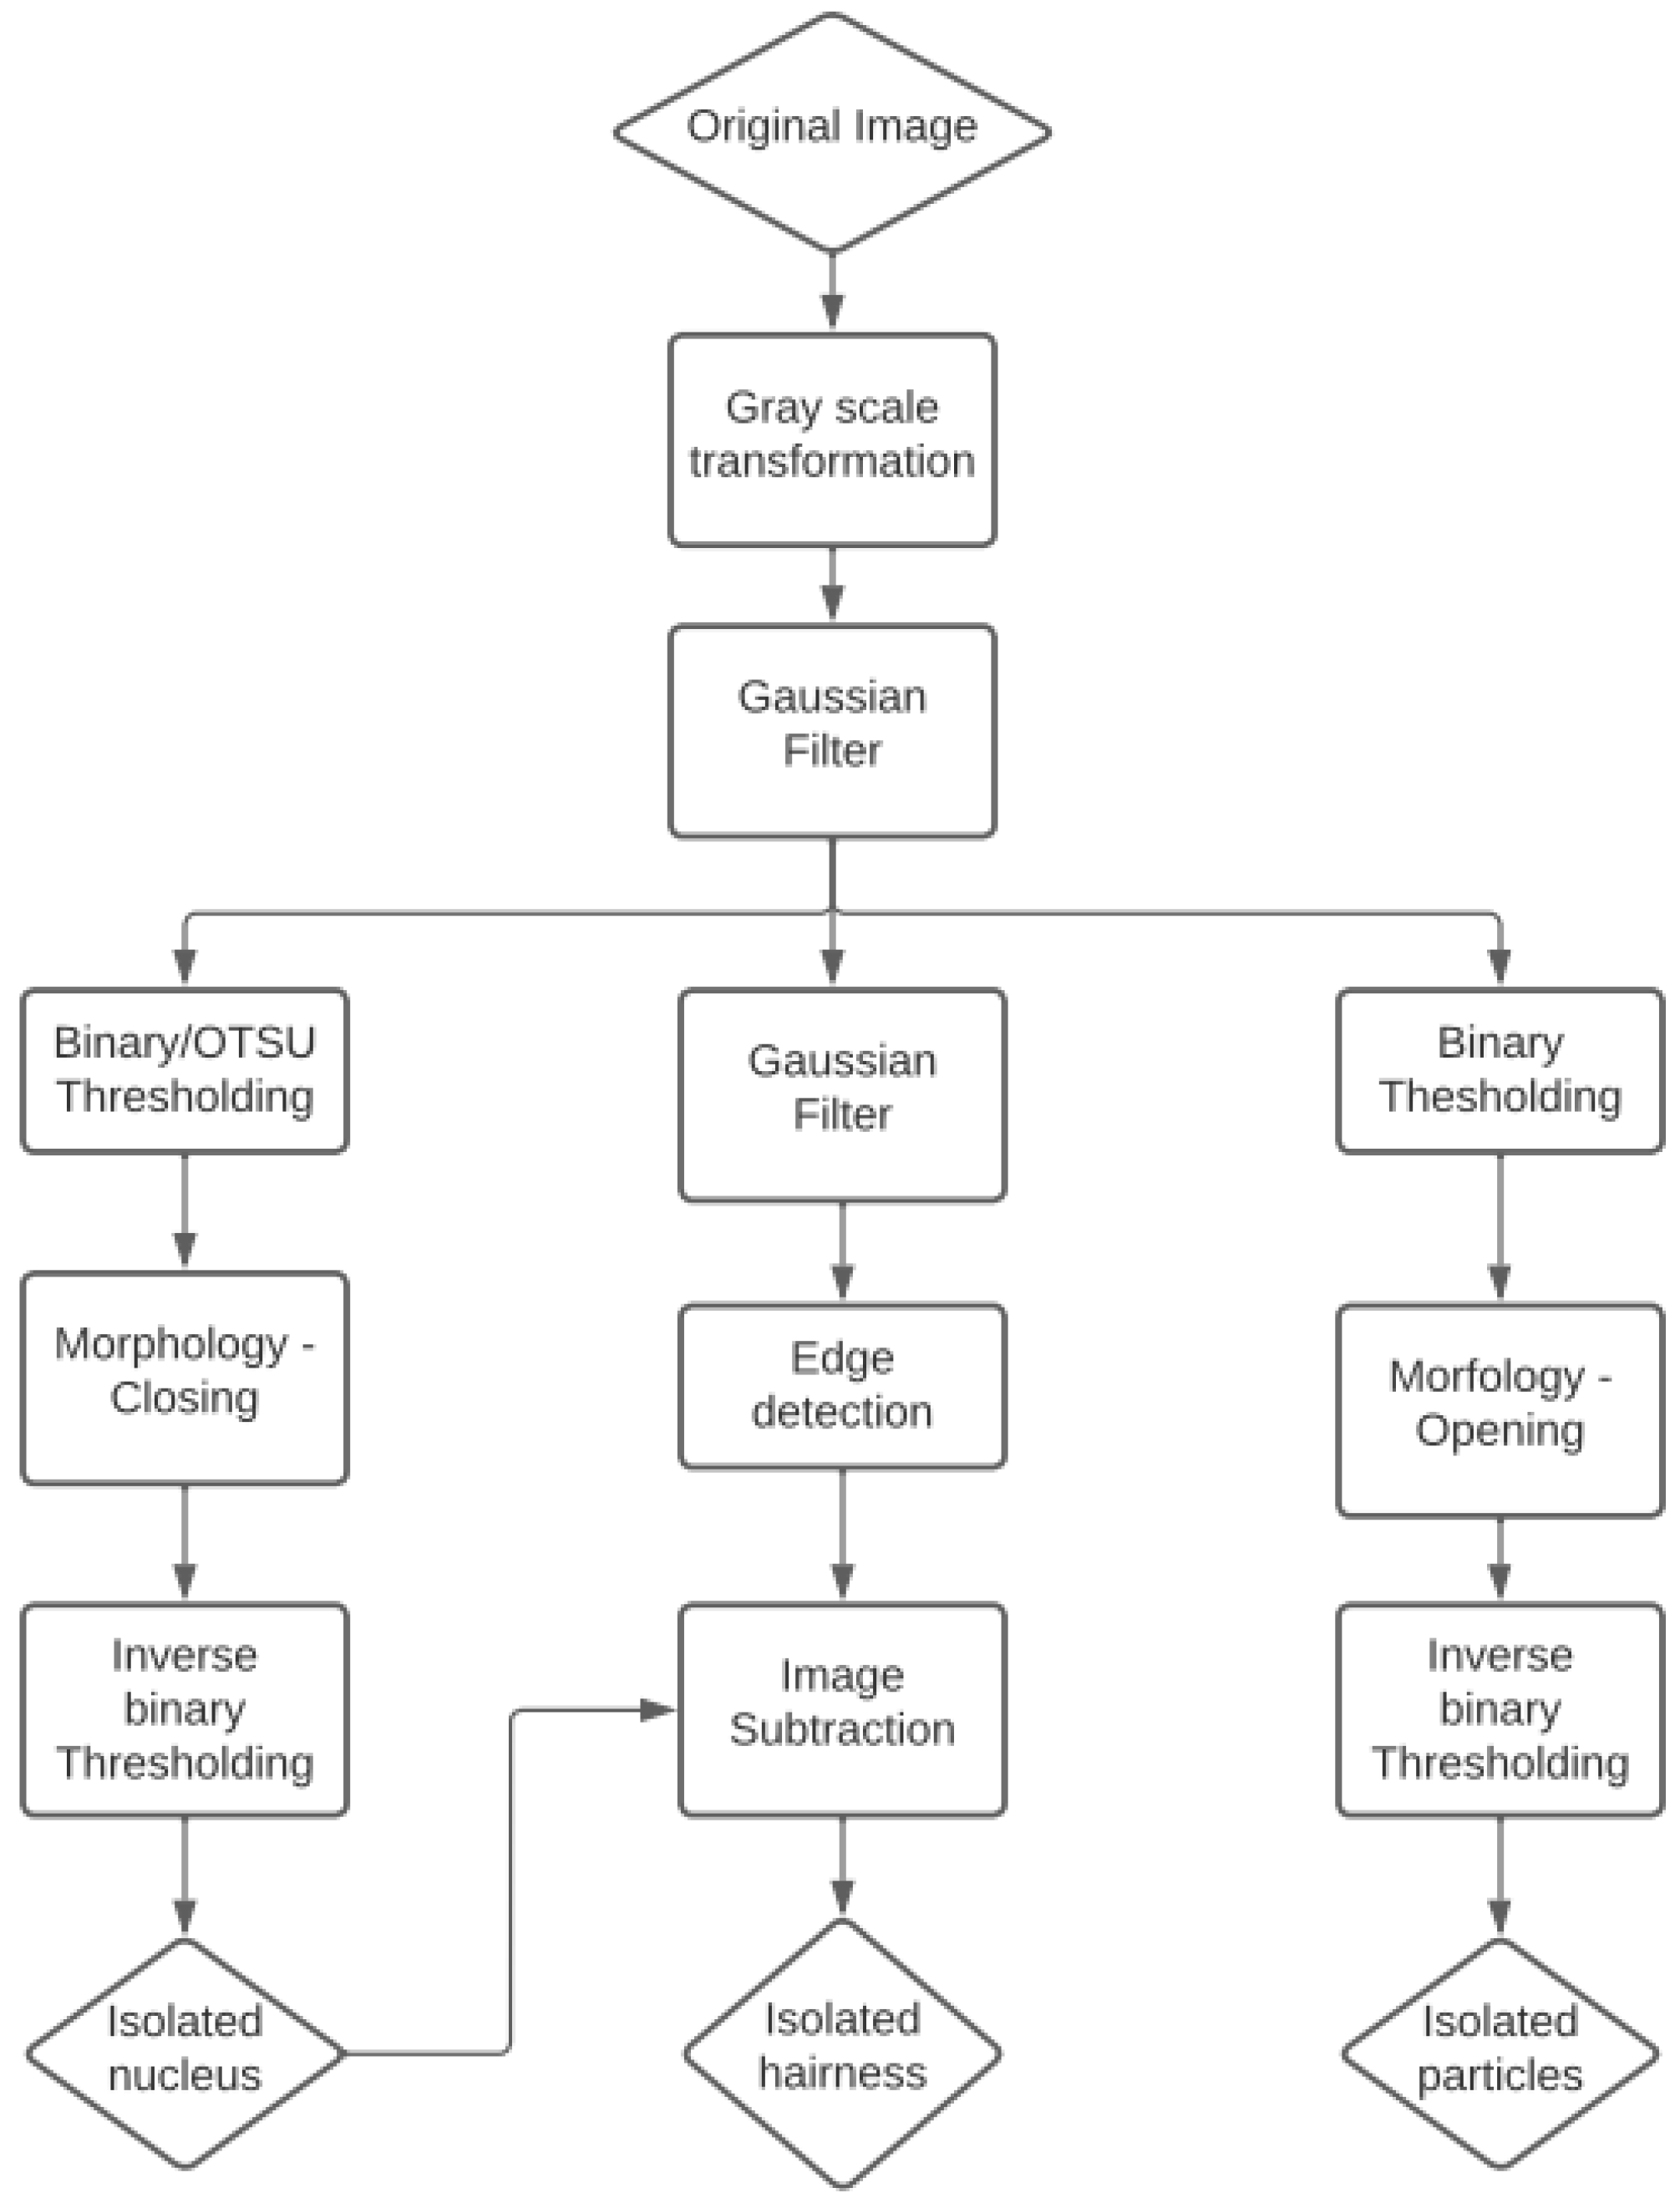
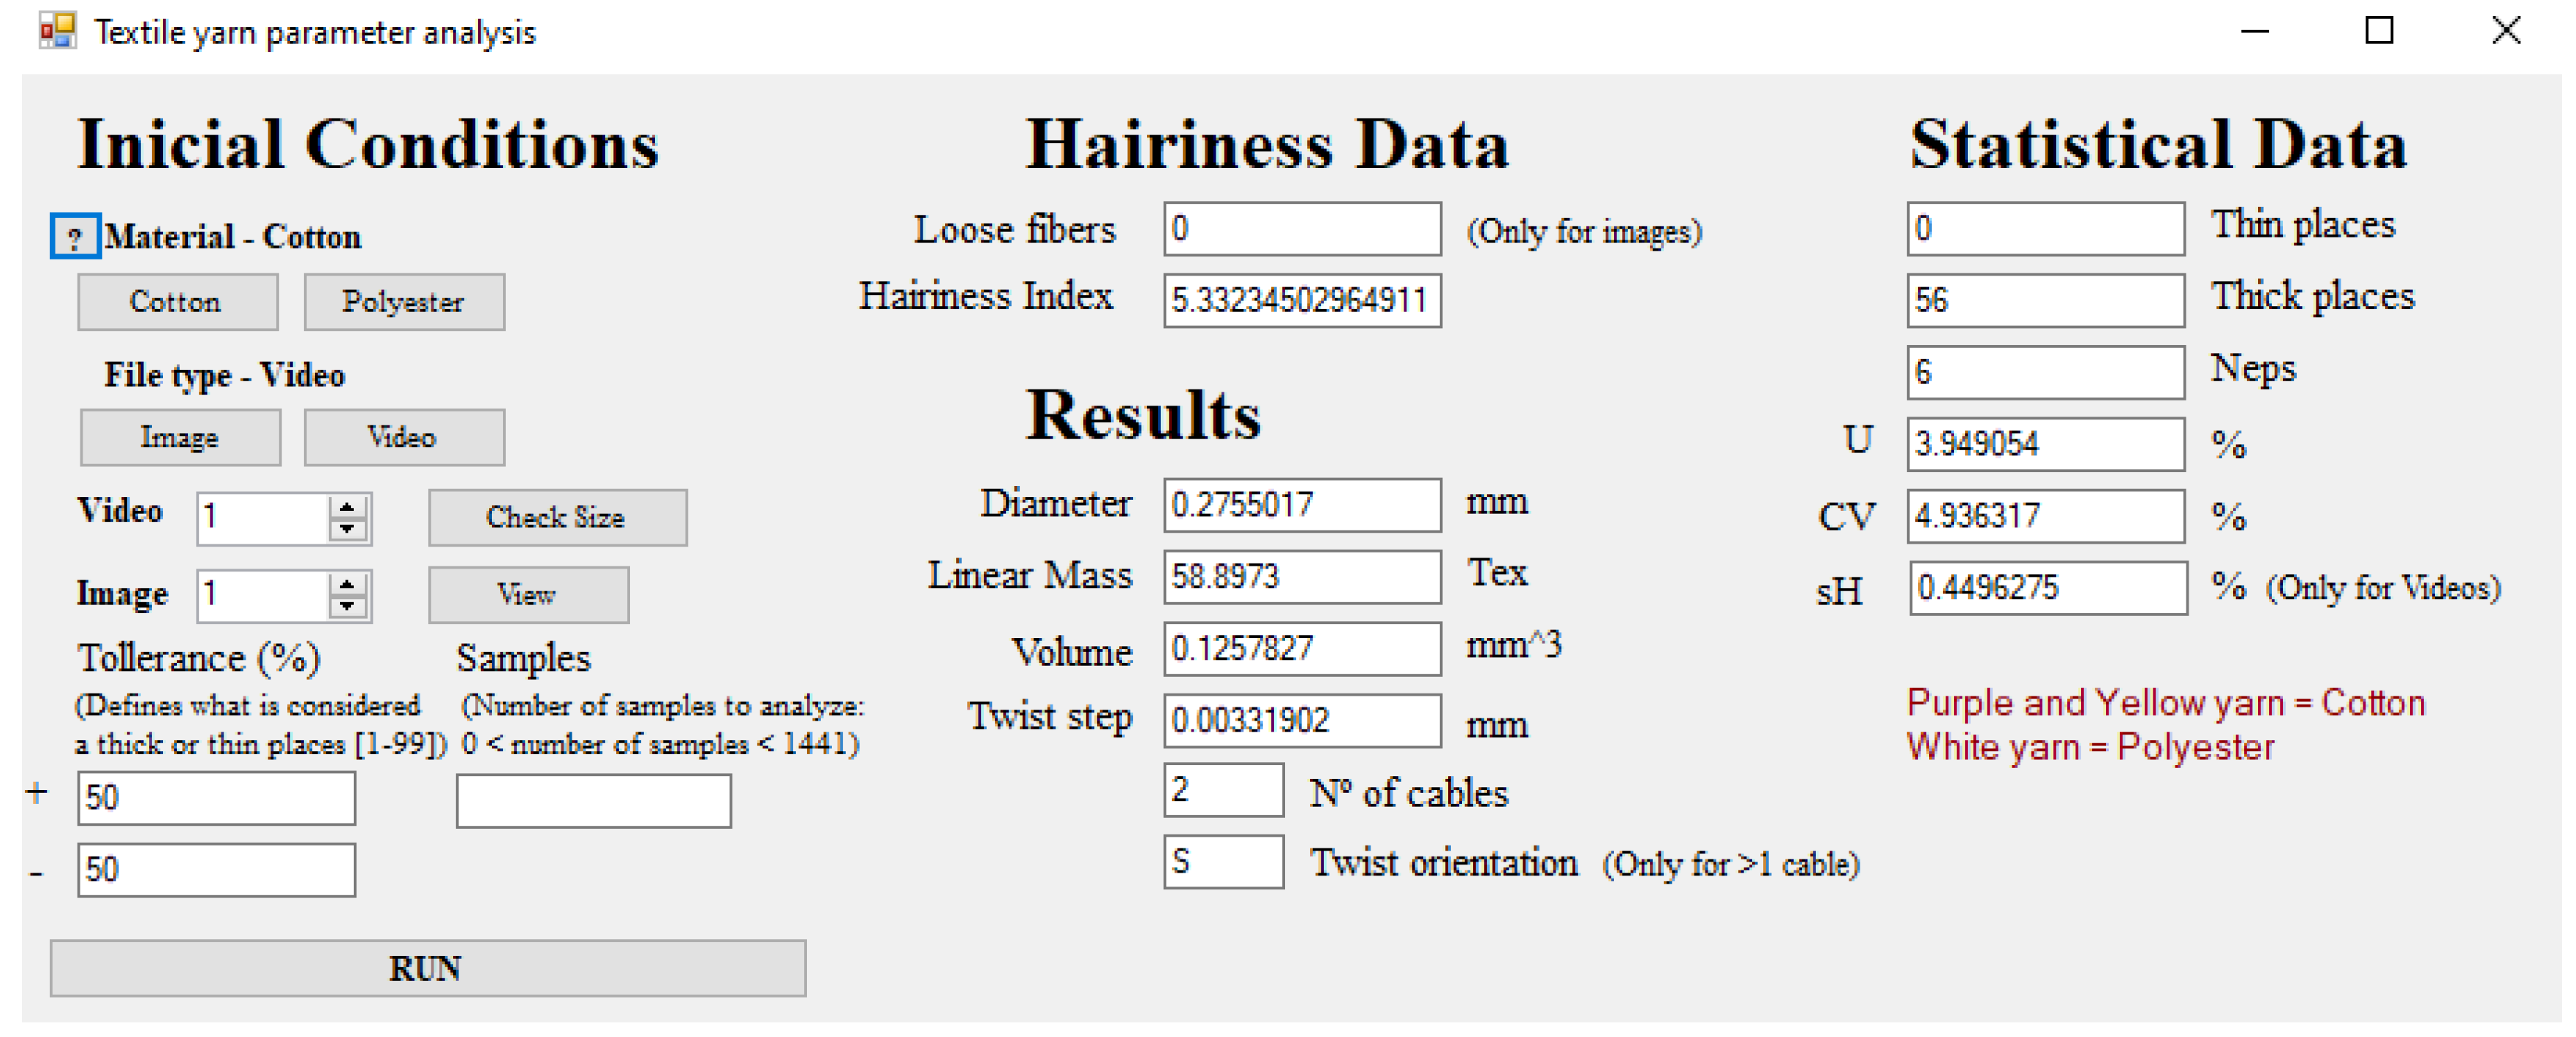
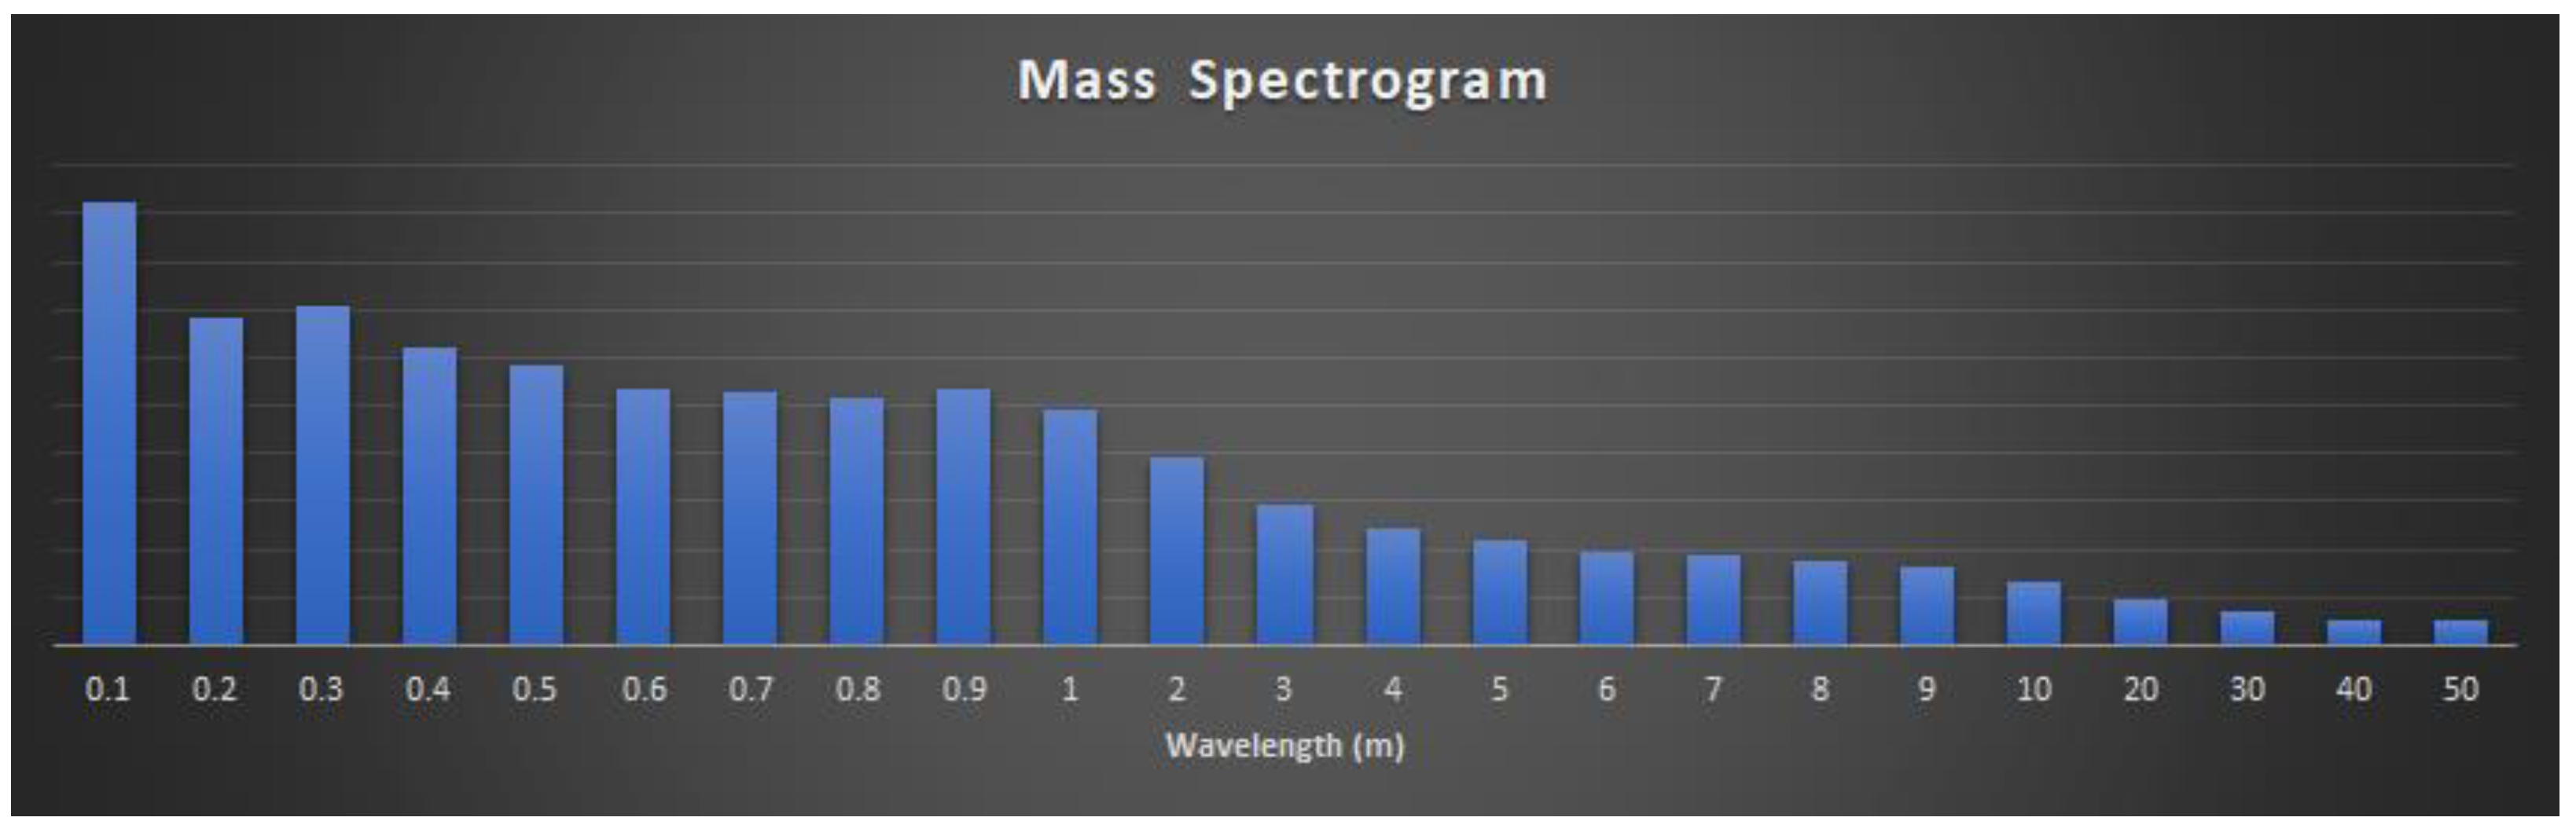
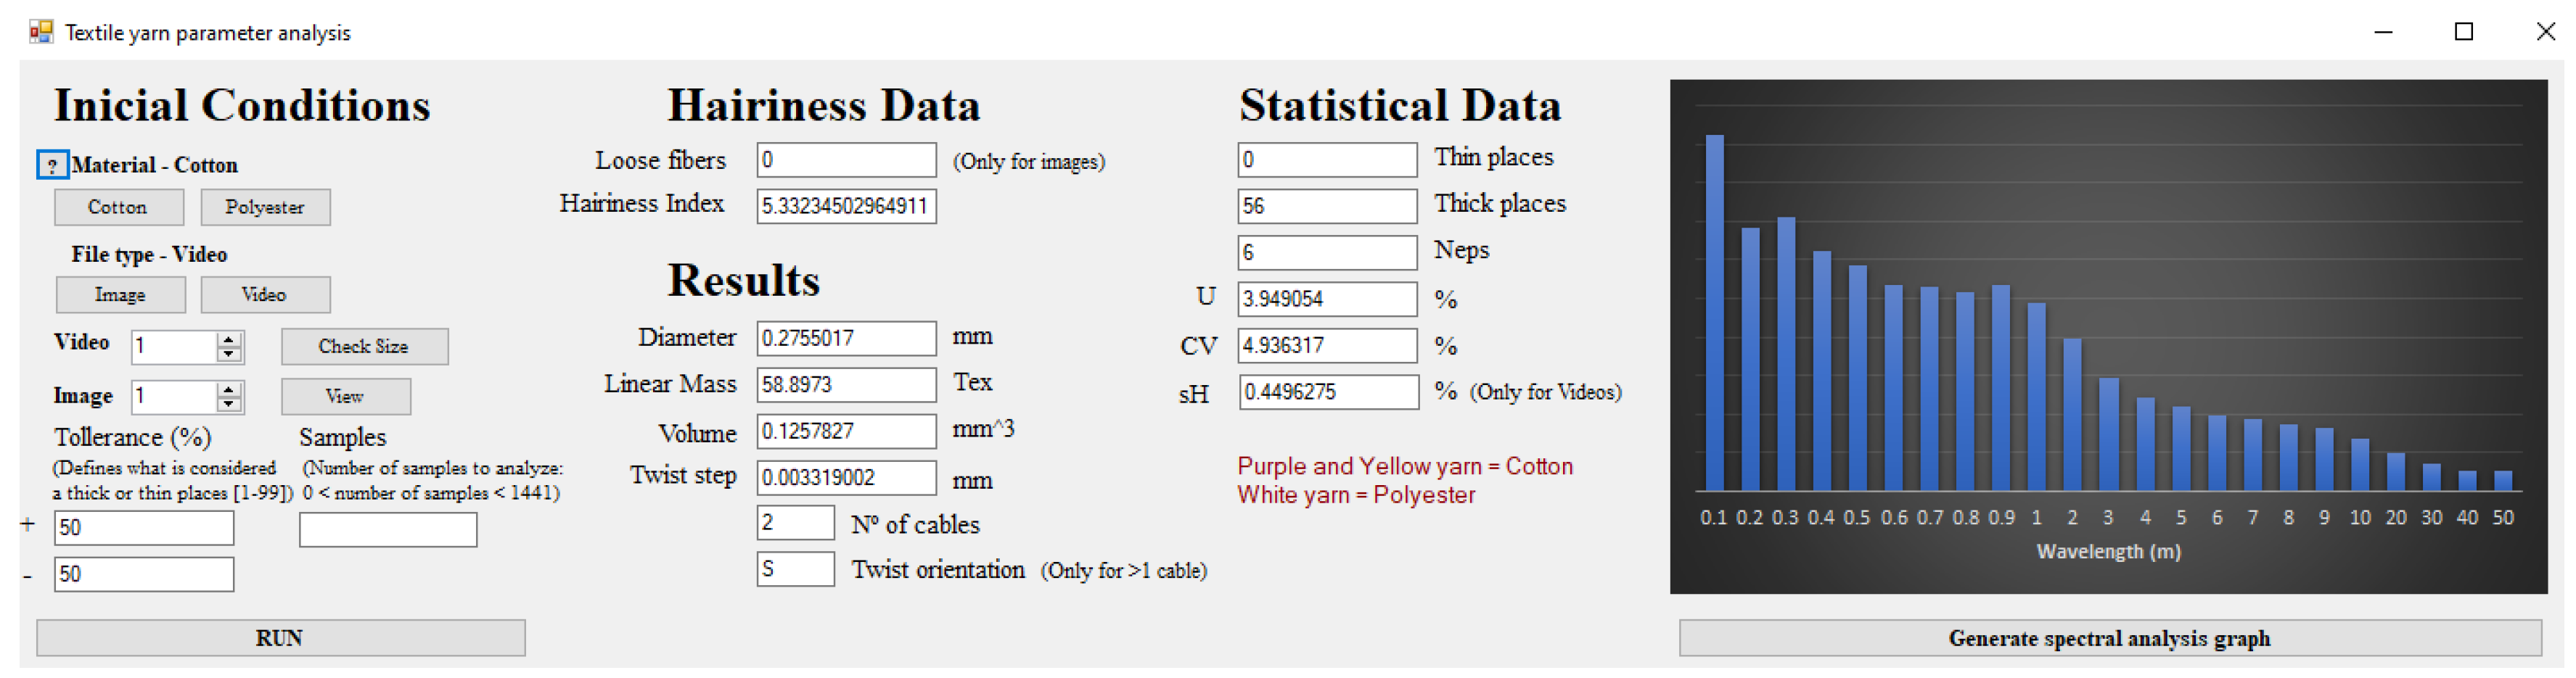
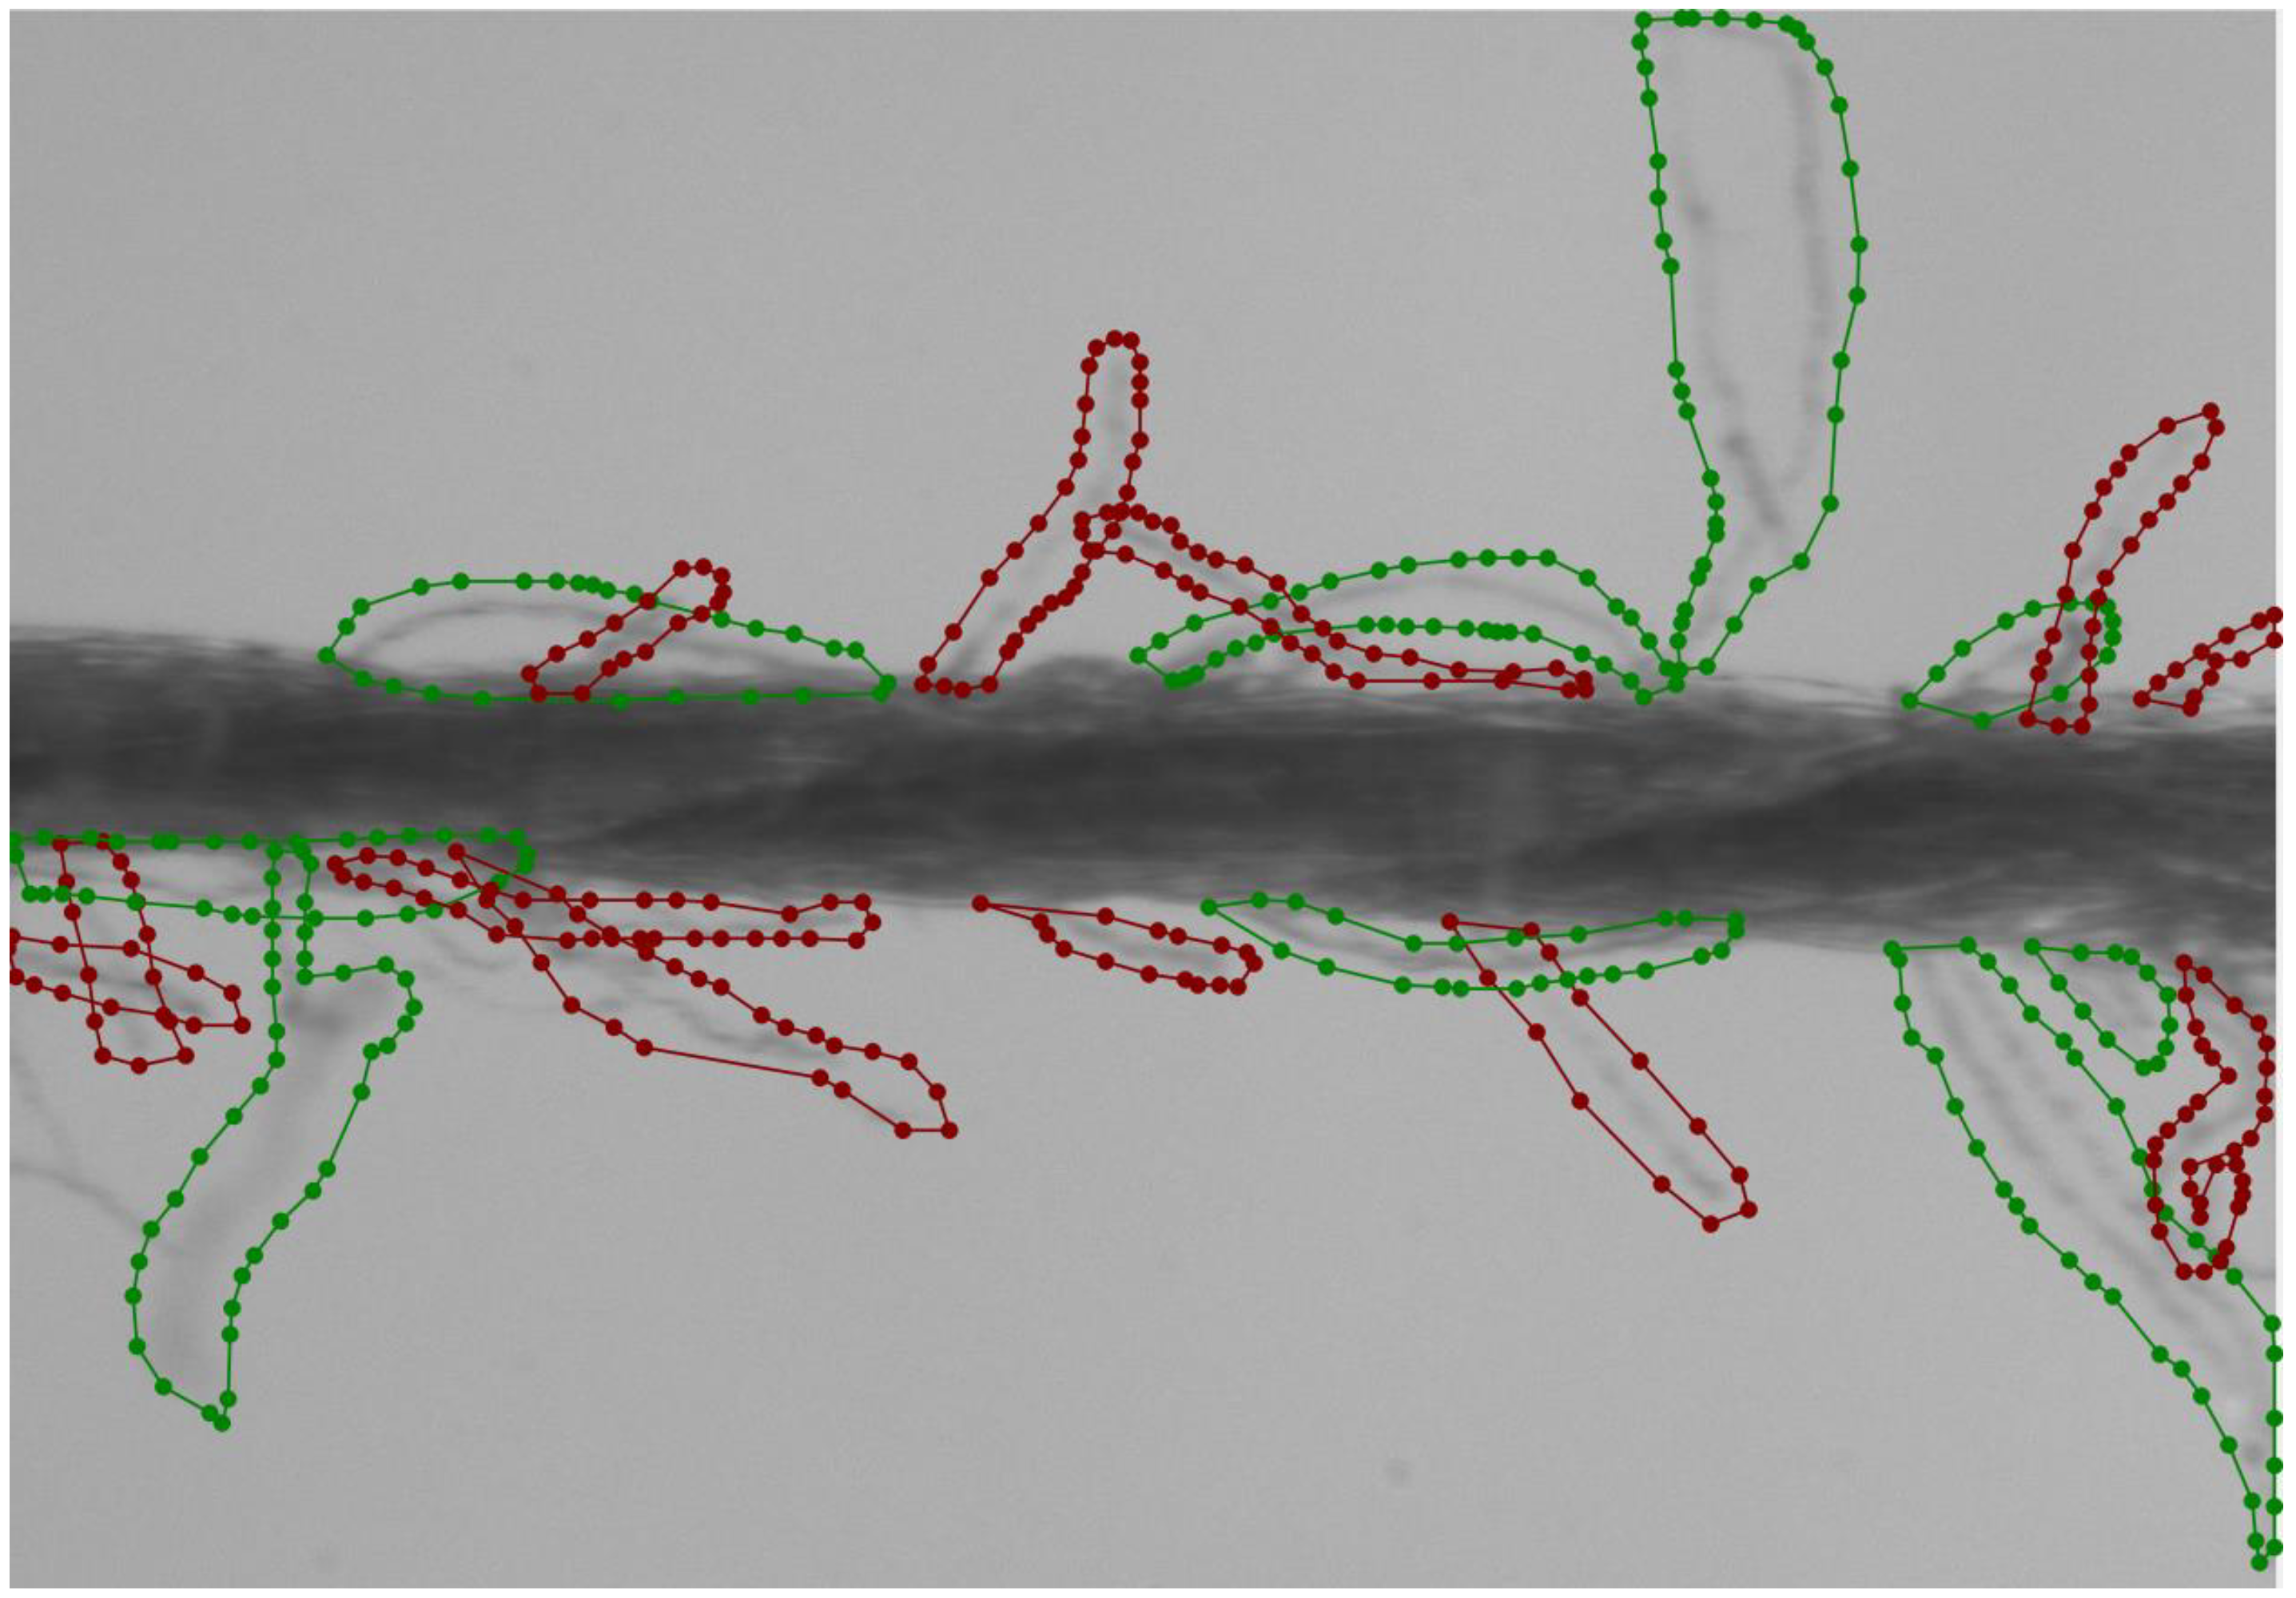