Article

Decentralized Energy Management System in Microgrid Considering Uncertainty and Demand Response

by
Sane Lei Lei Wynn
1,
Terapong Boonraksa
2,
Promphak Boonraksa
3,
Watcharakorn Pinthurat
4 and
Boonruang Marungsri
1,*
1
School of Electrical Engineering, Suranaree University of Technology, Nakhon Ratchasima 30000, Thailand
2
School of Electrical Engineering, Rajamangala University of Technology Rattanakosin, Nakhon Pathom 73170, Thailand
3
School of Electrical Engineering, Faculty of Engineering and Architecture, Rajamangala University of Technology Suvarnabhumi, Nonthaburi 11000, Thailand
4
School of Electrical Engineering and Telecommunications, The University of New South Wales, Sydney 2052, Australia
*
Author to whom correspondence should be addressed.
Electronics 2023, 12(1), 237; https://doi.org/10.3390/electronics12010237
Submission received: 25 November 2022 / Revised: 28 December 2022 / Accepted: 29 December 2022 / Published: 3 January 2023
(This article belongs to the Special Issue New Trends for Green Energy in Power Conversion System)

Abstract

:
Smart energy management and control systems can improve the efficient use of electricity and maintain the balance between supply and demand. This paper proposes the modeling of a decentralized energy management system (EMS) to reduce system operation costs under renewable generation and load uncertainties. There are three stages of the proposed strategy. First, this paper applies an autoregressive moving average (ARMA) model for forecasting PV and wind generations as well as power demand. Second, an optimal generation scheduling process is designed to minimize system operating costs. The well-known algorithm of particle swarm optimization (PSO) is applied to provide optimal generation scheduling among PV and WT generation systems, fuel-based generation units, and the required power from the main grid. Third, a demand response (DR) program is introduced to shift flexible load in the microgrid system to achieve an active management system. Simulation results demonstrate the performance of the proposed method using forecast data for hourly PV and WT generations and a load profile. The simulation results show that the optimal generation scheduling can minimize the operating cost under the worst-case uncertainty. The load-shifting demand response reduced peak load by 4.3% and filled the valley load by 5% in the microgrid system. The proposed optimal scheduling system provides the minimum total operation cost with a load-shifting demand response framework.

1. Introduction

Over the last decades, renewable energy resources (RESs) have been encouraged to reduce dependency on fuel-based generation and greenhouse gas (GHG) emissions [1,2,3]. Renewable energy resources are one of the solutions to the above issues and an option for future clean energy. Higher renewable penetration, such as wind and solar, in the power grid can significantly raise uncertainties in the systems and has adverse effects on the proper operation of the power systems. As a result, efficient forecasting of the RES generation has become necessary for the power systems with high RES penetration, and it has the potential to improve power efficiency and system reliability. Some critical aspects of power generation forecasting included high RES penetration rates, power supply and demand imbalances, and optimal system operation. In recent years, time-series statistical models have been the most commonly applied forecasting technique [4]. The mathematical formulation of the time-series method was developed and can be applied to observe near-future predictions based on available historical data [5]. Moreover, an accurate demand forecasting can help the utility with decisions in various aspects, such as purchasing and generating electricity, load switching, and improving system infrastructure. In addition, demand variation was a significant issue for system management in electricity markets. This variation created the distribution network’s vulnerability and had an economic effect on the electricity spot price, at which decisions were made based on the existing plants’ expanded investment. Thus, demand forecasting has also become an essential aspect of the emergence of competitive electricity markets [6,7].
The distribution network is being deregulated and changed to open a new window of a competitive electricity market by increasing system efficiencies, reducing operation costs, and minimizing utilities’ financial losses. The restructured design has been mainly partitioned into two sectors: the generation side and the load aggregator or end-user side [8]. While the conventional system has generated energy to meet total power demand requirements every time-step, the restructured system becomes more effective way for supply–demand balancing that keeps power fluctuation within the threshold level. Moreover, balancing in the conventional system cannot be achieved quickly due to several limitations, such as unexpected production outages, power transferring system failures, and unpredictable system load changing [9]. For this reason, the demand response (DR) has been changed for a sustainable electricity service system by changing consumers’ behavior which is responding to the real-time price tariffs program or the incentives offered by the program and also responding to the jeopardy of the system’s reliability circumstances [10]. Therefore, the new power system infrastructure with a demand response (DR) strategy was the more effective and lower investment for reliable power system operation. DR programs did not need more capital investment for system updating for more production units and power transferring capacities [9]. With the high penetration of distributed generation resources into the system, the reliable design function of DR provided positive impacts for the whole system through level-up system security and economic benefit [11]. The DR program has participated as a role in the active distribution network. The DR also plays as a chance to mitigate the system fluctuations due to the ability of fast action to meet system balancing in the event of resource shortage. It offered adjustment to the demand side rather than power procurement from the generation side. In this way, the electric consumer can fully participate in the active distribution network [12].
The microgrid EMS monitors and controls the operational status of optimal power allocation from the various energy resources to the controllable and critical loads. In advanced restructured design, controllable loads can be dispatched to ensure system reliability and stability. The EMS was designed to collect load profiles and forecast the energy resource information, consumer preference, policy and electricity market price for optimal power flow (OPF), energy price, load dispatching and generation scheduling [13]. Decentralized EMS is the autonomous intelligence controller considering several local controllers. Because local controllers only need to make decisions and communicate locally, communication congestion and computational burden are much lower than that in a centralized EMS system [14]. The uncertainties of RES and demand can cause difficulty managing optimal generation. All entities in distribution networks with microgrid clusters are interconnected systems and have different operational objectives and decision variables due to the impact of the local operating environment. Therefore, the centralized energy management system is no longer an option for the generation scheduling of the distribution networks with the MG cluster. The decentralized EMS has become a solution to tackle the microgrid operation [15]. In this scheme, local controllers must determine the optimal power output locally. Therefore, the decentralized EMS will significantly reduce the computational power requirement in the entire microgrid. Because local controllers have local authority, troubleshooting security issues could be difficult [14].
Generation scheduling is a common problem in feasible microgrid planning. It was usually solved by the optimization process. The optimal planning techniques can be applied to both renewable energy allocation and energy management systems. The energy management systems applied different optimization methods based on technical, environmental, and economic constraints and uncertainties [16]. In recent years, optimal planning techniques have become popular in the energy management systems in smart homes, smart buildings, and smart grids. Decision-making-based energy modeling has become a sustainable design for planning and controlling optimization issues [17]. Uncertainties of the RES generation exacerbated the balancing between generation and demand [2]. Therefore, it is required to schedule generation units in the microgrid planning stage to closely match with the forecasted demand profile between generation and demand. The problem of optimal appliance scheduling with the DR program and the uncertainty of rooftop PV were analyzed in [18]. In this work, the uncertainty of solar radiation was tackled with the Weibull probability density function (PDF). This system can reduce computation time with high computational accuracy. The result showed that the proposed model provided an economically feasible microgrid operation under solar uncertainty. The work in [19] presented the optimization of hybrid DG while taking demand and supply uncertainties into account. The model of demand variation was investigated by the probability density function. Controllable and uncontrollable DG mitigated the uncertainty of the supply side. The results demonstrated that the optimal combination of hybrid DG captured the demand uncertainty in the reconfigurable microgrid. The bi-level algorithm for decentralized energy management systems in microgrids was presented in [2]. The first step predicted generation set-points, while the second step adjusted generation outputs based on various scenarios. The simulation results provided the stable operation of networked and islanded modes under the stochastic nature of DG’s output power. The work in [20] put forward the ideas of a decentralized framework with DR from the point of view of a system operator who wanted to balance supply and demand and changed generation curves to match changes in demand. The results showed that the proposed algorithm minimized the suppliers’ operation cost, the consumers’ discomfort, and the transmission system’s congestion. The work in [21] was to demonstrate the active disturbance rejection control (ADRC) paradigm to ensure the effect of exogenous disturbances on the PV generation uncertainty. In this work, the performance of modified ADRC was compared with linear ADRC (LADRC), conventional ADRC, and improved ADRC (IADRC). The results showed that the proposed model provided high performance in the tracking system to capture PV uncertainty. The risk-seeking stochastic optimization was proposed to coordinate electricity markets with wind generation in [22]. The results showed that the procurer profit maximization can be provided by adjusting the parameters of the risk-seeking stochastic optimization model. A two-stage optimization model was implemented for profit maximization scenarios, and a probabilistic statistical perspective was used to capture wind power uncertainty. The risk-averse two-stage stochastic model was proposed for short-term schedules for the pool electricity market in [23]. The results showed that contracts with withdrawal penalty (CWP) and contracts with option (CWO) were the new options that provided retailers profit maximization in the pool electricity market. The electricity tariffs and demand uncertainties were considered to show the effect on the retailer profits/risk and retail price. The previous model applied a stochastic process that was embedded in the sophisticated decision-making model [15,20,24,25,26].
Although the stochastic model was applied in the operation and planning of the electrical power system, this model generated different scenarios to achieve optimal solutions and required a significant amount of computation time [27]. Moreover, the stochastic model is difficult to interface with the complex scenario-based forecasting models and the sophisticated decision-making model. The work in [28] proposed a decentralized multi-agent control scheme to manage the power sharing of the distribution network with RESs. However, the nature of RE resources uncertainty and the role of demand response were not considered in this work. The results presented that the proposed model provided a balanced active/reactive power sharing during stable/unstable demand events. The decentralized multi-agent robust optimal model with integrated demand response was presented in [29] for the electricity–gas–heat systems. The integrated demand response was used to handle the uncertainty of RESs. This work showed the effectiveness of the multi-agent decentralized robust optimal dispatching compared with the centralized robust optimal dispatching. The simulation results showed that the demand response market can handle the nature of RE resources uncertainty. The Benders decomposition technique is introduced for networked microgrid energy management in [30] to address the unbalanced condition. Probabilistic scenarios was generated to capture RE resources and demand uncertainty. The simulation results showed that the increased use of expensive generation resources constantly increased the operation cost. The proposed model provided a cost-effective interaction of operators and distributors. Nowadays, the use of electricity is increasing, and the electricity is generated from various renewable sources such as wind, hydro and solar power. Therefore, it is very important to plan and manage the power generation for effectively supplying power systems. This paper focuses on managing power generation systems to reduce the peak load of the microgrid system using an optimization method.
Three options are available to handle uncertainty problems: generating more power or buying more energy from the main grid, using energy storage systems, and participating in a demand response program [31]. Due to economic operation and environmental concerns, the first conventional solution has the drawback of power reserving [32]. The previous work did not highlight common possible uncertainties in the power network, especially the intermittent nature of wind and solar generations and demand variation. The concept of DR cooperation in the microgrid energy management system is to reduce operating costs and to mitigate the intermittent nature of RE resources. To recover a certain amount of uncertainty, energy management from the generation side is an option to maintain system security. To address the shortcomings, this article proposes a decentralized energy management model by considering RES uncertainty and demand response. The proposed EMS system is a controllable structure to manage the generation source from the upstream. From this regard, this work is to investigate the cost-effective active distribution network by introducing the local energy management system with demand response.
The major contributions of this article are summarized as follows:
  • The time-series forecasting ARMA model is introduced to predict wind and PV generations as well as load demand for the proposed decentralized energy management system, which can reduce the computational burden.
  • The particle swarm optimization (PSO) technique is applied to implement the optimal generation scheduling based on the forecast data of wind, PV, and load demand to reduce the operation costs of the microgrid system.
  • The proposed method incorporates the demand response (DR) which does not require probability constraint parameters to tackle the deviation from the forecasting data.
The rest of the paper is organized as follows. Section 2 presents the proposed methodology of the paper. In this section, the forecast technique, well-known particle swarm optimization technique, and problem formulation are introduced and discussed. Section 3 presents verification simulation results and discussions. Finally, Section 4 concludes the paper.

2. Methodology

The proposed strategy consists of three stages. In the first stage, hourly average energy demand and hourly average WT and PV power generations are predicted by using an ARMA (2,1) for a particular month. This work used two-year historical data to forecast the present-time RE generation and demand profile. The second step is scheduling available generation resources with the system’s constraints, such as power balance constraint, generation capacities, and spinning reserves. This step requires the information setup necessary for the system, such as forecasting RE and power demand, electricity price, and distributed generation characteristics. A particle swarm optimization algorithm was used for optimal scheduling to minimize system operating costs. All available generation resources are scheduled optimally by the PSO optimizer according to actual and forecast data for a particular month. The final step is generating a demand response program from optimally scheduled results. If the generation capacities are less than the power demand at a particular time, the required power demand is suggested to shift the valley period. Finally, the network operators provided the demand decision information to the demand side to respond to the load in a particular hour. The proposed framework is shown in Figure 1. The decentralized forecasting and optimization model are implemented using MATLAB 2021. The simulation is performed with an Intel(R) Core(TM) i7-6500U, 2.50 GHz CPU speed, and 8.00 GB RAM. A flowchart of the proposed decentralized energy management system is given in Figure 2.
In the next subsections, the forecasting technique used to predict WT and PV generations and load demand based on historical data is presented. Then, the problem formulation based on the particle swarm optimization technique is given and discussed.

2.1. Forecasting Technique

An ARMA model based on statistical and Box–Jenkins methods was adopted. The ARMA model is commonly applied to stationary time-series data as it is a superior tool to predict the future values of stationary time-series [33]. The Yule–Walker estimator was used to estimate the sample autocorrelation coefficient [34] which is expressed by,
x ¯ t = i = 1 m ϕ i x t i + j = 0 n θ j ω t j ,
where ϕ i is the i-th AR coefficient; x t i is the time series value; ω is the white noise with zero mean and constant variance; and θ j is the j-th MA coefficient.
A series of measurement data sets for the specific site is required to forecast the output of a RES generation using statistical methods. The selected site for obtaining the historical data is Nakhon Ratchasima Province (14.979900 latitudes, 102.097771 longitudes), Thailand. The historical wind speed, solar irradiation data, and load profile were taken from the selected site location [35,36,37]. The enormous amount in the applied data set can be reduced without losing information by employing statistical data treatment. Synthetic data for a typical year that represent the actual multi-year measured data statistics can be generated [38].
The ARMA model is a suitable prediction tool if the historical time-series is stationary. The stationary time-series have statistical properties such as all mean, variance and autocorrelations that are constant or meaningful over all time horizons. Therefore, a statistical forecasting technique in which the stationary time-series is changed by statistical transformations will be applied.
The stationary times-series provided an easy implementation process that gave the predicted results according to the historical data. Thus, the time-series sequence can provide a clue to the search process for the forecasting model [39].
For seasonally non-stationary data, the yearly data set is divided into the seasonal monthly segments. Daily non-stationary data are removed by subtracting the hourly mean value from the actual data set and dividing it by the standard deviation to reduce the data to a normal process with a mean of 0 and a variance of 1 [3,40]. The time-series of the particular month of the year is the standardized velocities for removing diurnal non-stationary and it can be denoted as
V * ( n , y ) = V n , y μ ( t ) σ ( t ) ,
with the period function as
μ ( t ) = i = 0 d · Y 1 V 24 i + 1 d · Y , 1 t 24 ,
σ ( t ) = [ i = 0 d · Y 1 ( V 24 i + 1 μ ( t ) ) 2 d · Y ] 1 2 , 1 t 24 ,
where V * ( n , y ) is the standardized hourly average wind speed; V n , y is the hourly average wind speed; μ ( t ) and σ ( t ) , respectively, are the sample mean and standard deviation of all transformed wind speeds in 24 h; d and Y are the number of days considering for a month and year, respectively.
Then, the statistic series is compared with the measured data series by mean absolute error (MAE) to show the performance index as given by
M A E = 1 n i = 1 n | X ¯ i X i | ,
where X i represents the forecast time-series values; X ¯ i represents the observed time series values and n is the total number of samples.

2.2. Optimal Generation Scheduling

In general, demand shifting and peak shaving that response from the demand side significantly impacted the whole system context under stringent operating conditions. The demand-shifting function removes the demand from peak time to an off-peak time interval to mitigate operation stress in the design and reduce energy costs for end-users. The system operator’s perspective is to minimize system operation costs by replacing more expensive energy production with cheaper production [41]. Metaheuristic is a powerful technique to search feasible solutions from the discrete large search space, while classical methods cannot find optimal points from a large search space. The metaheuristic is a robust optimization technique with high exploring and exploiting. The classical method cannot solve all types of the optimization problem, and it requires extensive computation time to obtain the optimum points [16]. Bio-inspired optimization is an emerging metaheuristic technique inspired by the nature of biological evolution. Swarm intelligence and evolutionary computing are two main types of bio-inspired optimization methods. Particle swarm optimization (PSO) is a popular swarm intelligence bio-inspired optimization method [17]. The PSO is a robust technique and can search the global optimum points with fast convergence speed [42]. The PSO method is an easy-to-understand optimization method with few parameters and efficient global best solutions. So, this method has been chosen by the several researchers.
In this section, optimal generation scheduling is implemented by employing the particle swarm optimization technique. The working principle of the particle swarm optimization is inspired by the behavior of swarm species that worked cooperatively and search their requirement in the search space. The local best experience ( P b e s t ) and global best experience ( G b e s t ) were used to search for the next movement to guarantee the best solution. c 1 and c 2 factors accelerate the best searching positions, and the random numbers are generated between w m i n and w m a x [43]. The velocity of the particle and the particle’s position are expressed by
V i , j k + 1 = ω V i , j k + c 1 r 1 ( P b e s t i , j k X i , j k ) + c 2 r 2 ( G b e s t i , j k X i , j k ) ,
X i , j k + 1 = X i , j k + V i , j k + 1 ,
where X i , j k is the position of particles i and j with iteration k; V i , j k is the velocity of particles i and j with iteration k; ω is the inertial factor; c 1 a r e c 2 are the acceleration factors; r 1 a r e r 2 are the random number [0, 1]; P b e s t is the best particle and G b e s t is the best global solution.

2.3. Proposed Objective Function

In this section, an energy management system is implemented with the optimal generation scheduling. The objective function of the optimization is the operation cost minimization with system constraints. The system constraints included power balance constraints, spinning reserves constraints, and generation capacities constraints. The spinning reserves protect the system from unexpected power outages and sudden load changes in this work. The system’s objective function includes the operation cost of the two-generation units, PV and wind generations, and required power from the main grid. The operation cost of the generation unit is taken from [31]. The power purchasing price from the main grid considered in this study is a time of use (TOU) from [44]. The operating costs are defined as follows: the purchase price of electricity from the grid is based on the Thai TOU electricity trading rate on-peak = 0.17 $/kWh and off-peak = 0.076 $/kWh. The PV and WT only have the operation and maintenance costs [24,45]. The operation and maintenance costs of PV and WT are 0.1095 $/kWh [24]. Therefore, the purpose of cost reduction is manage the DGs during on-peak periods where the operating costs are high. The PSO technique is used for optimizing the arrangement of DGs to generate the energy at peak load times. The optimization problem formulations of the DR program are defined by
Min C o p e r a t i o n = t = 1 T P w i n d t λ w i n d + P P V t λ P V + P g r i d t λ g r i d + [ a P g 2 + b P g ] ,
where C o p e r a t i o n is the total operation of the system; P P V t , P w i n d t , P g r i d t and P g t are the power delivered from the PV, wind, grid and the generator at time t, respectively; a , b are the cost coefficients of DG units. λ w i n d   and   λ P V represent the coefficient of the operation and maintenance cost of wind and PV. λ g r i d represents the prices of operation costs.
The proposed objective function of the optimization problem is subject to the following constraints.
Power balance constraint:
t = 1 T P w i n d t + P P V t + P g r i d t + P D G t = P d t ,
where P w i n d t   and   P P V t , respectively, are the active power of wind and PV units at time t; P g r i d t is the power delivered from the main grid at time t; P D G t is the active power of fuel-based DG unit at time t and P d t is the total power from the demand side at time t.
Spinning reserves constraint:
t = 1 T P G t P d t + P L ,
where P d t represents the total power from the demand side at time t; P G t and P L are the total generation capacity of the system and the line losses at time t, respectively.
Generation capacities constraints:
P P V m i n P P V t P P V m a x ;
P w i n d m i n P w i n d t P w i n d m a x ;
P D G m i n P D G t P D G m a x ;
P g r i d m i n P g r i d t P g r i d m a x .

3. Results and Discussion

In this section, the microgrid test system used for verifying the effectiveness of the proposed strategy is introduced. Then, the output powers of the wind, PV, and load for the demand forecasting module are given. Finally, simulation results obtained from the proposed strategy are provided and discussed.

3.1. Test System

The test system that is used for verification of the proposed strategy is illustrated in Figure 3. As seen in the figure, there are two DG units connected to Buses 22 and 28, respectively. All information of the test system can be found in [46]. The characteristics of the cost function of the two DG units are given in Table 1. In addition, there is one wind turbine unit and one PV source connected at Buses 15 and 12, respectively. The microgrid system is connected to the main grid at Bus 1.

3.2. Forecasting Output Powers of Average Hourly Wind, PV and Load

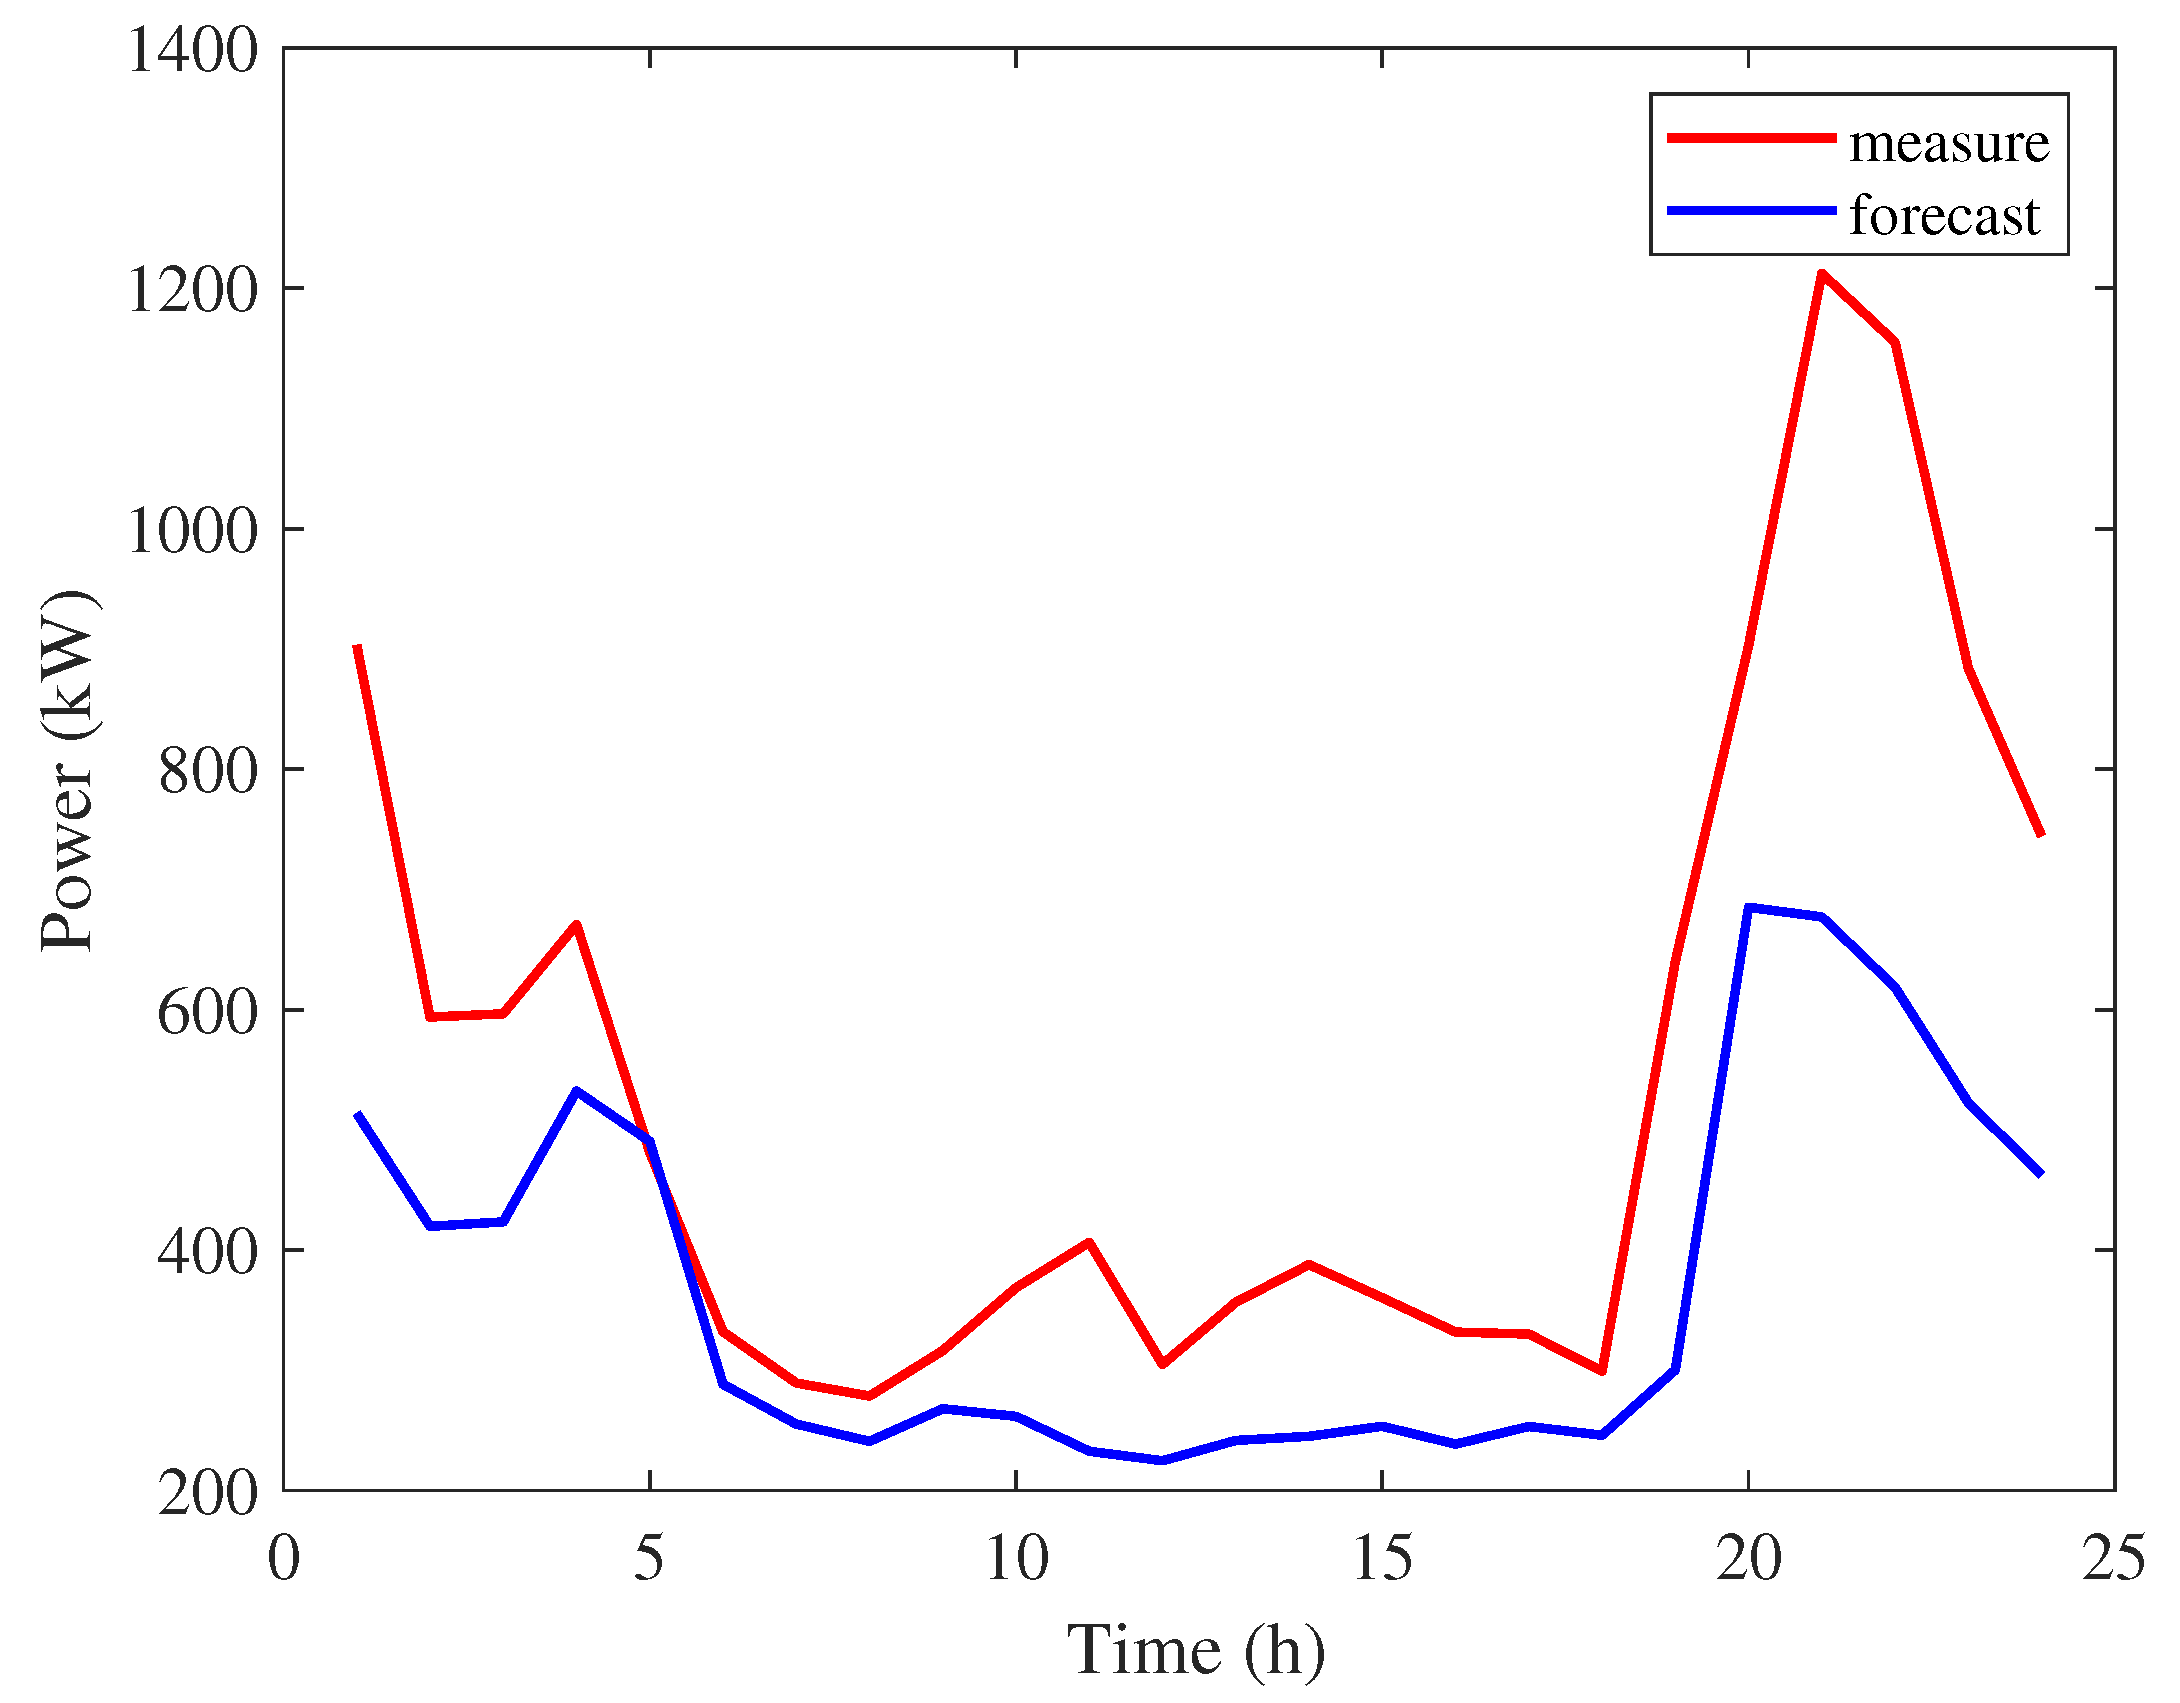
ARMA (2,1) is implemented in the process of time-series analysis for PV and demand forecasting. The technique applied two-year hourly wind speed data of a particular month. ARMA (3,1) is applied for forecasting wind speed. The historical data set of the seasonally selected data set is used for future average hourly prediction series. Figure 4, Figure 5 and Figure 6 show the simulation results obtained based on average solar irradiance, wind speed, and load profile, respectively. Renewable energy has a capacity limit that changes with time due to environmental disturbances [47]. The irradiation, temperature, and unexpected weather condition have a considerable deviation effect on the efficiency and power generation of the PV system [21,48]. The nature of time-varying is due to exogenous disturbance, which will affect power generation, and demand. This limitation is known as uncertainty [32,47]. When the system operates with high penetration of RE resources, this system is required to ensure the balance of generation and demand [49]. In this work, it was assumed that the error percentage is the percentage of uncertainty. In generation forecasting, the forecast (MAE) errors of WT and PV were 11.43% and 10.45%, respectively, while in load predicting, the percentage (MAE) error of the peak day was 17.71%. In this paper, it is assumed that the error percentage obtained here is the percentage of uncertainty in the microgrid system.

3.3. Generation Scheduling and Demand Response Program

This section provides simulation results of the optimal generation scheduling and load-shifting demand response program. The effectiveness of the proposed strategy is evaluated in three cases as follows.
  • Case I: Cost minimization of the microgrid system with forecast PV, wind, and load demand data without considering uncertainty.
  • Case II: Cost minimization of the microgrid system considering uncertainty, the uncertainty of PV 10.45%, the wind of 11.43%, and the load demand of 17.71%.
  • Case III: Cost minimization of the microgrid system for the day-ahead forecast PV and wind uncertainty (PV of 10.45% and wind of 11.43%) as well as the actual load demand requirement.
It is assumed that the microgrid system participates in the DR program in all cases. The amount of maximum power that can be exchanged by the main grid is 300 kW.
The load shifting changed the required amount of load from peak-demand time to off-peak time to reshape the load profile. In the case studies, the two distributed generators (DG1 and DG2) are working as the dispatchable generation while the PV and WT units are non-dispatchable generations.
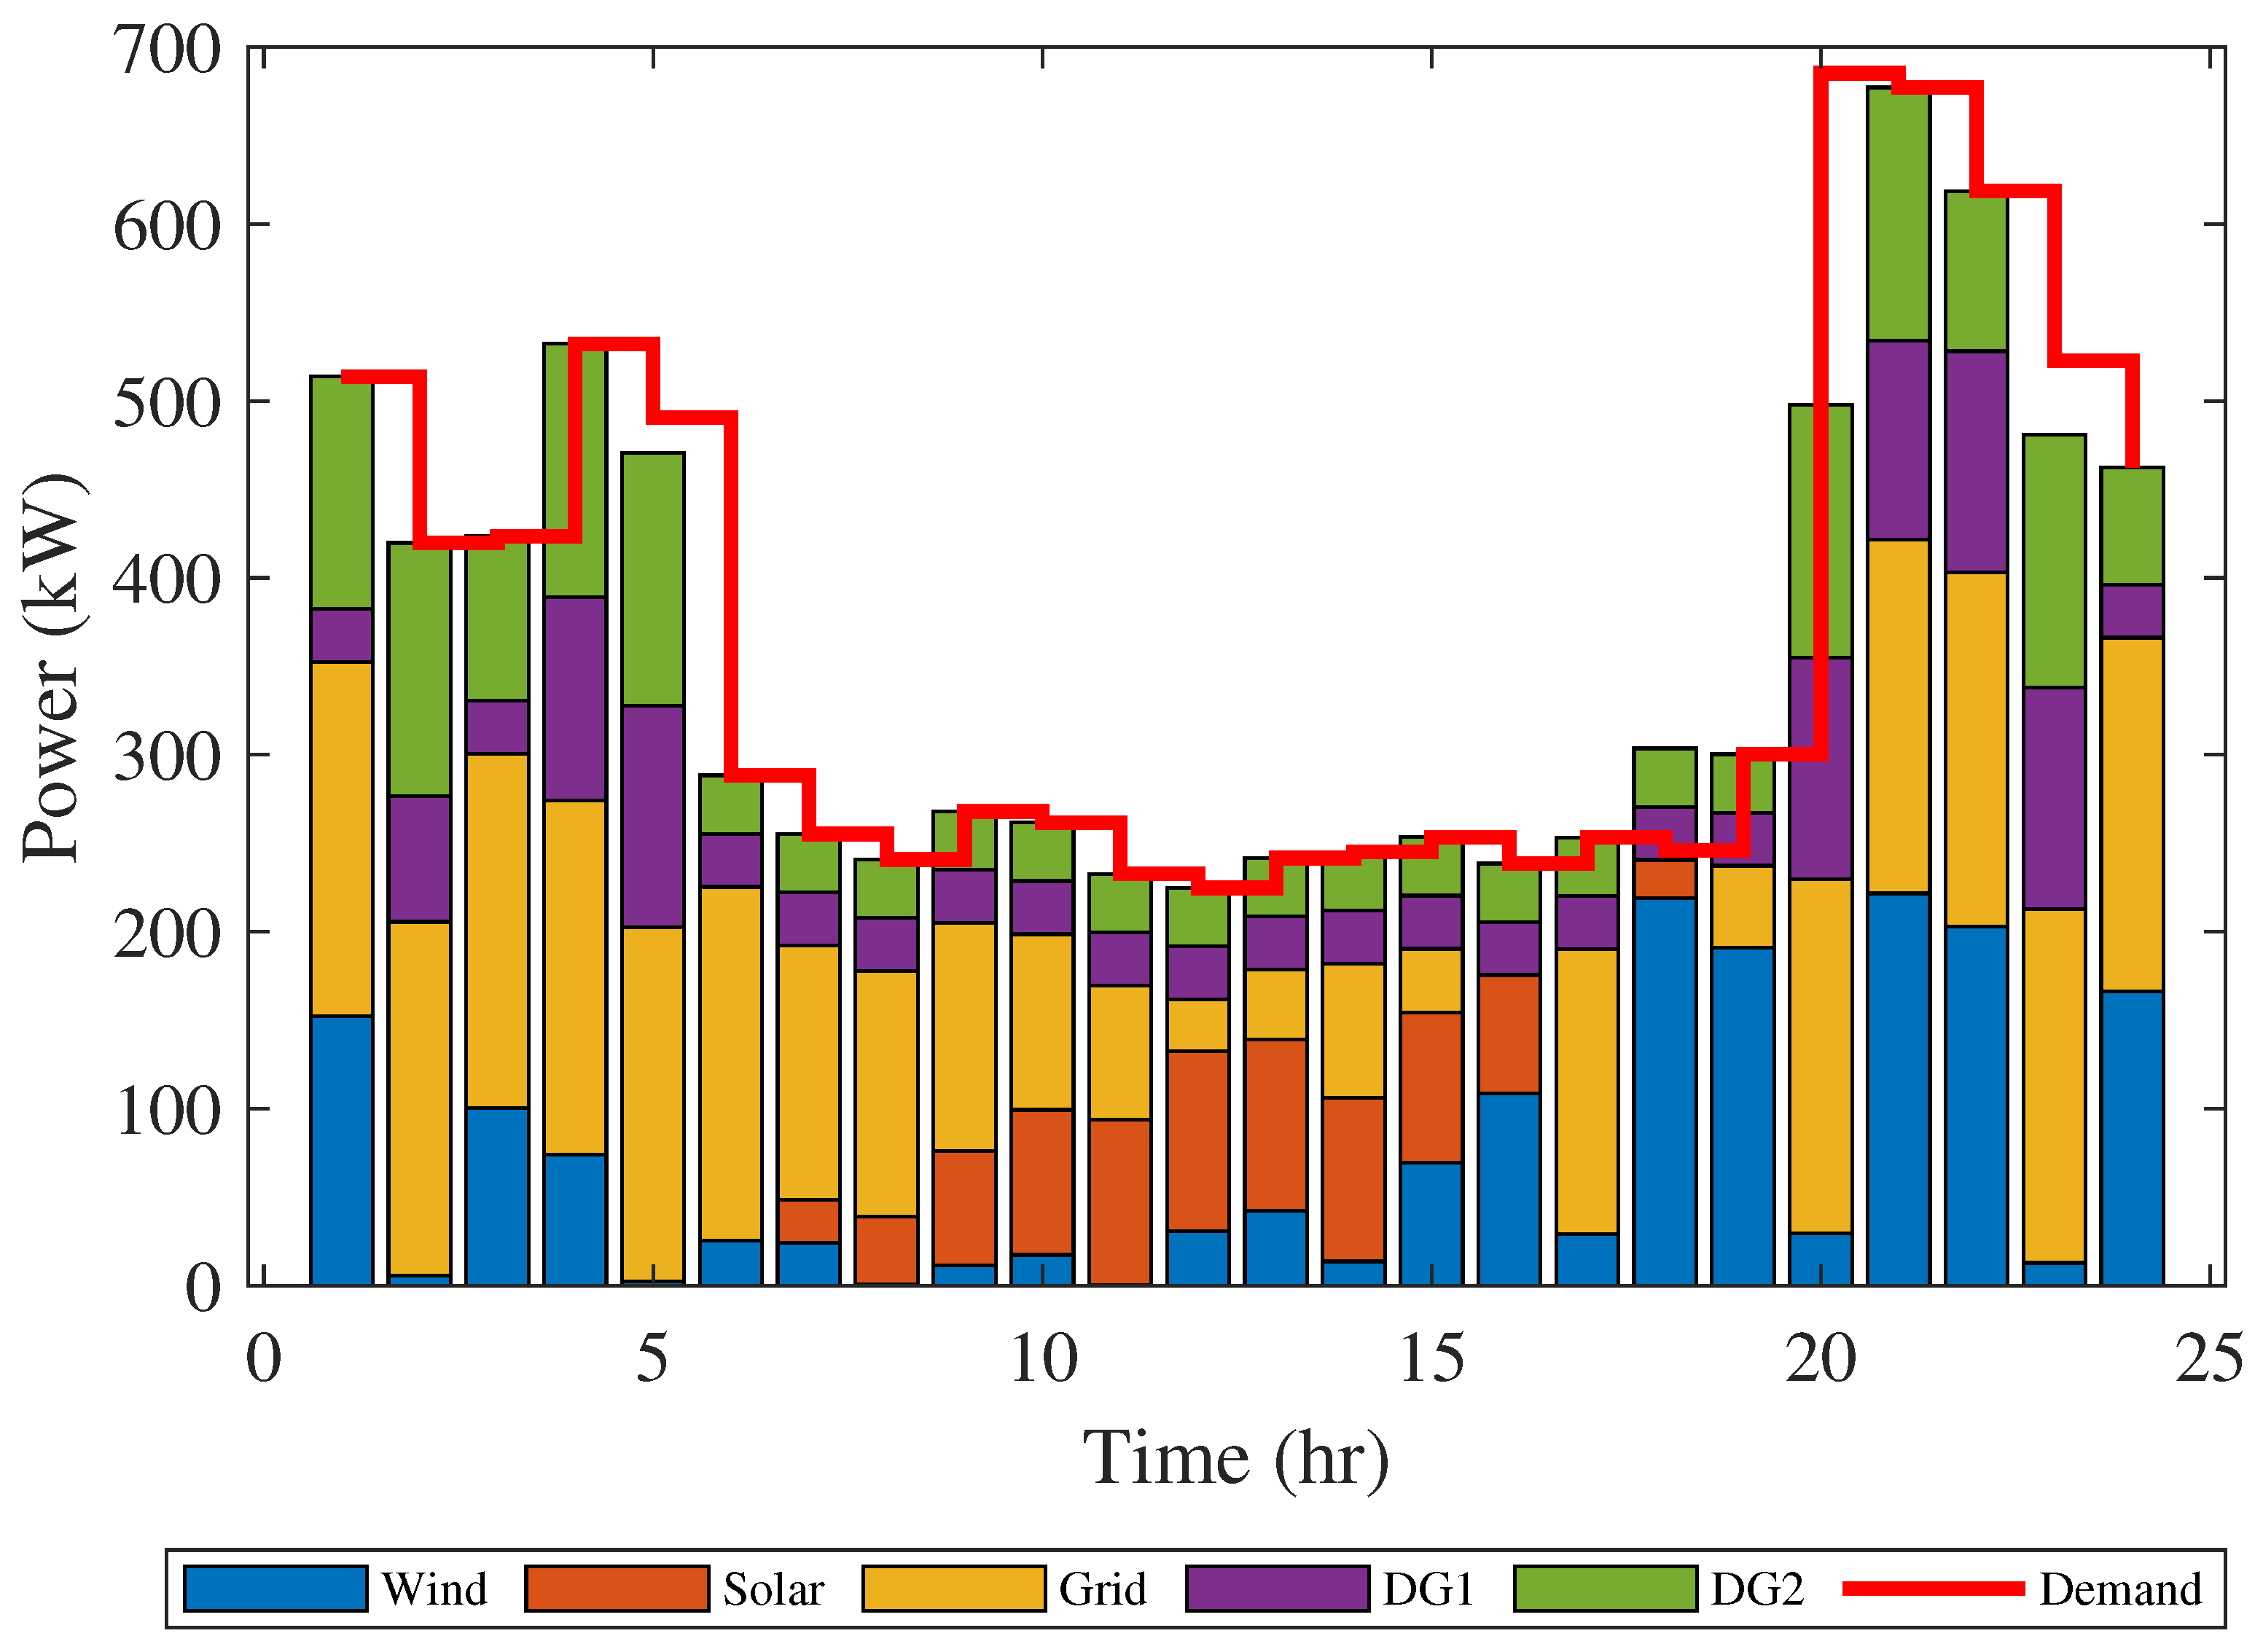
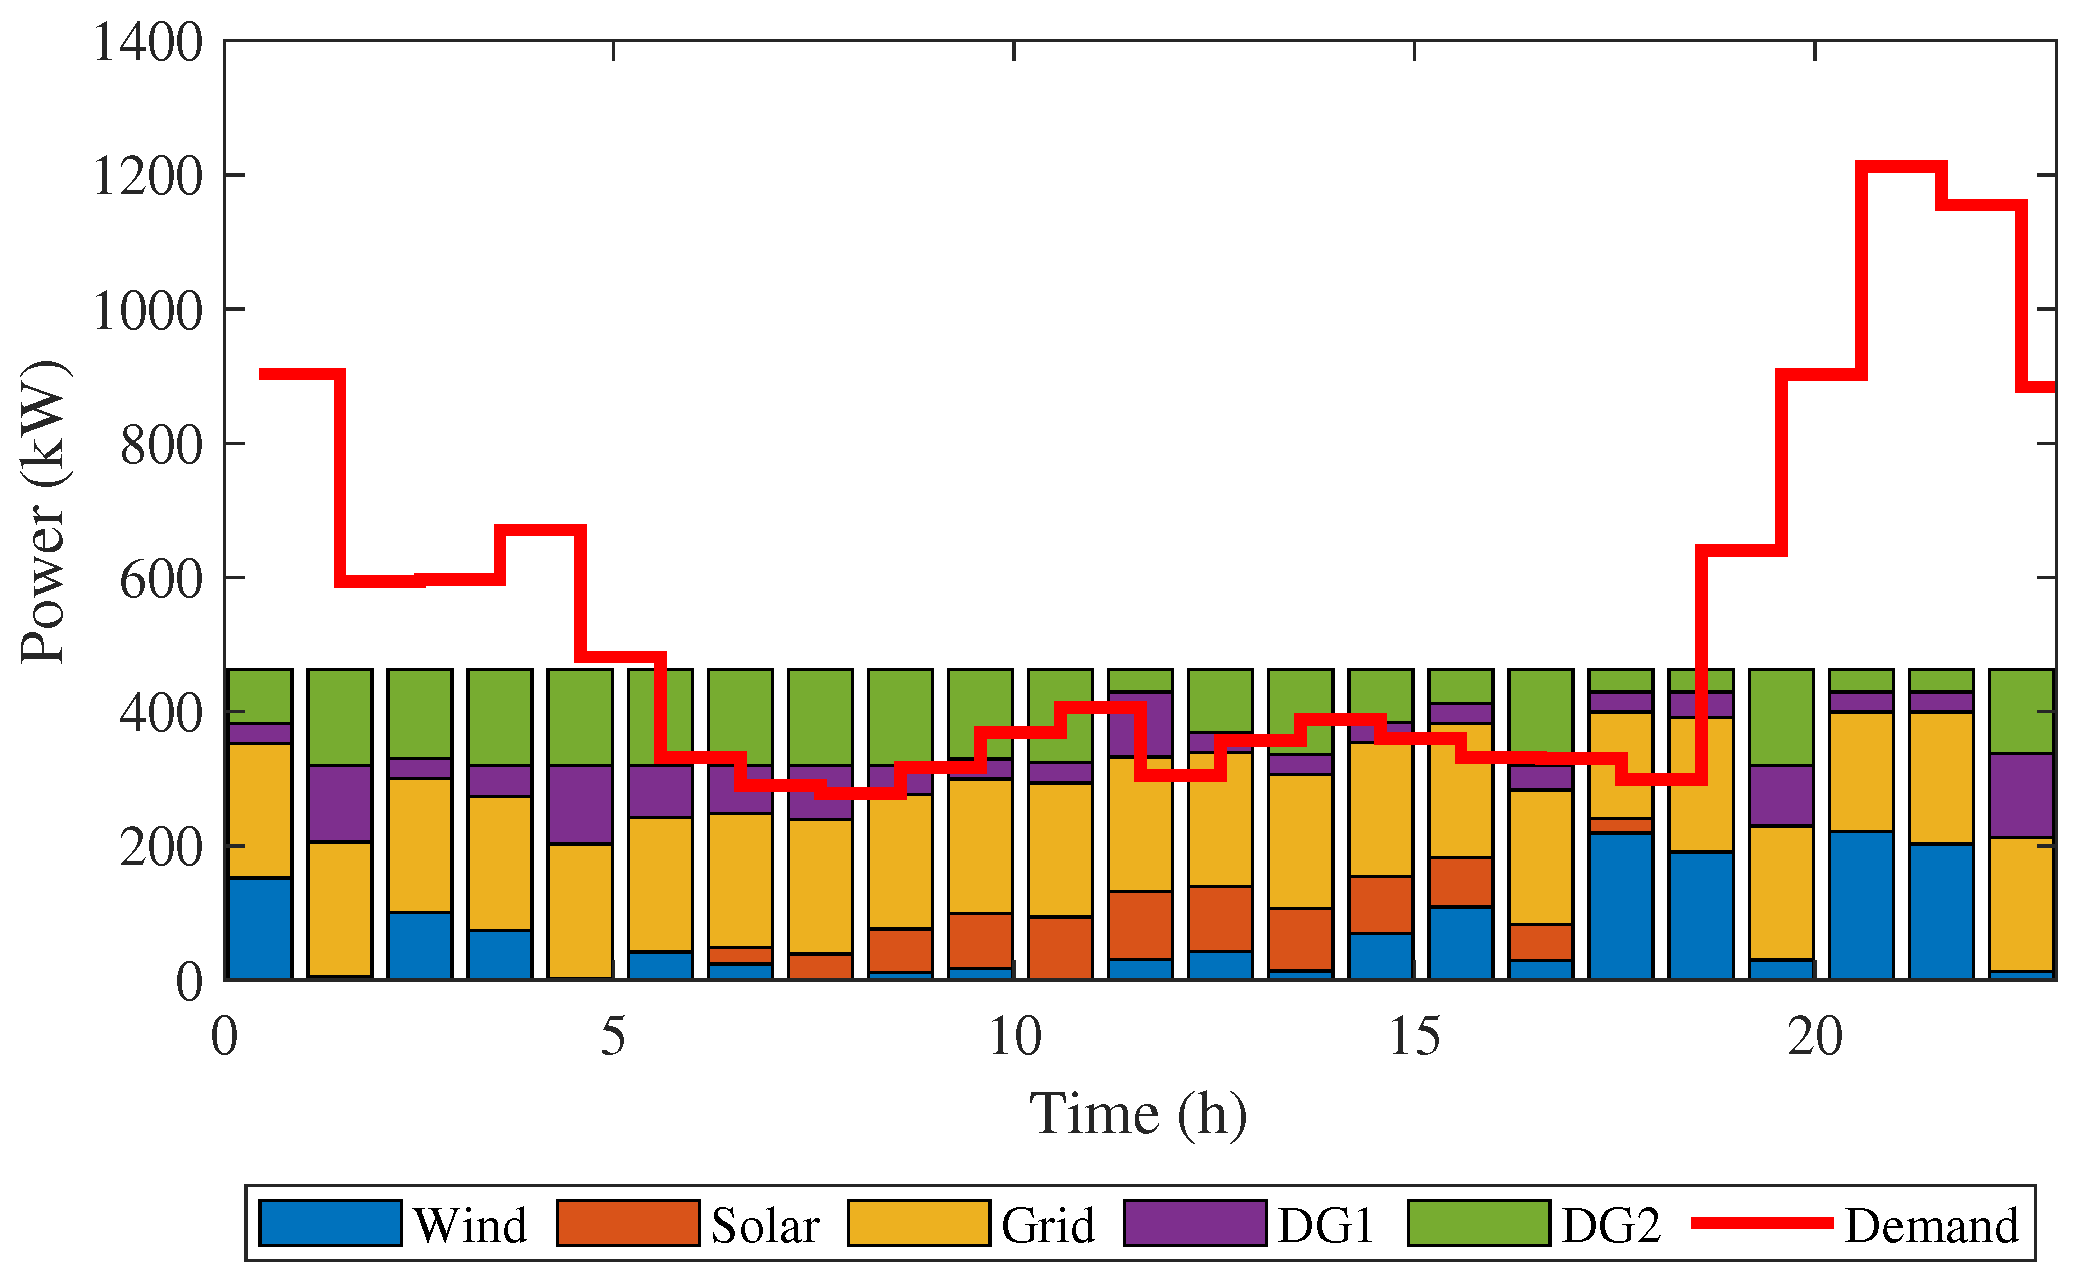
In Case I, when the PV and wind generated maximum power during the daytime, the two DG units and the grid provided less power, as seen in Figure 6. All generation sources are not able to provide the required demand at peak days. Hence, the DR program will be applied to solve the power requirements. The option of the proposed strategy is to provide priority to the DG units while maximizing RES generations. The available resources such as DG units and the main grid are planned to optimally schedule in the microgrid system. Figure 6, Figure 7 and Figure 8 show the simulation results of the optimal generation scheduling with actual and forecast data.
The objective function and system constraints are the standard parameters used in the microgrid scheduling process to achieve cost–benefit under a RES uncertain environment. According to Figure 7 and Figure 8, optimal generation scheduling with a demand response program can reduce the peak load on peak days at 19–24 h and 1–5 h. Load shifting occurred in the off-peak period when the total loads are less than the generation capacity at 6–18 h. Figure 8 and Figure 9 compare the load demand and the available generation capacity of Case II and Case III. The capacity difference is high when the PV and wind had not provided sufficient generation. Moreover, in Cases II and III, as the actual demand is more than the forecast demand, the power requirement is more dependent on the local dispatchable generation units and the main grid.
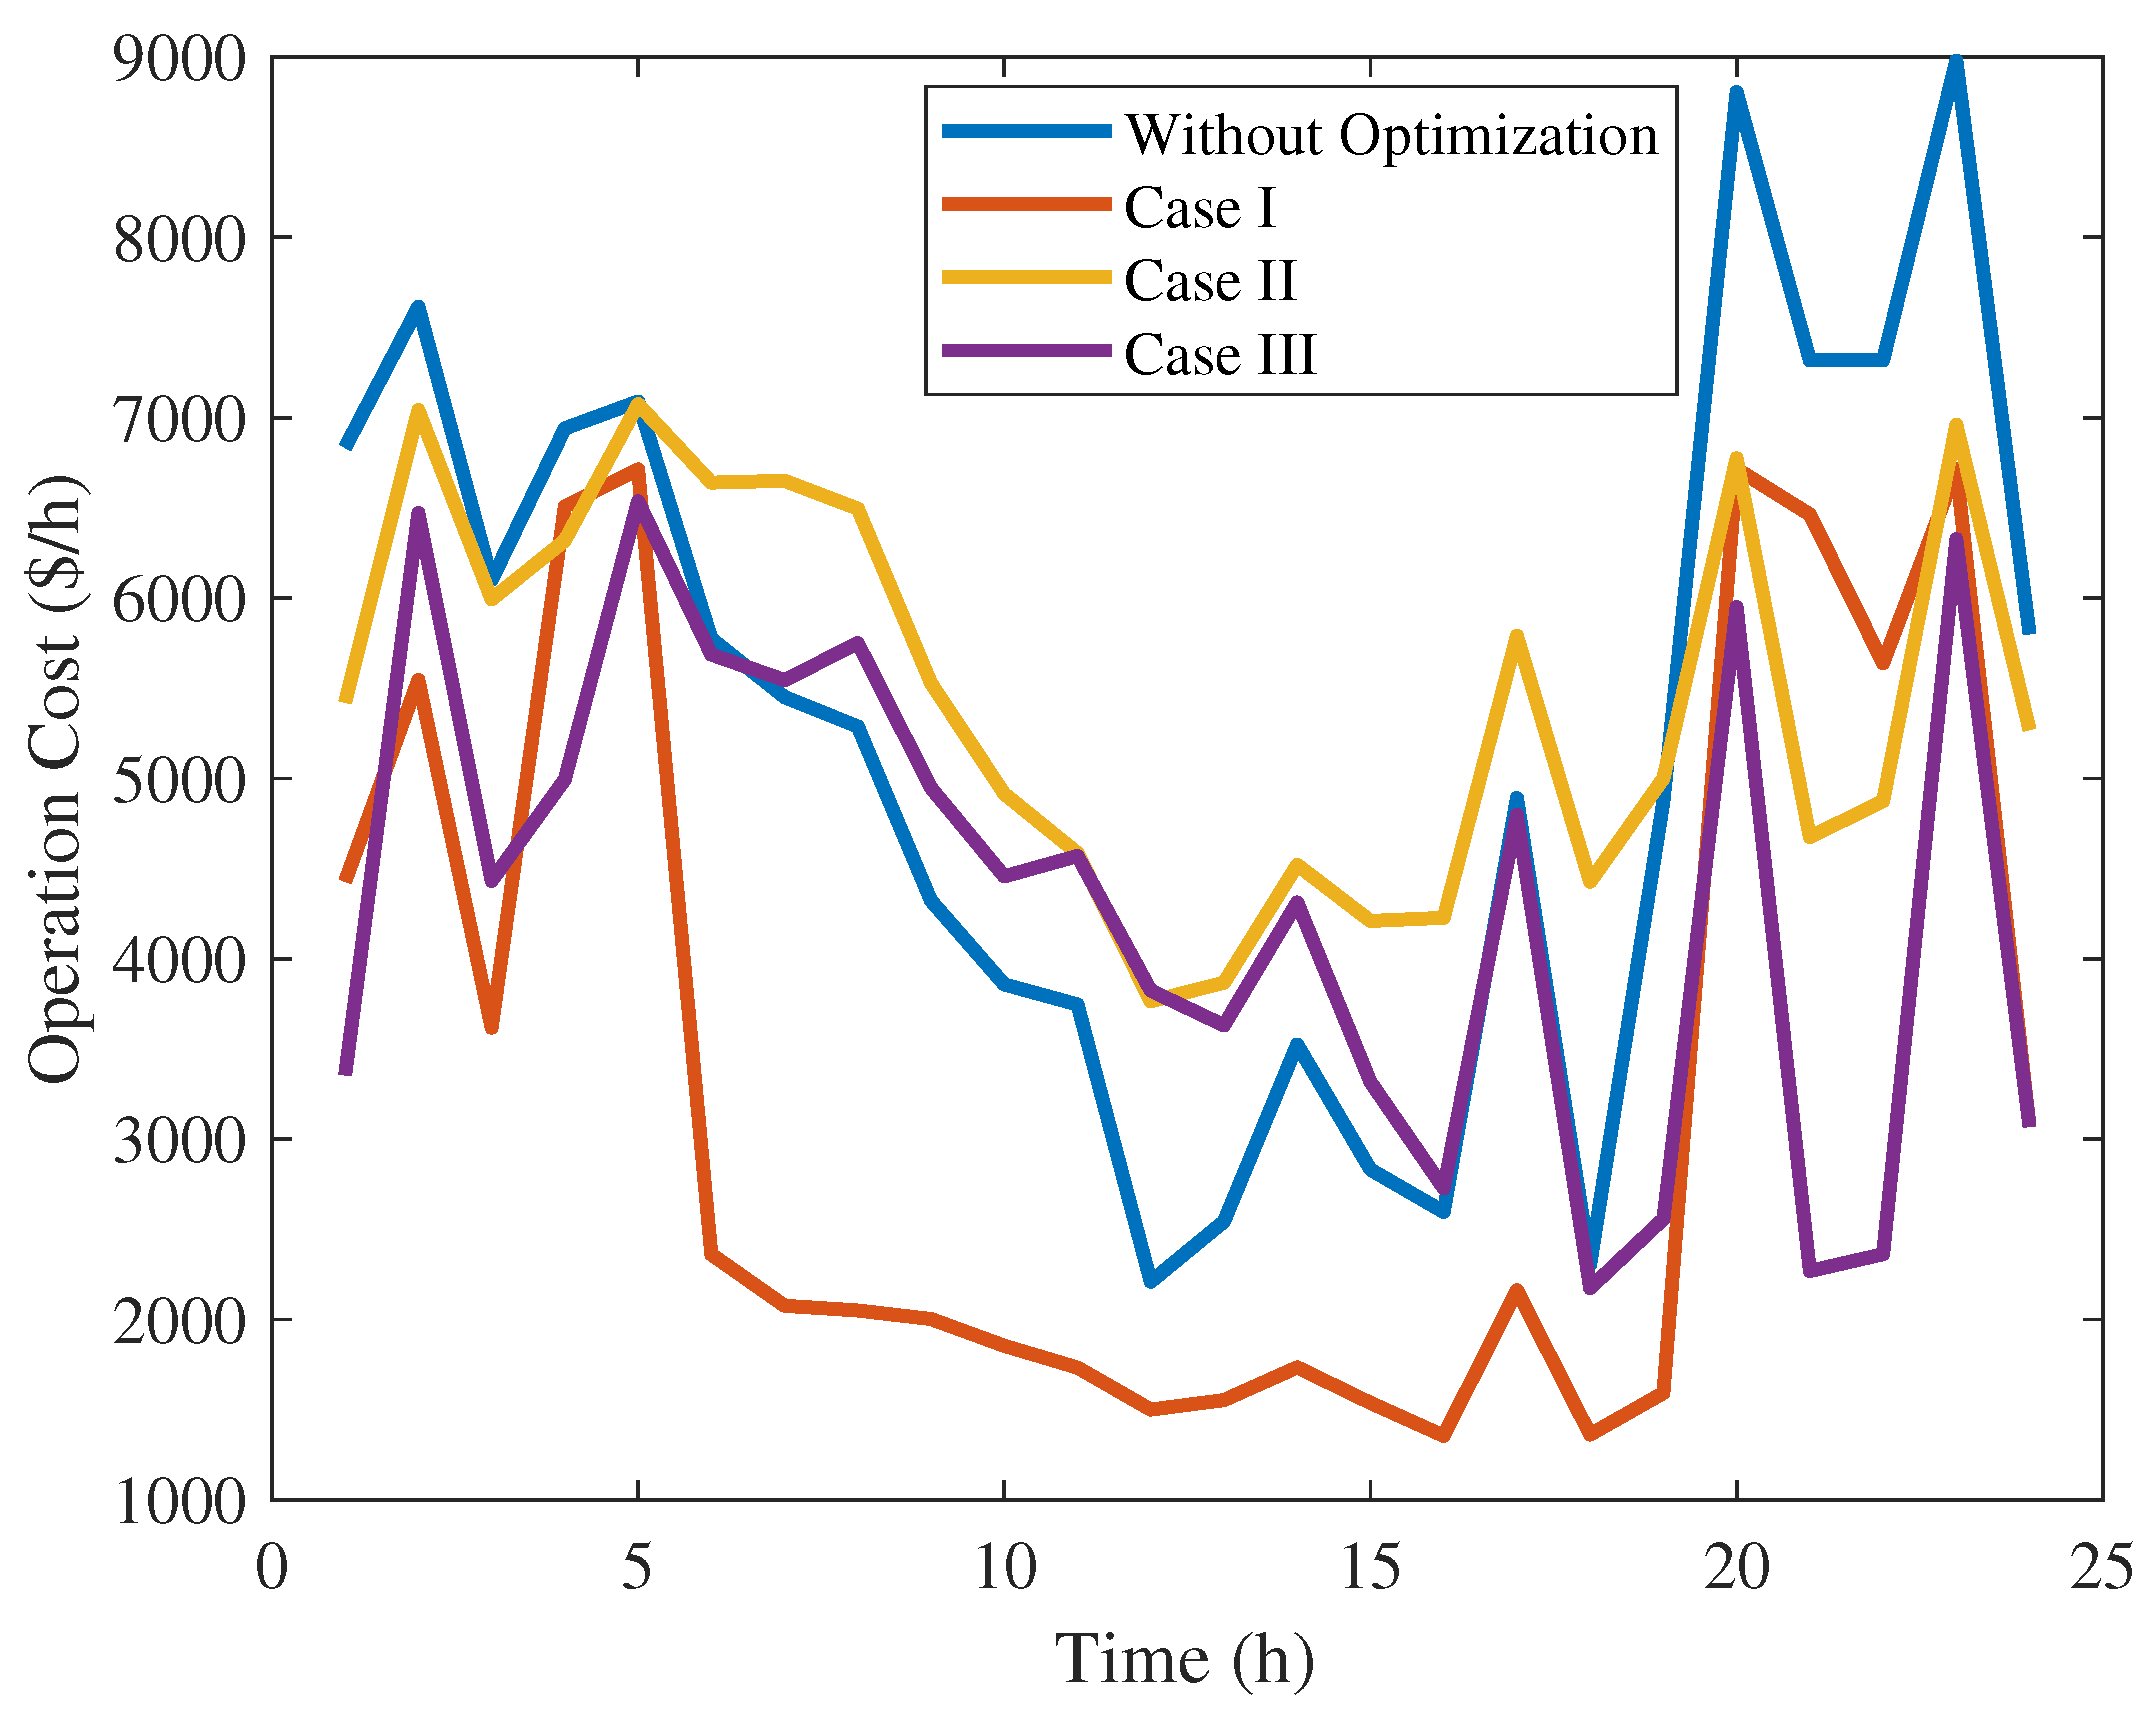
Based on Figure 7, Figure 8 and Figure 9, the loads of the microgrid test system from the three case studies can be shifted by using the proposed decentralized EMS, as illustrated in Figure 10. According to Figure 11, the optimization method provided the economic operation costs for Cases I, II, and III at peak time (20 h–23 h), although the microgrid have wind generation and demand uncertainties. After the optimal generation schedule program has been implemented, the simulation results provided the preferred amount of power that must be shifted to a particular period.
In Case I, the power is planned to receive from the cheaper generation such as wind, solar, and the main grid, and the power is supplied from expensive DG generation during the nighttime. Therefore, the total operation cost is saving by 58% compared to that without optimal scheduling. The demand response program is less than Cases II and III. However, the possible uncertainty effect is not considered in this case. The operation costs for the microgrid with and without optimal scheduling are 80,287 $ and 137,020 $, respectively.
In Case II, the robustness of the EMS is tested with the worst-case uncertainty of RESs. The PV generation uncertainty increased to 11%, wind power decreased to 10%, and the total demand changed to 17%. The available wind output power is lower than the forecast value, and the available PV power and the actual load demand level are higher than the forecast value. Therefore, the local generation and operation costs are higher than that of Cases I and III. This is because the proposed system properly considered the higher system’s uncertainty that will impact the distribution system. Therefore, Case II needs more generations to immunize against a higher level of uncertainty. Table 2 shows that production costs increased significantly to cover worst-case RES uncertainties. From Table 3, the powers from the DG increase with growing uncertainty, and load shift DR also increases to compensate for the worst case. The optimal scheduling has effectively controlled more power generation without violating the objective function and system constraints. The operation costs for the microgrid with and without optimal scheduling are 131,020 $ and 137,020 $, respectively. Although the scheduling is implemented with possible system uncertainty (RE and demand), the operation cost is 4% less than the operation cost without optimal scheduling.
Case III only considered RE generation uncertainty to evaluate the system’s supply and demand balance. This is because the proposed system elevated the use of RE resources. The results show that the scheduling process retained 22% of cost savings. The operation costs for the microgrid with and without optimal scheduling are 104,060 $ and 137,020 $, respectively. Due to generation uncertainty, the power requirement is more dependent on the local dispatchable generation units and the main grid. From Figure 8 and Figure 9, the total generation from available local resources is stable for 24 h. This is because the optimal schedule process provided the stable operation cost for Cases II, and III, although the microgrid has RE and demand uncertainties. However, in Case II, the total power from the main grid and local generation are 7200 kW and 4452 kW, respectively. In Case III, the total power from the main grid and local generations are 4732 kW and 3767kW, respectively. Therefore, the grid and local generation’s dependency decreased by 52% and 18%, respectively. However, the DR program of Case III is 38% more than that of Case II. Thus, the total operational cost is reduced by optimal generation scheduling. The cost-saving results in the three case studies are 55%, 4%, and 22%, respectively.
The system operation cost minimization is the objective function in case studies, and demand response is to mitigate system uncertainty by shifting demand. It is noteworthy that the total RES power is available more at the off-peak time. The possible demand response after applying the optimal generation scheduling is shown in Figure 10. The positive power is the required amount of power to shift at the peak time period, while the negative power is the extra generation capacities at the off-peak time period. The load at the peak time period of 19–4 h can be transferred to the off-peak time of 6–18 h. In Case II, the demand response decreased the peak load by 4.3%, and the valley load filled by 5.0%. In Case III, the peak load reduced by 7.2%, and the valley load filled by 7.3%.
According to Figure 11, the optimization method provided the economic costs for Cases I, II, and III at peak time (20–23 h), although the microgrid has wind and demand uncertainties. The optimal operation process maintained the system’s operational security under 11% PV generation, 10% wind power uncertainty and 17% demand uncertainties. In all case studies, the dispatch of the DG units and the grid power was able to balance the generation and demand under uncertainty. In the economic aspect, the optimization results can provide an economic cost interval of (1355 $/h, 7075 $/h). Table 2 shows the optimization results of the operation cost over 24 h for the three case studies.
Table 3 shows the impact of system uncertainties on the DR program and generation resources. After introducing system uncertainties, the load was cut and shifted more than the load in Case I, and more energy was exchanged from the main grid. It is observed that Case II mainly depended on the grid, and local generation was the second option to meet the peak demand. The DR program was a less desirable option than that of Case III. In Case II, the optimization method provided optimal energy management and distributed the peak load among the DR, local generation, and the main grid. When the uncertainty increased in the microgrid system, the electricity generation also increased in the local generation capacity to meet demand variation from 12,197.1 to 14,330.7 kW.
To evaluate the performance of the proposed strategy, the energy management system presented in [48,50,51,52] is compared with the proposed system in terms of operation cost minimization. The works in existing and proposed methods considered load-shifting demand response in the distribution network. The method’s effectiveness is demonstrated by operation cost reduction with the system’s uncertainty. The comparison results are shown in Table 4. The work in [50] proposed multi-agent generation scheduling and demand-side management without considering system uncertainty. In this work, the proposed system provided 5% cost savings by shifting the load. The work in [51] investigated the impact of high penetration of wind power on the operation cost savings with the introduction of demand response. In this work, the wind uncertainty was assumed at 10%, and the operation cost is saved by 27%. The article [52] optimized the network–load interaction framework to capture market price DR uncertainty. The results showed that the optimization method can reduce the network operation cost by 16.9%. The work in [48] represented the PV power on a sunny and cloudy day, potentially impacting the operation cost. The demand response with battery energy storage was introduced for industrial microgrid facilities. The results in this work showed that the proposed model provided a 15.6% cost saving on a cloudy day and 12.8% on a sunny day.
In the proposed system, the cost saving is 22% with the optimal scheduling method. This is because the objective of the local EMS system is to use full power from RE generation and expensive DG power used as a dispatchable generation. Consequently, the proposed method properly considers higher system uncertainties than the existing works. By comparing with the results obtained by the existing works, the proposed method provided higher cost savings than the existing methods under the worst uncertainty. It is shown that the optimal generation scheduling with demand response can effectively manage local generation under uncertainties to achieve operational cost savings.

4. Conclusions

The energy management system has been used to provide advanced load management techniques and control facilities. This paper proposed a decentralized energy management system to minimize the system’s operation cost by shifting the flexible load in the microgrid system. In the proposed strategy, the local generation resources were scheduled optimally, and the DR program was used to maintain the power balance of supply and demand. The uncertainties of RES generations and load demand were taken into account in this strategy. Particle swarm optimization and an autoregressive moving average model were applied for the implementation of the proposed strategy. In addition, mean absolute error (MAE) was used to evaluate the accuracy of the forecasting technique for a considered time period. Three case studies were given to evaluate the effectiveness of the proposed strategy. As a result, the proposed strategy was able to increase the utilization rate of the RESs and to reduce the system’s uncertainty with minimum operating cost. In the proposed strategy, the customers can participate in the active distribution network by changing demand patterns. Moreover, the proposed strategy also provided the balance of robustness and cost benefits of the microgrid operation. The proposed system managed power sharing among RE and dispatchable generation units in the microgrid system to provide operational cost minimization. The demand response program was introduced in the system to cope with the 11% PV generation uncertainty, 10% wind power uncertainty, and 17.71% demand uncertainty. The simulation results showed that the optimal generation scheduling can minimize the operating cost under the worst-case uncertainty. Using the demand response model, the customers can participate in the active distribution network by changing the load pattern to respond to the system’s uncertainties. The load-shifting demand response reduced the peak load by 4.3% and filled the valley load by 5%. There are several benefits of accurate generation forecasting, such as alleviating generation uncertainties, increasing in system stability, allowing more renewable penetration into the system, and minimizing maintenance costs.
In future work, the day-ahead generation scheduling integration with the deep learning technique may extend this work. The deep learning model can provide more accurate forecasting results and perform short-time predictions of RESs for network energy management.

Author Contributions

Conceptualization, S.L.L.W., W.P. and B.M.; methodology, S.L.L.W.; software, S.L.L.W., T.B. and P.B.; validation, S.L.L.W. and B.M.; formal analysis, S.L.L.W., W.P. and B.M.; investigation, S.L.L.W., W.P. and B.M.; data curation, S.L.L.W.; writing—original draft preparation, S.L.L.W.; writing—review and editing, W.P. and B.M.; supervision, B.M.; funding acquisition, B.M. All authors have read and agreed to the published version of the manuscript.

Funding

This research was funded by Suranaree University of Technology, Thailand (vitesbundit-2562-2).

Institutional Review Board Statement

Not applicable.

Informed Consent Statement

Not applicable.

Data Availability Statement

Not applicable.

Acknowledgments

Sane Lei Lei Wynn gratefully acknowledges the scholarship from Suranaree University of Technology, Thailand.

Conflicts of Interest

The authors declare no conflict of interest.

Abbreviations

The following abbreviations are used in this manuscript:
ARMA      Autoregressive Moving Average
DNO      Distribution Network Operator
EMS      Energy Management System
LC      Local Controller
MAE      Mean Absolute Error
MGCC      Microgrid Central Controller
MO      Market Operator
PDF      Probability Density Function
RES      Renewable Energy Resource
TOU      Time of Use
Φ i       The i-th AR coefficient
X t i       Time-series values
θ t       The j-th MA coefficient
ω t j       White noise
V ( n , y ) *       Standardized hourly average value
V ( n , y )       Average hourly value
μ ( t )       Sample mean and standard deviation of all transformed values in 24 h
σ ( t )       Sample standard deviation of all transformed values in 24 h
d      Number of days for considering month and year
Y      Number of considering years
P b e s t i , j k       Local best update solution of the j-th and i-th component with iteration k
G b e s t i , j k       Global best update solution of the j-th and i-th component with iteration k
C o p e r a t i o n       Total operation cost of the system ($)
P P V t       Output power of PV at time t (kW)
P w i n d t       Output power of wind at time t (kW)
P g r i d t       Power delivered from the main grid at time t (kW)
P g t       Output power of fuel-based generation at time t (kW)
P d t       Total power of demand at time t (kW)
P L       Total distribution line losses (kW)
P G t       Total available generated power from system’s resource (kW)
λ P V , λ w i n d       The coefficient of operation and maintenance cost ($/kWh)
λ g r i d       Prices of operation ($/kWh)

References

  1. Pinthurat, W.; Hredzak, B. Distributed control strategy of single-phase battery systems for compensation of unbalanced active powers in a three-phase four-wire microgrid. Energies 2021, 14, 8287. [Google Scholar] [CrossRef]
  2. Sobri, S.; Koohi-Kamali, S.; Rahim, N.A. Solar photovoltaic generation forecasting methods: A review. Energy Convers. Manag. 2018, 156, 459–497. [Google Scholar] [CrossRef]
  3. Nfaoui, H.; Buret, J.; Sayigh, A. Stochastic simulation of hourly average wind speed sequences in Tangiers (Morocco). Sol. Energy 1996, 56, 301–314. [Google Scholar] [CrossRef]
  4. David, M.; Ramahatana, F.; Trombe, P.J.; Lauret, P. Probabilistic forecasting of the solar irradiance with recursive ARMA and GARCH models. Sol. Energy 2016, 133, 55–72. [Google Scholar] [CrossRef] [Green Version]
  5. Voyant, C.; Muselli, M.; Paoli, C.; Nivet, M.L. Numerical weather prediction (NWP) and hybrid ARMA/ANN model to predict global radiation. Energy 2012, 39, 341–355. [Google Scholar] [CrossRef] [Green Version]
  6. Pappas, S.S.; Ekonomou, L.; Karamousantas, D.C.; Chatzarakis, G.; Katsikas, S.; Liatsis, P. Electricity demand loads modeling using AutoRegressive Moving Average (ARMA) models. Energy 2008, 33, 1353–1360. [Google Scholar] [CrossRef]
  7. Wynn, S.L.L.; Pinthurat, W.; Marungsri, B. Multi-Objective Optimization for Peak Shaving with Demand Response under Renewable Generation Uncertainty. Energies 2022, 15, 8989. [Google Scholar] [CrossRef]
  8. Nguyen, D.T.; Negnevitsky, M.; De Groot, M. Pool-based demand response exchange—concept and modeling. IEEE Trans. Power Syst. 2010, 26, 1677–1685. [Google Scholar] [CrossRef]
  9. Albadi, M.H.; El-Saadany, E.F. A summary of demand response in electricity markets. Electr. Power Syst. Res. 2008, 78, 1989–1996. [Google Scholar] [CrossRef]
  10. Mahmoudi, N.; Eghbal, M.; Saha, T.K. Employing demand response in energy procurement plans of electricity retailers. Int. J. Electr. Power Energy Syst. 2014, 63, 455–460. [Google Scholar] [CrossRef]
  11. Zhong, H.; Xie, L.; Xia, Q. Coupon incentive-based demand response: Theory and case study. IEEE Trans. Power Syst. 2012, 28, 1266–1276. [Google Scholar] [CrossRef]
  12. Yu, M.; Hong, S.H.; Kim, J.B. Incentive-based demand response approach for aggregated demand side participation. In Proceedings of the 2016 IEEE International Conference on Smart Grid Communications (SmartGridComm), Sydney, NSW, Australia, 6–9 November 2016; pp. 51–56. [Google Scholar]
  13. Conejo, A.; Carrion, M. Risk-constrained electricity procurement for a large consumer. IEE Proc.-Gener. Transm. Distrib. 2006, 153, 407–413. [Google Scholar] [CrossRef]
  14. Su, W.; Wang, J. Energy management systems in microgrid operations. Electr. J. 2012, 25, 45–60. [Google Scholar] [CrossRef]
  15. Hajiamoosha, P.; Rastgou, A.; Bahramara, S.; Sadati, S.M.B. Stochastic energy management in a renewable energy-based microgrid considering demand response program. Int. J. Electr. Power Energy Syst. 2021, 129, 106791. [Google Scholar] [CrossRef]
  16. Gamarra, C.; Guerrero, J.M. Computational optimization techniques applied to microgrids planning: A review. Renew. Sustain. Energy Rev. 2015, 48, 413–424. [Google Scholar] [CrossRef] [Green Version]
  17. Nguyen, T.H.; Nguyen, L.V.; Jung, J.J.; Agbehadji, I.E.; Frimpong, S.O.; Millham, R.C. Bio-inspired approaches for smart energy management: State of the art and challenges. Sustainability 2020, 12, 8495. [Google Scholar] [CrossRef]
  18. Liu, J.; Wang, W.; Zhang, Y.; Xu, X. Energy management for households considering uncertainty in solar irradiance with various probability distribution. J. Electr. Eng. Technol. 2019, 14, 1943–1956. [Google Scholar] [CrossRef]
  19. Srinivasan, T.; Wang, X.; Kim, H.J.; Ra, I.H. Performance enhancement for microgrids under the demand uncertainties with the presence of multiple DGs through stochastic ranking algorithm. J. Electr. Eng. Technol. 2021, 16, 223–238. [Google Scholar] [CrossRef]
  20. Khalili, T.; Nojavan, S.; Zare, K. Optimal performance of microgrid in the presence of demand response exchange: A stochastic multi-objective model. Comput. Electr. Eng. 2019, 74, 429–450. [Google Scholar] [CrossRef]
  21. Azar, A.T.; Abed, A.M.; Abdulmajeed, F.A.; Hameed, I.A.; Kamal, N.A.; Jawad, A.J.M.; Abbas, A.H.; Rashed, Z.A.; Hashim, Z.S.; Sahib, M.A.; et al. A New Nonlinear Controller for the Maximum Power Point Tracking of Photovoltaic Systems in Micro Grid Applications Based on Modified Anti-Disturbance Compensation. Sustainability 2022, 14, 10511. [Google Scholar] [CrossRef]
  22. Xiao, D.; Chen, H.; Wei, C.; Bai, X. Statistical Measure for Risk-Seeking Stochastic Wind Power Offering Strategies in Electricity Markets. J. Mod. Power Syst. Clean Energy 2021, 10, 1437–1442. [Google Scholar] [CrossRef]
  23. Jordehi, A.R.; Tabar, V.S.; Mansouri, S.; Nasir, M.; Hakimi, S.; Pirouzi, S. A risk-averse two-stage stochastic model for planning retailers including self-generation and storage system. J. Energy Storage 2022, 51, 104380. [Google Scholar] [CrossRef]
  24. Karimi, H.; Jadid, S. Optimal energy management for multi-microgrid considering demand response programs: A stochastic multi-objective framework. Energy 2020, 195, 116992. [Google Scholar] [CrossRef]
  25. Firouzmakan, P.; Hooshmand, R.A.; Bornapour, M.; Khodabakhshian, A. A comprehensive stochastic energy management system of micro-CHP units, renewable energy sources and storage systems in microgrids considering demand response programs. Renew. Sustain. Energy Rev. 2019, 108, 355–368. [Google Scholar] [CrossRef]
  26. Mohseni-Bonab, S.M.; Rabiee, A.; Mohammadi-Ivatloo, B. Voltage stability constrained multi-objective optimal reactive power dispatch under load and wind power uncertainties: A stochastic approach. Renew. Energy 2016, 85, 598–609. [Google Scholar] [CrossRef]
  27. Yang, Z.; Ghadamyari, M.; Khorramdel, H.; Alizadeh, S.M.S.; Pirouzi, S.; Milani, M.; Banihashemi, F.; Ghadimi, N. Robust multi-objective optimal design of islanded hybrid system with renewable and diesel sources/stationary and mobile energy storage systems. Renew. Sustain. Energy Rev. 2021, 148, 111295. [Google Scholar] [CrossRef]
  28. Alhasnawi, B.N.; Jasim, B.H.; Rahman, Z.A.S.; Guerrero, J.M.; Esteban, M.D. A novel internet of energy based optimal multi-agent control scheme for microgrid including renewable energy resources. Int. J. Environ. Res. Public Health 2021, 18, 8146. [Google Scholar] [CrossRef]
  29. Ma, Z.; Yang, M.; Jia, W.; Ding, T. Decentralized Robust Optimal Dispatch of User-level Integrated Electricity-Gas-Heat Systems Considering Two-level Integrated Demand Response. Front. Energy Res. 2022, 1751. [Google Scholar] [CrossRef]
  30. Alobaidi, A.H.; Khodayar, M.E.; Shahidehpour, M. Decentralized energy management for unbalanced networked microgrids with uncertainty. IET Gener. Transm. Distrib. 2021, 15, 1922–1938. [Google Scholar] [CrossRef]
  31. Nwulu, N.I.; Xia, X. Optimal dispatch for a microgrid incorporating renewables and demand response. Renew. Energy 2017, 101, 16–28. [Google Scholar] [CrossRef]
  32. Shahryari, E.; Shayeghi, H.; Mohammadi-Ivatloo, B.; Moradzadeh, M. A copula-based method to consider uncertainties for multi-objective energy management of microgrid in presence of demand response. Energy 2019, 175, 879–890. [Google Scholar] [CrossRef]
  33. Wang, Z.; Chen, B.; Wang, J. Decentralized energy management system for networked microgrids in grid-connected and islanded modes. IEEE Trans. Smart Grid 2015, 7, 1097–1105. [Google Scholar] [CrossRef]
  34. Patterson, K. An Introduction to ARMA Models. In Unit Root Tests in Time Series; Springer: Berlin/Heidelberg, Germany, 2011; pp. 68–122. [Google Scholar]
  35. Weather History Dashboard for Any Location. Available online: https://www.visualcrossing.com/weather-history/ (accessed on 10 December 2022).
  36. Climate Data Online: Dataset Discovery. Available online: https://www.ncdc.noaa.gov/cdo-web/datasets/ (accessed on 10 December 2022).
  37. The Study of the Characteristics of Electricity Consumption. Available online: http://peaoc.pea.co.th/loadprofile/ (accessed on 10 December 2022).
  38. Bahrami, S.; Amini, M.H.; Shafie-khah, M.; Catalao, J.P. A decentralized electricity market scheme enabling demand response deployment. IEEE Trans. Power Syst. 2017, 33, 4218–4227. [Google Scholar] [CrossRef]
  39. Singh, B.; Pozo, D. A guide to solar power forecasting using ARMA models. In Proceedings of the 2019 IEEE PES Innovative Smart Grid Technologies Europe (ISGT-Europe), Bucharest, Romania, 29 September–2 October 2019; pp. 1–4. [Google Scholar]
  40. Brown, B.G.; Katz, R.W.; Murphy, A.H. Time series models to simulate and forecast wind speed and wind power. J. Appl. Meteorol. Climatol. 1984, 23, 1184–1195. [Google Scholar] [CrossRef]
  41. Mortaji, H.; Ow, S.H.; Moghavvemi, M.; Almurib, H.A.F. Load shedding and smart-direct load control using internet of things in smart grid demand response management. IEEE Trans. Ind. Appl. 2017, 53, 5155–5163. [Google Scholar] [CrossRef]
  42. Khan, A.; Hizam, H.; bin Abdul Wahab, N.I.; Lutfi Othman, M. Optimal power flow using hybrid firefly and particle swarm optimization algorithm. PLoS ONE 2020, 15, e0235668. [Google Scholar] [CrossRef] [PubMed]
  43. Alam, M.N. Particle swarm optimization: Algorithm and its codes in matlab. ResearchGate 2016, 8, 10. [Google Scholar]
  44. Electricity Tariffs. Available online: https://www.pea.co.th (accessed on 10 December 2022).
  45. Nikmehr, N.; Najafi Ravadanegh, S. A study on optimal power sharing in interconnected microgrids under uncertainty. Int. Trans. Electr. Energy Syst. 2016, 26, 208–232. [Google Scholar] [CrossRef]
  46. IEEE PES Test Feeder. Available online: https://cmte.ieee.org/pes-testfeeders/ (accessed on 20 November 2022).
  47. Ela, E.; O’Malley, M. Studying the variability and uncertainty impacts of variable generation at multiple timescales. IEEE Trans. Power Syst. 2012, 27, 1324–1333. [Google Scholar] [CrossRef] [Green Version]
  48. Huang, C.; Zhang, H.; Song, Y.; Wang, L.; Ahmad, T.; Luo, X. Demand response for industrial micro-grid considering photovoltaic power uncertainty and battery operational cost. IEEE Trans. Smart Grid 2021, 12, 3043–3055. [Google Scholar] [CrossRef]
  49. Ela, E.; Diakov, V.; Ibanez, E.; Heaney, M. Impacts of Variability and Uncertainty in Solar Photovoltaic Generation at Multiple Timescales; Technical Report; National Renewable Energy Lab. (NREL): Golden, CO, USA, 2013. [Google Scholar]
  50. Logenthiran, T.; Srinivasan, D.; Khambadkone, A.M.; Aung, H.N. Multiagent system for real-time operation of a microgrid in real-time digital simulator. IEEE Trans. Smart Grid 2012, 3, 925–933. [Google Scholar] [CrossRef]
  51. Dietrich, K.; Latorre, J.M.; Olmos, L.; Ramos, A. Demand response in an isolated system with high wind integration. IEEE Trans. Power Syst. 2011, 27, 20–29. [Google Scholar] [CrossRef] [Green Version]
  52. Wu, H.; Dong, P.; Liu, M. Optimization of network-load interaction with multi-time period flexible random fuzzy uncertain demand response. IEEE Access 2019, 7, 161630–161640. [Google Scholar] [CrossRef]
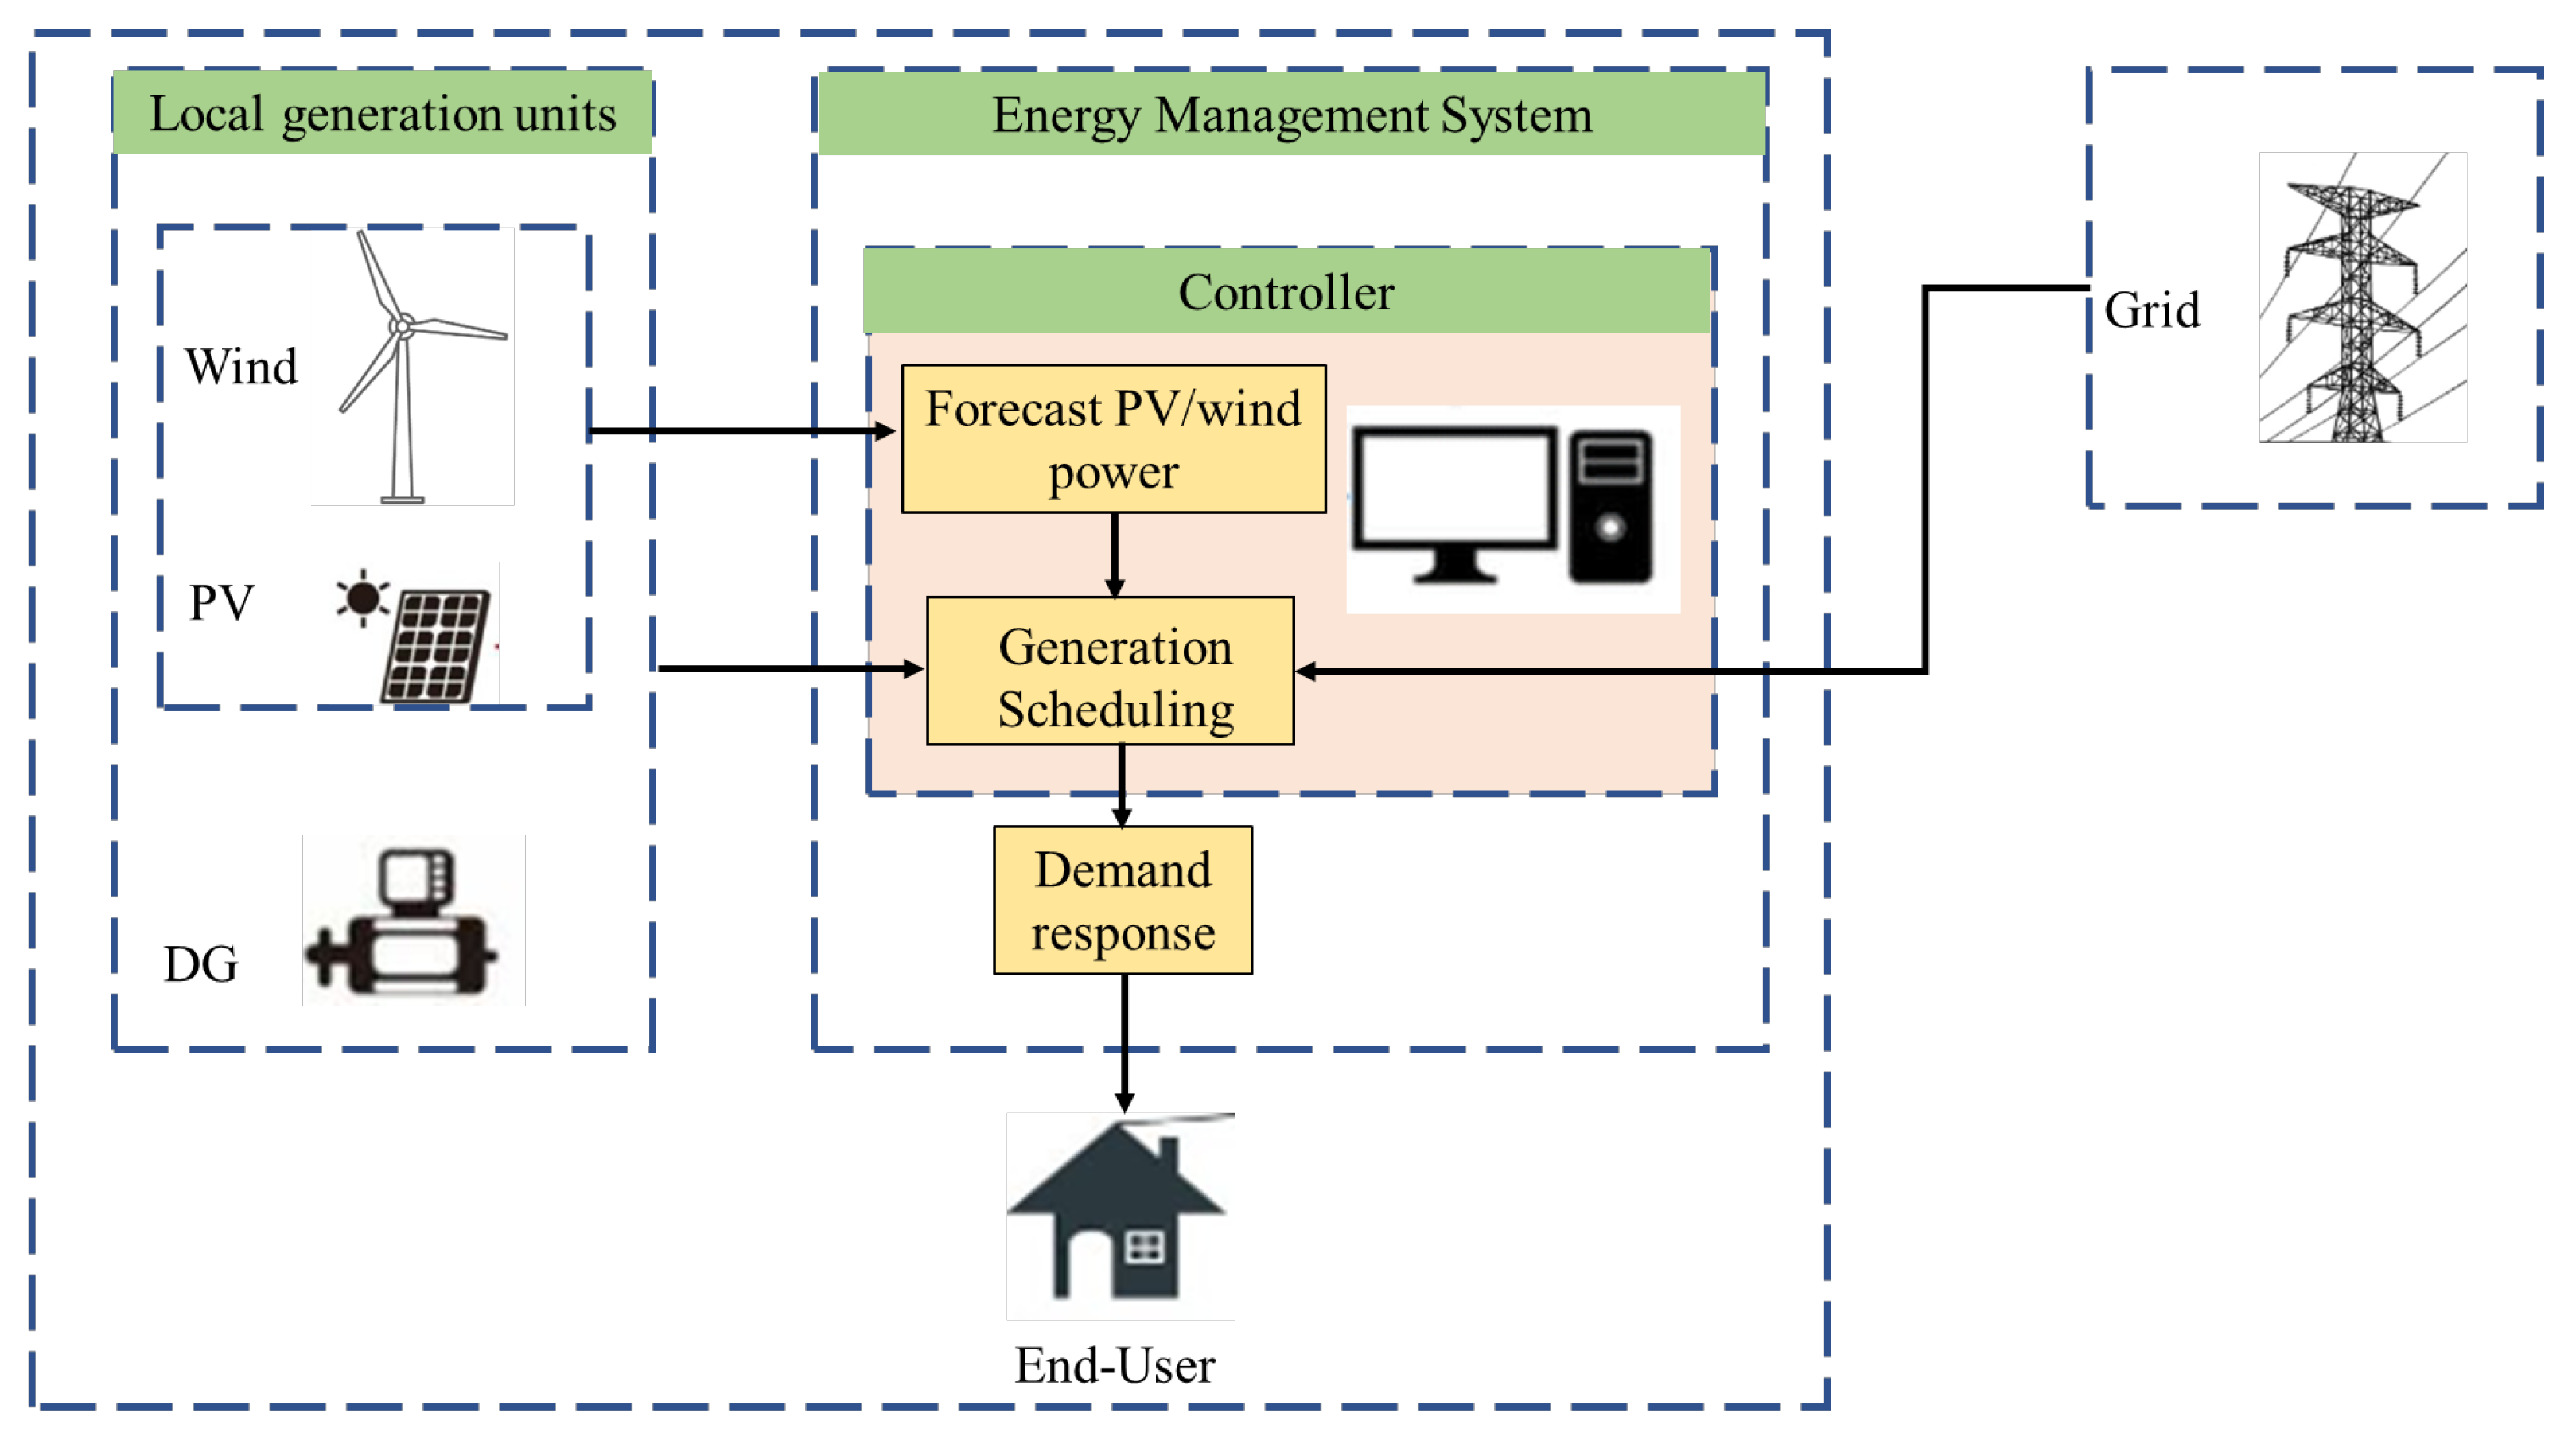
Figure 1. The proposed framework of the decentralized energy management system.
Electronics 12 00237 g001
Figure 2. Flowchart for implementation of the proposed decentralized energy management system.
Electronics 12 00237 g002
Figure 3. Microgrid test system [46].
Electronics 12 00237 g003
Figure 4. Forecast and actual PV power data.
Electronics 12 00237 g004
Figure 5. Forecast and actual wind power data.
Electronics 12 00237 g005
Figure 6. Forecast and actual of load profile data for peak day.
Electronics 12 00237 g006
Figure 7. Case I: Microgrid generation scheduling for peak day with forecast data.
Electronics 12 00237 g007
Figure 8. Case II: Microgrid generation scheduling for peak day with actual data.
Electronics 12 00237 g008
Figure 9. Case III: Microgrid generation scheduling for peak day with PV and wind forecast data and actual demand.
Electronics 12 00237 g009
Figure 10. Hourly−shiftable demand response program in peak day.
Electronics 12 00237 g010
Figure 11. Comparison of operation cost of case studies and without optimization.
Electronics 12 00237 g011
Table 1. Generation characteristics of the two DGs.
DGsab P min , (kW) P max , (kW)
10.00043021.603033
20.00039420.81125143
Table 2. Total operation cost of generation units.
Time (h)w/o Optimization, ($/h)Case I, ($/h)Case II, ($/h)Case III, ($/h)
16834442954213355
27615554570426471
36100361859934433
46941650763194995
57090671470756537
65775236166405687
75451207666505545
86288205064965750
95322200255284947
104858185449154457
114746173345864570
123209150037643824
133543155338673631
144524173445204312
153831153742103317
163596135542272727
175891216257904797
182305136244272174
194871159350002558
208806671767755950
217318646346752269
227319563948742362
238983671569606326
245804306952703069
Total137,02080,287131,020104,060
Table 3. Power requirements for each case study.
Case Studies DR Total , (kW)Local Generation, (kW)Grid Power, (kW)
Case I24830093174
Case II267844537200
Case III369737674733
Table 4. Results comparison with existing works.
ArticlesSystem’s UncertaintyOperation Cost Reduction
[48]PV uncertainty15.6%
[50]Not consider5%
[51]Wind uncertainty (10%)27%
[52]Price uncertainty16%
Propose method11% PV uncertainty, 10% wind uncertainty23%
Disclaimer/Publisher’s Note: The statements, opinions and data contained in all publications are solely those of the individual author(s) and contributor(s) and not of MDPI and/or the editor(s). MDPI and/or the editor(s) disclaim responsibility for any injury to people or property resulting from any ideas, methods, instructions or products referred to in the content.