1. Introduction
The technology and scale of wind power and photovoltaic power generation have achieved significant progress, thus effectively promoting the transformation of the power system into one based on these new forms of energy. Because the new power system is characterized by a high proportion of new energy power sources and power electronic equipment, the electrical characteristics of the power frequency of the system have also changed. At present, the power system is still configured with transmission line protection in a conventional way, and the traditional protection principle has been shown to have problems relating to adaptability [
1,
2,
3]. The relay protection, as the first line of defense, is facing serious challenges [
4,
5].
The distribution parameters of transmission lines in the actual power system have obvious characteristics, and the fault additional component spectrum generated during the fault often has a large amount of fault information, such as fault location [
6], fault type, and fault occurrence time, especially in the high-frequency frequency band. The fault characteristics are more obvious [
7], and the protection based on transient quantities is not affected by power frequency phenomena, such as oscillation, CT saturation, and transition resistance. Using high-frequency fault information can quickly detect high-frequency components and achieve high-speed protection [
8,
9], to avoid the action delay caused by the coordination between the filter and the action time in power frequency protection.
There are three main types of relay protection principles based on fault frequency domain characteristics: the first type focuses on the high-frequency transient line protection principle based on the attenuation effect of fault transient electrical quantities at the line "boundary"; the second type focuses on the transient line protection principle based on the fault natural frequency; and the third category is the transient line protection principle based on fault model identification in the frequency domain.
(1) The principle of high frequency transient line protection based on the attenuation effect of fault transient electrical quantities at the line "boundary". Due to the discontinuous wave impedance caused by the wave traps on both sides of the line and the bus-to-ground capacitance, the attenuation effect generated by the high-frequency component is used to identify internal or external faults. The high-frequency content is higher when an internal fault occurs, and is low when an external fault occurs. The principle and model of this method are relatively simple and easy to implement [
10,
11,
12]. At the same time, the wave trappers and bus-to-ground capacitance at both ends of the line are generally called "line boundaries". The line protection of high frequency transients based on the attenuation effect of transient faults at the line "boundary" is called boundary protection [
13,
14]. Boundary protection usually does not require line communication and can achieve high-speed action, but the setting of relay protection is relatively difficult.
(2) Transient-based line protection principle considering fault natural frequency. After a fault occurs somewhere on the line, the fault traveling wave will generate a series of harmonics during the propagation from the fault point to the bus. These harmonics are called natural frequencies, among which the component with the lowest frequency and the highest energy are referred to as the natural frequency principal component. Furthermore, there is a certain functional relationship between the natural frequency and the fault distance. Ref. [
15] proposed using the spectral correlation of the fault phase current at both ends of the line to identify the internal and external faults, and the spectral energy to determine the faulty phase and the fault type. The traditional impedance criterion is required as an auxiliary criterion in an internal fault in order to ensure the reliability of the protection action. This scheme is not affected by the power frequency phenomenon, does not require communication, and is widely used. The transient line protection principle based on the natural frequency of line faults has strict requirements on the accuracy of the extraction of the main frequency. In addition, its sampling rate is high, implementation is difficulty, and reliability cannot be guaranteed.
(3) Transient line protection principle based on fault model identification in frequency domain. Refs. [
16,
17,
18] proposed a line pilot protection principle based on the comprehensive impedance of fault components, using the ratio of fault voltage and current at both ends of the line as the fault criterion element to identify the fault characteristics. During an external fault, the modulus value of the comprehensive impedance reflecting the capacitive reactance on the transmission line is relatively large, whereas, in an internal fault, the modulus value of the comprehensive impedance reflecting the source impedance and line impedance is relatively small. Thus, internal and external faults can be distinguished according to the magnitude of this modulus value when a fault occurs.
In addition, in Ref. [
19], Prof. Suonan at Xi’an Jiaotong University in China and his team proposed a new pilot protection principle for transmission lines based on frequency-domain model recognition theory by adopting the Matrix Pencil algorithm. The internal and external fault-based models were proposed, and the fault recognition was achieved by comparing the internal fault-based model error with the external fault-based model error. In Ref. [
20], Prof. Saleh at the University Of New Brunswick presented a review of the time-domain and frequency-domain approaches to detect and identify fault currents, indicating the frequency domain approach has better accuracy and response speed than the time-domain approach, but the response speed may face a lower bound. In Ref. [
21], Prof. Jia and his research team at the State Key Laboratory of Alternate Electrical Power System with Renewable Energy Sources in NCEPU introduced a modeling method for converter impedance in the frequency domain. The study proposed using frequency-domain information suitable for different types of equipment, and the model based on the frequency domain to analyze the high-frequency characteristics of faults in DC systems was not affected by the converter control strategy. In Ref. [
22], Prof. Tzelepis and his team at the University of Strathclyde utilized wavelet transform to detect and discriminate faults, in which the optimum wavelet decomposition level, mother wavelet, and protection threshold were critical to achieve higher performance. In Ref. [
23], Prof. Lee at the University of Texas at Arlington proposed a power-spectrum-based hyperbolic S-transform to extract the high-frequency components of the current signals generated by an electric fault, and realized identification of fault classes in power transmission networks. In Ref. [
24], Prof. Shu at Kunming University of Science and Technology described the characteristic distribution of the traveling wave by the forward and backward traveling-wave components and realized fault location. In Ref. [
25], Prof. Geddada at Nanyang Technological University proposed using the frequency-domain-based short-time Fourier transform to quantitatively analyze high-frequency components in the fault current and to detect faults. In Ref. [
26], Prof. Mohsenian at the University of California at Riverside utilized the information in the frequency domain that was obtained during the detection phase to identify the location of faults. The study proved that much lower time resolution in power system measurements is needed, and identified the accuracy and efficiency of the approach.
It can be seen from the above research that an increasing number of scientists are focusing on the frequency domain and the spectrum characteristics of fault information to realize the location of faults. This is because the large scale of electronic equipment, in addition to the new energy resources feeding in to power systems, are resulting in more sophisticated fault characteristics containing multi-frequency components. However, most of the transient-based line protection relying on the frequency domain uses only low-frequency information for identification, which represents a limitation. In addition, the optimum decomposition layers and frequency band in the wavelet transform, which is popularly utilized in transient-based protection strategy, are difficult to define. Thus, the research in this field is still not fully explored. This study utilized frequency-domain information of the double terminals, and identified the optimum decomposition layers and analysis window. As a result, precise internal and external fault identification was realized, thus helping to address the negative effects of protection malfunction, and contributing to the safe and stable operation of new power systems confronted with sophisticated and multiple electrical characteristics.
2. Frequency Spectrum Feature Analysis of Fault Transient Current
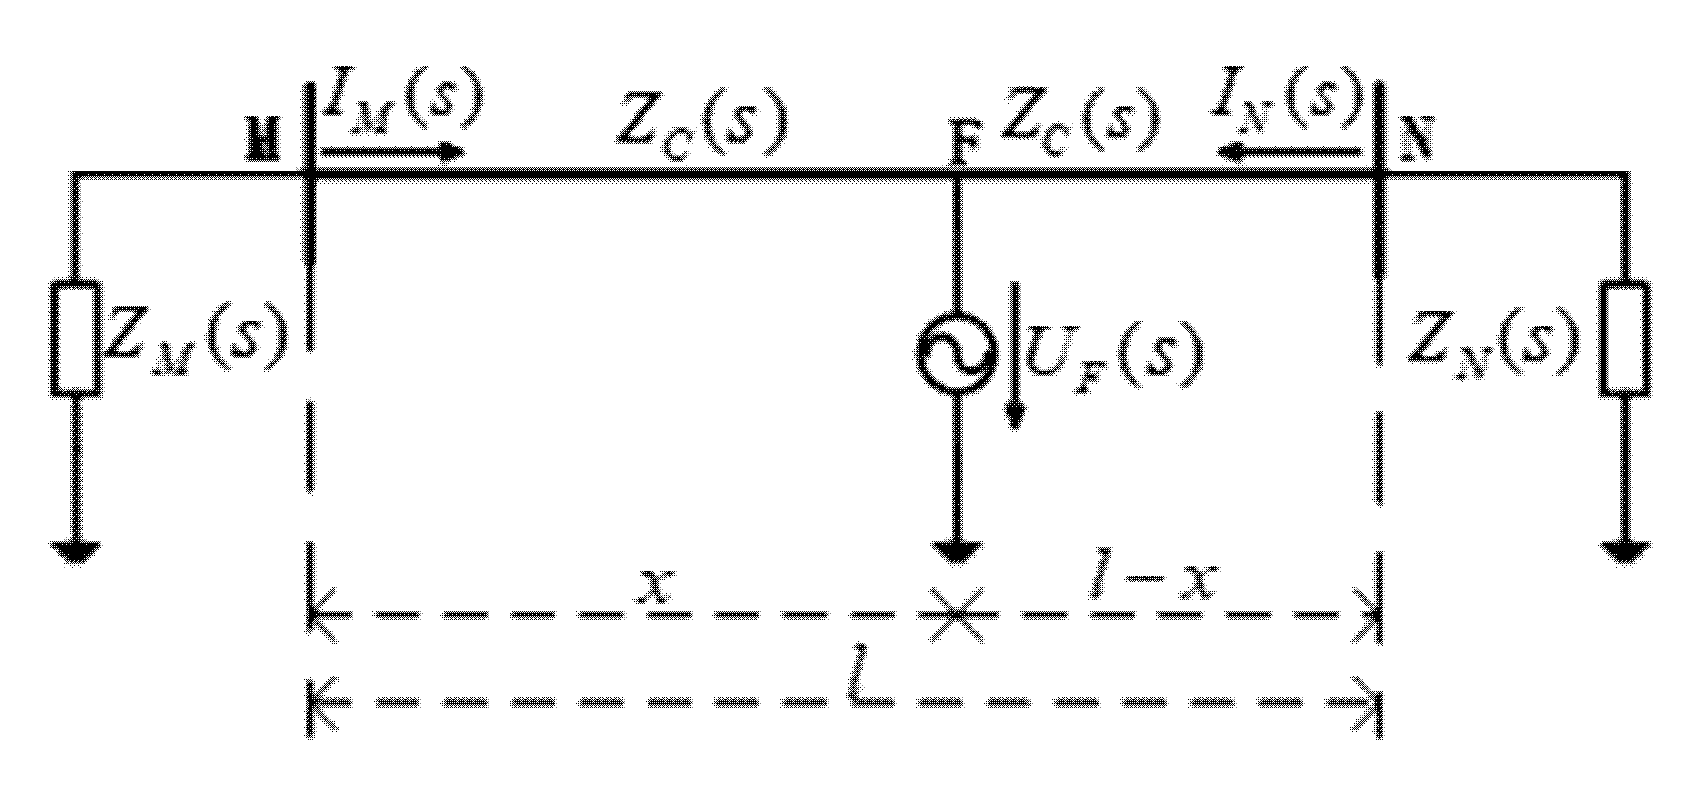
2.1. Internal Fault Characteristics Analysis
The fault additional network when an internal fault occurs is as shown in
Figure 1.
From the analysis of the frequency components of the wave process of the transmission line, the complex frequency domain expression of the transient current measured at the M and N terminal protection installations can be obtained as follows:
where
UF(0) is the voltage amplitude of the fault point when a fault occurs,
ω0 is the power frequency,
φ is the voltage initial phase angle when a fault occurs, and
chγ and
shγ represent hyperbolic functions.
Via Equations (1) and (2), the ratio of the frequency-domain currents at both ends of the line after faults are detected can be described as follows:
where
IM(
s) is the basic resonance equation of
IM, and its extreme value mainly represents the frequency characteristics of
IM;
IN(
s) is the basic resonance equation of
IN, and its extreme value mainly represents the frequency characteristics of
IN;
chγ and
shγ represent hyperbolic functions.
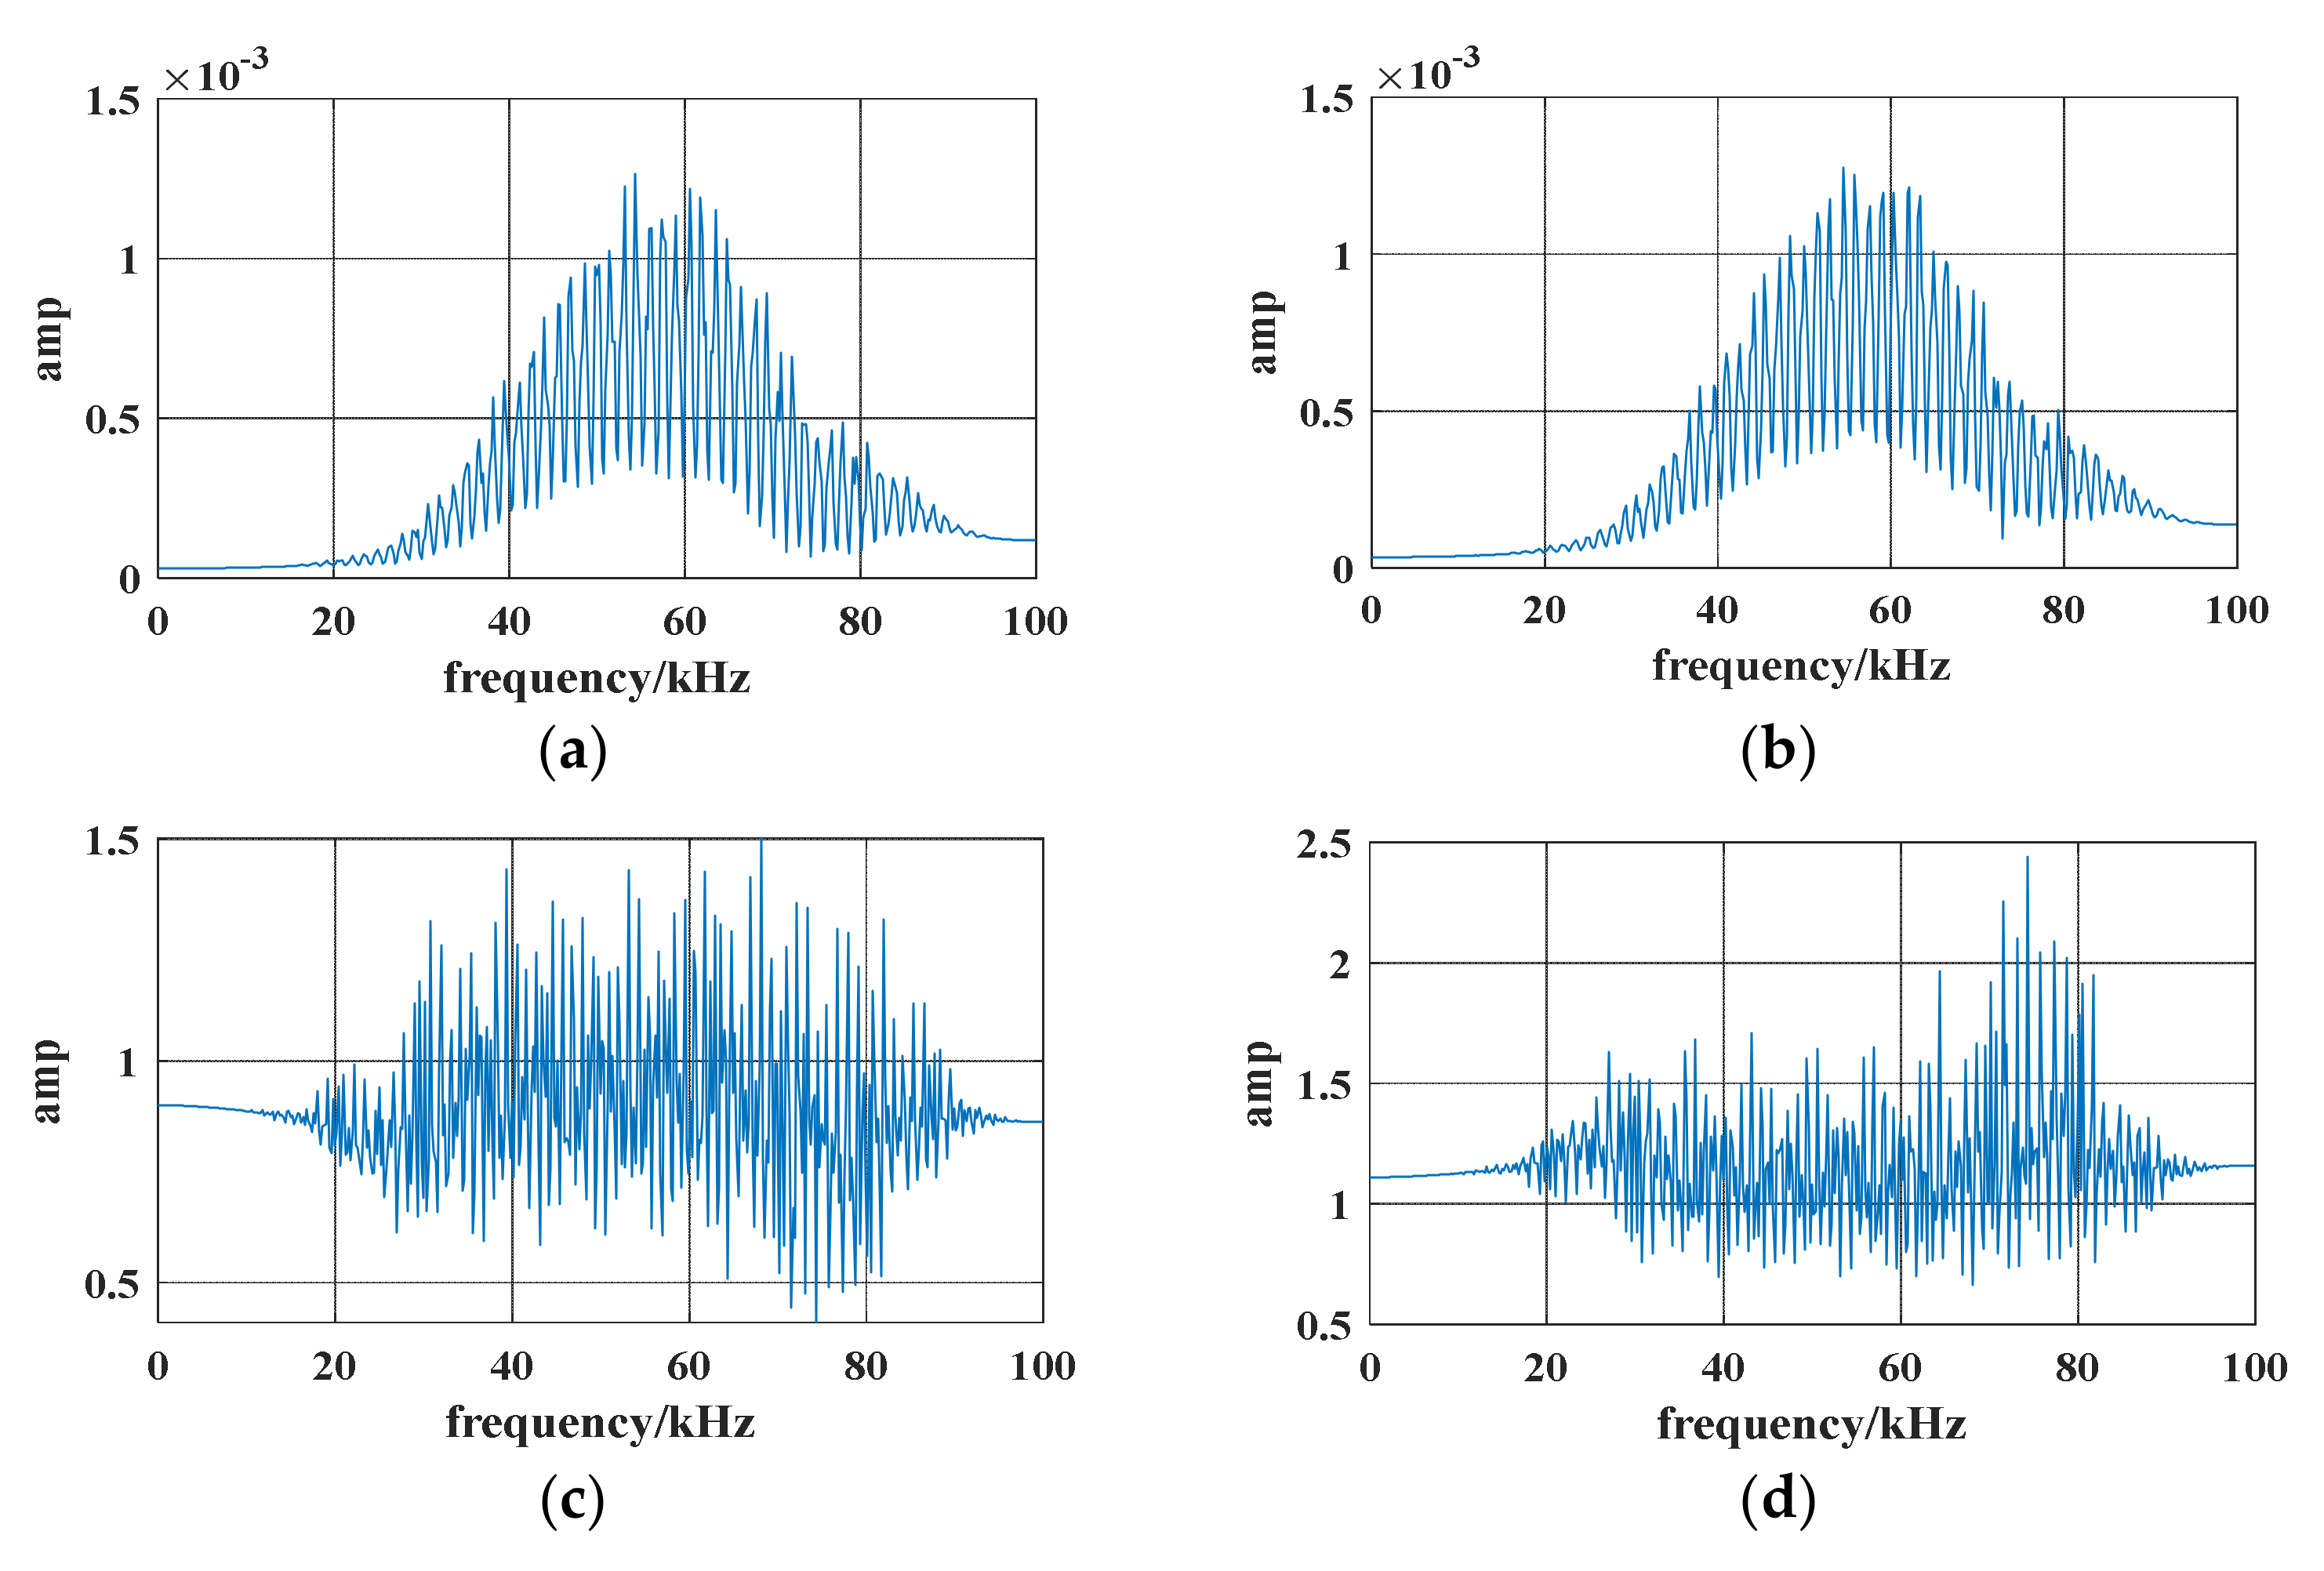
Under normal circumstances, the transmission line only contains power frequency information. When a fault occurs, high-frequency transient information will appear on the line, which destroys the model of the current ratio in the frequency domain on both sides of the line. When there is an internal fault, due to the different distances between the fault point and the protection installations on both sides, the corresponding harmonic frequencies in the transient current spectrum that propagate from the fault point to both sides of the line are different, and are related to the distance from the fault point to the two sides of the line. When an internal fault occurs at a distance of 0.8
l from the M side in the line, fault currents on both sides of the line are decomposed by the wavelet packet and in the third frequency band (50–75 kHz) because, through analysis and observation, fault characteristics in this frequency range are the most obvious. After extracting the current information in the corresponding frequencies, phase-mode transformation is performed on the current to better observe its fluctuation situation. Simulation results of the line-mode current spectrum and frequency-domain current ratio are shown in
Figure 2.
As shown in
Figure 2a,b, due to the impact of multiple frequency components in the transient current spectrum, the current has obvious fluctuations at multiple frequency points because it propagates from the fault point to the installation of protection on both sides of the line through the refraction effect of distributed inductance and capacitance on the line. It can be seen from
Figure 2c,d that, when the fault point is not in the middle of the line, the harmonic frequencies in the current spectrum in the frequency domain on both sides of the line are different. The frequency spectrum of the domain current ratio fluctuates at multiple frequencies, but with smaller amplitudes. When the fault occurs in the middle of the line, the fault current spectrum on both sides should be basically the same, and the current ratio in the frequency domain should be roughly 1 and the fluctuation is small. It can be seen from
Figure 2 that, when an internal fault occurs at a distance of 0.8
l from the M side in the line, the frequency spectrum fluctuation of the frequency-domain current ratio
IN/
IM is more significant.
When there is a fault in the area, the fault transient current wave is propagated from the fault point to both sides of the line. Due to the refraction and reflection effect of distributed inductance and capacitance from the fault point to the protection installations on both sides of the line, the fluctuation of the fault current spectrum at the protection installations on both sides is different. However, since the fault occurs in the inner area of the protected line, after the fault traveling wave is detected on both sides of the line, the difference in the fault current spectrum measured in the same time window is small. When the fault point is close to one side of the line, more high-frequency components on that side can be detected. However, when a fault occurs at the midpoint of the line, the fault current spectrum on both sides should be basically the same, which shows that the spectrum fluctuations on both sides are also basically the same. Therefore, when the fault point is close to the M side, the high-frequency content in the M-side transient current spectrum is correspondingly more obvious, so the spectral fluctuation characteristics of IM(s)/IN(s) are more significant; when the protection is close to the N side of the line, the high-frequency content in the N-side transient current spectrum is correspondingly more obvious, so the spectral fluctuation characteristics of IN(s)/IM(s) are more significant.
2.2. External Fault Characteristics Analysis
The fault additional network when an external fault occurs is shown in
Figure 3.
When an external fault occurs, on the protected line M-N, the transmission line equation can be obtained as follows:
From
Figure 3, the relationship between the voltage and the current on the N-side bus can be obtained as:
Combining Equations (4) and (5), the ratio of the frequency-domain current at both ends of the line can be obtained as:
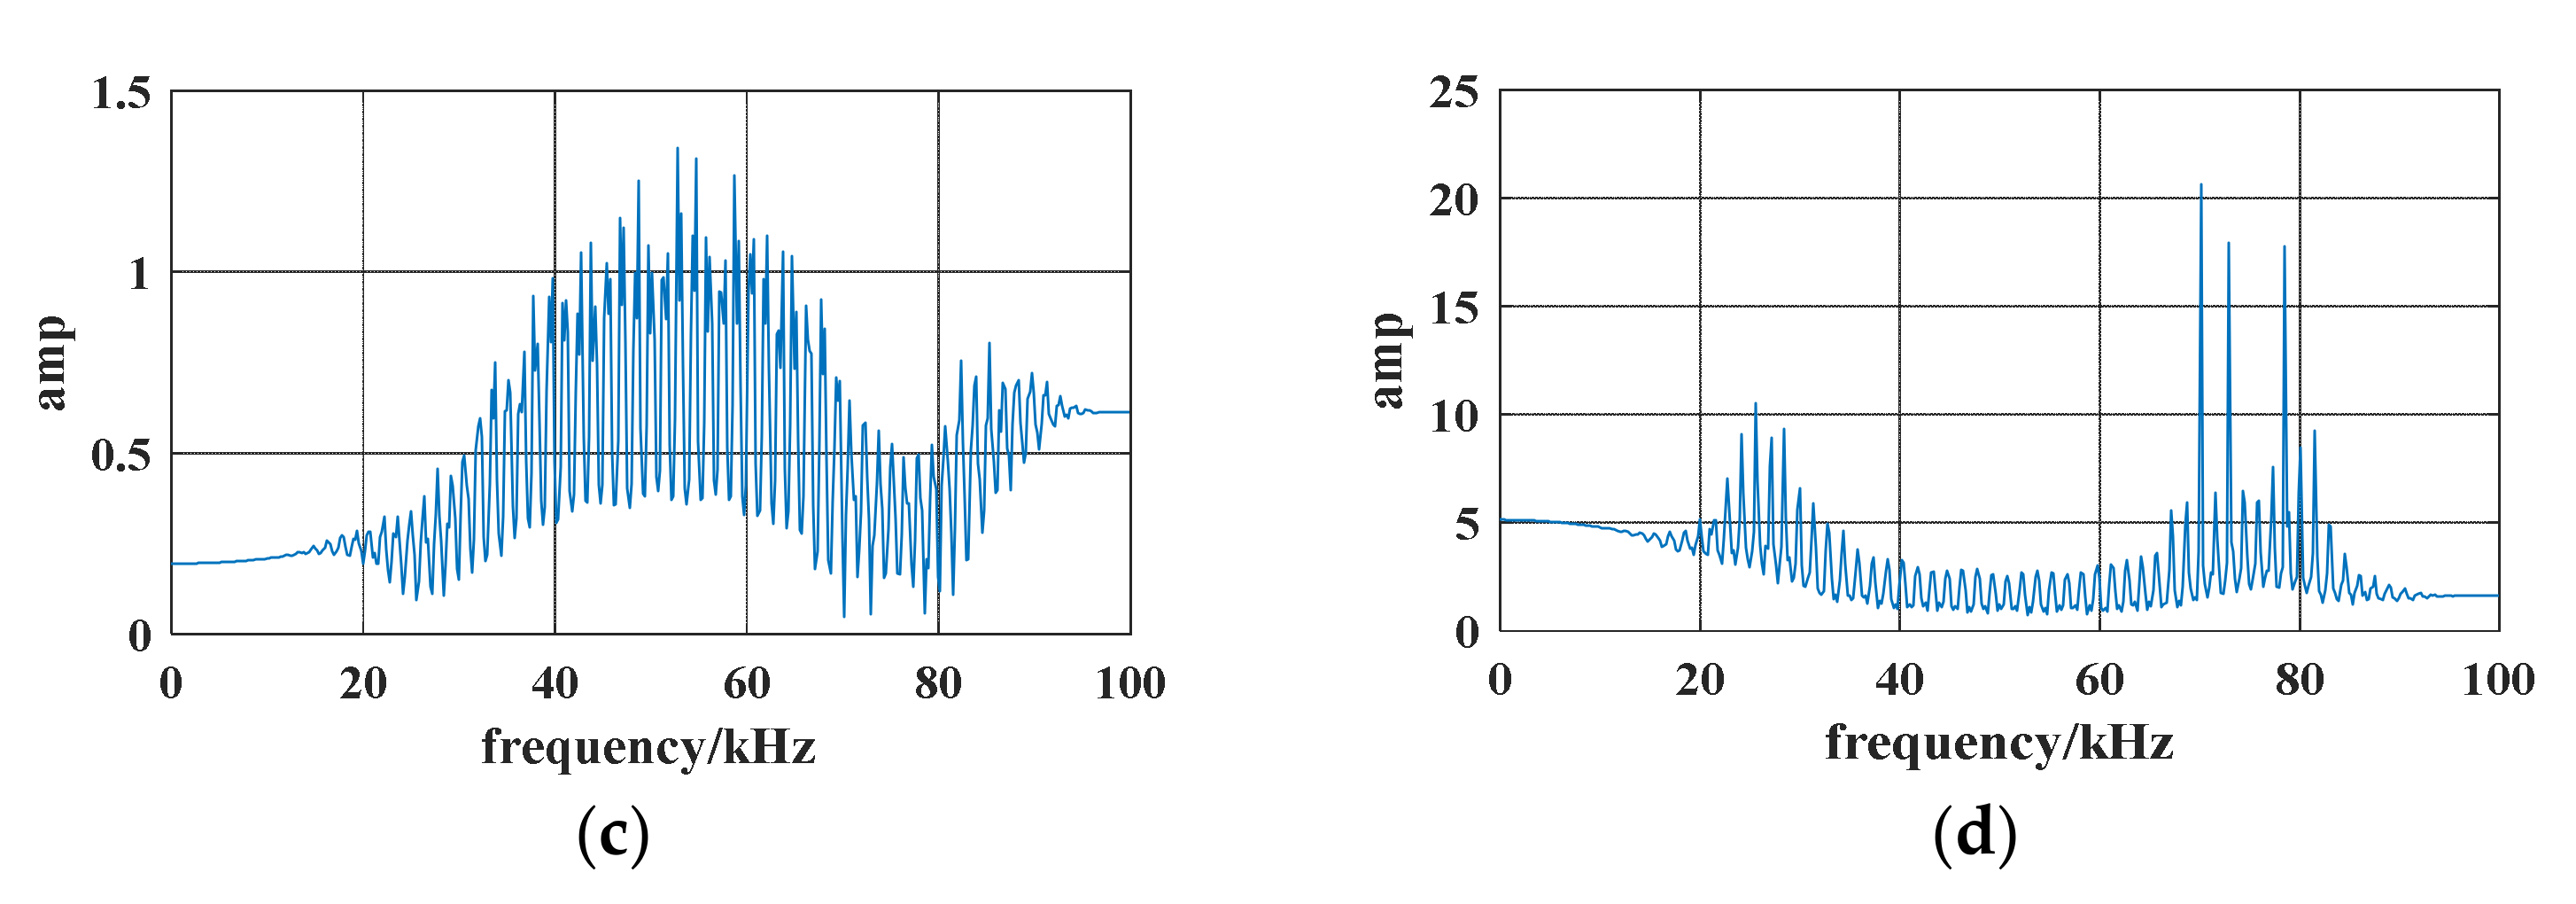
In the case of an external fault, the transfer function of the frequency-domain current on both sides of the line can be directly obtained from the transmission equation of the line. The frequency-domain current ratio in an external fault is only related to the overall length of the line, so its fluctuation should be relatively regular. Since the transient traveling wave at the fault point is transmitted through the line boundary and enters the protected line during an external fault, and propagates from the side close to the fault through the entire length of the protected line to the other side far from the fault, the spectral fluctuation of the transient current on the near end is weak, whereas that of the transient current on the far end is strong, and their spectral amplitudes vary greatly. When an external fault occurs at a distance of 0.2
l from the N side of the line, fault currents on both sides of the protected line are decomposed by the wavelet packet and in the third frequency band (50–75 kHz). The simulation results of the line-mode current spectrum and frequency-domain current ratio are shown in
Figure 4. Through comparison of
Figure 3 and
Figure 4, the difference in the current spectrum between internal and external faults can be determined.
The above analysis and figures indicate the following:
(1) When an internal fault occurs, the frequency spectrum of the current ratio in the frequency domain on both sides of the protected line fluctuates with multiple frequency components. When the fault does not occur at the middle of the line, since the corresponding harmonic frequency in the frequency-domain current spectrum on both sides is different, the spectrum of the frequency-domain current ratio of the line fluctuates at multiple frequency points, but the amplitude is small. When the fault occurs at the middle of the line, the fault current spectrum on both sides should be basically the same, so the frequency domain current ratio should be roughly 1 and the fluctuation is small.
(2) When an external fault occurs, since the fault transient current transmitting into the protected line propagates through the entire length of the protected line, the amplitude of the frequency domain current on both sides is quite different, and the frequency spectrum of the current ratio in the frequency domain should fluctuate regularly and the fluctuation amplitude is large.
(3) When an internal fault occurs, the frequency spectrum fluctuation characteristics of IM(s)/IN(s) are more significant when the fault point is identified to be closer to the M terminal; conversely, when the fault point is closer to the N terminal, the spectrum fluctuation characteristics of IN(s)/IM(s) are more significant; and when the fault point is in the middle of the line, the spectrum fluctuations of IM(s)/IN(s) and IN(s)/IM(s) are basically the same. In the case of an external fault, the frequency domain current of the protection installation nearer the fault point is used as the input, whereas that of the protection on the farther side of the line is used as the output, and the ratio of the corresponding frequency-domain current input to output should fluctuate greatly. Therefore, regardless of the occurrence of internal or external faults, if it is identified that the fault point is closer to one side of the line, the frequency-domain current on that side is taken as the numerator of the ratio of the frequency-domain currents, and correspondingly, the frequency-domain current on the other side is taken as the denominator.
Therefore, fault location can be identified according to the frequency spectrum fluctuation degree of the current ratio in the frequency domain on both sides of the line, so as to form a two-terminal transient-based protection principle.
3. Internal and External Fault Identification Scheme
3.1. Spectrum Fluctuation Identification
Kurtosis is a mathematical statistic that characterizes the distribution characteristics of variables and is very sensitive to the shock component in the signal. It is mainly affected by the shock waveform in the signal and can describe the peak degree of the signal waveform. It is widely used in the failure diagnosis of mechanical equipment. Kurtosis is defined as
K, the ratio of the fourth moment to the square of the second moment of the specific signal, which is not affected by the absolute level of the signal, and its mathematical expression is described as follows [
27]:
Applying the kurtosis criterion to frequency-domain analysis, kurtosis can be used to analyze non-stationary random signals, reflect the fluctuation and peak degree of frequency-domain signals in different frequency bands through spectral kurtosis, select the optimal number of decomposition layers, and filter out the frequency bands with the most obvious features.
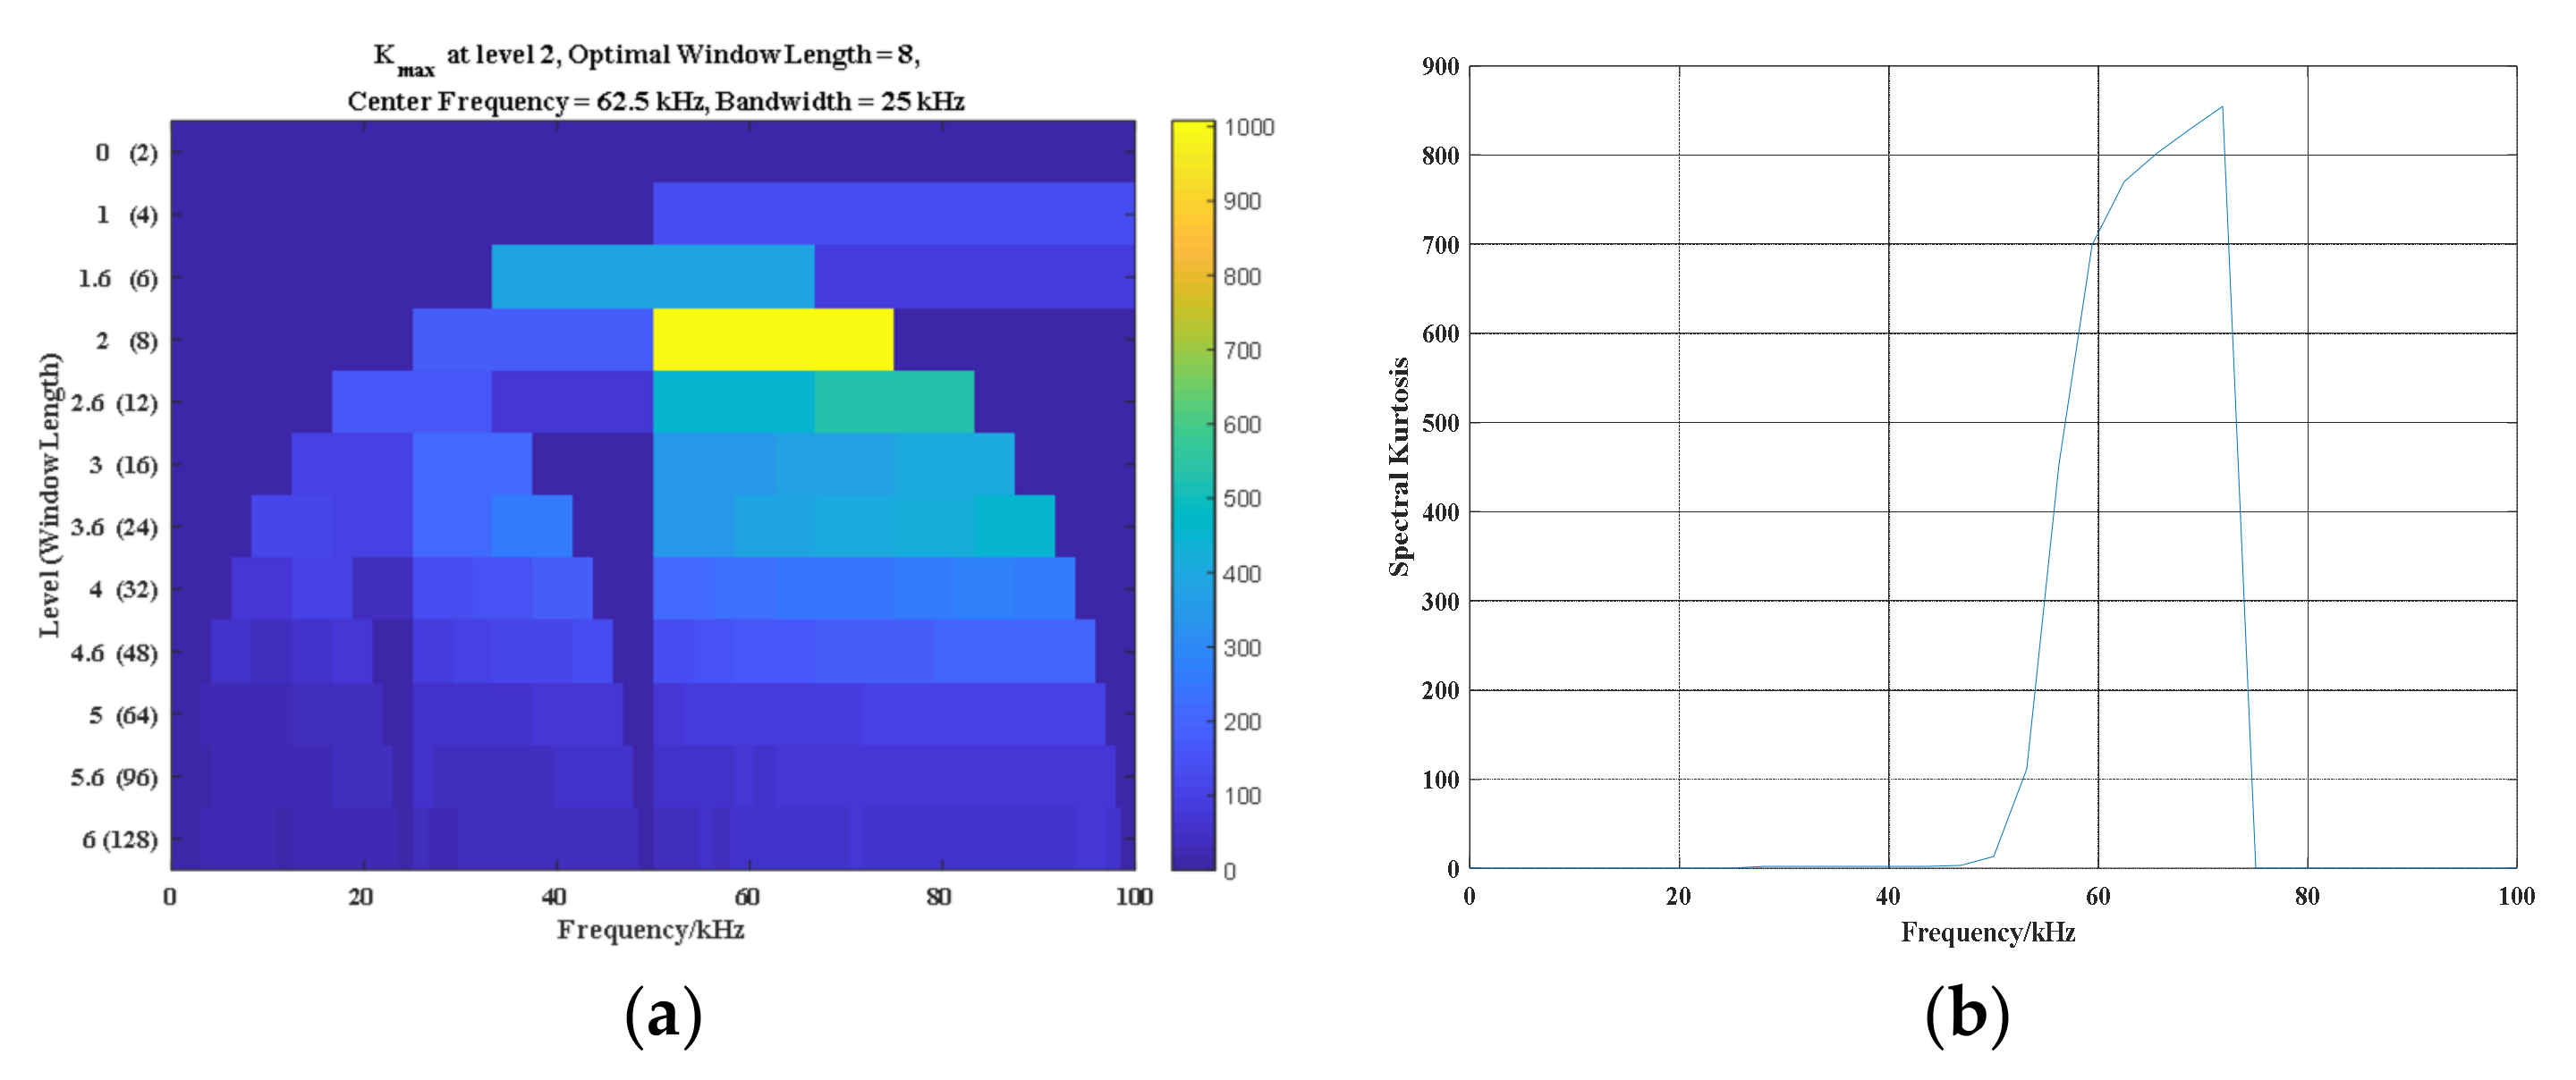
When an internal A-phase grounding fault occurs at a distance of 0.8
l from the M side in the line, the phase-mode transformation is performed on the additional fault current on the M side of the line, and spectrum kurtosis analysis is then performed, as shown in
Figure 5. In this figure, the yellow part represents the information with the most obvious characteristics, and through which the optimal decomposition layer and analysis window can be determined.
It can be seen from
Figure 5 that when the number of decomposition layers is two and the number of optimal kurtosis analysis windows is eight, the signal kurtosis is the largest, which means the fluctuation in the fault current is the most obvious. Therefore, when analyzing the fluctuation in the fault current spectrum, the two-layer wavelet packet decomposition should be selected, and the third frequency band (50–75 kHz) should be selected for spectral feature analysis. The fault line-mode current on the M side is decomposed into two layers of wavelet packets, and then its spectrum is obtained. The upper and lower kurtosis envelope curve spectra
U and
L are obtained from the current spectrum, and the mean curve
M = (
U +
L)/2. Subtracting the signal from the mean curve yields the fluctuation amplitude–frequency curve of the signal, as shown in
Figure 6.
The frequency spectrum fluctuation can be identified by the spectrum fluctuation amplitude–frequency curve of the fault line-mode current after removing the mean curve, and the frequency spectrum fluctuation can be quantified by calculating the spectrum fluctuation variance in
Figure 6b.
From the analysis of the characteristics of the transient current spectra of internal and external faults, it can be obtained that the frequency spectrum of the current ratio in the frequency domain on both sides of the line fluctuates at multiple frequency points in an internal fault, but the amplitude is small; the ratio of the current input to output in the frequency domain fluctuates more regularly and with a larger amplitude in external faults. By comparing the fluctuation difference of the current ratio in the frequency domain when the fault occurs inside and outside the line, the fluctuation difference is quantified by the spectrum fluctuation variance, and the new principle of double-terminal transient-based protection is realized.
3.2. Fault Location Criterion
In order to eliminate the three-phase coupling effect of the line, the scheme in this paper uses the line-mode component of the transient current after phase-to-mode transformation for analysis, that is, Im = Ifa − 2Ifb + Ifc, and the sampling frequency is selected to be 200 kHz; thus, the highest observed frequency is 100 kHz.
When t = 0.221 s, internal and external faults are set on the line. The additional components of the fault current at the protection installations on both sides of the line are subjected to phase-mode transformation, and then the modulus current is decomposed by wavelet packets to obtain reconstructed wavelets of different frequency bands. The packet coefficient is used to realize fast fault identification by comparing the spectral fluctuation of the transient line-mode current.
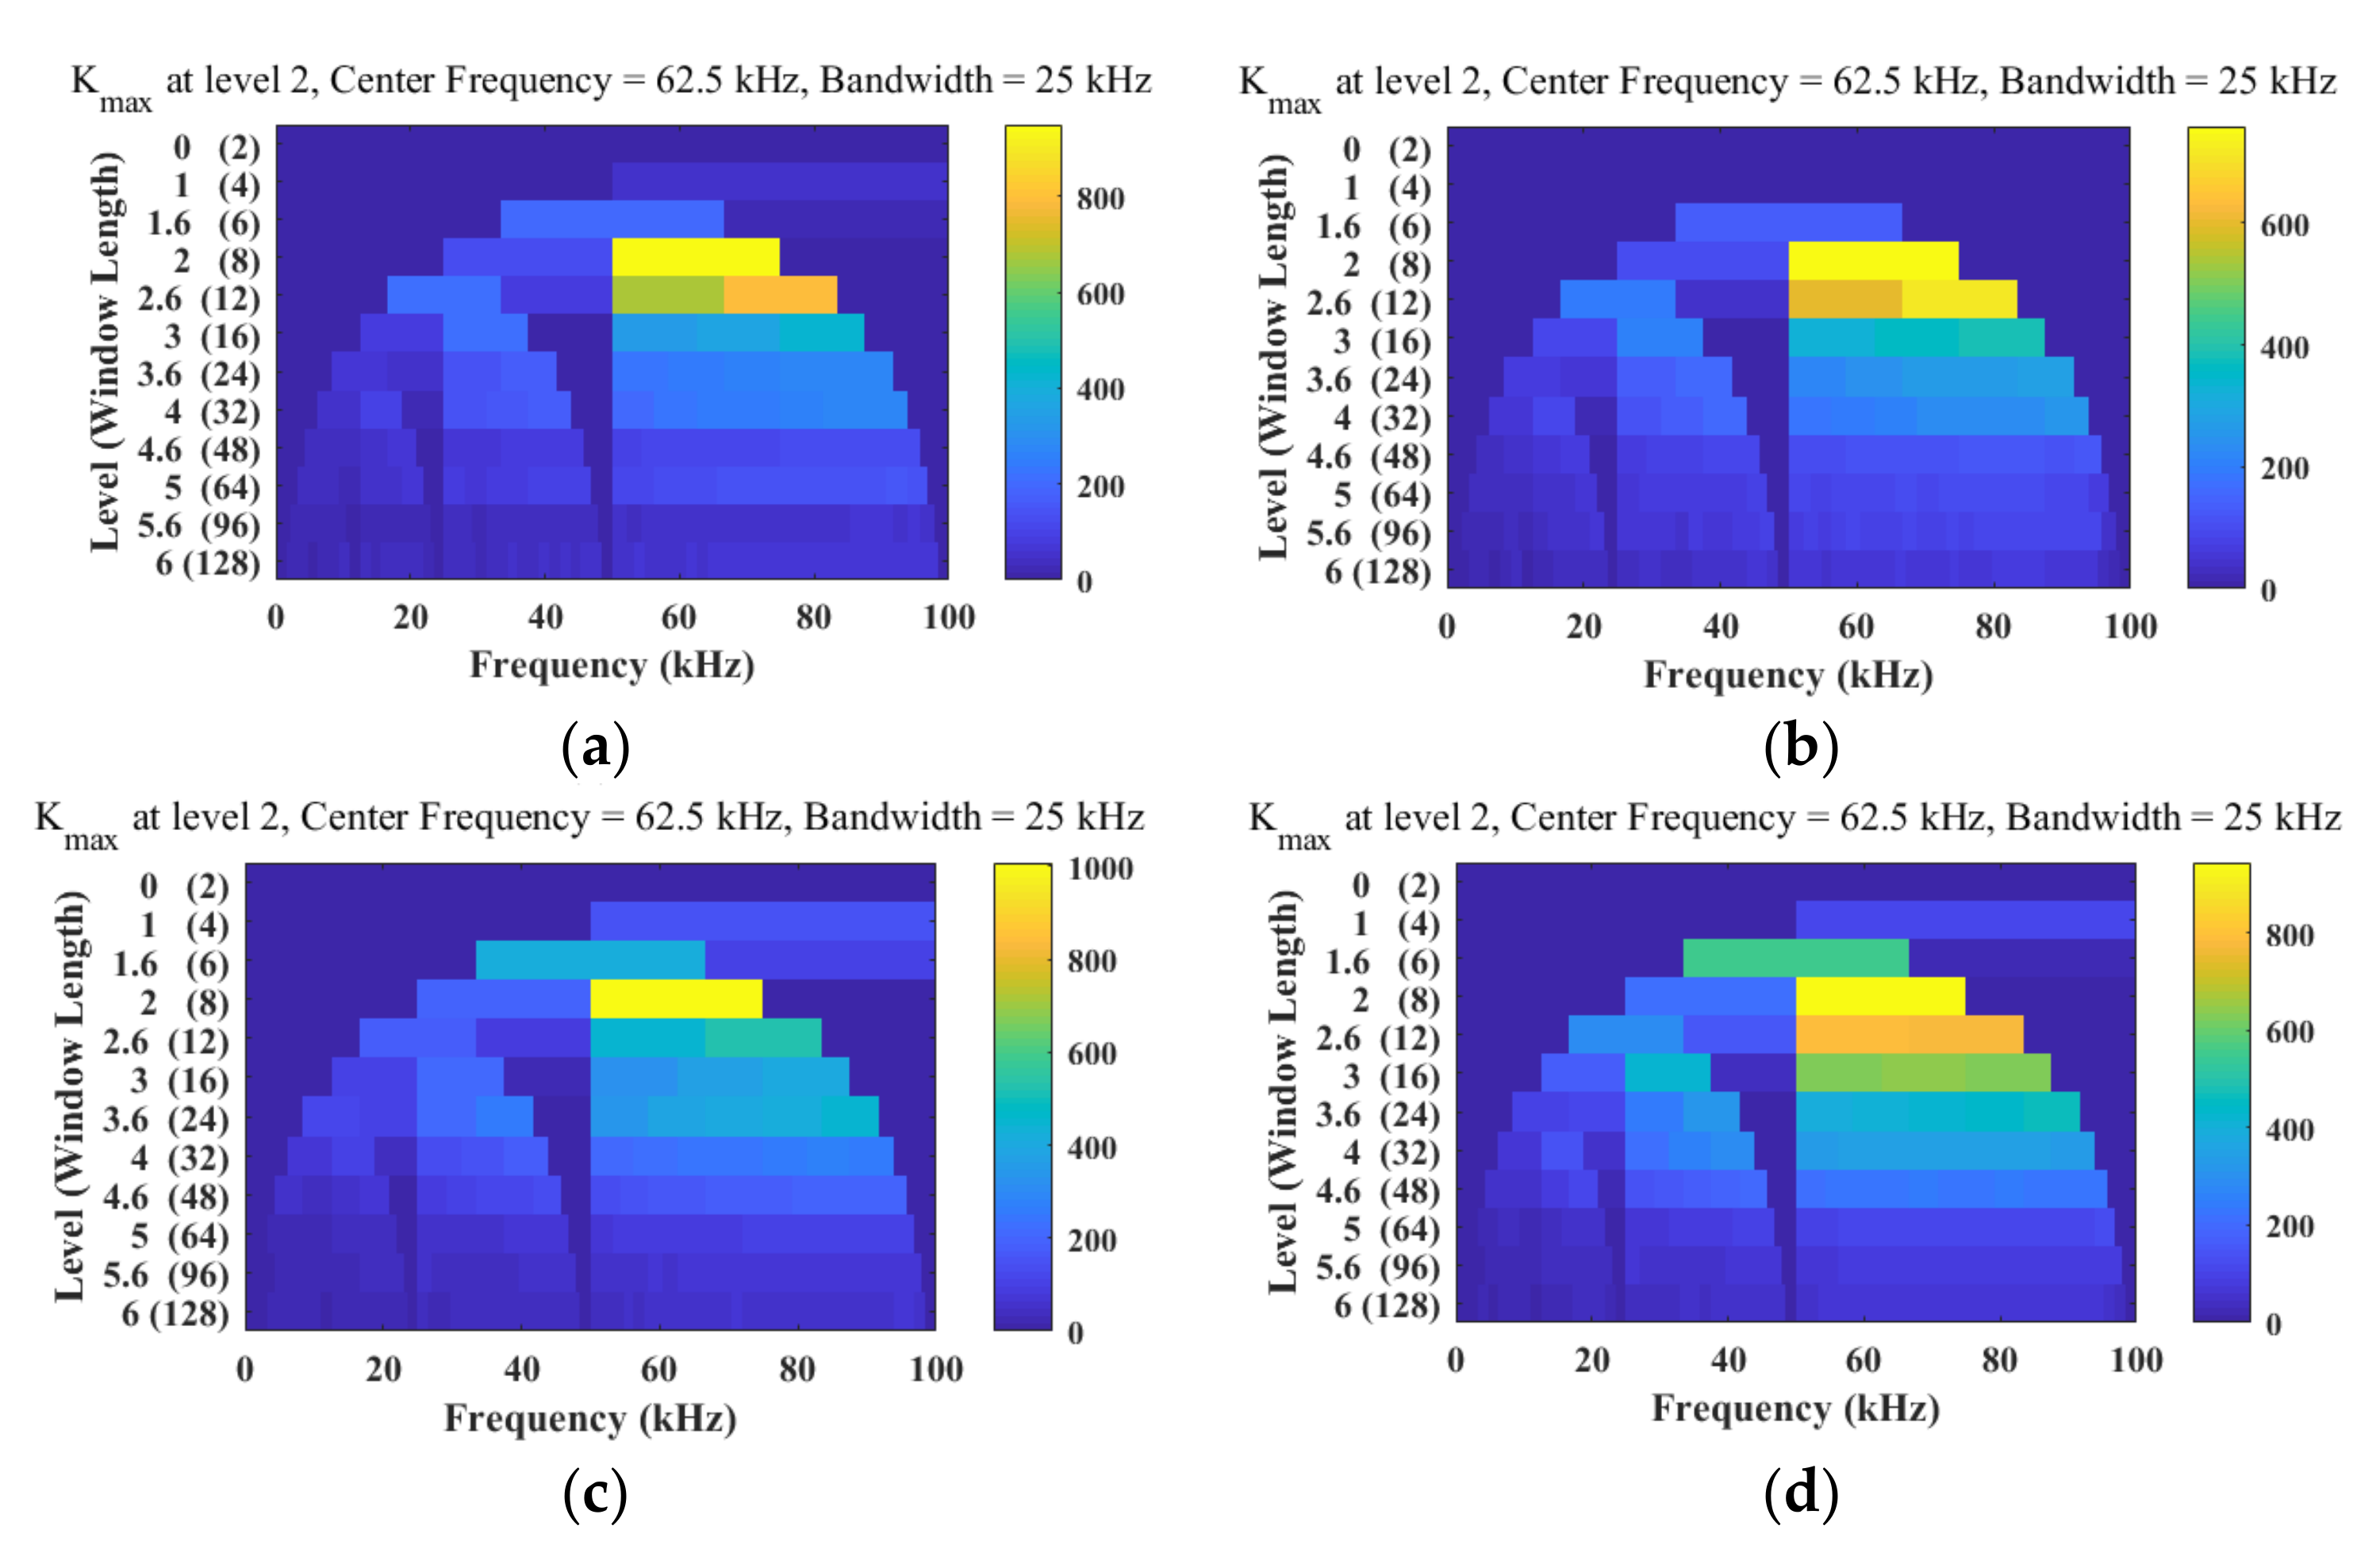
Kurtosis analysis was performed on the currents on both sides of the line, and the optimal number of decomposition layers and the frequency band with the most obvious features were selected according to the kurtosis diagram, as shown in
Figure 7. The yellow part represents the current information with the most obvious characteristics.
It can be seen from
Figure 7 that the optimal number of decomposition layers for fault current kurtosis analysis is two, regardless of whether it is an internal or external fault. In the protection scheme of this paper, the third frequency band (50–75 kHz) of the two-layer wavelet packet decomposition is uniformly selected as the frequency band for fault feature analysis because of its obvious characteristics.
It can be seen from Equations (3)–(6) that the observation time of the frequency-domain current model on both sides of the line is within a certain time window after the fault traveling wave is detected at the protection installation on the corresponding side. Thus, when analyzing the frequency spectrum fluctuation of the current ratio, the time 5 ms after the fault current is detected by the protection should be selected as the observation time window of the protection criterion.
When an internal fault at a distance of 0.8
l from the M side in the line and an external fault at a distance of 0.2
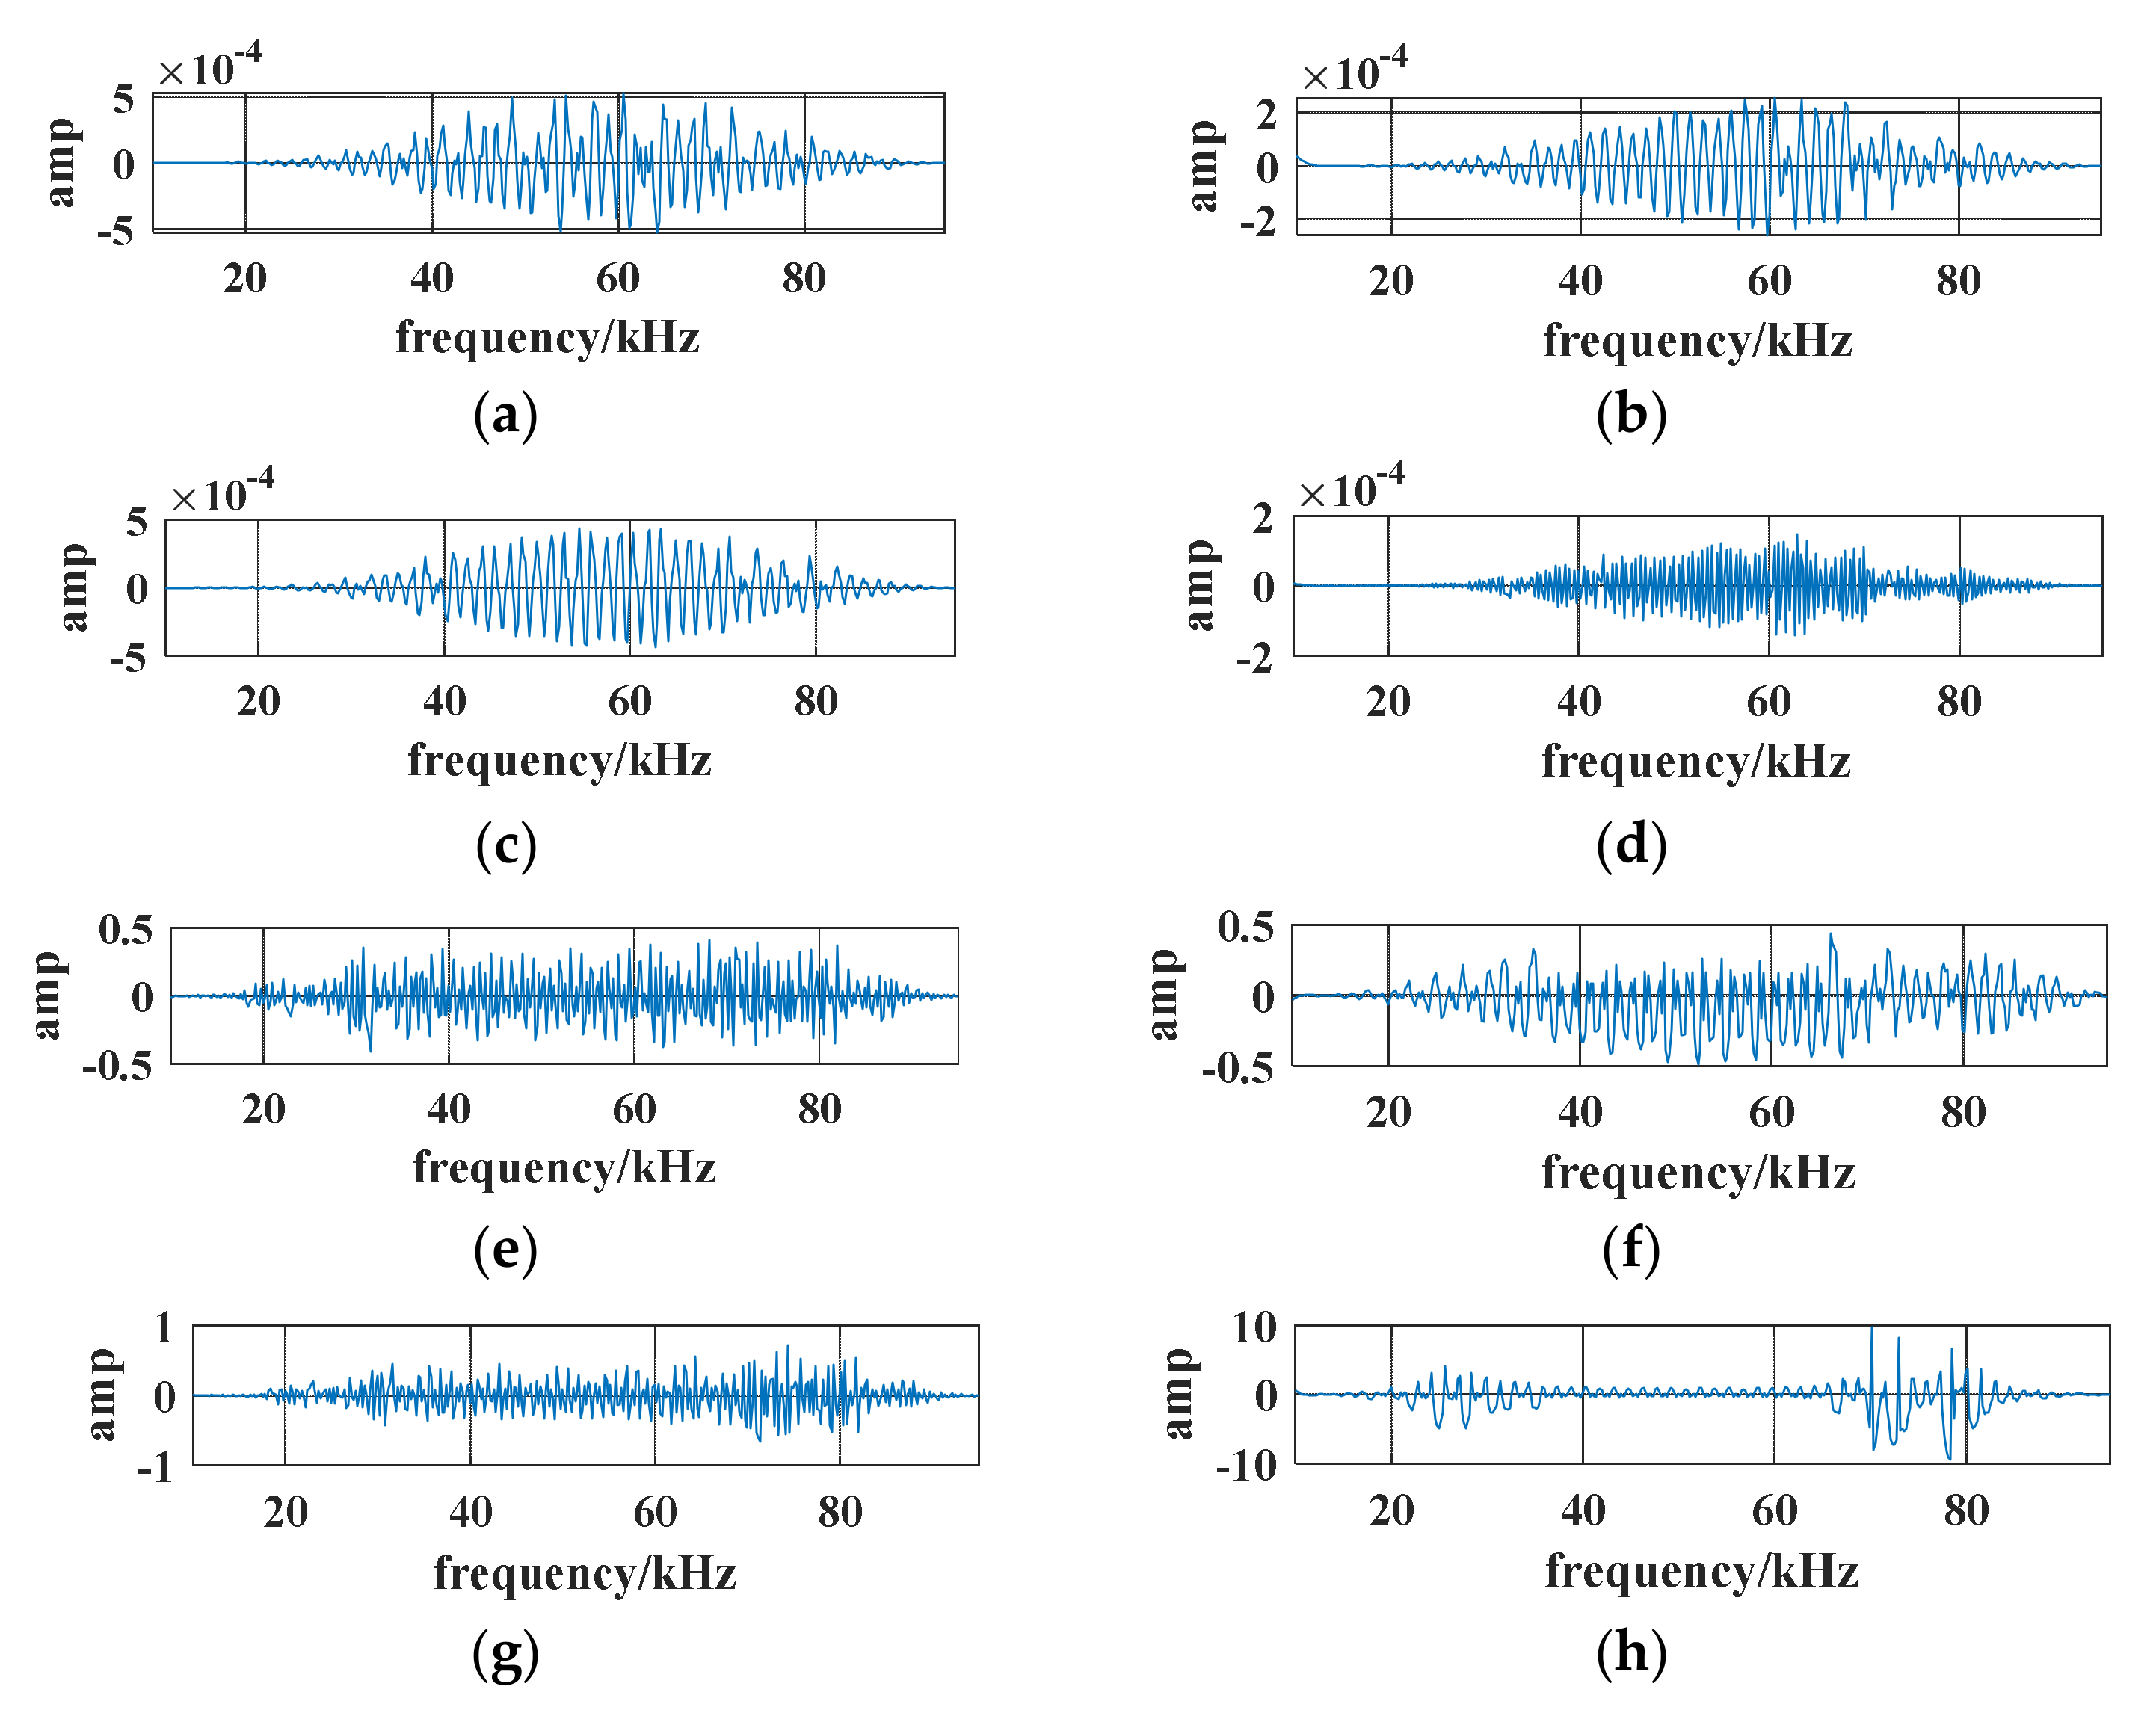
l from the N side of the line are set, the fault currents in the 5 ms data window after the faults are detected by the protection on both sides are subjected to phase-mode transformation. After wavelet packet decomposition, the simulation results of the line-mode current spectrum fluctuation curve in the third frequency band (50–75 kHz) and the fluctuation curve of the frequency-domain current ratio are shown in
Figure 8. Through
Figure 8, the difference in the spectrum current fluctuation can be determined.
It can be seen from
Figure 8a,c that, due to the different distances from the fault point to both sides of the line, the frequency spectrum fluctuations on both sides of the line are different. It can be seen from
Figure 8b,d that, because the fault current is transmitted into the protected line and propagates from one side to the other side through the full length of the line, the frequency spectrum fluctuations on both sides of the line are different. In the criterion analysis of the current ratio, the current of one side nearer to the fault point is taken as the numerator and the current farther from the fault point is taken as the denominator because, in this way, the characteristic differences are more obvious. According to the selection of the protection criterion components, the fluctuation curve of the current ratio in the fault frequency domain of an internal fault can be obtained from
Figure 8g, and that of an external fault can be obtained from
Figure 8h. It can be seen from the figure that the frequency spectrum fluctuations of the current ratio in the frequency domain are very different between internal and external faults. The variance in the fluctuation curve of the current ratio can be used to identify the fault location. When an internal fault occurs, the current ratio fluctuates at multiple frequency points, but the fluctuation range is small, which indicates the variance in the corresponding volatility curve is small; when an external fault occurs, the fluctuation in the current ratio is relatively regular and the fluctuation range is large, and the variance in the corresponding volatility curve is large.
3.3. Relay Protection Scheme
Following the above analysis, the variance in the spectrum fluctuation curve of the frequency–domain current ratio in the third frequency band (50–75 kHz) with the most obvious characteristics was selected as the basis for fault identification of internal and external faults, and the corresponding protection criterion was selected according to the moment when the fault is detected on both sides. When the M side detects the fault first, the protection criterion is
IM/
IN, and when the N side detects the fault first, the protection criterion is
IN/
IM. When the protection is activated, the spectrum fluctuation variance
K3 of the frequency-domain ratio of the line-mode current within 5 ms can be calculated. To be specific, 100 current values on both sides of the line are evenly sampled and calculated 5 ms after the fault occurs, taking the calculated current ratio as
x1,
x2, …,
x100. To facilitate data identification, the calculated value of
K3 is amplified by 10 times, which is shown in Formula (8).
where
M represents the mean of the 100 calculated current ratios.
In the above formula, the variance is selected because it can reflect the fluctuation in the signal.
When
K3 exceeds the threshold, it can be identified as an external fault, and when
K3 is less than the threshold, it can be identified as an internal fault. The protection criterion expression is shown as follows:
where protection criterion setting value
Kset is set to be 50. In this study, simulations were performed in many conditions, and it was found that setting the threshold at 50 can correctly identify internal and external faults with enough margin.
When the protection detects a fault, it immediately utilizes the fault criteria to identify the fault, and the identification steps are as follows:
(1) After the faults are detected on both sides of the protection, the fault current data within a 5 ms time window after the fault current is sensed by the protection installations are collected, the additional component of the fault current is calculated, and the phase-mode transformation is performed;
(2) Two-layer wavelet packet decomposition is performed on the line-mode components of the additional fault current on both sides;
(3) The wavelet packet reconstruction coefficient of the third frequency band of the line-mode current on both sides is taken for analysis, the protection criterion is selected according to the selection principle of the protection criterion, and the frequency spectrum of the corresponding frequency domain current ratio is obtained;
(4) The upper and lower peak envelope curve and the mean curve for the frequency spectrum of the current ratio in the frequency domain are calculated, and the spectrum fluctuation curve of the de-averaged frequency domain current ratio is obtained;
(5) The variance in the spectrum fluctuation curve of the current ratio in the frequency domain is obtained and compared with the protection criterion threshold. If it is less than the threshold, it is determined to be an internal fault; if it is greater than the threshold, it is determined to be an external fault.
5. Conclusions
Based on the analysis of the frequency components of the wave process of the transmission line, in this study, the spectral characteristics of the transient current on both sides of the protected line were analyzed. Through wavelet packet decomposition, the time-domain current measured at the protection installation was converted into the frequency-domain current in different frequency bands. According to the spectral fluctuation difference in the frequency-domain current ratio of the line-mode fault component in the transient state of the internal and external faults, a new protection principle based on the ratio of currents in the frequency domain on both sides was proposed. The main conclusions obtained are as follows:
(1) When there is an internal fault, the frequency spectrum of the current ratio in the frequency domain on both sides of the protected line is impacted by multiple frequency components, causing fluctuations at multiple frequency points, but the amplitude is small. When a fault occurs in the middle of the protected line, since the fault current spectra on both sides should be basically the same, the fluctuation amplitude of the current ratio is the smallest. In the case of an external fault, since the fault transient current transmitting into the protected line spreads through the entire length of the line, the amplitude of the frequency-domain current on both sides is significantly different; thus, the frequency spectrum of the ratio should have a regular fluctuation with relatively large scale.
(2) Using spectral kurtosis to select the optimal number of wavelet packet decomposition layers and the frequency band with the most obvious characteristics, it was found that the optimal number of decomposition layers is two and optimal size of the analysis window is eight. The de-averaged variance in the current ratio fluctuation curve in the frequency domain can effectively identify the spectral fluctuation characteristics of faults, so as to achieve precise identification of internal and external faults. When the variance K3 is larger than 50, an external fault is identified; otherwise, an internal fault is identified.
(3) The protection scheme based on the fluctuation of the current ratio in the frequency domain on both sides of the transmission line is basically not affected by the transition resistance, and can perform well for different fault types and different fault locations, precisely distinguishing internal and external faults.


