1. Introduction
The implementation of computational methods for the digitization of sound, through the Fast Fourier transform (FFT), has allowed important advances in Music Information Retrieval Systems [
1,
2], in the recognition and identification of Musical Instruments [
3,
4] and the characterization of musical audio records.
To characterize sound in general, and musical sound in particular, it is necessary to know the attributes of pitch, intensity, duration, and timbre. The first three characteristics of sound correspond respectively to the acoustic magnitudes of frequency, intensity, and time, and they are directly measurable quantities. Timbre, however, is a multi-dimensional and shallowly defined attribute that allows one to distinguish between different sounds even when they have the same intensity, duration, and tone; that is, it allows discriminating sounds of different musical instruments even when it is the same musical note, with the same duration and the same intensity. The timbre of a specific musical sound (with a fundamental frequency in the tempered musical scale) is mainly related to the attack, sustain, and decay lapses of that frequency, the tonal variation, and the harmonics present [
5,
6].
The problem of univocal characterization of musical timbre raises the need to elaborate descriptors (derived magnitudes, coefficients, or functional) that evaluate timbre from digital audio records [
7]. This is important for problems such as Automatic Music Transcription (AMT) [
8]. It has been identified that, for audio recordings, it is necessary to have efficient systems that identify the different musical timbres with high precision and quantitatively [
9].
Since musical timbre is a phenomenon of auditory perception, many of the investigations are developed in the line of psychoacoustics, aiming to evaluate verbal descriptors that reveal measurable attributes of musical timbre [
10,
11,
12,
13], timbre attributes of musical sounds, and visual colors through subjective perception evaluation experiments [
14]. Other, more recent studies focus on the analysis of timbre similarity between auditory images of various types of musical instruments and the linguistic-cognitive dimensions of timbres through a model where the timbre representation is contained in 20 dimensions [
15,
16].
Although the psychoacoustic perception of musical timbre cannot be ignored, it must be recognized that the main timbral characteristics must be somehow inscribed within the FFT that enables the recording and subsequent reproduction of musical sound. For the sake of argument, suppose any significant timbral characteristics that are not contained in the FFT performed on a musical audio record. Then, the deconvolved audio (inverse convolution) of the reproduced digital record could not be distinguished timbrally. However, this fact does not happen in musical digitization as we could distinguish timbral aspects from the deconvolved audio. Therefore, the FFT contains all the significant timbral characteristics.
Other research focuses on the presentation of an exhaustive collection of acoustic descriptors in the form of coefficients or functional (Timbre Toolbox, Librosa, etc.) that can be computationally extracted from the statistical analysis in the digitization of the spectrum (FFT). This focuses mainly on the statistical and mathematical characterization of the maximums in the FFT, such as the mean value in frequency (centroid) and amplitude, standard deviation, kurtosis, roots or poles of the distribution, arithmetic and geometric sequences in frequency, mean values and mean-squares of the amplitudes, among others [
1,
9,
16,
17,
18,
19,
20,
21]. Currently, there is no consensus on which and how many acoustic descriptors are to characterize musical timbre. However, it is recognized that many of them are derivatives or combinations of others and that in general they are correlated with each other. We wonder, then, what would be the minimum timbral descriptors that allow such a characterization of the musical timbre.
Peeters and collaborators [
22] have studied the 34 most common statistical and mathematical descriptors and have found that only 9 descriptors are relatively independent with a correlation of 60%, and only 7 are so with a 50% correlation, which suggests that future studies on musical timbre should consider as a minimum: (1) a measure of the central tendency of spectral descriptors that vary in time; (2) a measure of the temporal spread of time-varying spectral descriptors; (3) a descriptor of the energy content of the sound signals and of the time envelope of the energy; (4) a periodicity descriptor. Peeters and collaborators [
22] add: “It should be noted that this minimum requirement characterizes few or none of the previous studies on the perception of musical timbre”. Since we are studying only musical monophonic sounds of aerophones, we have been left with a minimum set of timbre descriptors from a single FFT analysis, excluding psychoacoustic and perceptual characteristics for quantification.
Despite recent advances using verbal (psychoacoustic) descriptors as statistical or mathematical descriptive analysis of musical timbre, this is still an open-ended problem. Taffeta et al. [
23] state that most acoustic descriptors fail to examine all sound parameters that could be important when attempting to analyze timbral dimensionality in musical sounds and it constitutes a challenge for the automated identification of musical instruments and the quantitative evaluation of the “quality” of the sound in melodics, simple or compound fragments (polyphonic music).
An alternative approach is to construct the timbral descriptors from musical acoustics, using by analogy the analysis and digital processing of spectra in other areas of knowledge. FFT provides a representation in the two-dimensional plane of the frequencies and intensities (alternatively energy-frequency) present in a signal. Spectral analysis techniques consist of describing and interpreting the statistical distribution of the amplitudes for different frequencies. In that sense, it does not depend on the wavelength or frequency analyzed. Therefore, an infrared spectrum (Chemistry), visible (Astronomy), signals from ultrasound, Electroencephalograms and electrocardiograms (Medicine), seismic (Geology) and sonic (Ultrasound for failure analysis, or mechanical vibrations in acoustics and Engineering) are equivalent. From the physical point of view, and also from the mathematical description, an audio FFT spectrum does not differ from the spectra obtained in Mechanical Engineering for the analysis of vibrations, or from the infrared (IR) spectra in Chemistry for the rotational and vibrational oscillations of molecules.
The objective of this work is to propose a minimum set of acoustically motivated timbral descriptors (functional mathematical or dimensionless coefficients) that allow the computational extraction of timbral information from musical records using the FFT. To evaluate the effectiveness of these timbral descriptors, an empirical study of the timbral characteristics in digital musical sounds of a sample of wooden aerophones is presented: Clarinet, Bassoon, Transverse Flute, and Oboe.
This paper is organized as follows: the next section presents the methodology for obtaining the spectra and their quantification of the audio records. Then, the Timbral coefficients section shows the coefficients or descriptors and their evaluation for the selected aerophones. In the Spectral Signatures section, the chromatogram for the fourth octave of the tempered musical scale and the spectral signature (“fingerprint”) that characterizes each aerophone studied are evaluated. Finally, conclusions and future work directions are presented in the last section.
2. Methodology
The aerophone audio records were obtained from the TinySOL open-source sound library [
24] which contains recordings of individual sounds, played ordinarily, at a level of dynamic/intensity mezzo-forte, in a WAV audio format that minimizes information losses, sampled at 44.1 kHz on a single channel (mono) at 16-bit depth. From this library, we have restricted our analysis to only some instruments of the woodwind family of a typical western symphonic music orchestra, these are the Transverse Flute (Fl), Oboe (Ob), Clarinet (Cl), and Bassoon (Bn).
The selection of the family of wooden aerophones is justified by having the greatest timbral diversity and more melodic possibilities for functioning as a solo instrument within a symphony orchestra but also presenting well-differentiated timbral characteristics when they function as a set of instruments [
25].
Although Pons, Jordi, et al. [
26] make the timbre analysis based on spectrograms, we propose in this work a simpler alternative way studying the FFTs since these must contain the same relevant information of the musical timbre, applied to monophonic sounds and considering the proposed set of instruments. This simpler alternative considers coefficients extracted from the full FFT spectra, instead of the spectrogram obtained using the short-time FFT.
To calculate the FFT and obtain the frequency spectra, the SciPy library module in Python [
27] is used. Then, for the identification of the local maxima, the find_peaks function in Scipy.signal was used. Next, the tables of the maximum frequencies, expressed in Hz, with relative amplitudes, normalized considering the maximum amplitude value achieved in each spectrum of the FFT, were obtained to compare the various audio spectra with different power levels (Watt) or relative power (dB). Due to the FFT used, which operates on the entire function, information on size, overlap, etc. is not considered in this study.
The calculation of the coefficients was performed on the frequency spectrum of the common range of the instruments studied, corresponding to musical sounds between B3 to D#5 (~246 Hz to ~623 Hz).
The study of acoustic phenomena affirms that all musical instruments consist of a resonator (string, membrane, or resonant tube) whose geometry and materials will determine, for a given impulse, the natural modes of vibration of the generated stationary wave. Thus, the nature of the component materials of the musical instrument, and its geometric shape determine the secondary frequencies and harmonics possible of a mode of vibration or impulse associated with a certain musical note. This is what allows the reproducibility of the sounds for each musical note and consequently of the melodies.
The values of the amplitude of each vibration mode, both for the fundamental frequency and its harmonics and other component partial frequencies, will depend on several factors such as the energy associated with the initial impulse, the losses due to transmission and absorption, and the combination of standing waves (resonances, constructive and destructive interferences due to multiple reflections, reverberation, etc.). However, the distribution of the set of harmonics and the values of the fundamental frequencies and the partial frequencies do not change, even when the amplitudes of the waves are attenuated or intensified in the propagation of the waves inside the resonant cavity (aerophones), along the vibrating string (rubbed string instruments and plucked strings) or on the struck surface (flexible membrane or vibrating surface).
Then, the sound of a musical instrument will consist essentially of a succession of waves, which are characterized by the magnitudes of amplitude and phase. At each instant, the sound is then described by amplitudes (magnitude measured on any scale: intensities, decibels, energy, etc.) and frequencies. Consequently, a Fourier spectrum of a monophonic audio signal is essentially a finite, paired collection of numbers associated, respectively, with the component amplitudes and frequencies.
The discrete distribution of such points in a configuration space can be described in terms of (i) the maximum of the acoustically associated distribution with the sound of the corresponding musical note (fundamental frequency and fundamental amplitude); (ii) the general form of homogeneity and range of variability of the amplitudes of the partial frequencies that accompany the fundamental frequency of the musical sound considered; and (iii) the statistical measurements of the mean amplitudes and middle frequencies.
Quantitatively assessing the musical timbre then involves weighing these three aspects: the fundamental frequency and amplitude, a measure of the secondary or harmonic frequencies present in number and relative importance (assessable through their intensity relative to the fundamental frequency), and a measurement of the grouping of the frequencies present (cadence, monotony, sequence of harmonics, etc.). Two magnitudes (amplitude and frequency) are used for these three aspects (musical sound, shape of the distribution, mean value of the partial sounds). A minimum of six functionals are then required to describe the monophonic musical timbre of individual sounds, in terms of the normalized amplitudes and frequencies present.
3. Results: Timbral Coefficients
It should be considered that, unlike the timbral study of speech and environmental sounds, musical frequencies make up a finite, countable, and discrete set of only 12 different values in each musical octave, for a total of 96 possible fundamental frequencies and their integer multiples that are in the audible range: from 20 Hz to 20 kHz. Therefore, the musical timbre can be characterized by a limited set of timbral coefficients, which are dimensionless quantities related to the frequencies and amplitudes in the Fourier spectrum of the audio records. Motivated by musical acoustics, these coefficients are tonal descriptors and, in essence, functionally describe the discrete distribution of normalized frequencies and amplitudes. As the amplitudes of the spectra of the FFTs are normalized (using the quotient of the amplitude of each partial frequency between the amplitude greater measured in each spectrum) it is possible to compare the relative amplitudes among them. They can be grouped into descriptors of the fundamental frequency (musical scale, 96 possible frequencies) and descriptors of the rest of the partial frequencies that arise when performing the FFT of the audio under analysis (descriptors of the shape of the distribution and statistics frequency distribution), these proposed descriptors are dimensionless coefficients.
The FFT values are essentially a discrete collection of pairs of different amplitudes and frequencies; therefore, they can be summarized by the following dimensionless parameters:
Measurement of the fundamental frequency in relation to the average frequency, (Affinity A).
Measurement of the frequency distribution with respect to the average frequency (Mean Affinity MA).
Quantification of the amplitude of with respect to the collection of amplitudes (Sharpness S).
Quantification of the average amplitude of the pulse collection (Mean Contrast MC).
Descriptor of how close the secondary pulses are to being integer multiples of the fundamental frequency (Harmonicity H).
Descriptor of the envelope through the average slope in the collection of pulses (Monotony M).
The details of these dimensionless timbral coefficients are described next and exemplified for the FFTs of monophonic woodwind sounds.
3.1. Fundamental Frequency Descriptors
In the analysis of acoustic signals, the centroid is usually used to describe the properties of the sound; however, in the timbral characterization, its use entails the difficulty of its acoustic interpretation, since given an audio record, the value of the average frequency (centroid) does not correspond to the envelope, nor to any of the fundamental and harmonic frequencies of the sounds studied. Its interpretation in musical acoustics is difficult because it cannot be correlated with the set of discrete frequencies of musical sounds in the Tempered Scale used in Western music (96 characteristic frequencies). The centroid is defined as the average frequency.
where
are the normalized amplitudes of the frequencies
of the Fourier spectrum. The normalized amplitudes are obtained by dividing the amplitudes values by the amplitude of the fundamental frequency
.
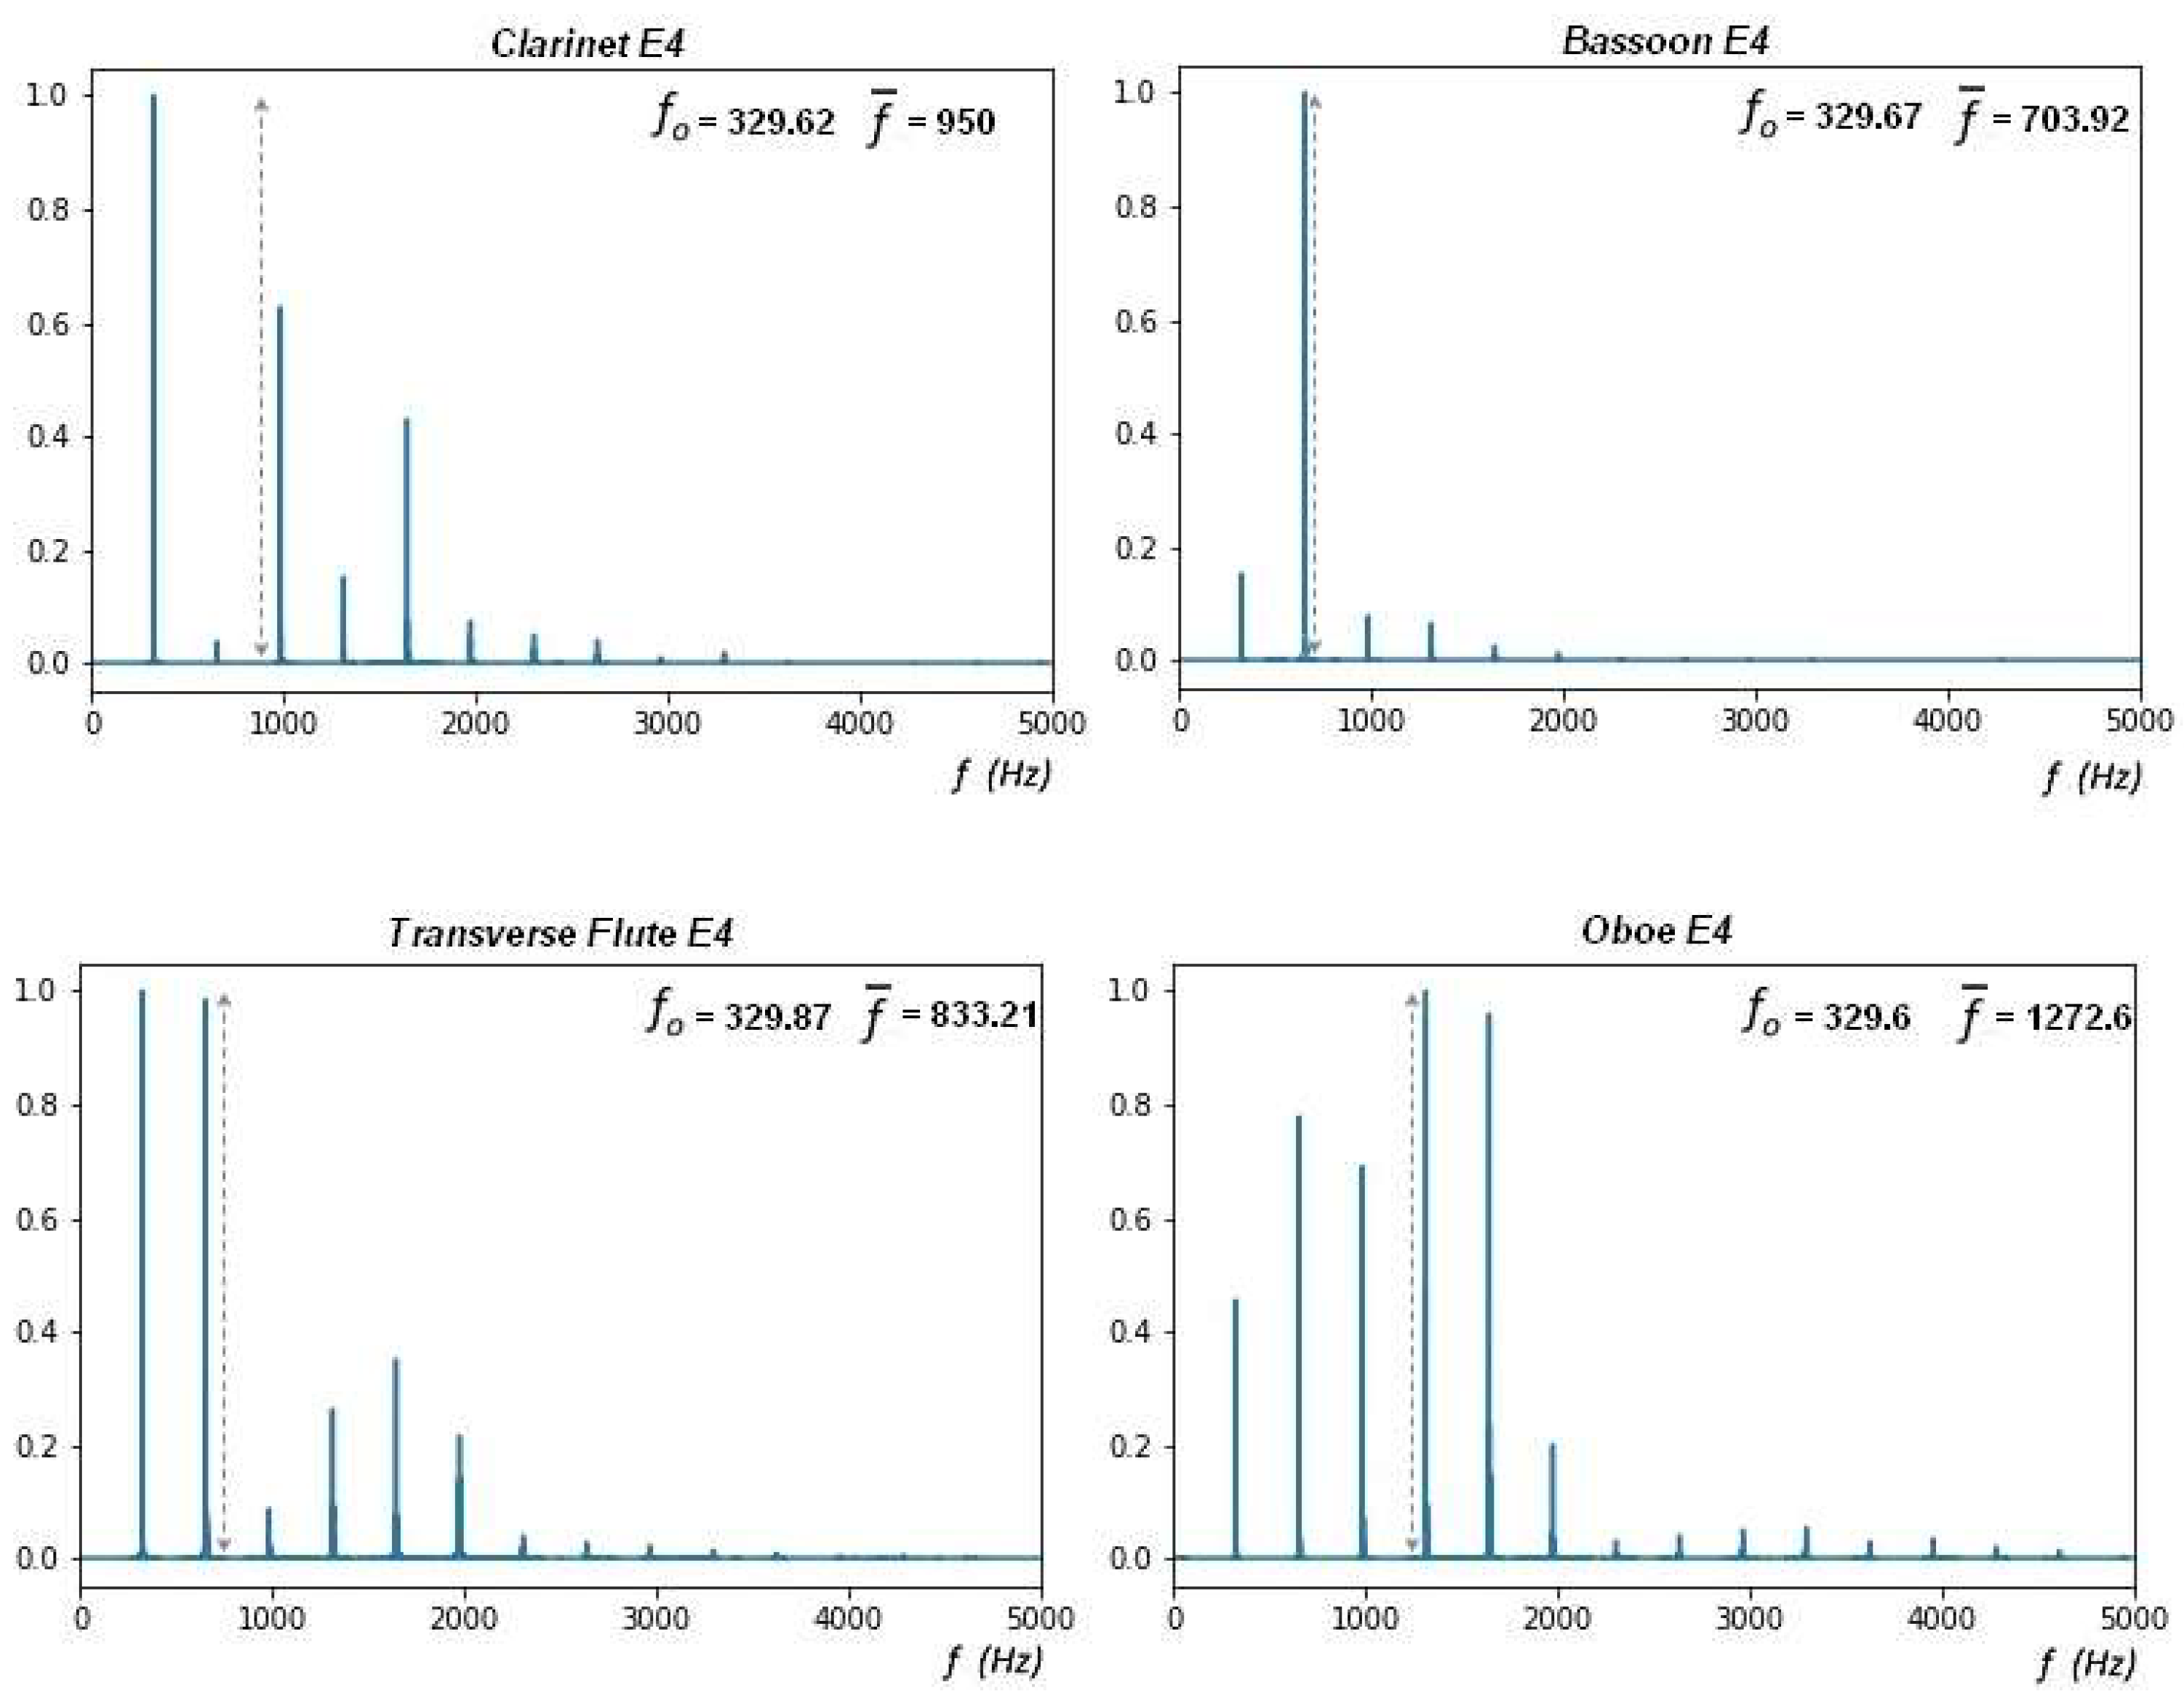
Figure 1 shows the Fourier Transform Spectra of the (4) wooden aerophones studied, particularly for the audio records of the musical sound E4 that corresponds to the nominal frequency of 329.6 Hz. The centroid or mean frequencies of the Fourier spectrum do not correspond to any of the harmonics of the analyzed sound.
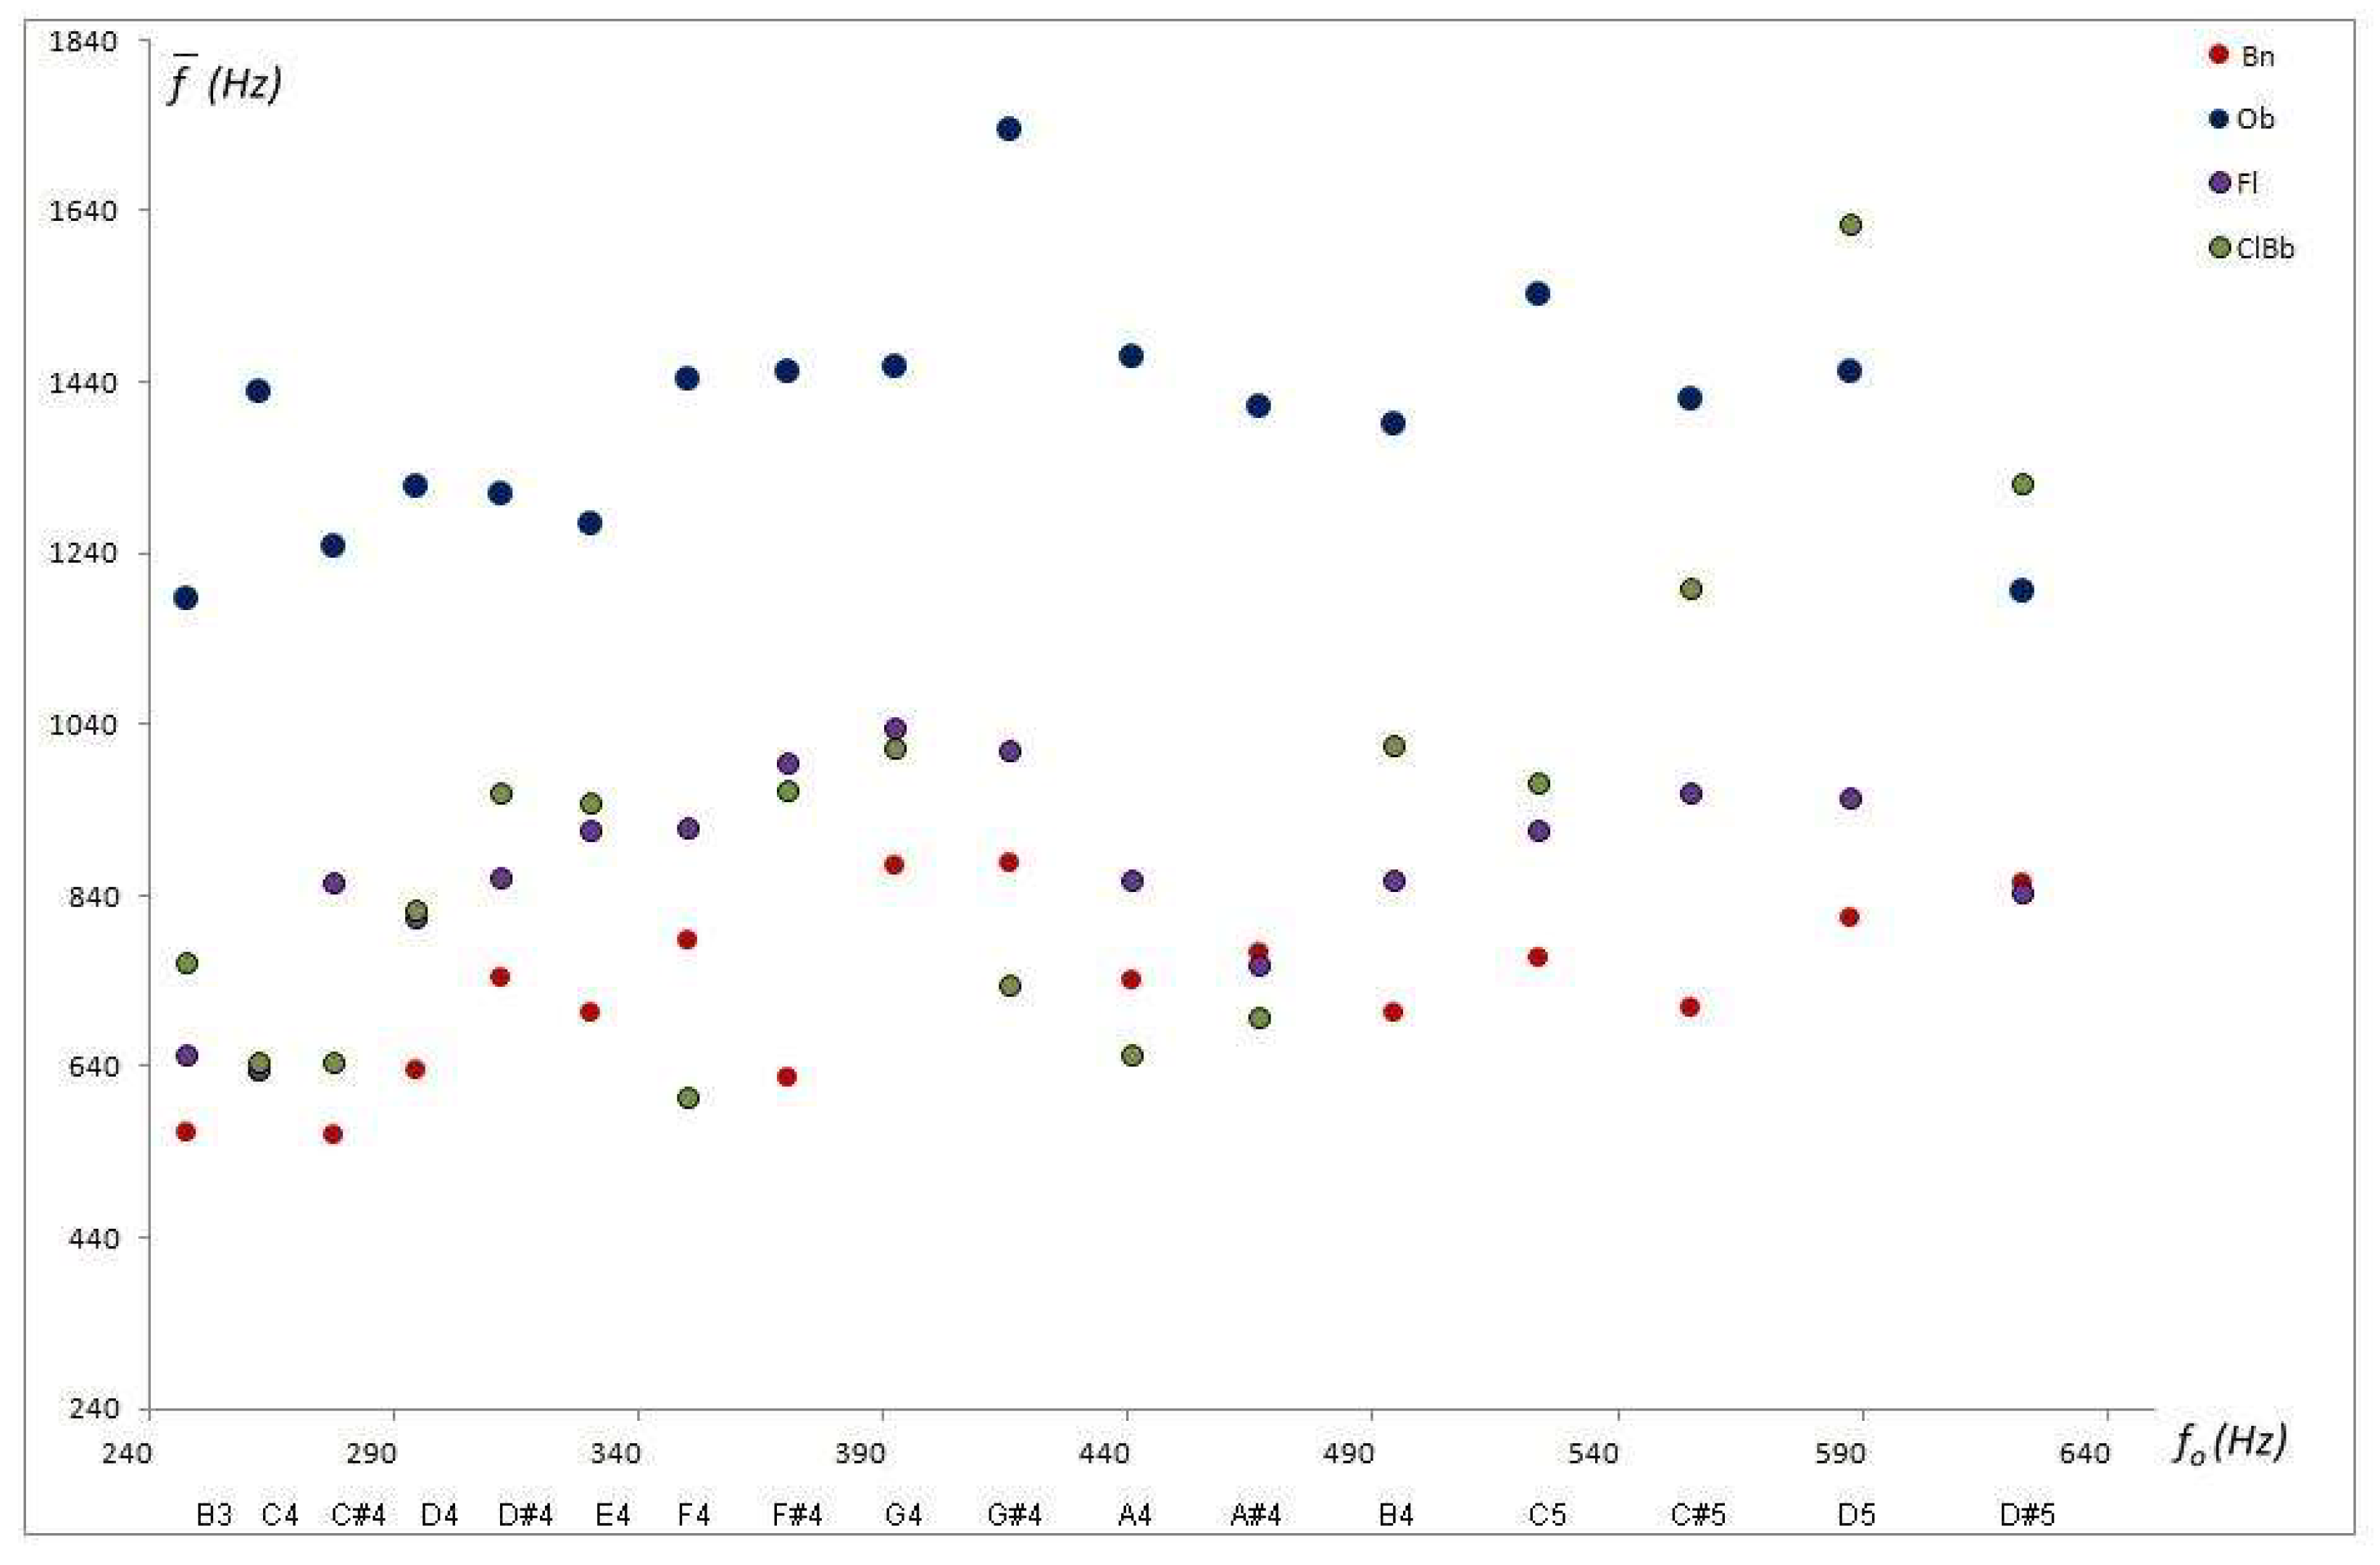
Figure 2 shows the centroid values concerning the musical sounds of the common tessitura of the selected aerophones. It can be seen that the centroid values are almost constant for the frequency range considered.
The centroid, in any case, indicates the presence of frequencies other than the fundamental one, with a distribution of intensities such that the average frequency (centroid) has a magnitude much greater than the frequency prescribed for each musical sound. However, it does not report the harmonicity of the sounds and does not correlate with the “natural” sequence of the musical scale in any of the instruments in the sample.
The fundamental frequency only coincides with the Centroid of the distribution if there is no harmonic or partial frequency in the sound. However, this is impossible in musical instruments whose resonators are exposed to multiple deflections, superpositions, and beats given by the geometry of the resonant tubes and openings, which characterize aerophones.
The separation between the fundamental frequency and the mean value of the frequencies would be important from the point of view of musical acoustics. This quantity can be evaluated through a dimensionless descriptor (Timbral Coefficient) that we call Affinity (A).
The Affinity coefficient describes how far the spectrum is from the ideal case, that is, how far the maximum Principal
is from the mean value in frequency or centroid (
):
If
and
are close there is more “Affinity” with the centroid and
A tends to be one. In
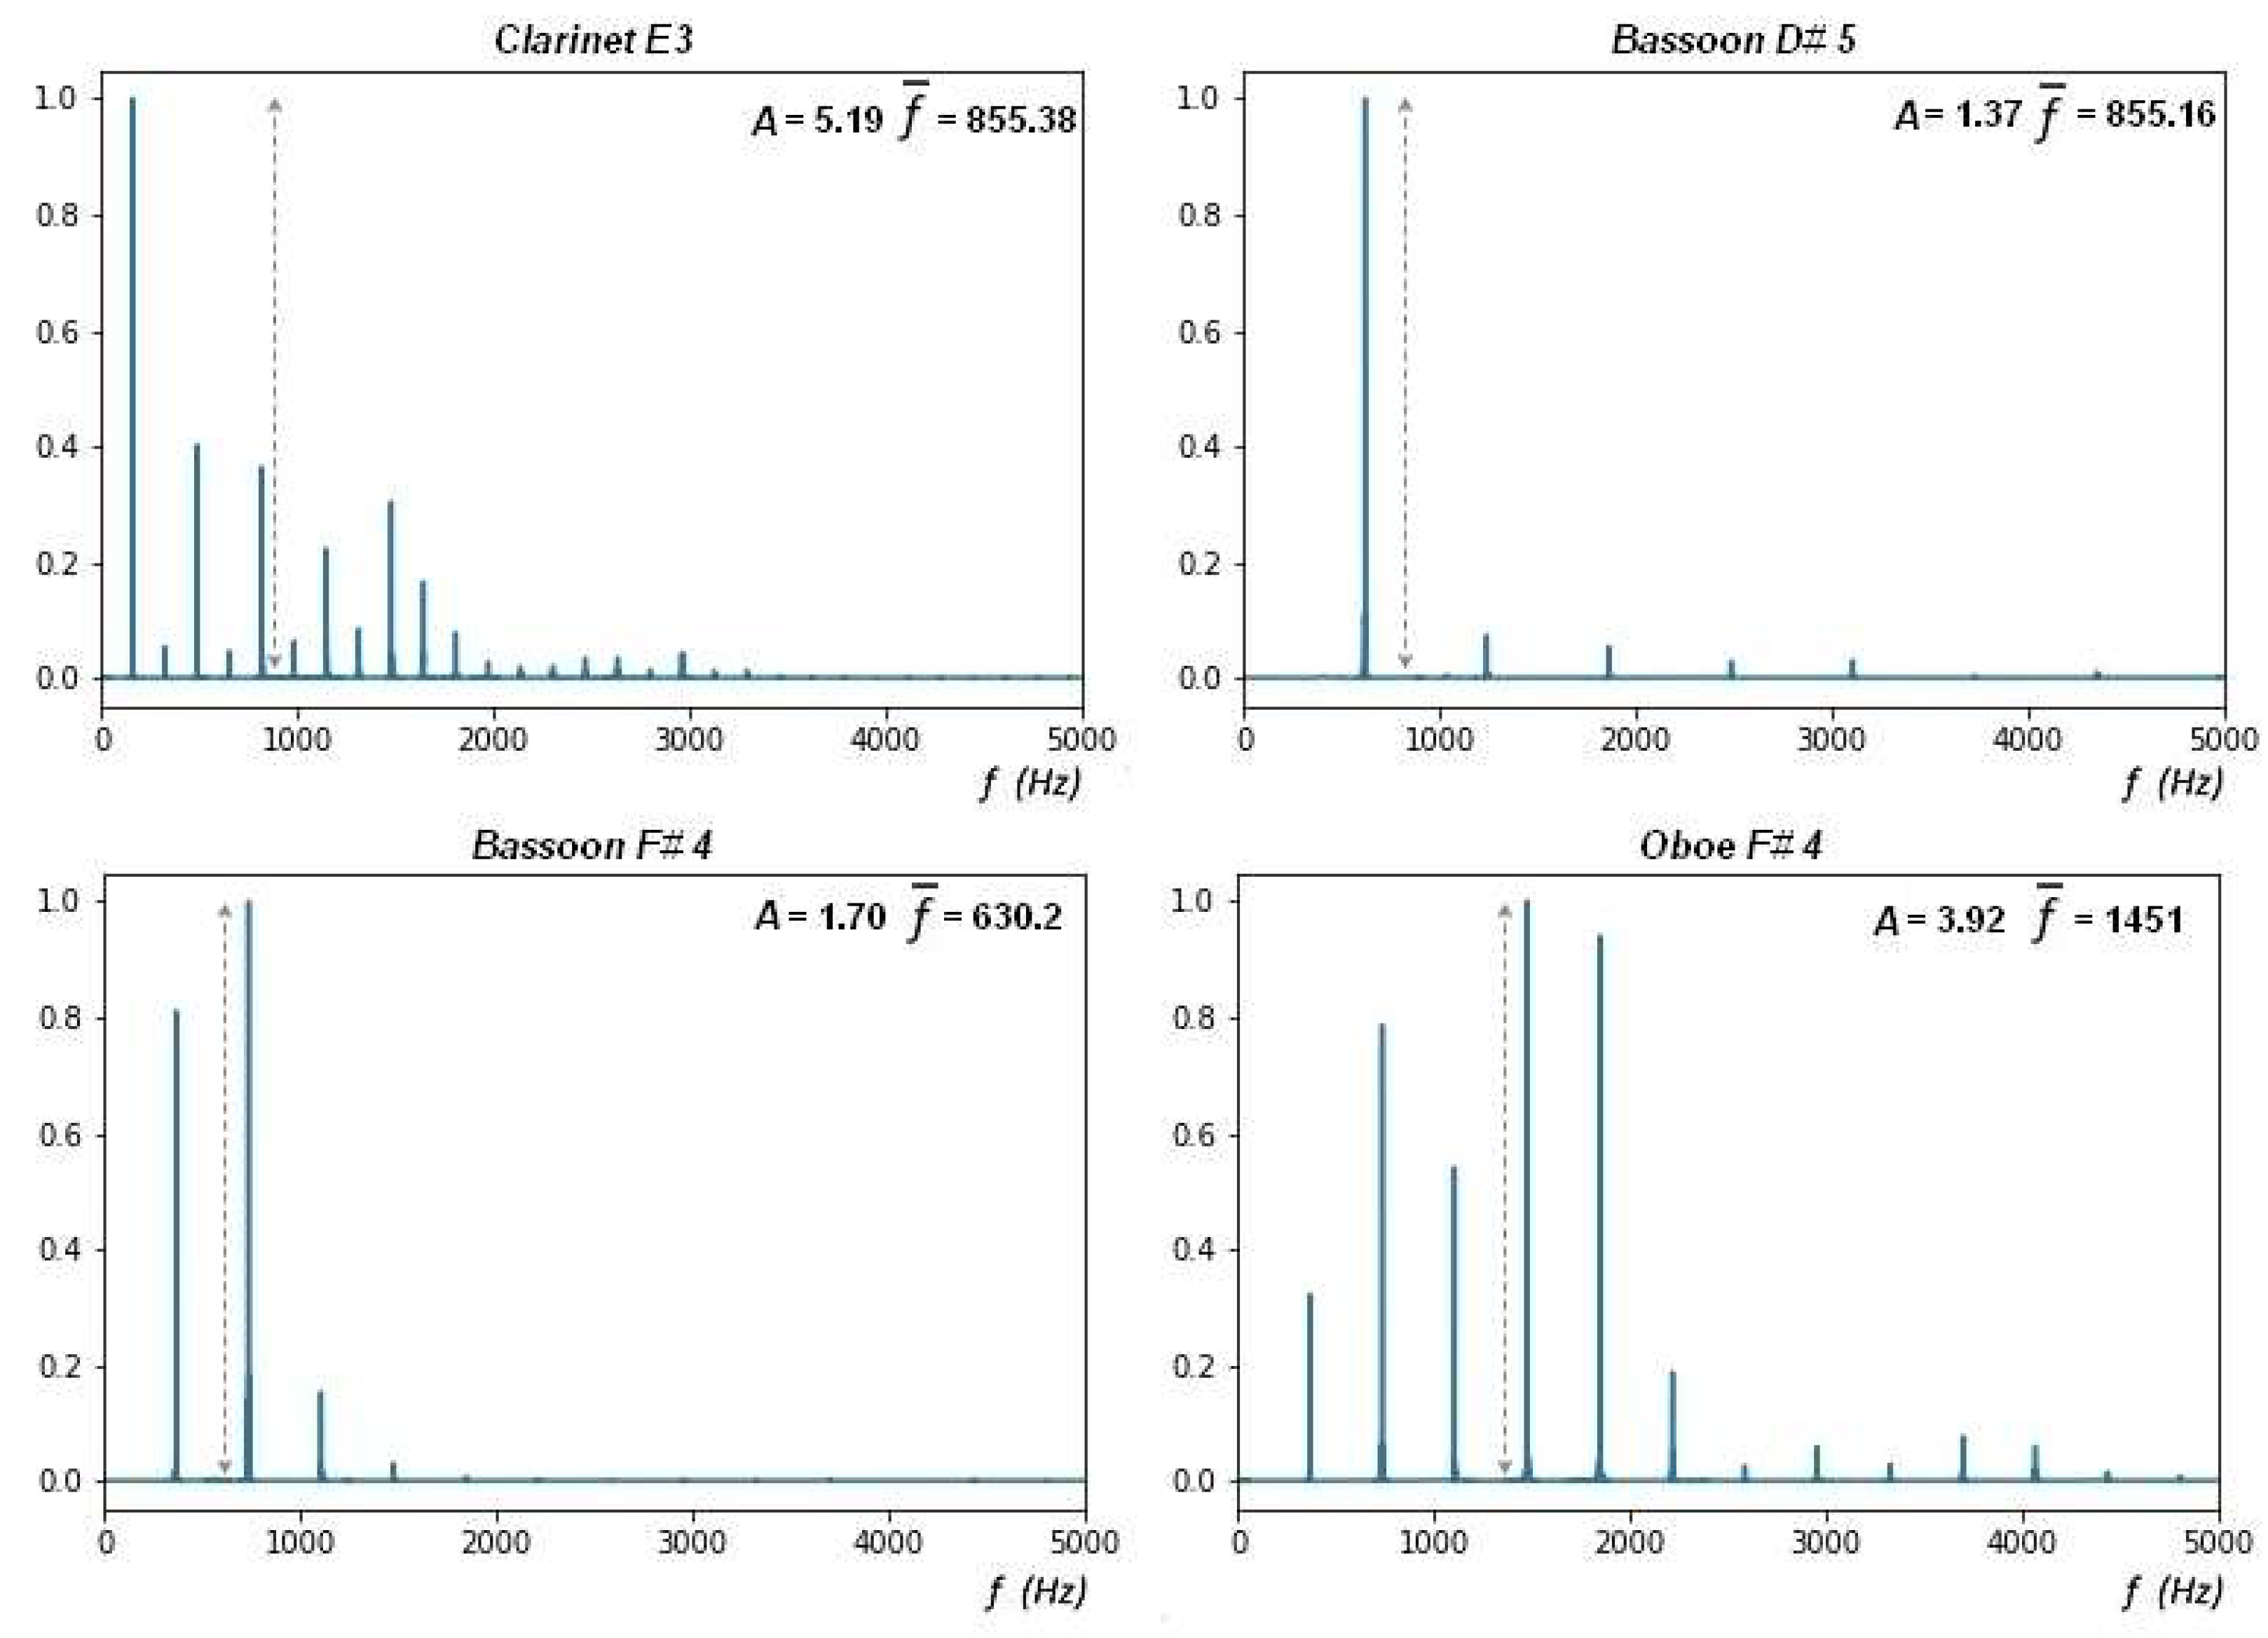
Figure 3, two Fourier spectra with very different coefficients of
A are compared. Moreover, in the upper panel, it is noted that different sounds in different instruments may have the same centroid values. However, their affinity, defined by Equation (2), will be different.
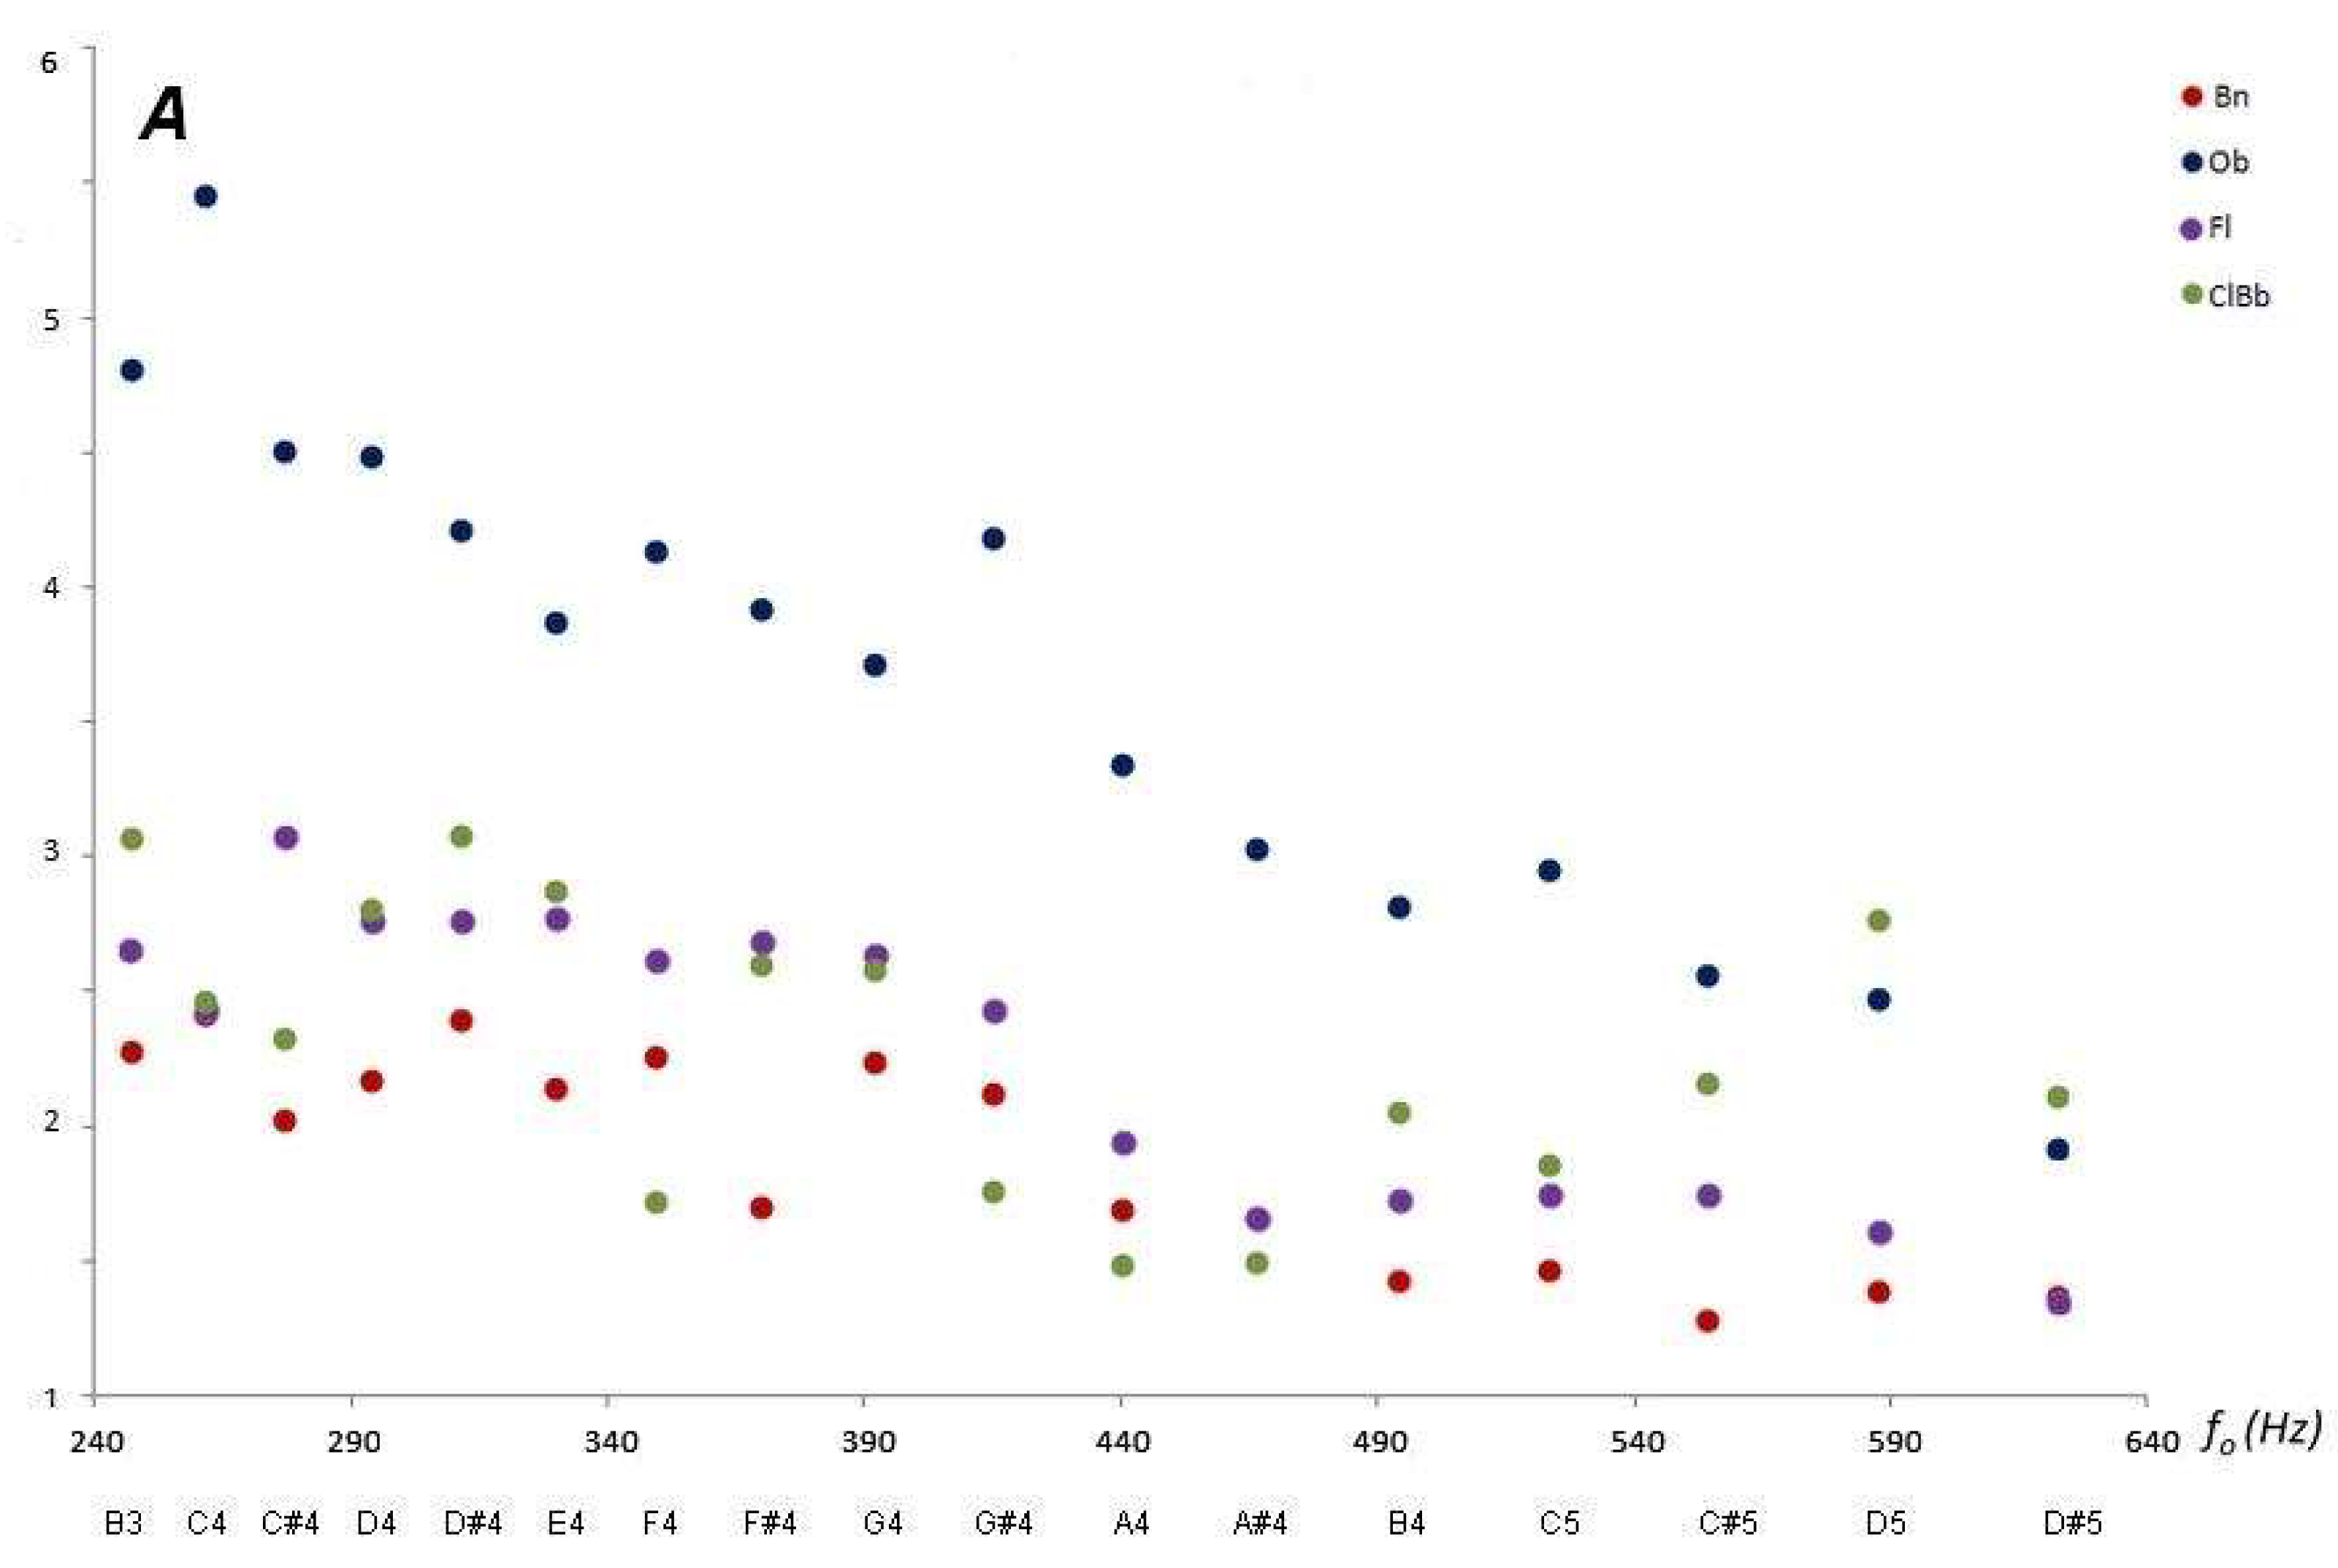
The assessments of Affinity
A for the audio records of the common tessitura (sounds B3 to D#5) for the aerophones studied are shown in
Figure 4.
In
Figure 4, it is observed that the Oboe has less Affinity with the fundamental frequency of the expected musical sounds (high values of
A) and, at the other extreme, the Bassoon has a mean frequency closer to the expected musical sound (values of
A closer to the unit).
If A ≅ 2 then the median or centroid frequency is twice the fundamental, as in the case of the Bassoon. For the Transverse Flute, the average frequency is of the order of 5/2 for the musical notes between B3 and F4, and of the order of 2 for the notes A#4 to D#5. Similarly, the Oboe behaves with more extreme values in both cases.
On the other hand, it can be observed in
Figure 1 that various musical instruments have different amplitudes in their fundamental frequency for normalized Fourier spectra (that is, regardless of the intensity of the recording sound). Furthermore, for the same instrument, the amplitude of the fundamental frequency can, on occasions, remain constant between different musical sounds, or vary in amplitude for different frequencies.
One way to evaluate this variation of the amplitude of the fundamental frequency, concerning the amplitudes of the other frequencies of the spectrum, is by utilizing another dimensionless descriptor or Sharpness coefficient (
S). Defined by:
Thus, the Sharpness (
S) is a measure of the “height”, amplitude, or relative intensity of the fundamental frequency
concerning the distribution, and its acoustic interpretation is immediate: the greater the Sharpness of a musical sound, the easier it will be due to its relative intensity to perceive the fundamental or nominal note that you want to play with the instrument. Ideally, a “pure” sound would be one that would have a single maximum without secondary frequencies
S = 1. By construction
S ≤ 1.
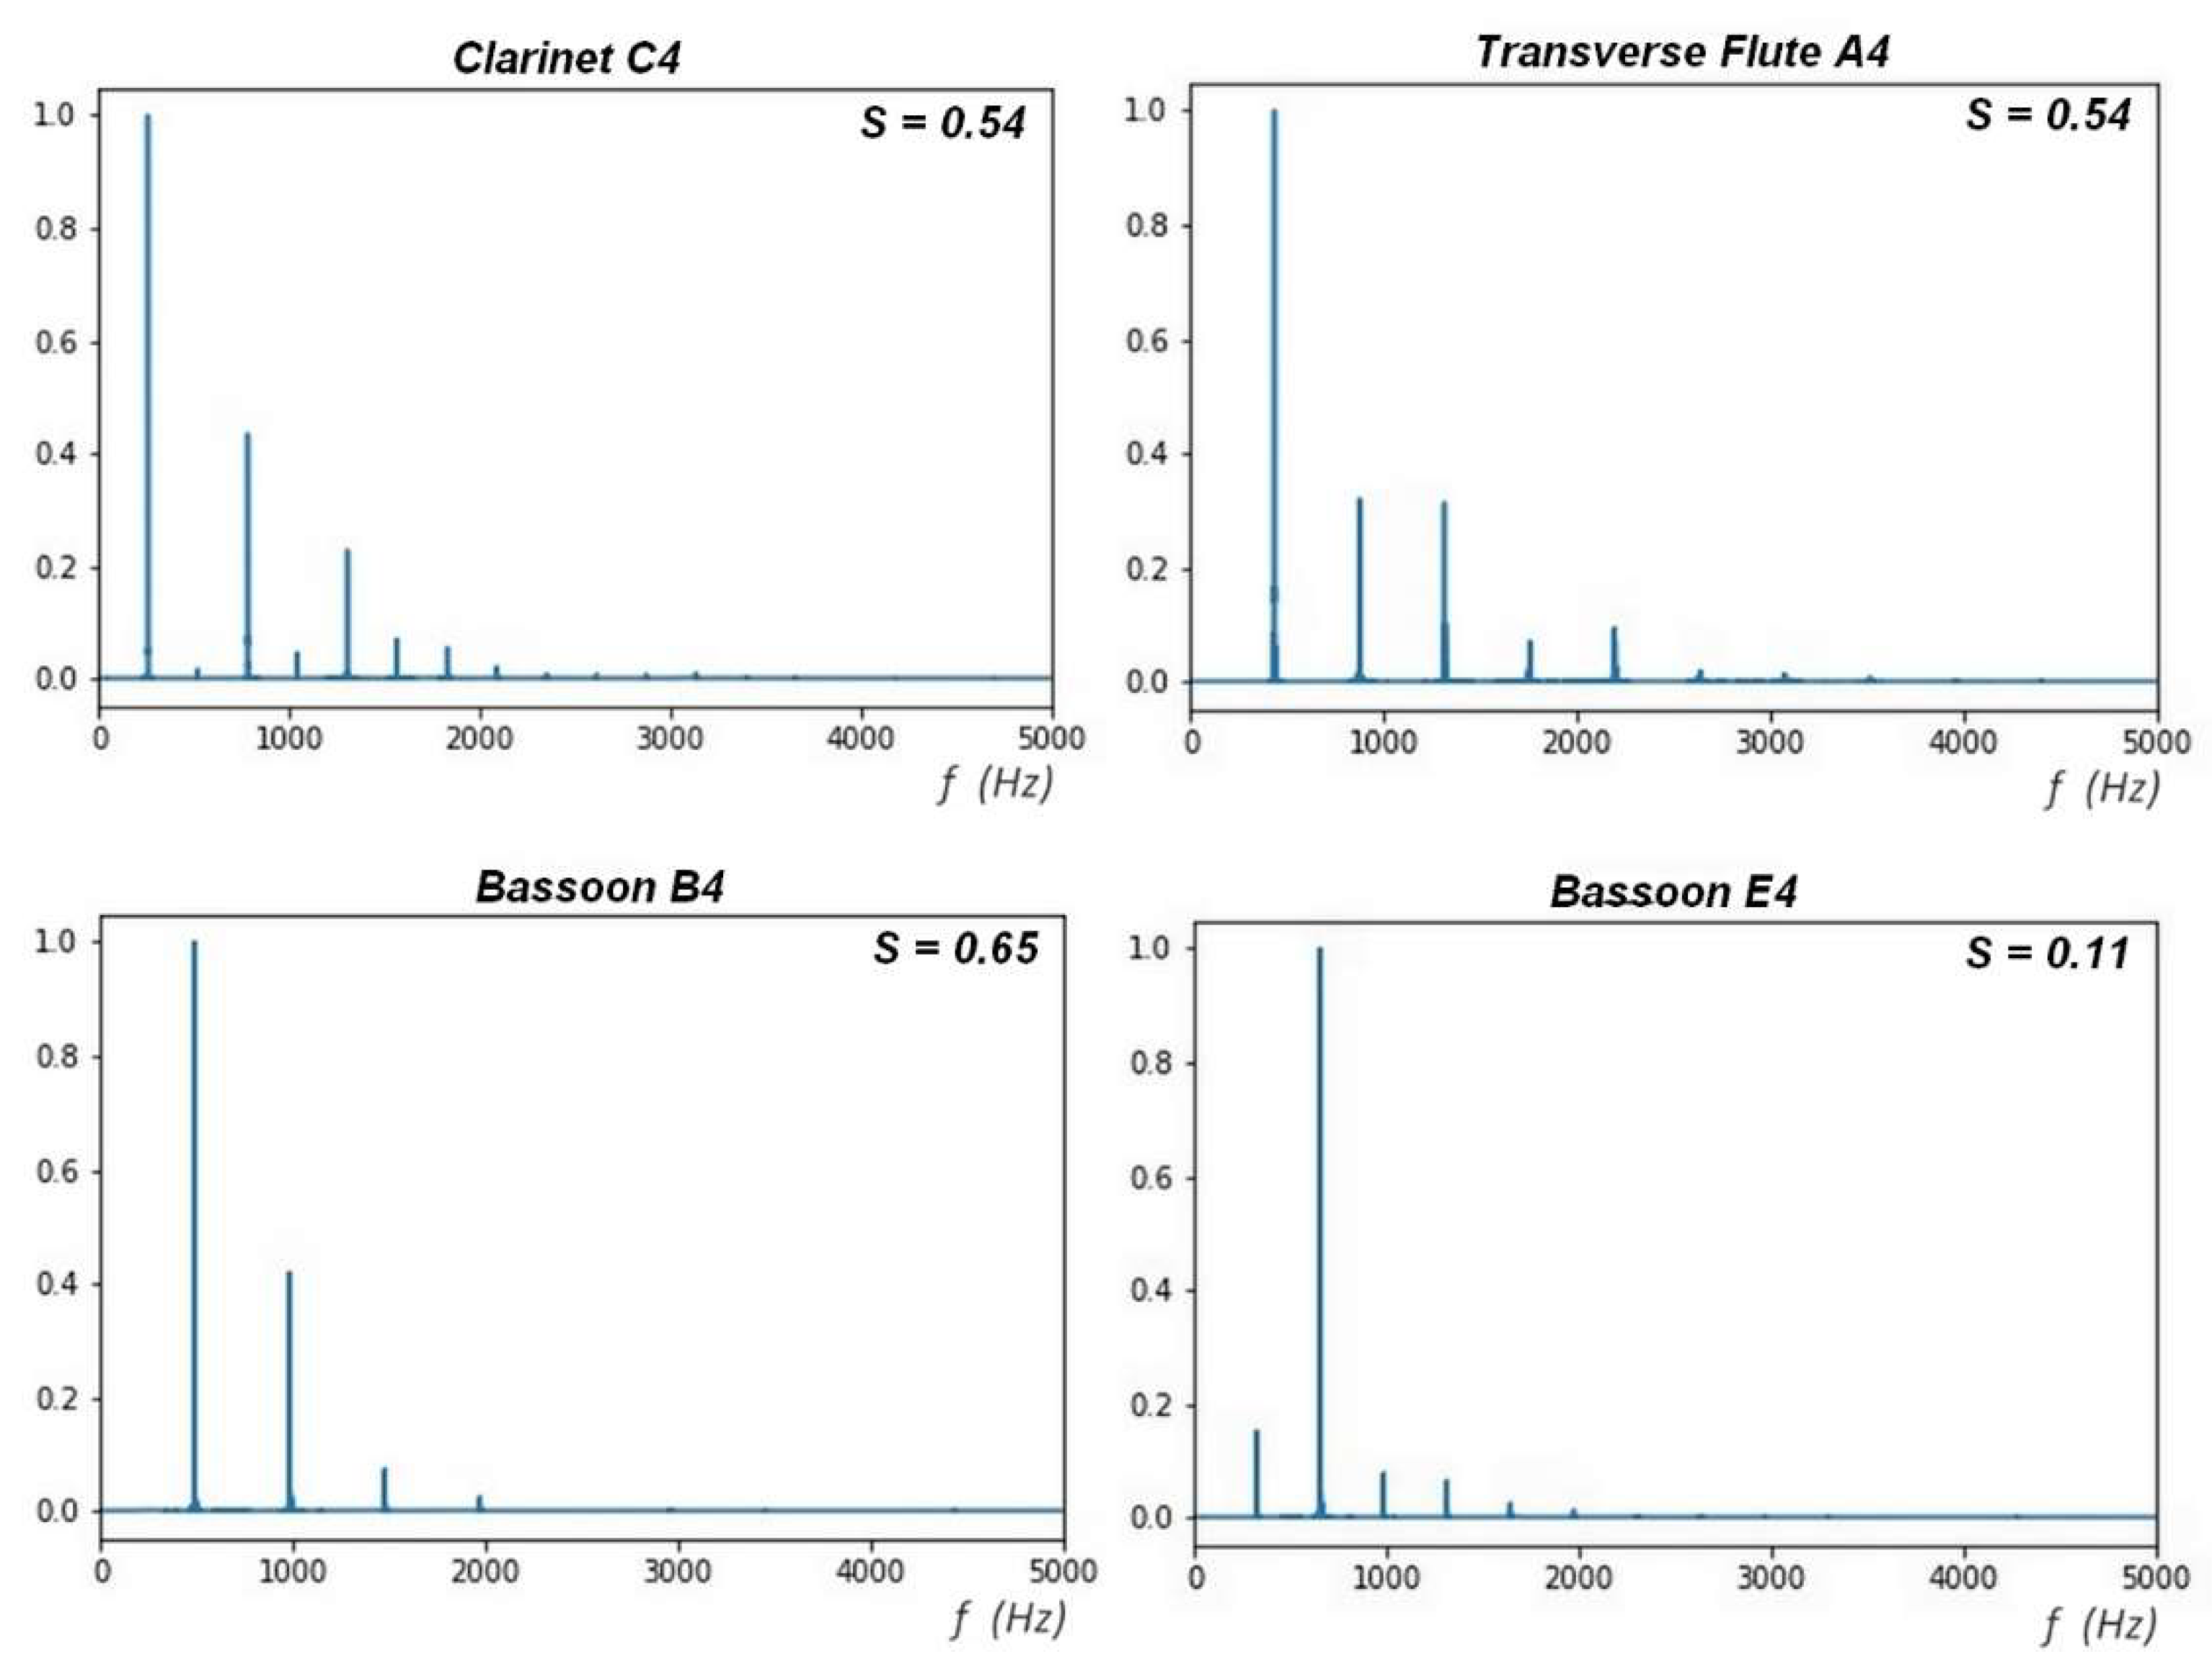
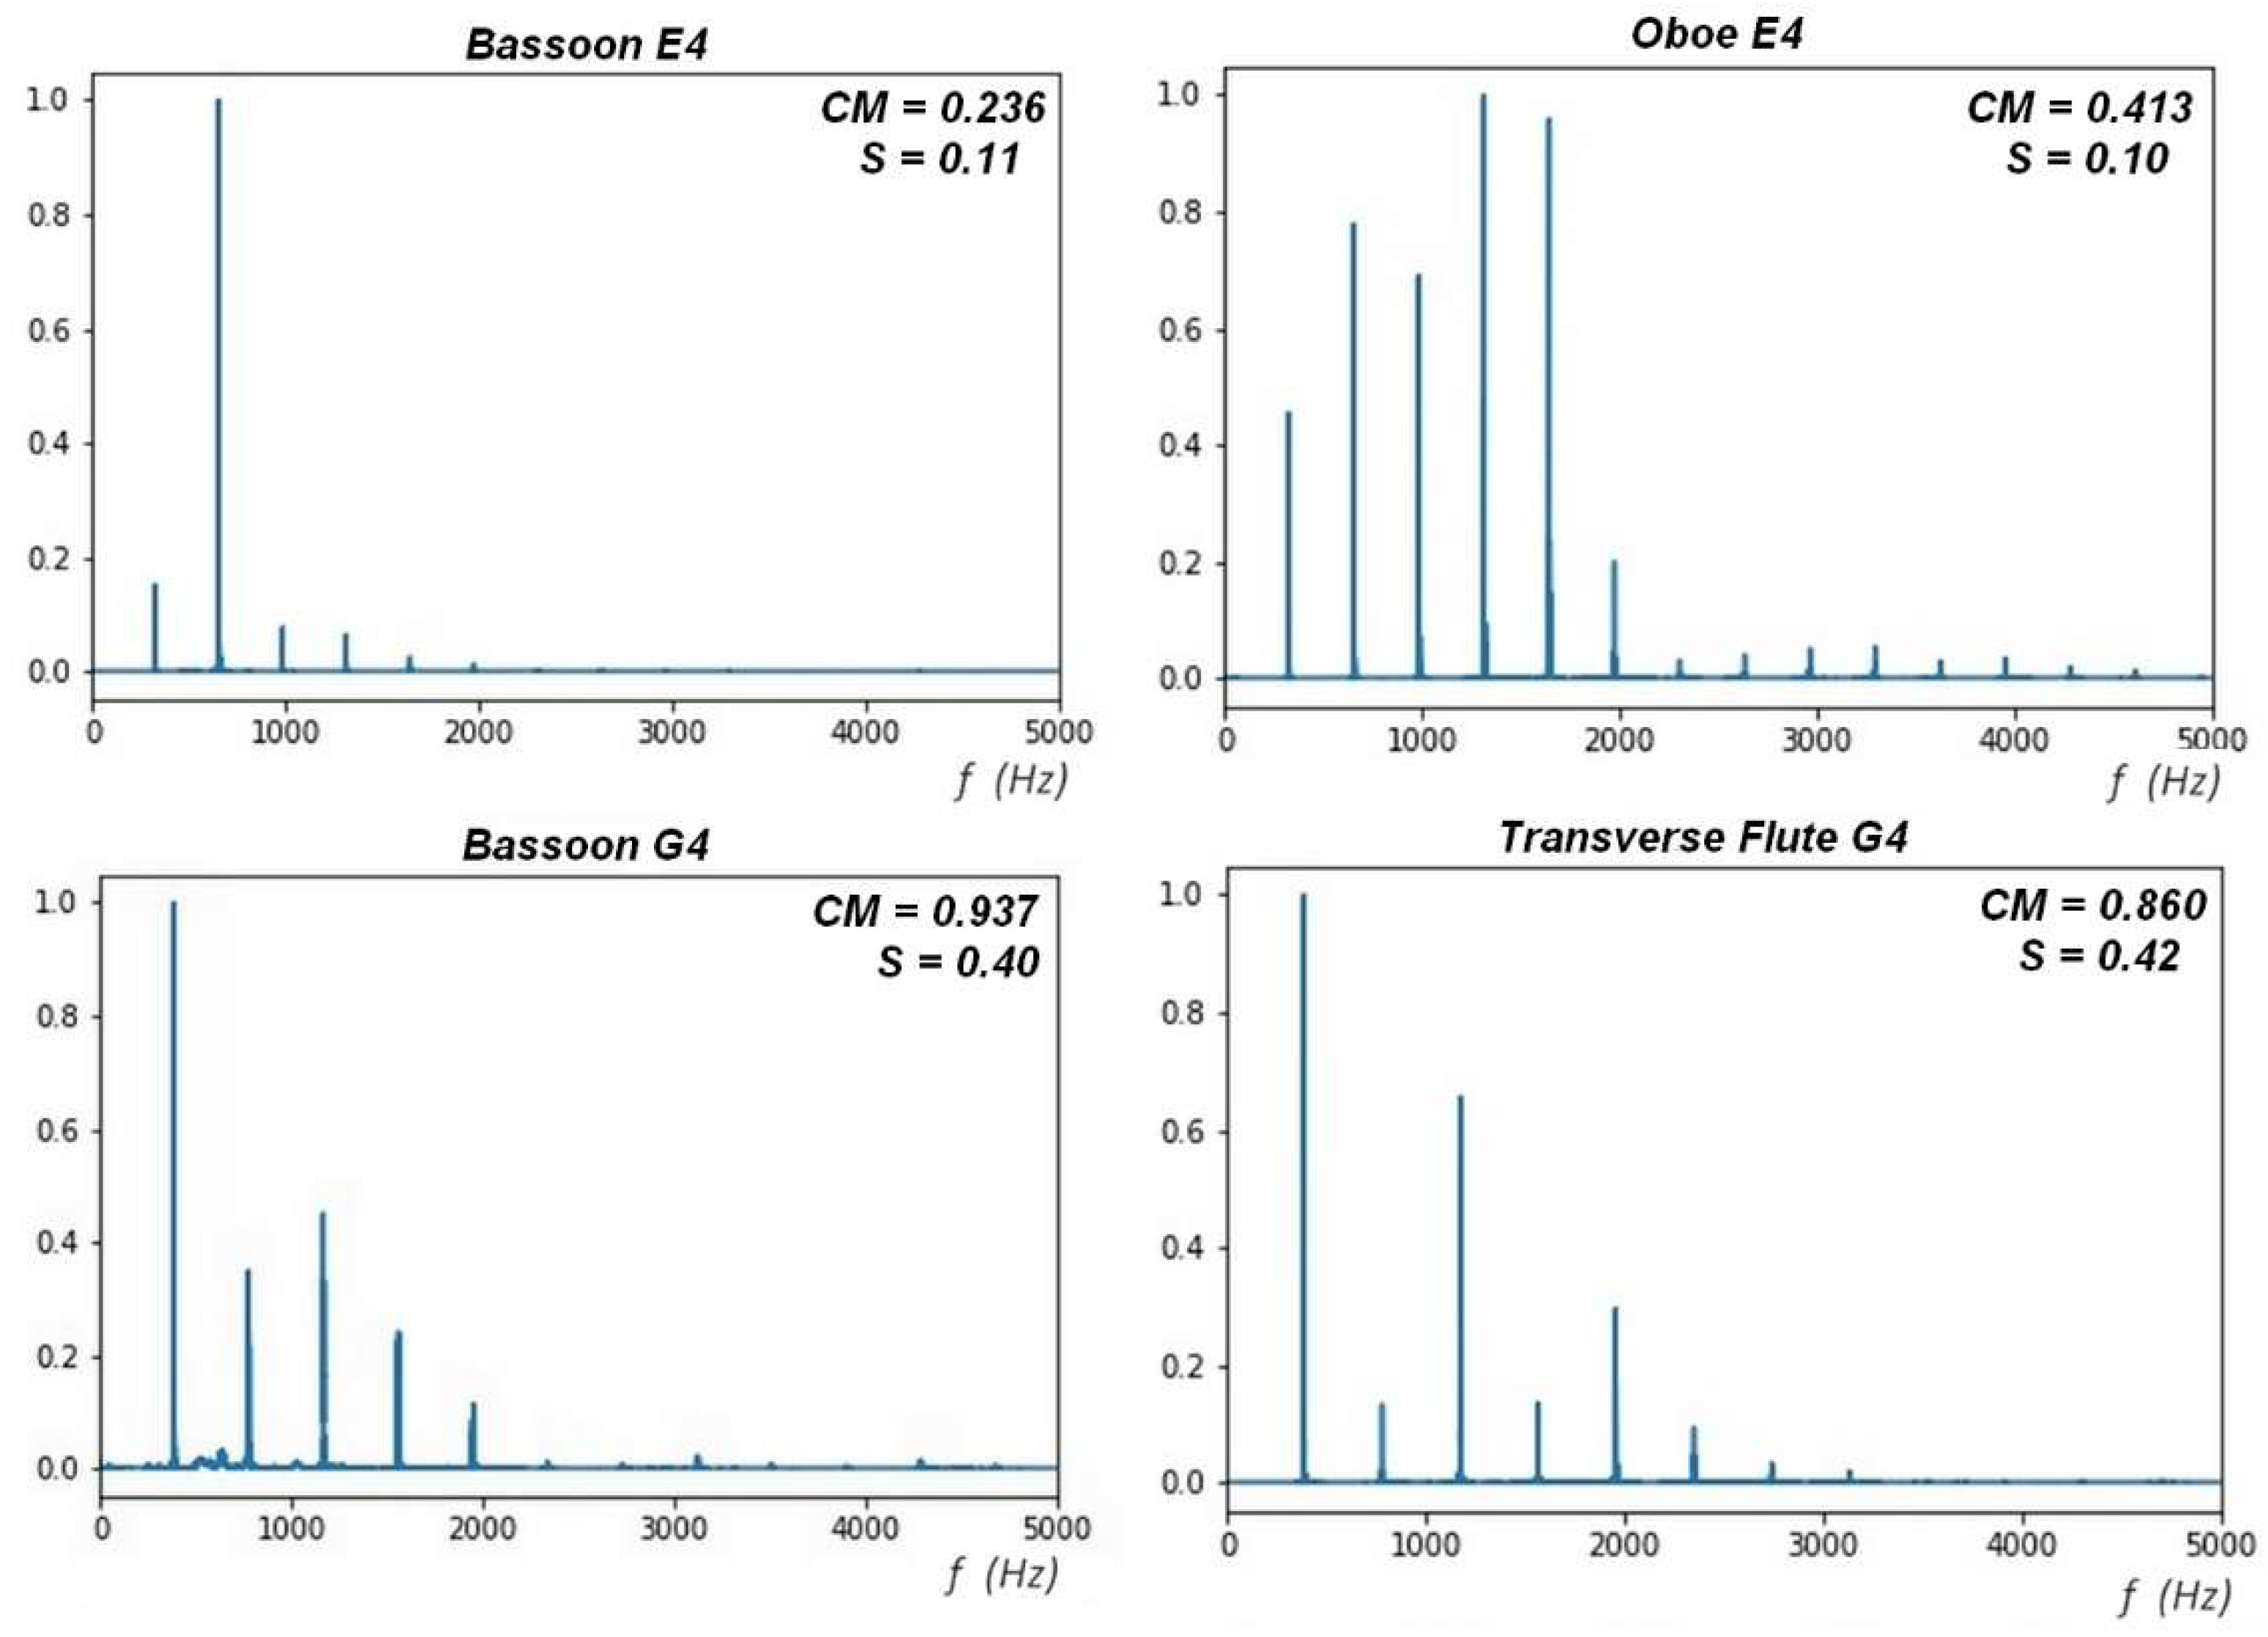
Figure 5 shows how spectra of different musical instruments, and different fundamental frequencies, can have the same Sharpness. In addition, that the same musical instrument can, depending on the frequency, present very different Sharpness.
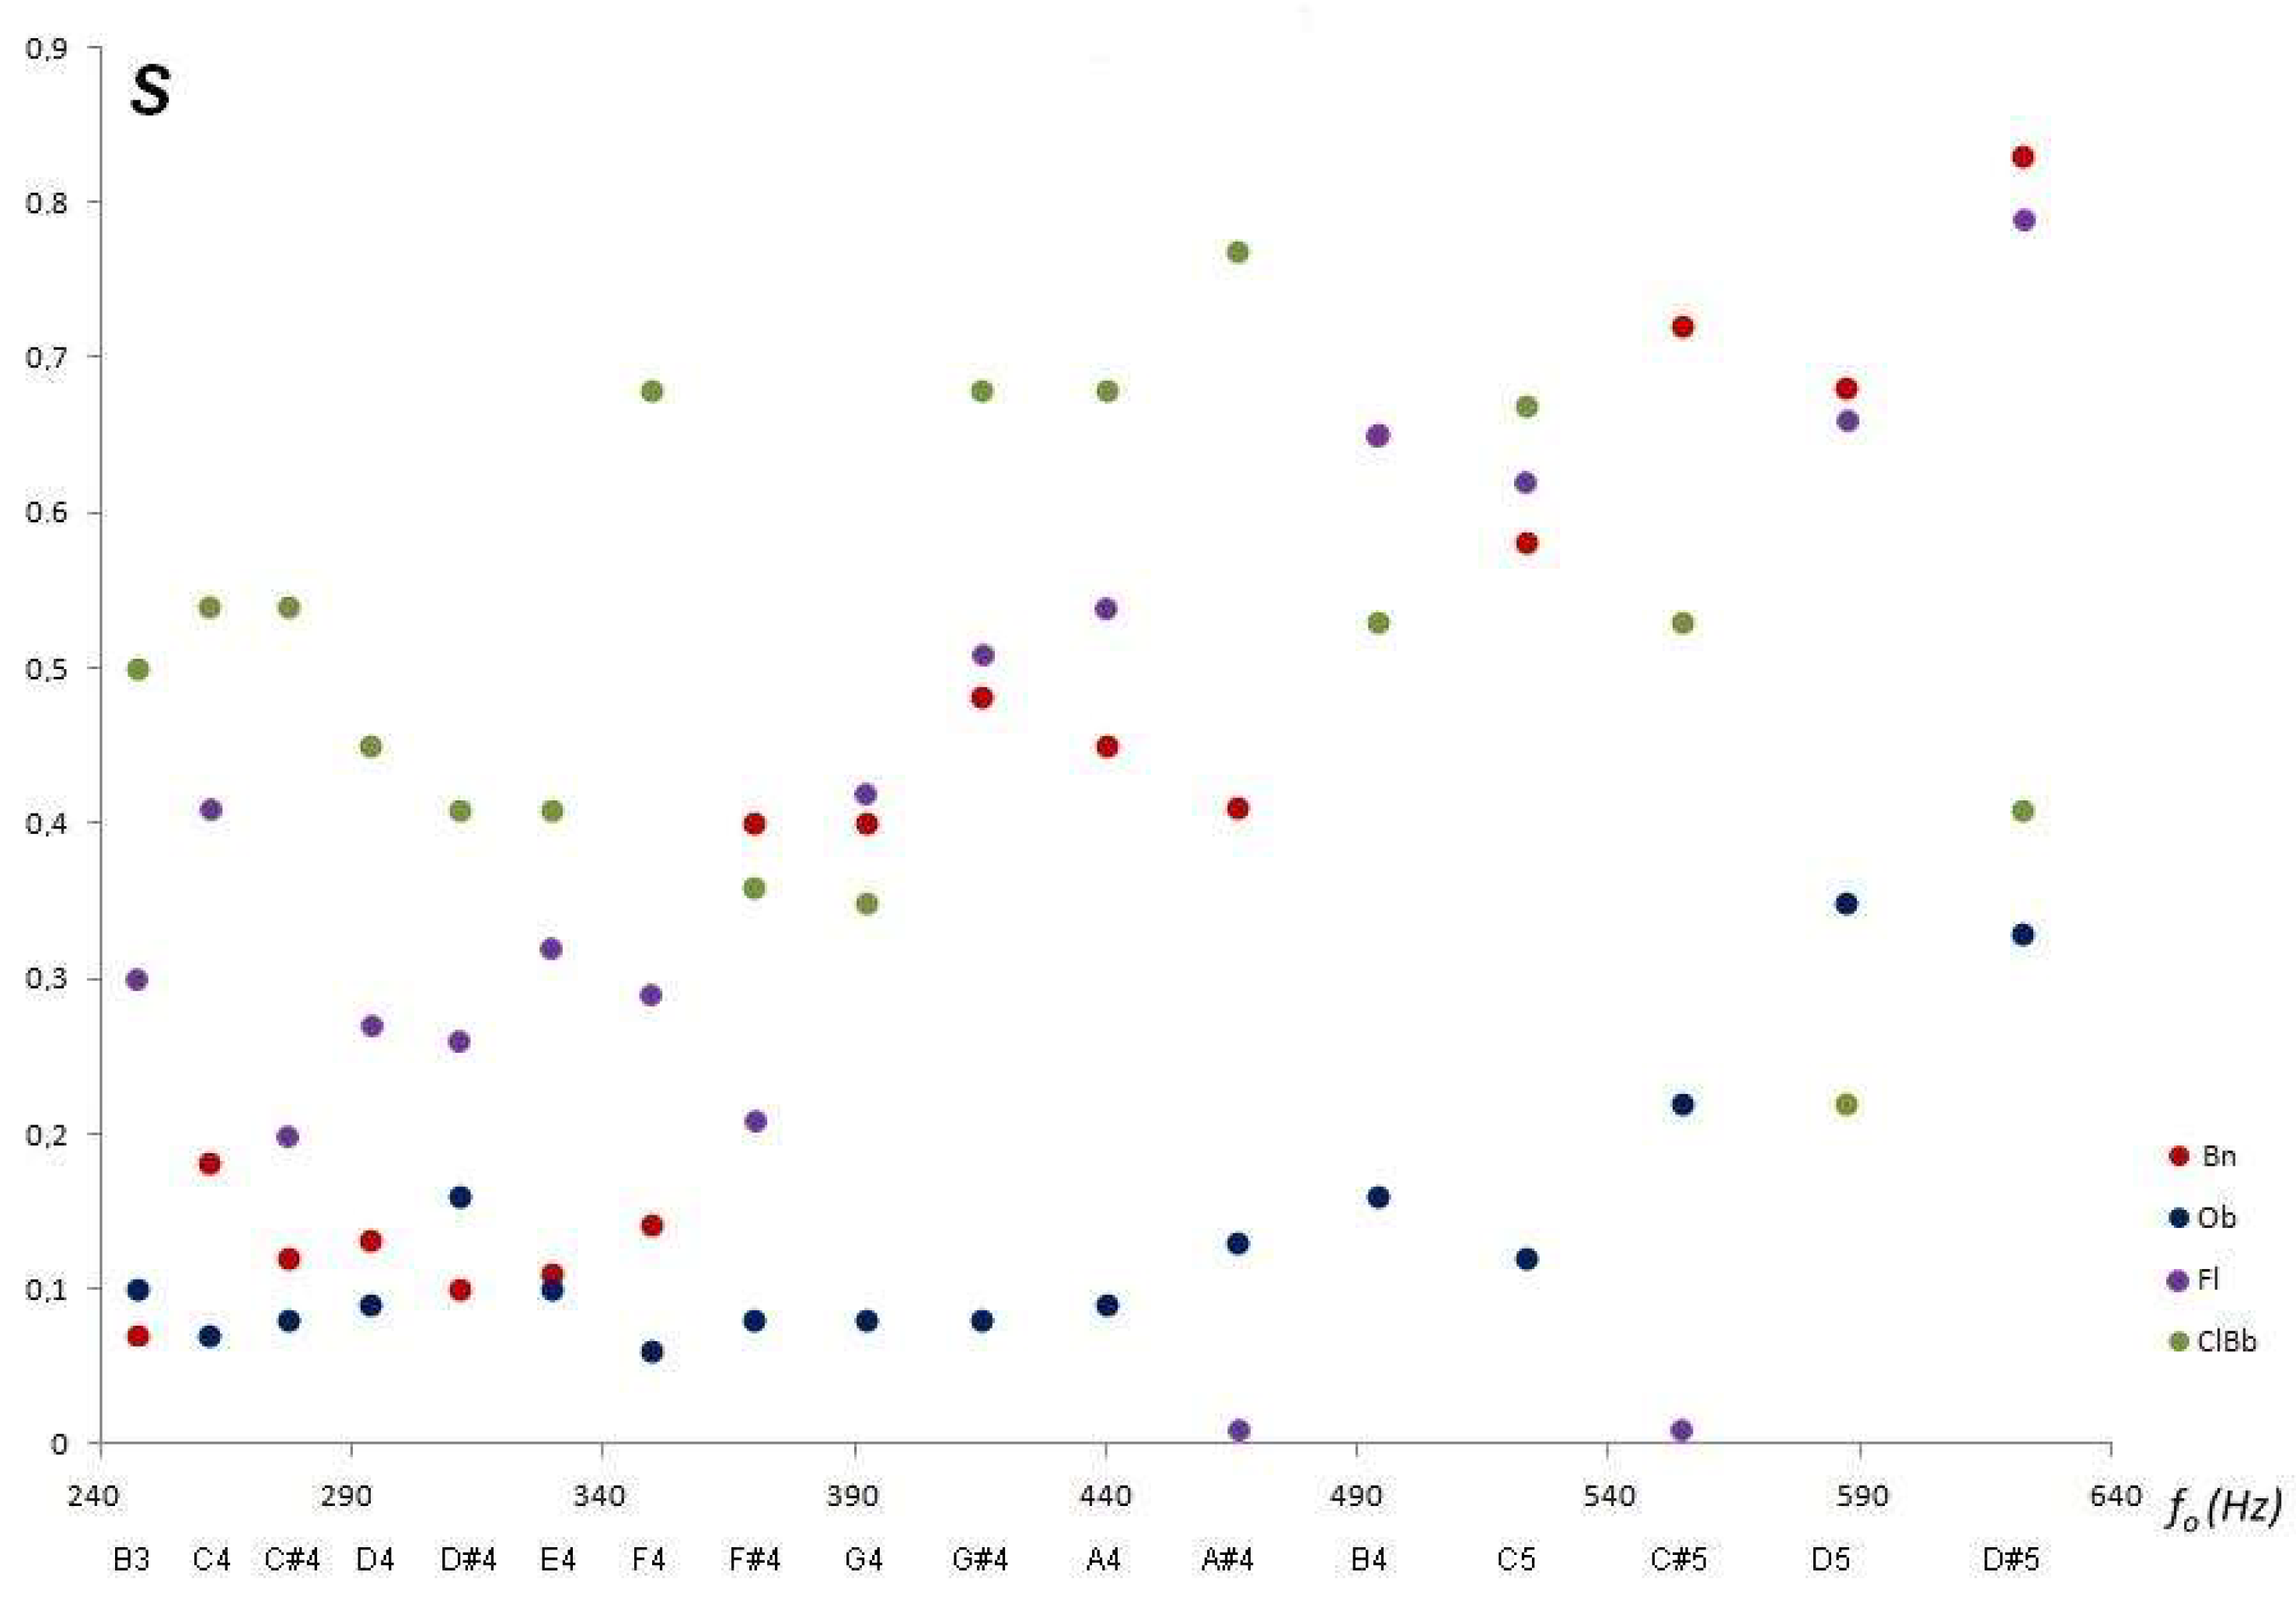
Figure 6 shows the variation in the Sharpness of aerophones. It is observed that, in general, (except for the F#4), the Clarinet is sharper than the Transverse Flute and this is sharper than the Bassoon; in any case, the Oboe is the least sharp of all. That is to say, the musical sounds are better defined in the Clarinet and poorly defined in the Oboe.
3.2. Descriptors of Frequency Distribution
It is also necessary to characterize the distribution of partial frequencies that appear associated with the fundamental frequency in the spectra of the FFTs of the audio records. Many authors use statistical descriptors of partial or secondary maximums, evaluating the kurtosis, the regular sequences when they occur, and statistical parameters.
However, it is possible to construct descriptors with a more direct acoustic meaning. In a given spectrum, there are always partial or secondary frequencies to
and can or cannot be harmonics. Harmonics can be counted; however, it can also happen that a secondary frequency is not strictly an integer multiple of the fundamental frequency, but whose frequency is very close to an integer multiple of
, and in a way, the sound would be more “harmonic” than if its frequency value were very different from the multiplicity of the fundamental frequency. To describe this property, the timbral coefficient of Harmonicity (
H) is proposed and defined as:
where the symbol [ ] denotes the integer part. This timbral function evaluates how harmonic the partial or secondary frequencies (
,
,
…
) of the FFT spectrum are. The idea is that any frequency
is a harmonic of
if the quotient between them is an integer.
Figure 7 shows this variation in examples of FFT spectra with different Harmonicity.
The Fourier spectra of the upper panel of
Figure 7 show that the C4 sound of the Flute is much more harmonic than the Oboe, even though the latter has many more secondary frequencies, some of which may be harmonics of
, as is the case of second, third and fourth maximum. If the secondary frequencies are all harmonics of
then
H = 0. Every time there are one or more frequencies that are not harmonics of
, the
j-th term, in the sum, will be non-zero and
H increases. The maximums of the spectrum distribution of the Transverse Flute in
Figure 7 are all integer multiples of the fundamental and, therefore, it is highly harmonic (
H = 0).
The same instrument can present very different values of harmonicity, depending on the musical sound considered, as observed for the Oboe on the right side of
Figure 7, in sounds C4 (
H ≅ 17) and D5 (
H ≅ 1). Even the same instrument with a qualitatively similar Fourier spectrum can present a very different harmonicity coefficient, as shown for the Transverse Flute in the left panel of
Figure 7; sounds C4 (very harmonic:
H ≅ 0) and B3 (very little harmonic:
H ≅ 10).
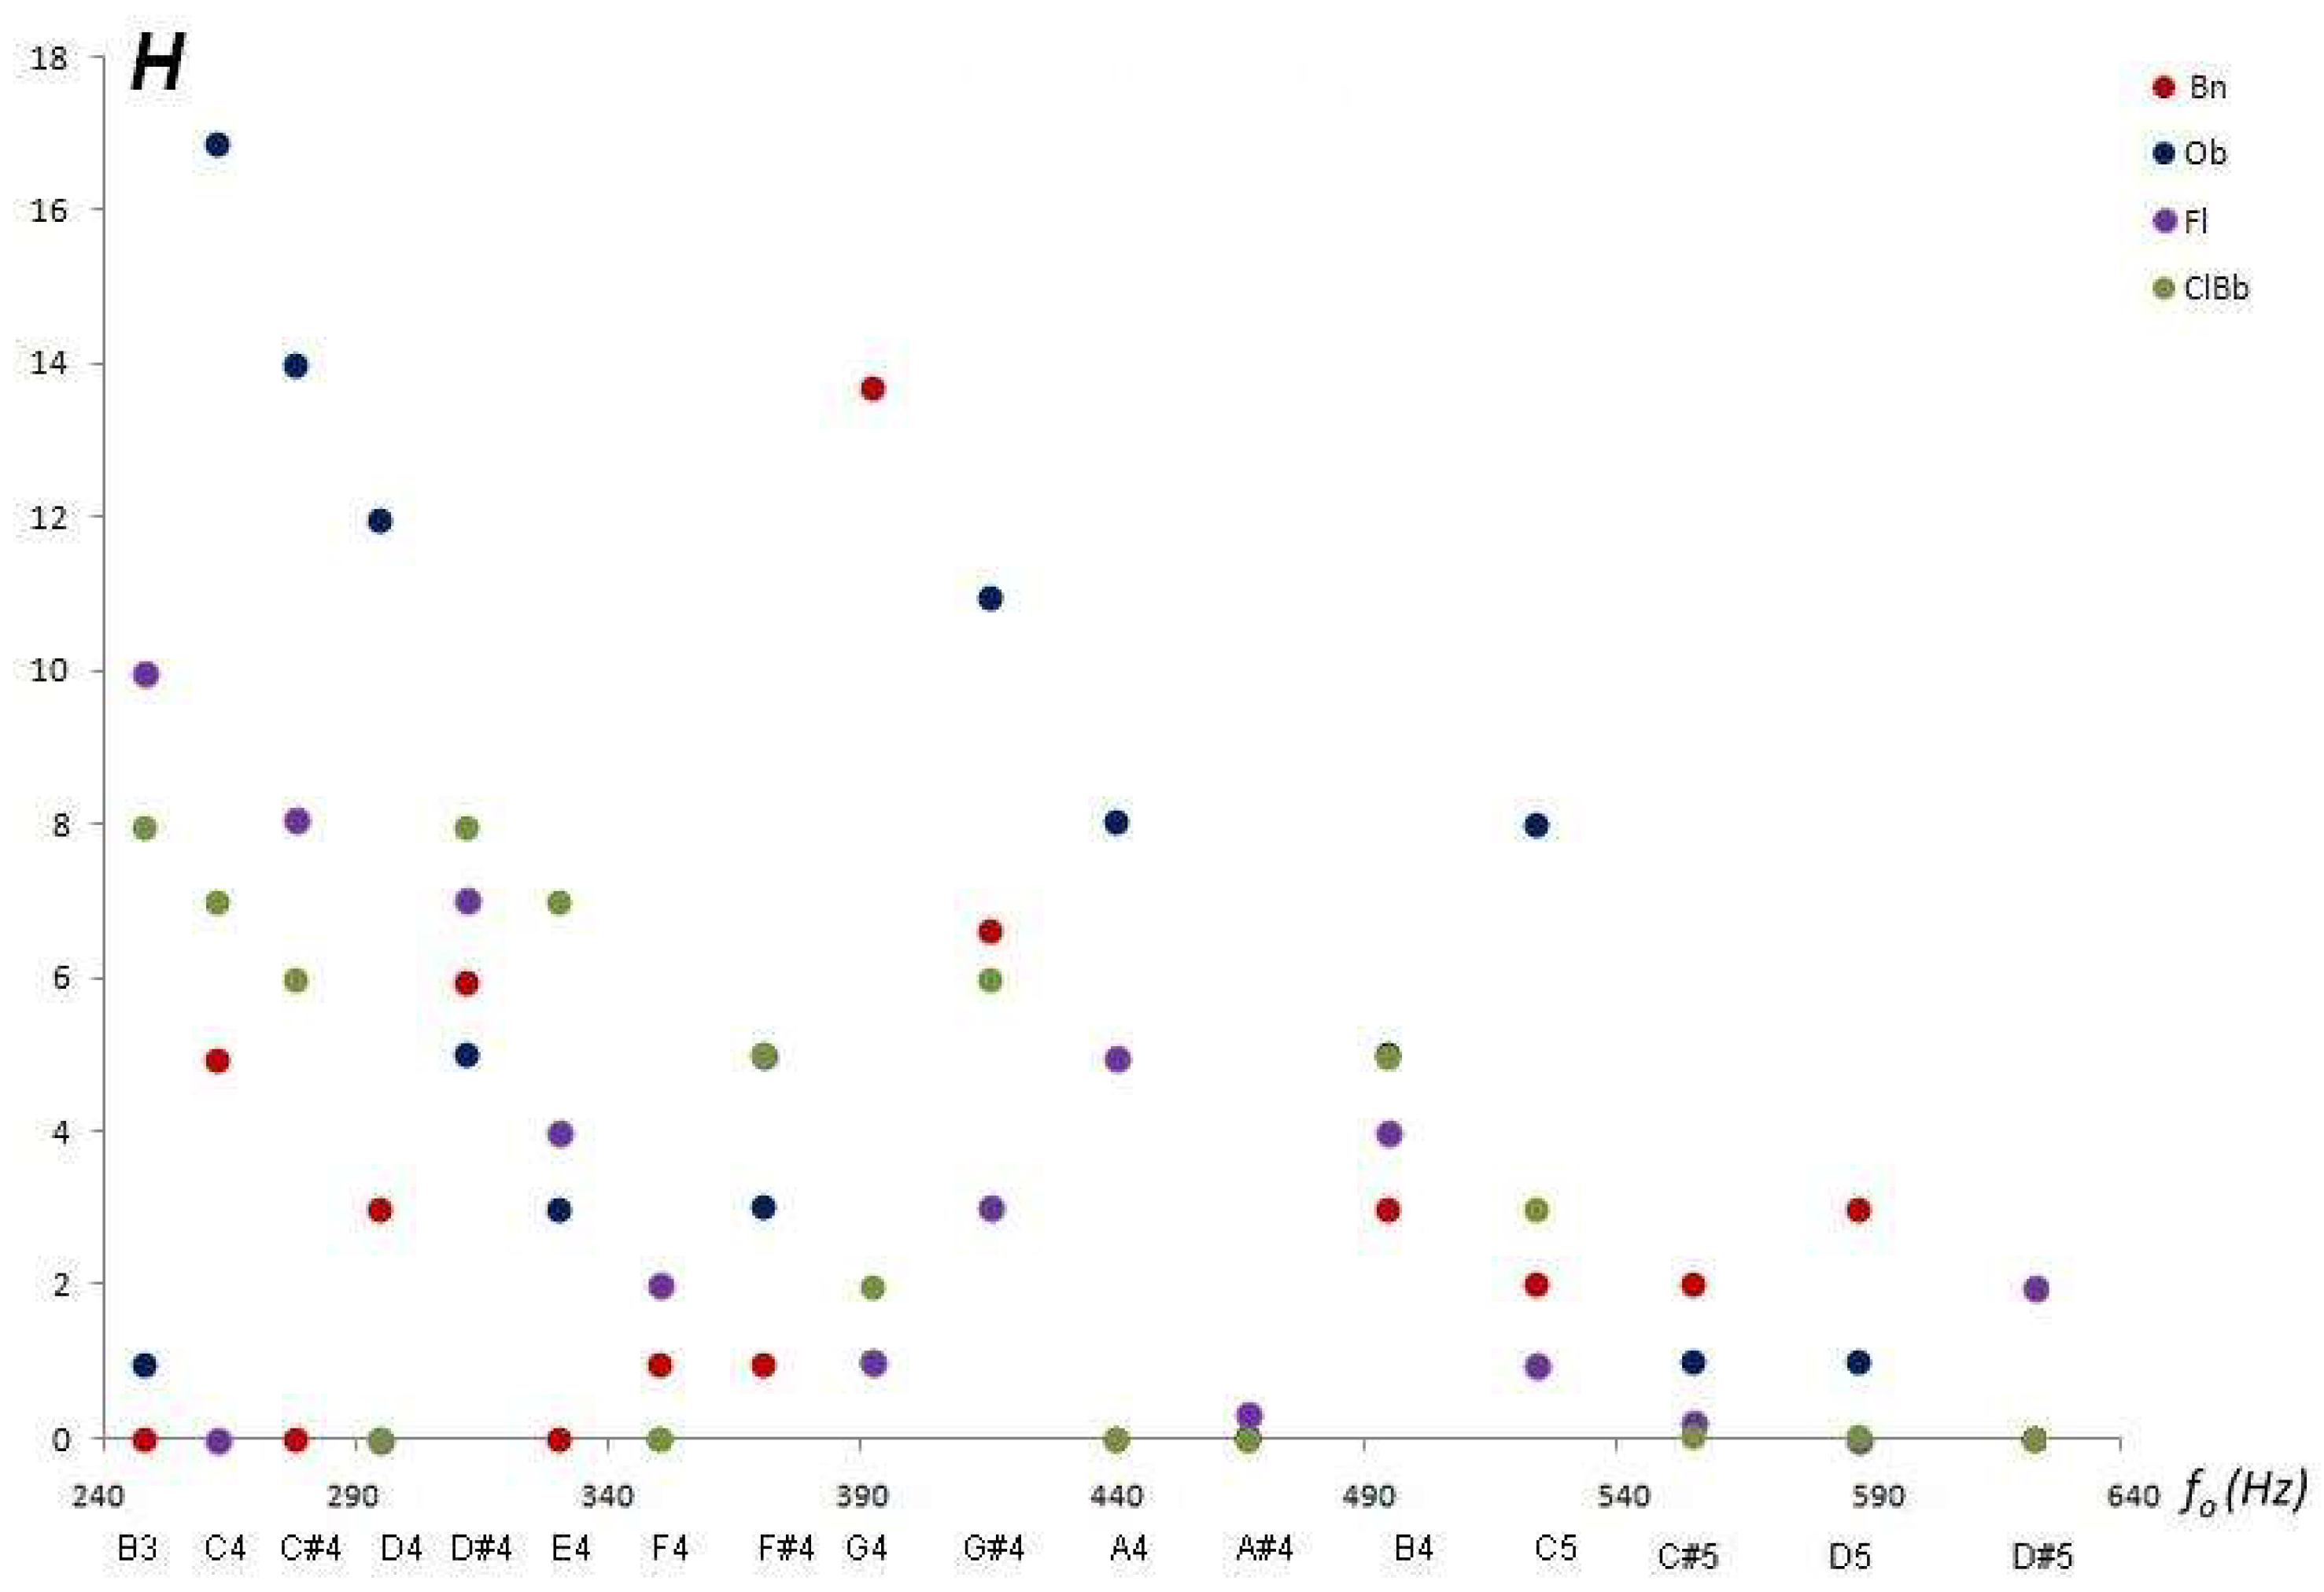
For common ranges, the results of the harmonicity assessment are shown in
Figure 8.
The Transverse Flute has the highest harmonicity (H close to zero), that is, its secondary frequencies are usually integer multiples of the corresponding fundamental sound, while the Oboe is the most anharmonic (large H). We note that the quality of harmonicity varies with the musical note and with the instrument, so for the characteristic sound of reference A = 440 Hz the Bassoon and Clarinet are completely harmonic, and the Transverse Flute is so for musical sounds C4, D4, E4, and A#4.
Another outstanding aspect of the distribution of maximums in the FFTs of the audio records is the variability of the amplitudes as a function of frequency. After the fundamental frequency , the following and successive maxima may have amplitudes that increase or decrease, that is, they could decrease in amplitude (decreasing Monotony) or increase (increasing monotony), or vary in growth with some tendency to increase or decrease.
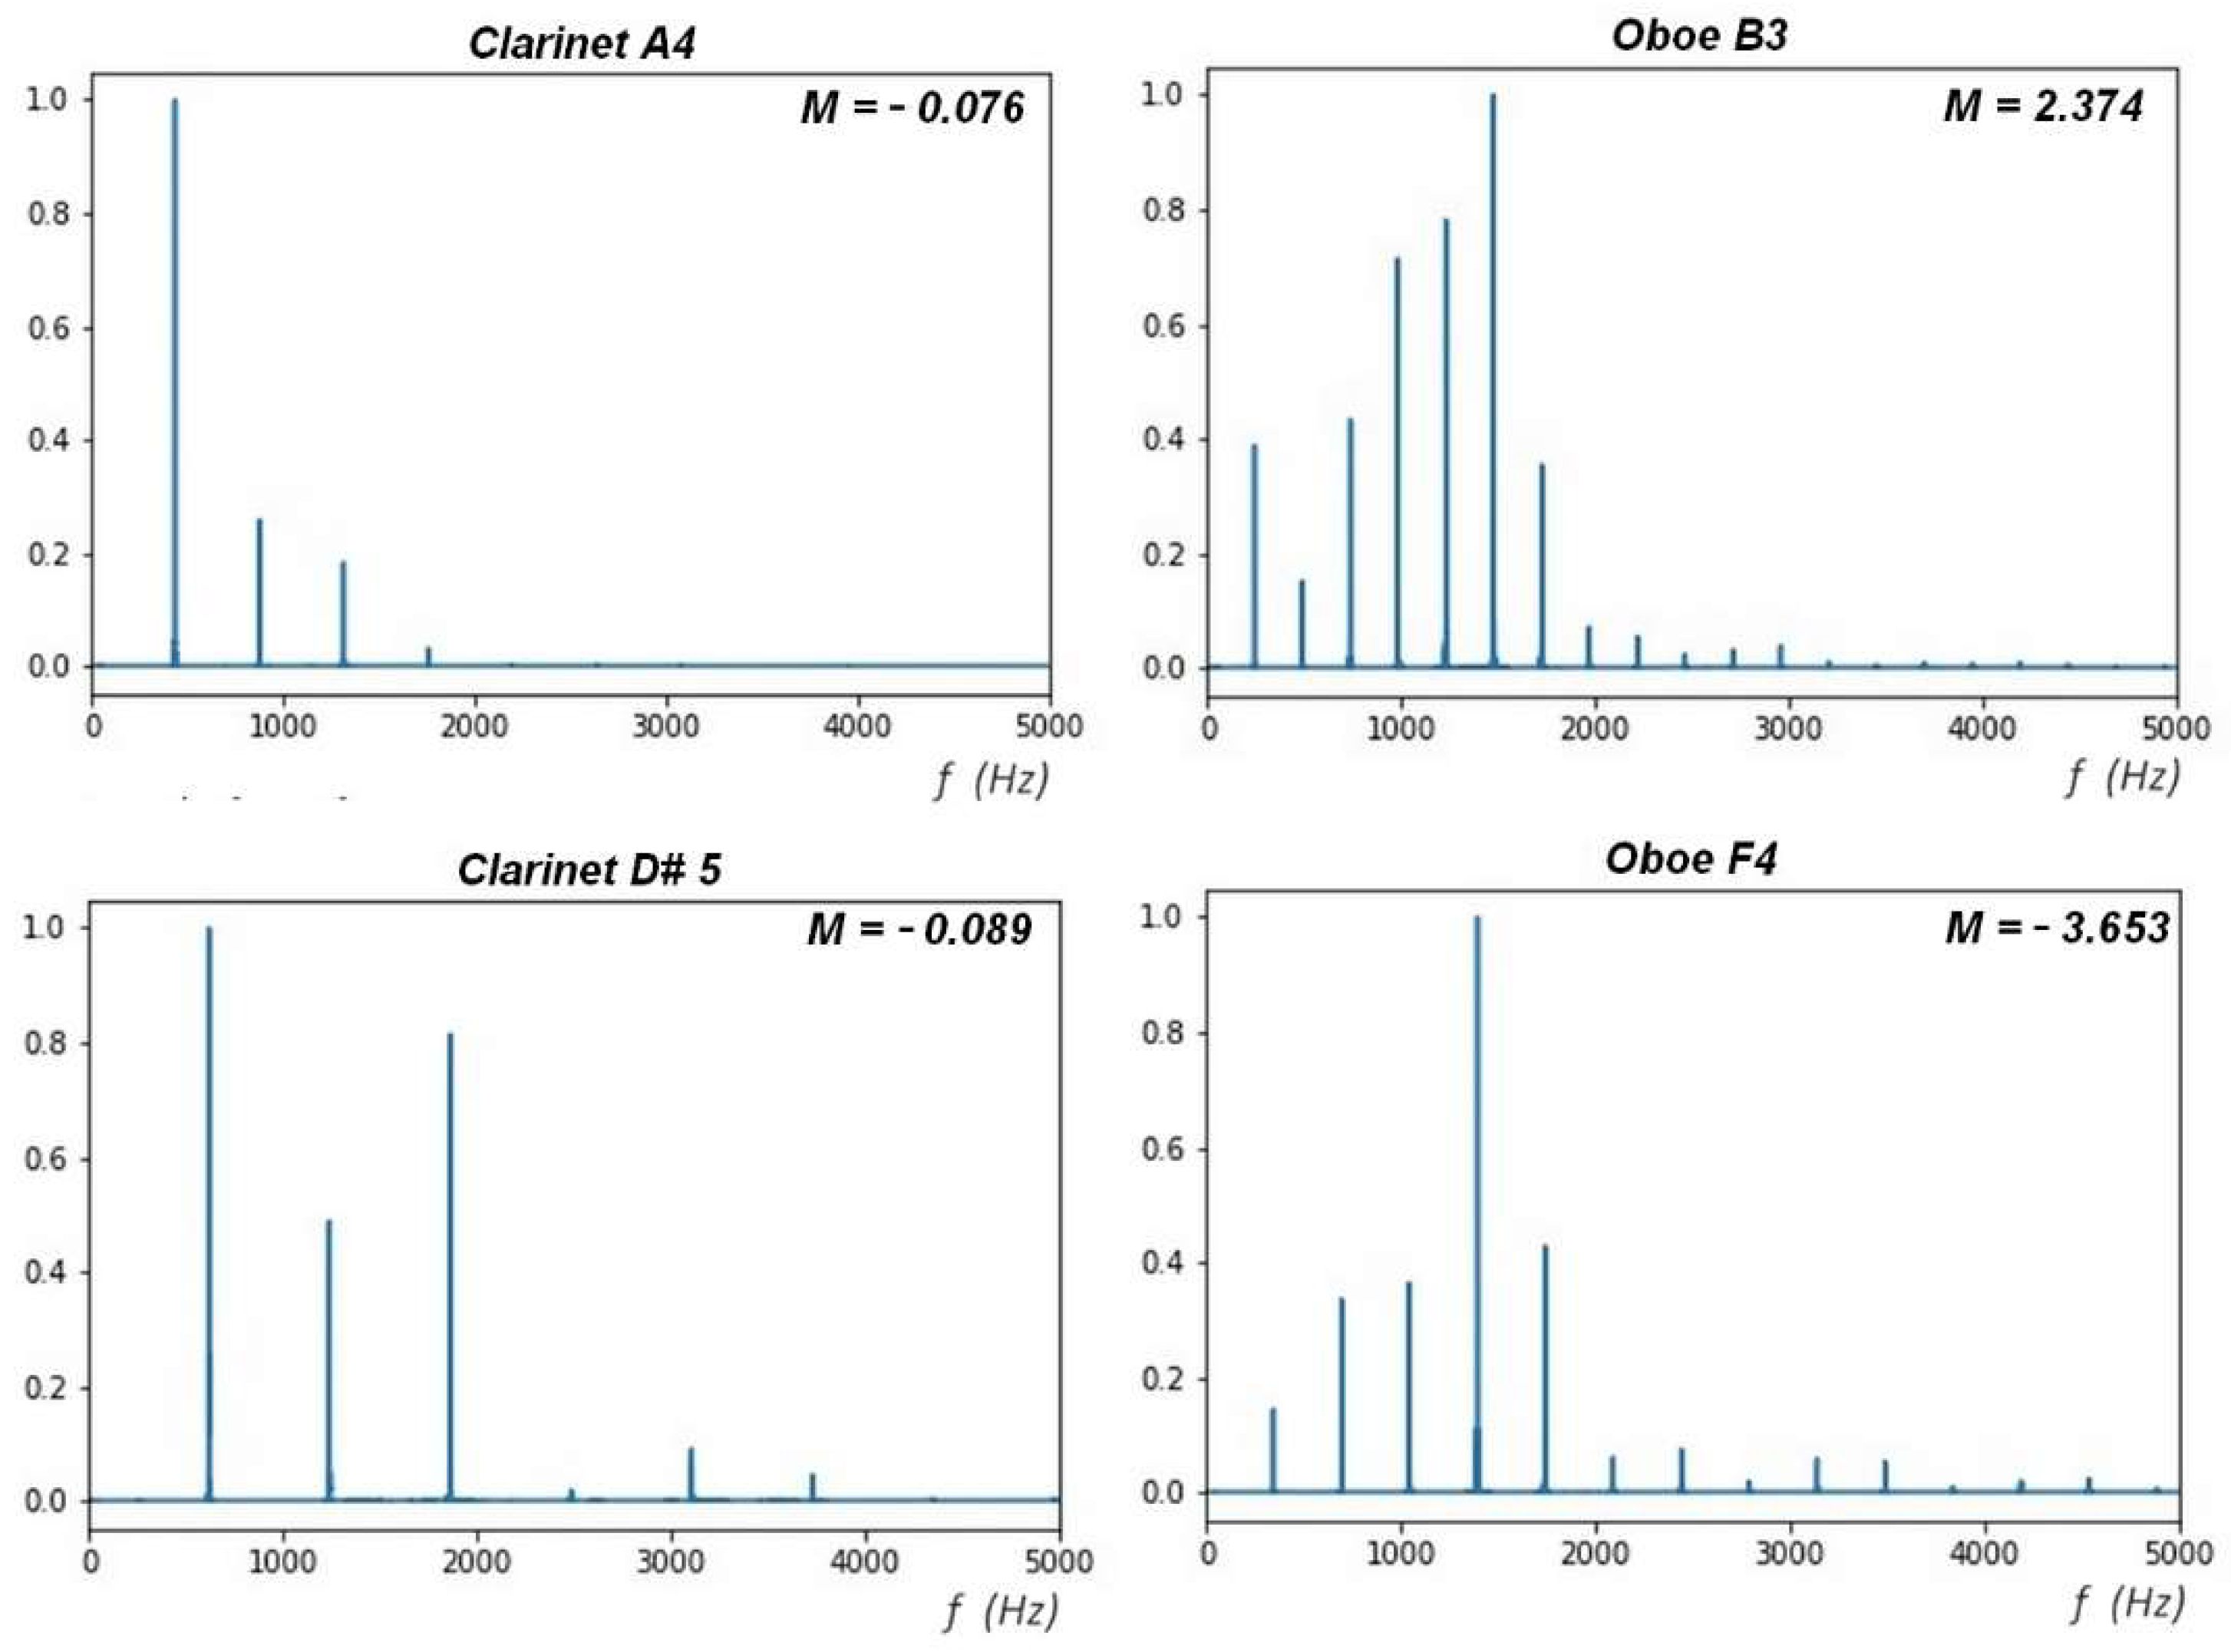
Figure 9 shows records with different behaviors in the monotony of the secondary or partial frequencies (whether they are harmonic or not).
The timbral coefficient of Monotony (
M) quantifies the regularity of the distribution of secondary frequencies (harmonic or not). It is defined as the average of the variations between two successive maxima:
Essentially, monotony informs whether the harmonics appear in increasing (positive M) or decreasing (negative M) succession after the fundamental frequency. It can be said that this coefficient approximates and discretely quantifies the first derivative of the frequency distribution.
Essentially monotony informs whether the harmonics appear in mostly increasing (positive M) or decreasing (negative M) succession after the fundamental frequency. It can be said that this coefficient approximately and discretely quantifies the first derivative of the frequency distribution.
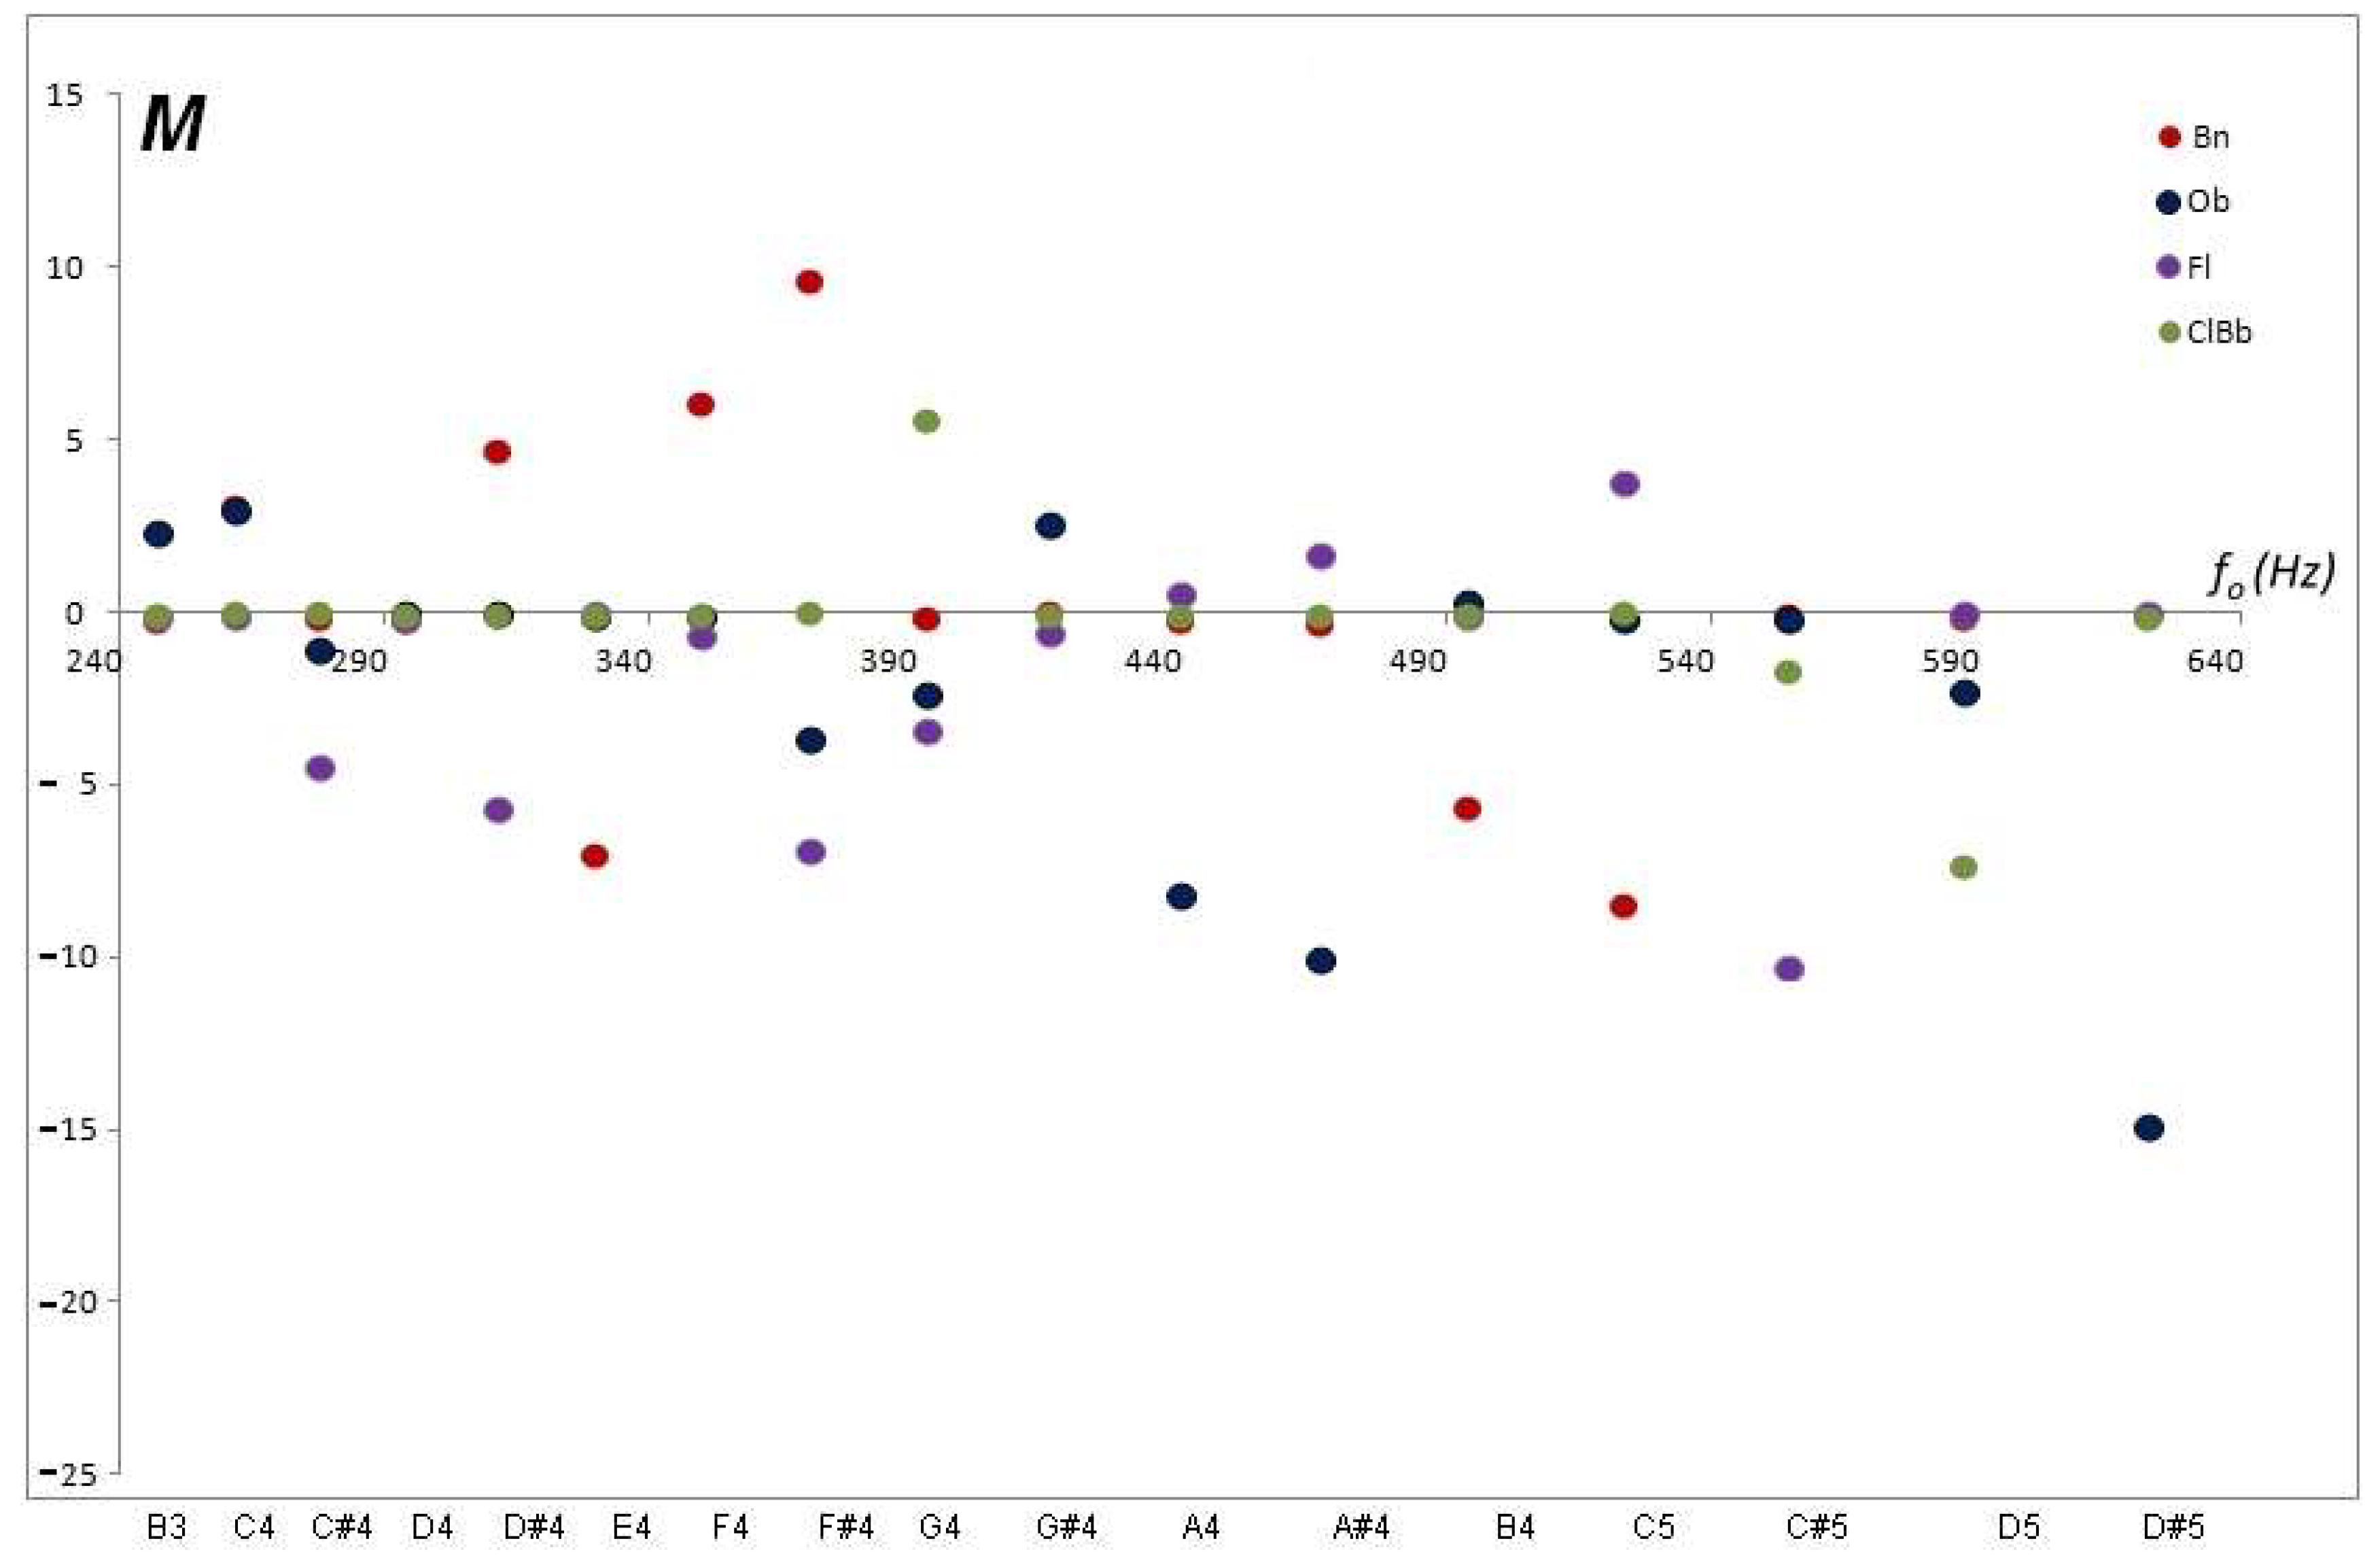
Figure 10 shows the assessment of the monotony of the common tessitura for the musical instruments studied. The Clarinet has negative values very close to zero and, on average, its frequencies decay in amplitude, which is to say that the sound attenuates very slightly after the fundamental frequency. The same homogeneity is appreciated in the sound of the Transverse Flute. On the contrary, the Bassoon shows high positive and negative values in several musical notes, that is, the bassoon has more sound alternation after the fundamental frequency. The Oboe has a certain alternation with a decreasing trend and the very negative
M value of it reports a large alternation with a trend or decreasing envelope for several of the notes.
3.3. Distribution Statistics
Another aspect that is perceived in the FFTs of the audio records for different aerophones is that the secondary or partial frequencies occupy a different frequency range, that is, the partial frequencies (harmonic or not) are sometimes very close together or are grouped, and, in others, they are more spatially distributed or more separated. If the secondary frequencies are very close to each other or close to the fundamental, the sounds may appear more “compact or thick”, while the spatial separation of the frequencies gives more diaphanous or transparency to the fundamental frequency. Transparency is the timbral coefficient defined as the Mean Affinity (
MA). It quantifies the frequency extent of the distribution and evaluates the separation of the partial frequencies concerning the centroid.
The
MA coefficient attempts to evaluate how compact the frequency distribution is concerning that mean value (including the fundamental frequency
). Note that the subscript
i has been used instead of
j to denote that the sum also includes
In other coefficients the sum over
j does not include
because it refers to the secondary maxima, whether harmonic or not.
Figure 11 shows how Mean Affinity (
MA) varies in various FFT spectra.
Figure 11 shows that the same sound can have different
MA values in different instruments. For example, in the upper panel the C4 sound of the Clarinet (
MA = 2.51) and the Transverse Flute (
MA = 2.98) both have very similar affinity coefficients, as well as, in the lower panel, the D5 sound in Oboe (
MA = 2.44) and Bassoon (
MA = 1.56). This holds even for sounds and instruments with the same Affinity (
A = 2.47) such as the C4 Clarinet (
MA = 2.51) and the D5 Oboe (
MA = 2.44). Two sounds with equal affinity values are observed in
Figure 11 wherein both registers have the same Affinity
A≅2.4 but their average Affinity are different (
MA = 2.51 Clarinet and
MA = 2.98 Transverse Flute).
Lower
MA values refer to compact distributions of secondary sounds close to the centroid. Thus, the Oboe has a lower average Affinity (high
A value) for the range of sounds studied, which is equivalent to saying that the secondary frequencies (different from the fundamental one) cover a greater range of frequencies. The opposite is the case with the Bassoon, whose secondary sounds are more compact for each of the nominal frequencies of the scale, as shown in
Figure 12. It is important to note that, by its definition, the
MA value multiplied by
gives us the effective mean frequency.
Finally, it should be noted that two FFT spectra can have the same number of secondary or partial frequencies, even if in both cases they are harmonic, but if one of these partial spectra has higher amplitude compared to the other spectrum, they will appear to us with greater variability in frequencies (
Figure 13).
The Mean Contrast (
MC) is the coefficient that measures the amplitude of the partial frequencies (tones or “colors”) concerning the fundamental frequency.
MC increases as the intensity of partial frequencies. The
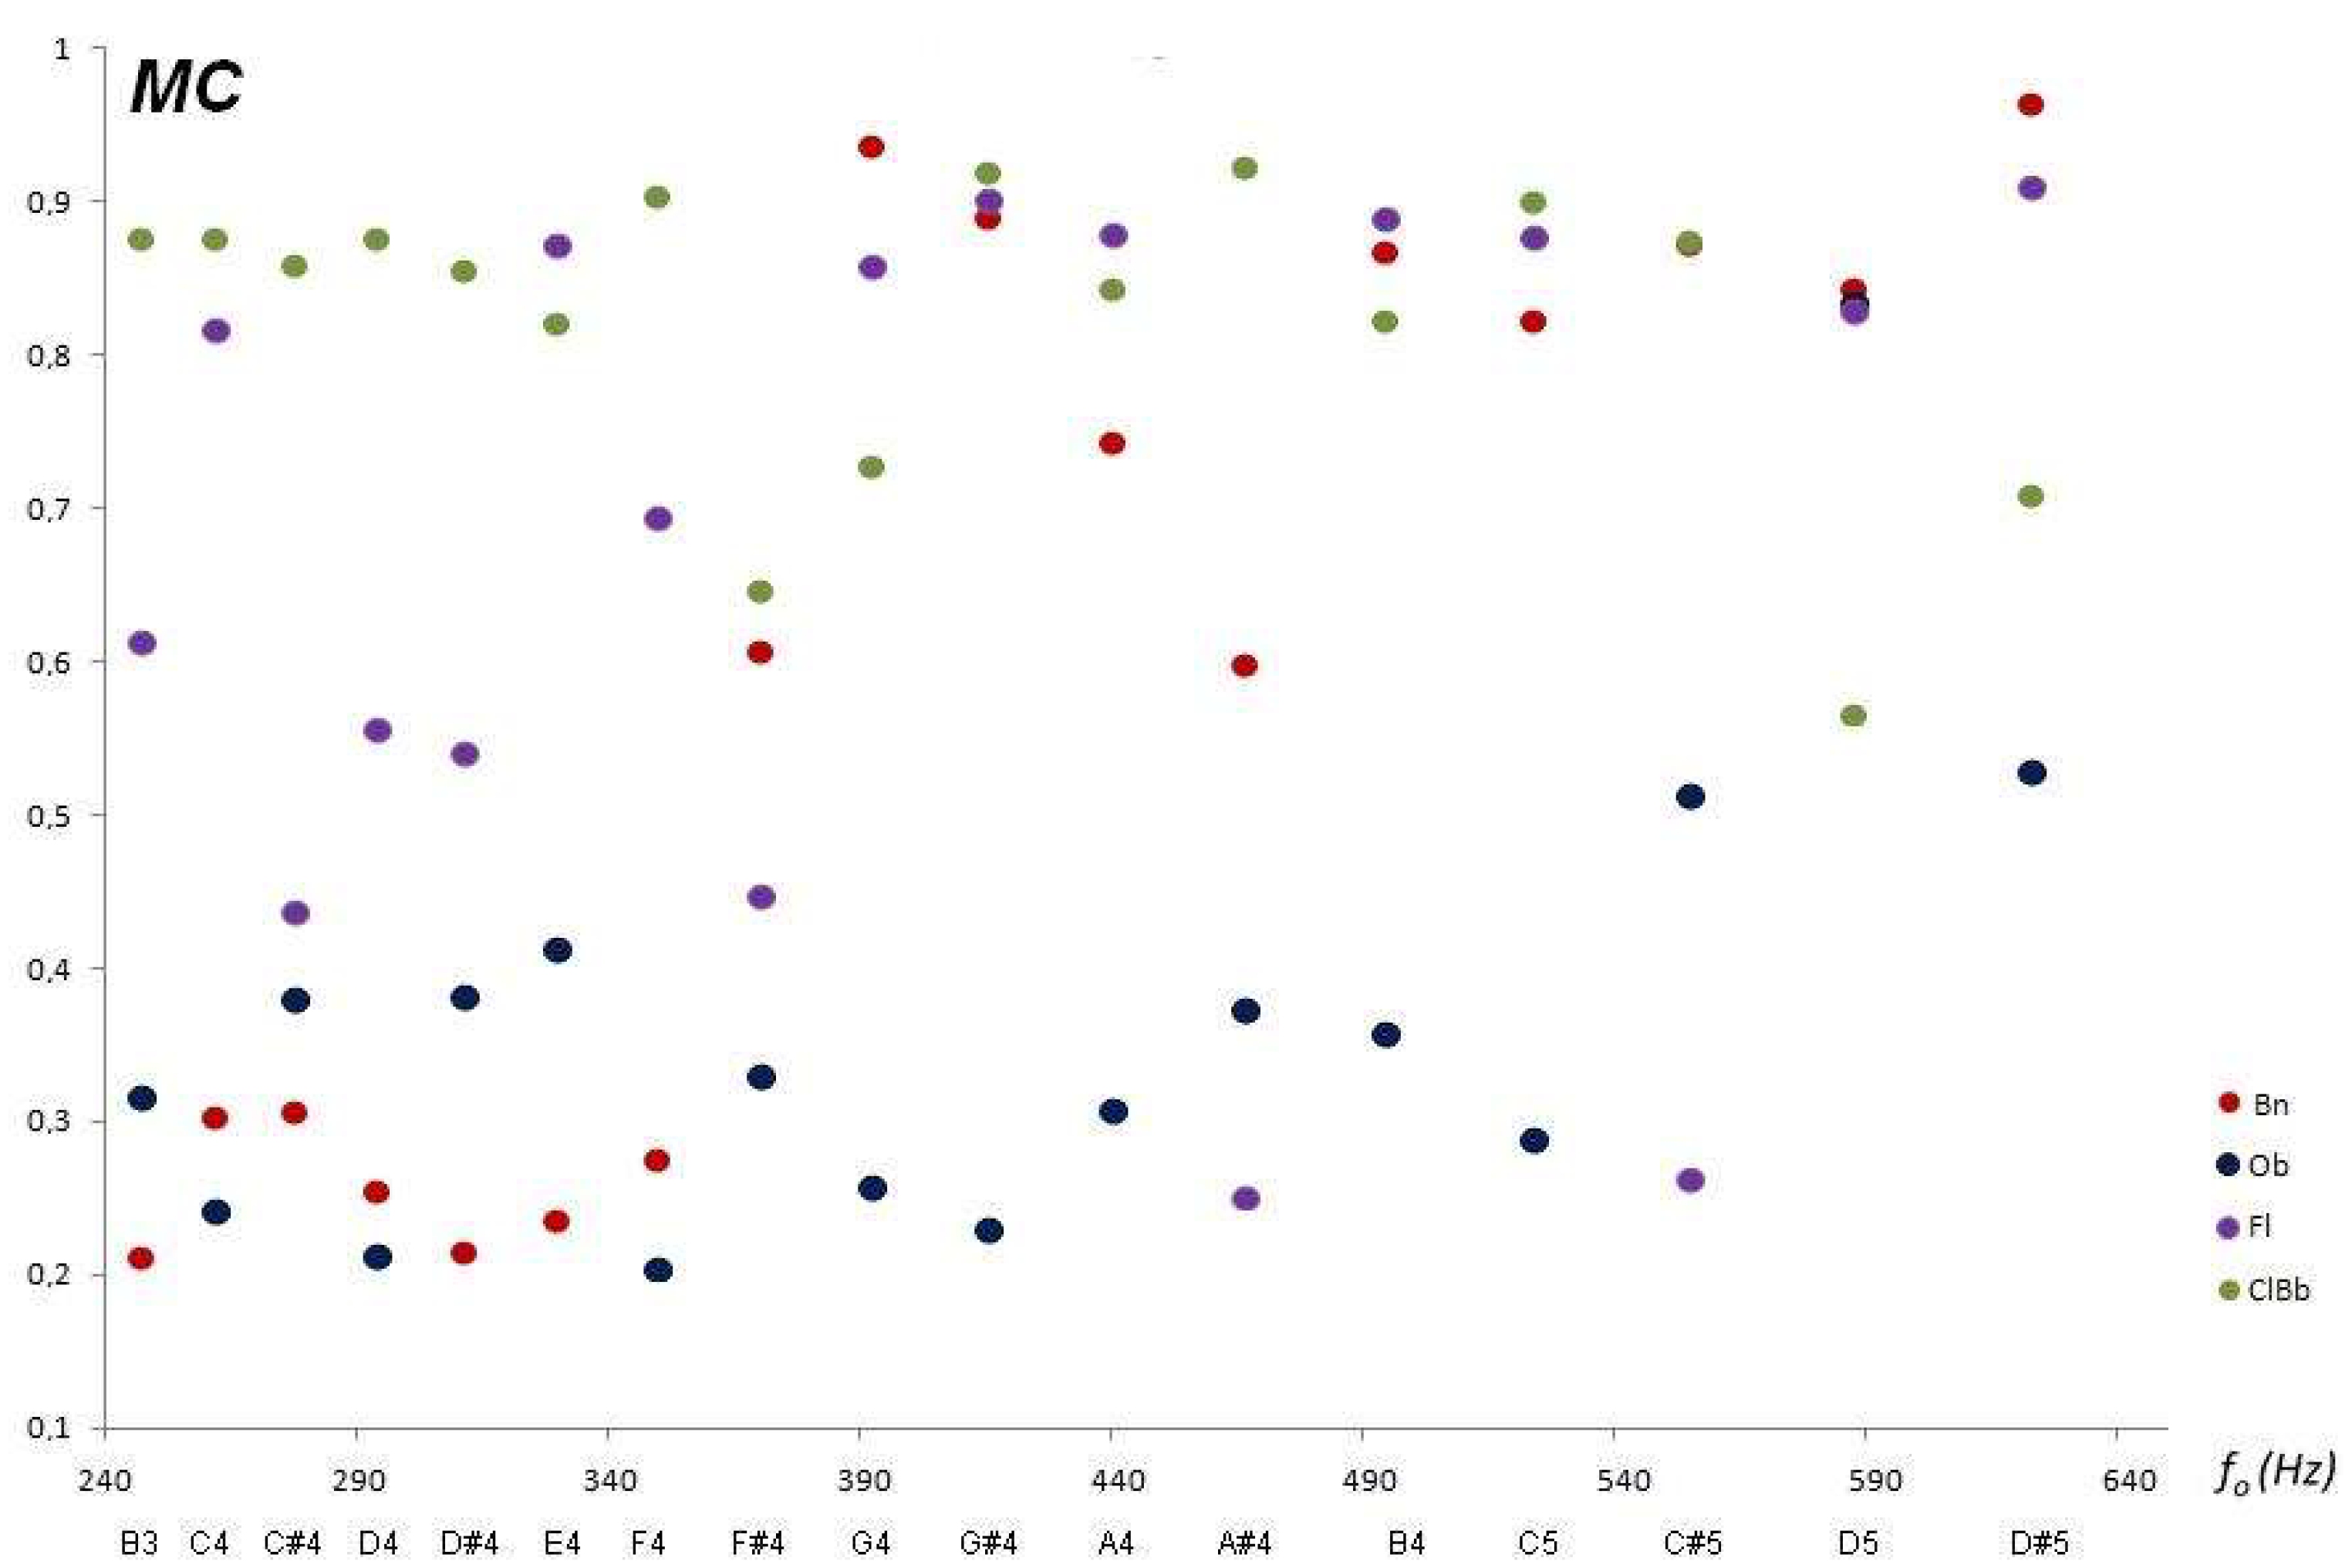
MC values for the common tessitura of the aerophones studied are shown in
Figure 14.
The Bassoon has a greater diversity of partial frequencies for the first half of the musical scale considered because the variations in amplitudes concerning amplitude of the fundamental frequency are greater when compared to other woodwind instruments. The same can be said of the Oboe for the other upper half of the musical scale concerning the other woodwind instruments. The Transverse Flute and the Clarinet exhibit approximately the same contrast of the amplitudes of their secondary frequencies related to the amplitude of the fundamental frequency.
In the appendix, the tables of the coefficients for all the tessitura of the four aerophones studied are presented. In these tables, the first column corresponds to the nominal frequency of the musical sound, the second column the Anglo-Saxon denomination of the musical sound, followed by the fundamental frequency and the centroid obtained utilizing the FFT of the audio records. Then, in the last columns, the values correspond to the coefficients of Affinity (A), Brightness (S), Harmonicity (H), Monotony (M), Mean Affinity (MA), and Mean Contrast (CM).
4. Discussion: Spectral Signatures
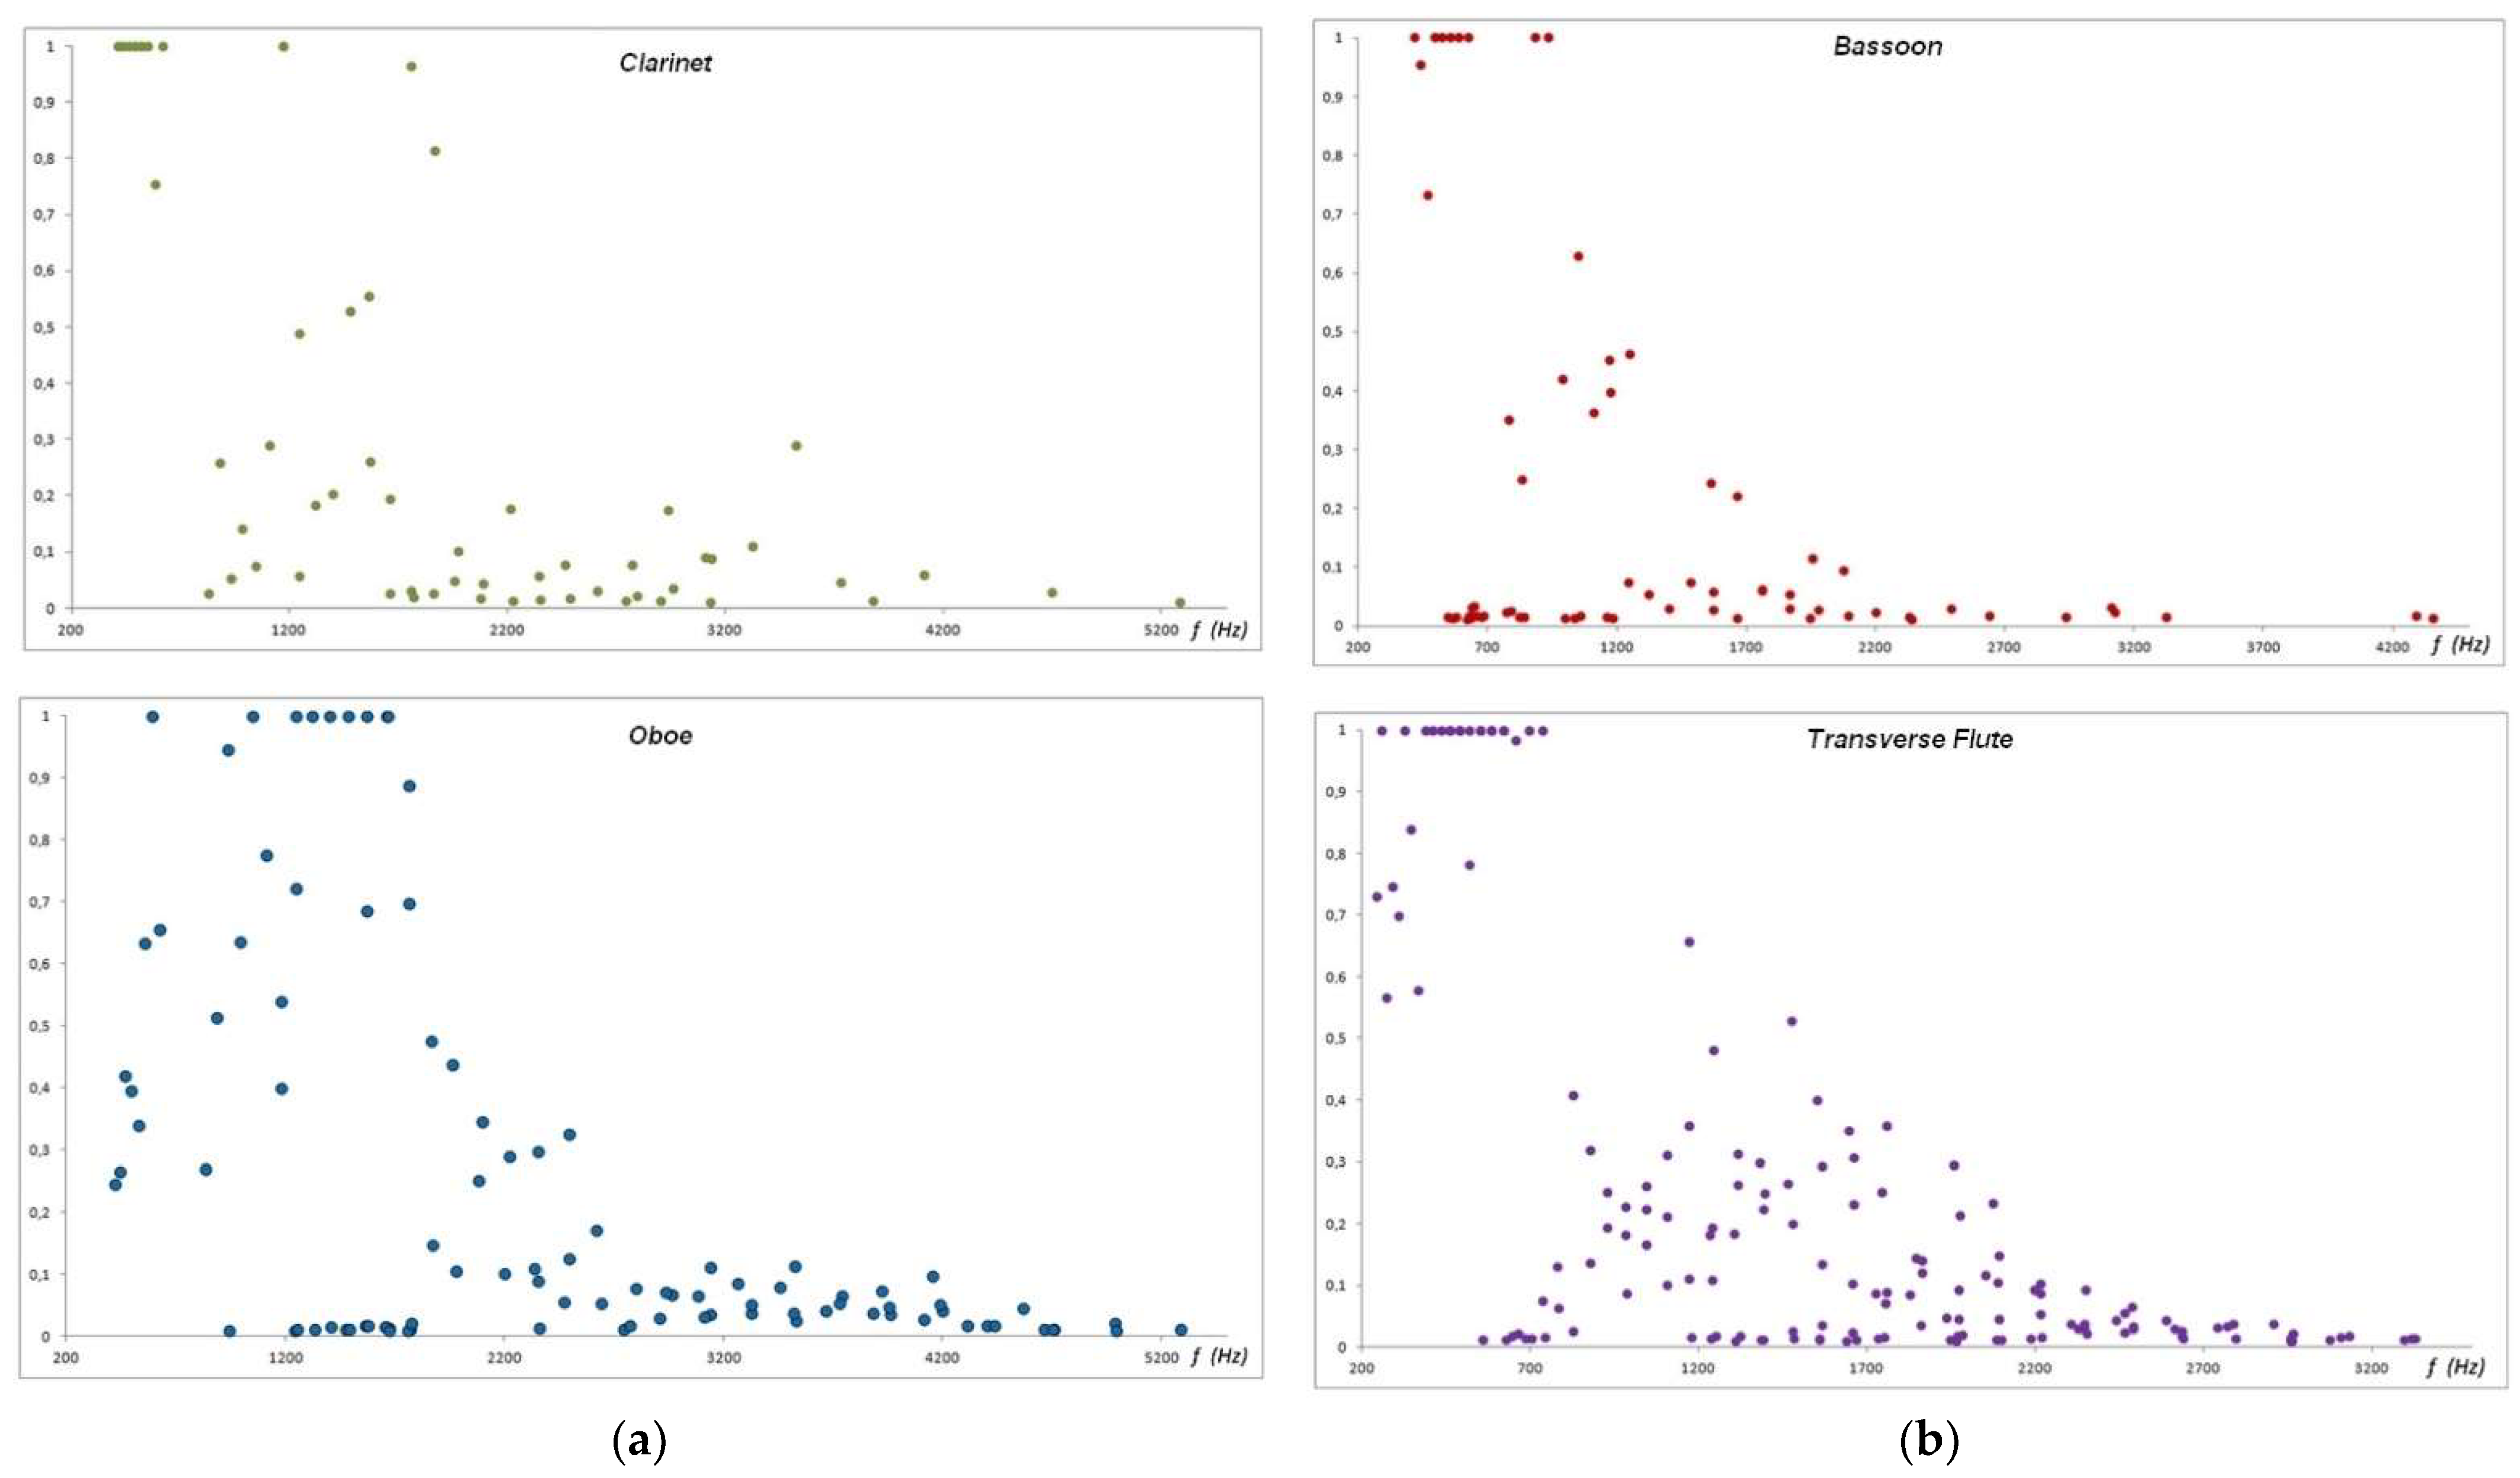
The identification of musical instruments, and in general of the wave emitting source, can be done through the analysis of their spectrum. In the case of electromagnetic radiation, the specific profile of intensities versus wavelength (absorption or emission) allows the identification of the emitter (be it a gas, a reflective surface, or an absorbing medium) and is called Spectral Signature. By analogy, we understand it as an “acoustic spectral signature” as the distribution of frequencies in the Fourier Transform Spectrum of musical sounds (tempered scale) that allow their univocal identification. If we restrict ourselves to the studied aerophones, which are only a small sample of all common musical instruments, a discriminatory identification between them can be made from the presented FFT spectra for common records in the range of B3 sounds to D#5, as shown in
Figure 15.
The harmonic frequencies (
) are those that are related to the fundamental frequency
through the integer multiplicity (
n = 2, 3, 4, …):
It is the case that not all the harmonics of a certain musical sound are always present. This allows, in principle, to discriminate the sounds of one of the aerophones from the others (
Table 1). For a musical sound like B-3, the Oboe is distinguished from the other aerophones by presenting harmonics 2 to 13 inclusive. While the Bassoon lacks harmonic
n = 6, the Flute contains harmonic
n = 6 but lacks harmonic
n = 13 that appears in the Oboe and the Clarinet, and the Clarinet lacks the harmonics
n = 11 and
n = 12 which distinguishes it from the Oboe and the Flute, respectively. From the collection of harmonics listed in
Table 1 it is observed that one aerophone can be distinguished from another in most of the musical sounds of the common tessitura (in the range of sounds B3–D#5), so for example for C#4 the Bassoon only has up to the harmonic
n = 6, the clarinet up to
n = 7, the Flute reaches up to
n = 9, and the Oboe even has harmonics of higher order.
It should be noted that the amplitudes of the obtained and normalized FFTs may present frequencies of negligible values compared to the frequency of greater amplitude. In any case, the harmonics counted in
Table 1 and the calculation of coefficients are only those partial frequencies whose amplitude is greater than or equal to 1% of the maximum amplitude.
This discrimination, in terms of which harmonics are present and which are missing, is not univocal. It presents degeneration, in the sense that for some musical sounds two different aerophones present the same harmonics (highlighted with the symbol * in
Table 1). However, as the FFTs are not the same between any two aerophones, the different relative intensities, through the Affinity and Sharpness coefficients, would allow the completion of the spectral signature and univocal identification of which instrument it belongs (
Figure 16).
The degeneracy of the harmonic frequencies of the C4 sound between the Clarinet and the Bassoon is not resolved with the centroid value (
Figure 2) which is the same for both, but with the coefficient of brilliants
S, for example (
Figure 6). Similarly, all other degenerations can be solved using one or more of the six proposed timbral coefficients.
Thus, for example, the triple apparent degeneration in sound A#4 is solved by using the coefficient of Mean Affinity
AM (
Figure 14) or Mean Contrast (
Figure 16) which allows the musical instrument to be uniquely identified. On the other hand, it should be noted that the number of harmonic frequencies present does not necessarily mean greater harmonicity in the musical sound. Note, for example, that the C#4 sound of the Oboe has 12 harmonics (
Table 1) and yet the value of
H = 14 (
Figure 8) shows great anharmonicity, while the Bassoon with only 4 harmonics exhibits great harmonicity (
H = 0) in the same musical sound. All this illustrates that counting the harmonics present is not enough to determine the harmony of musical sounds.
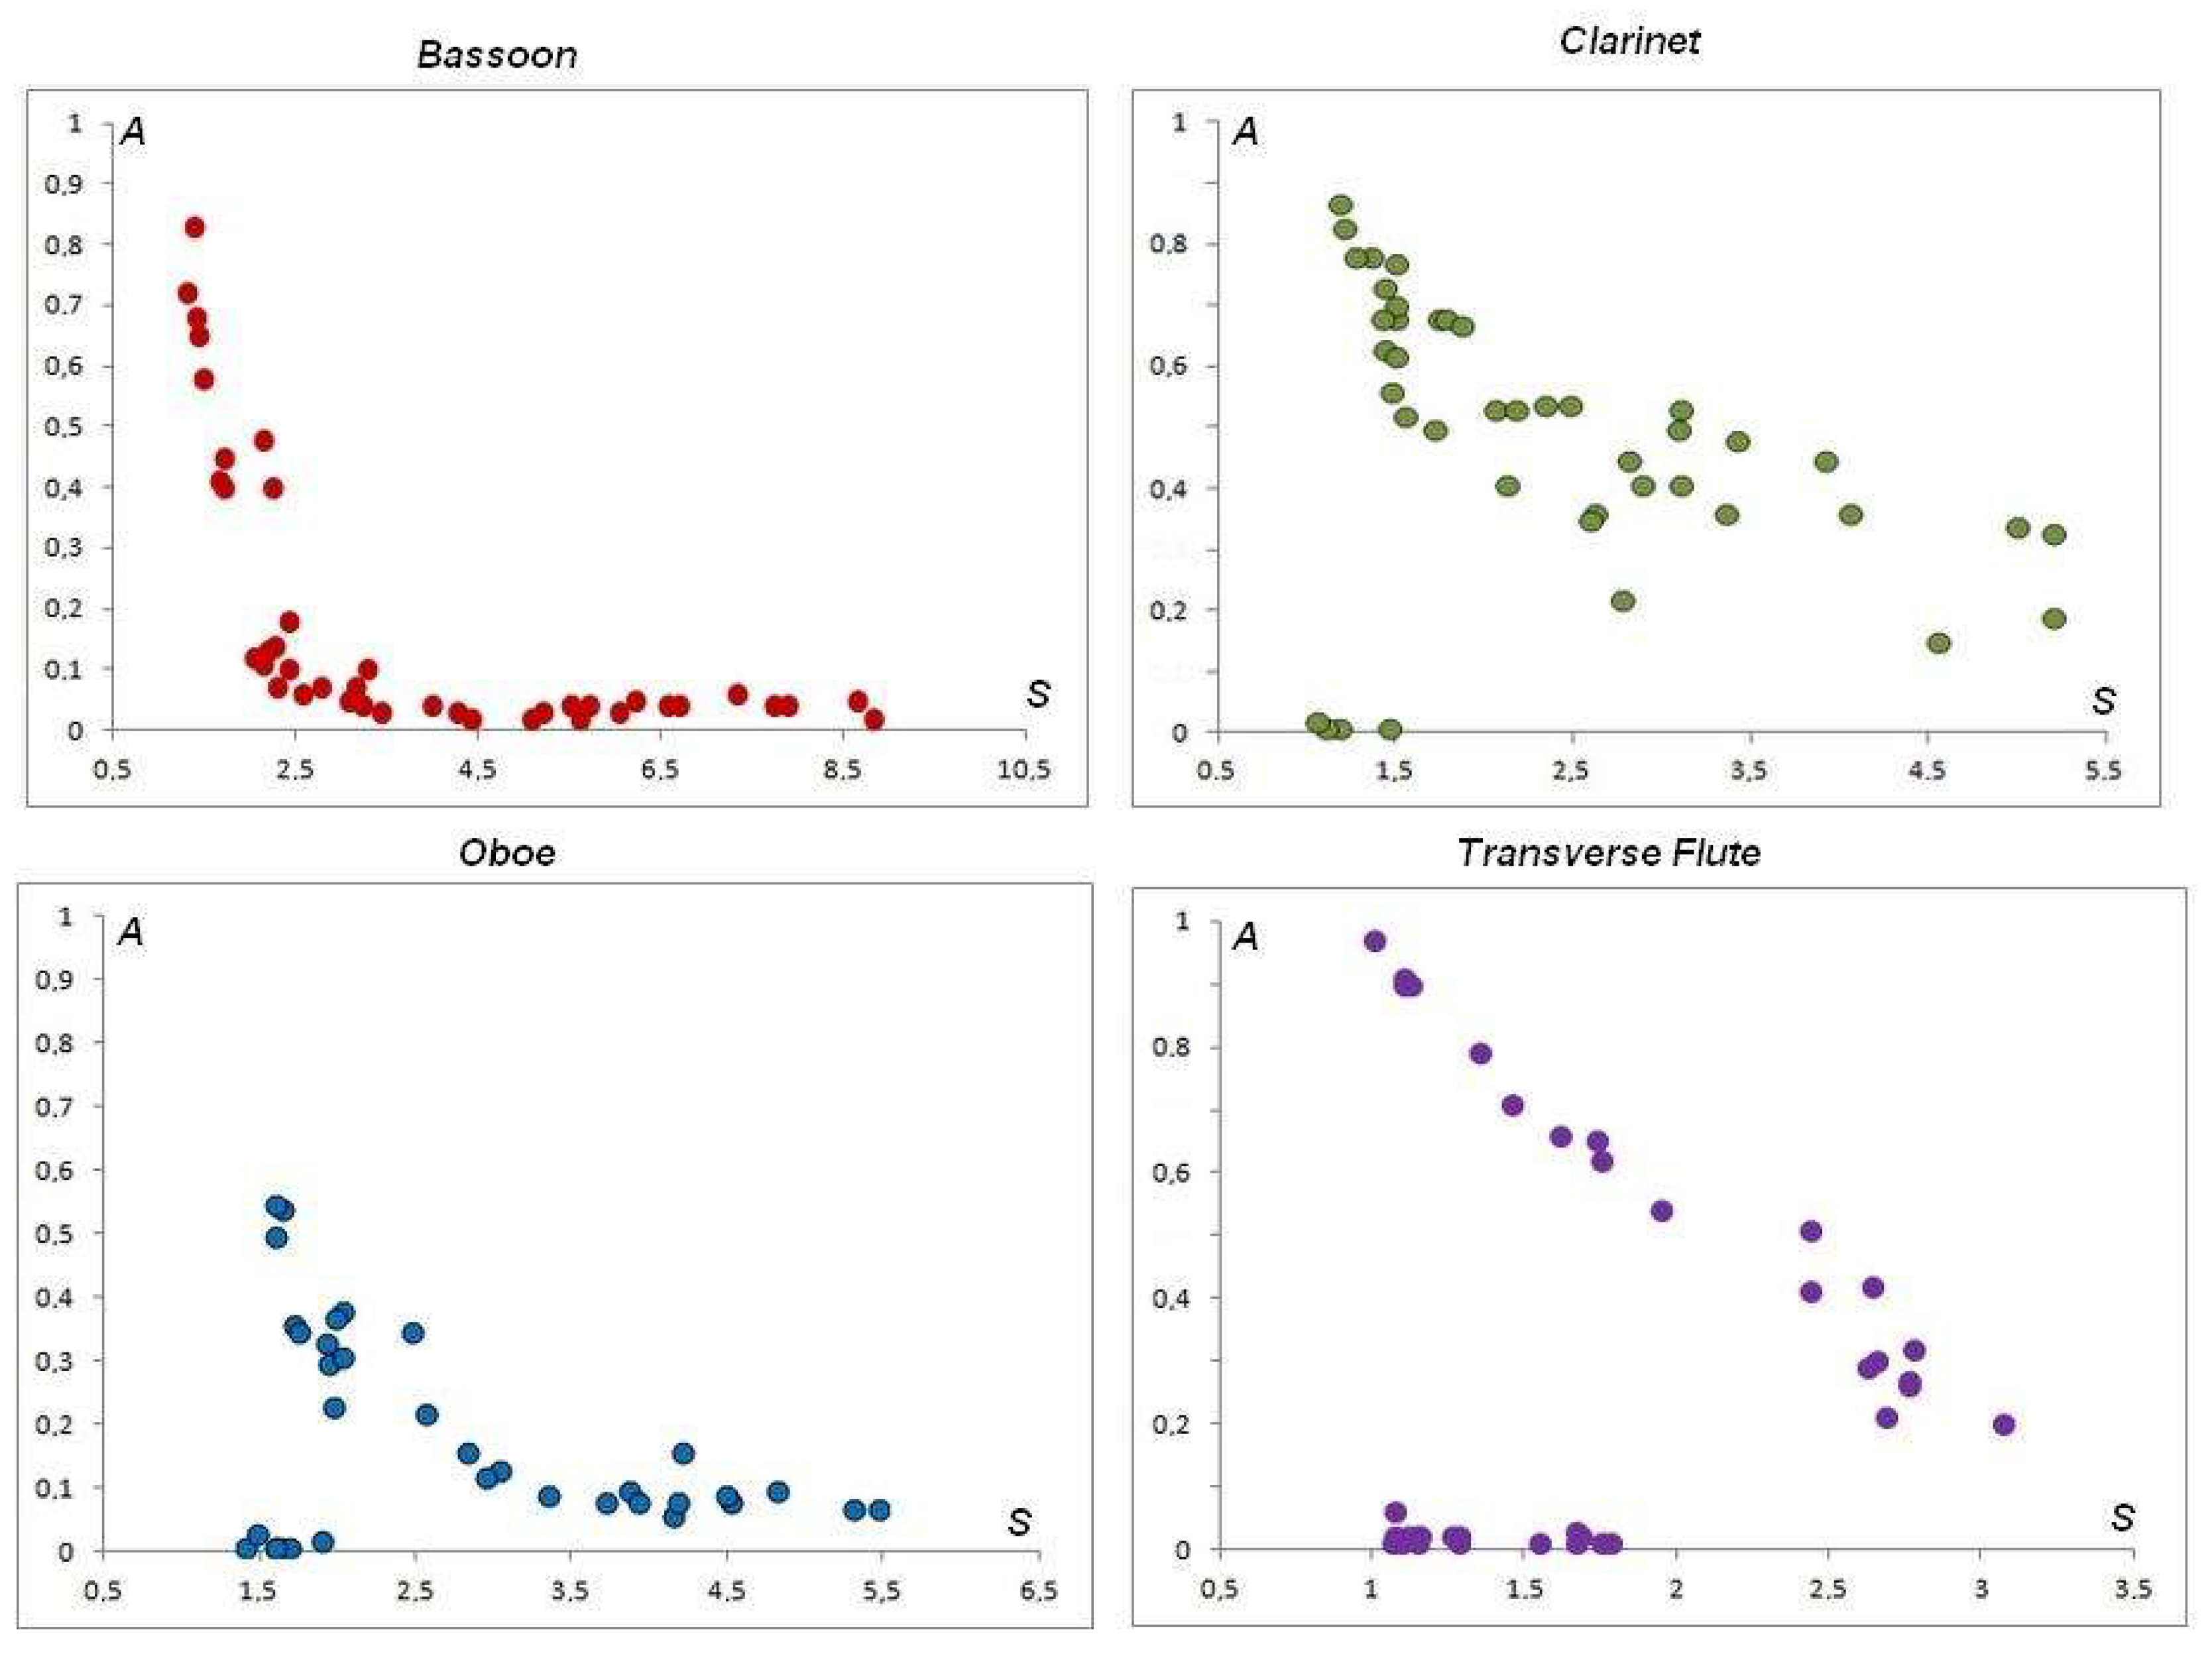
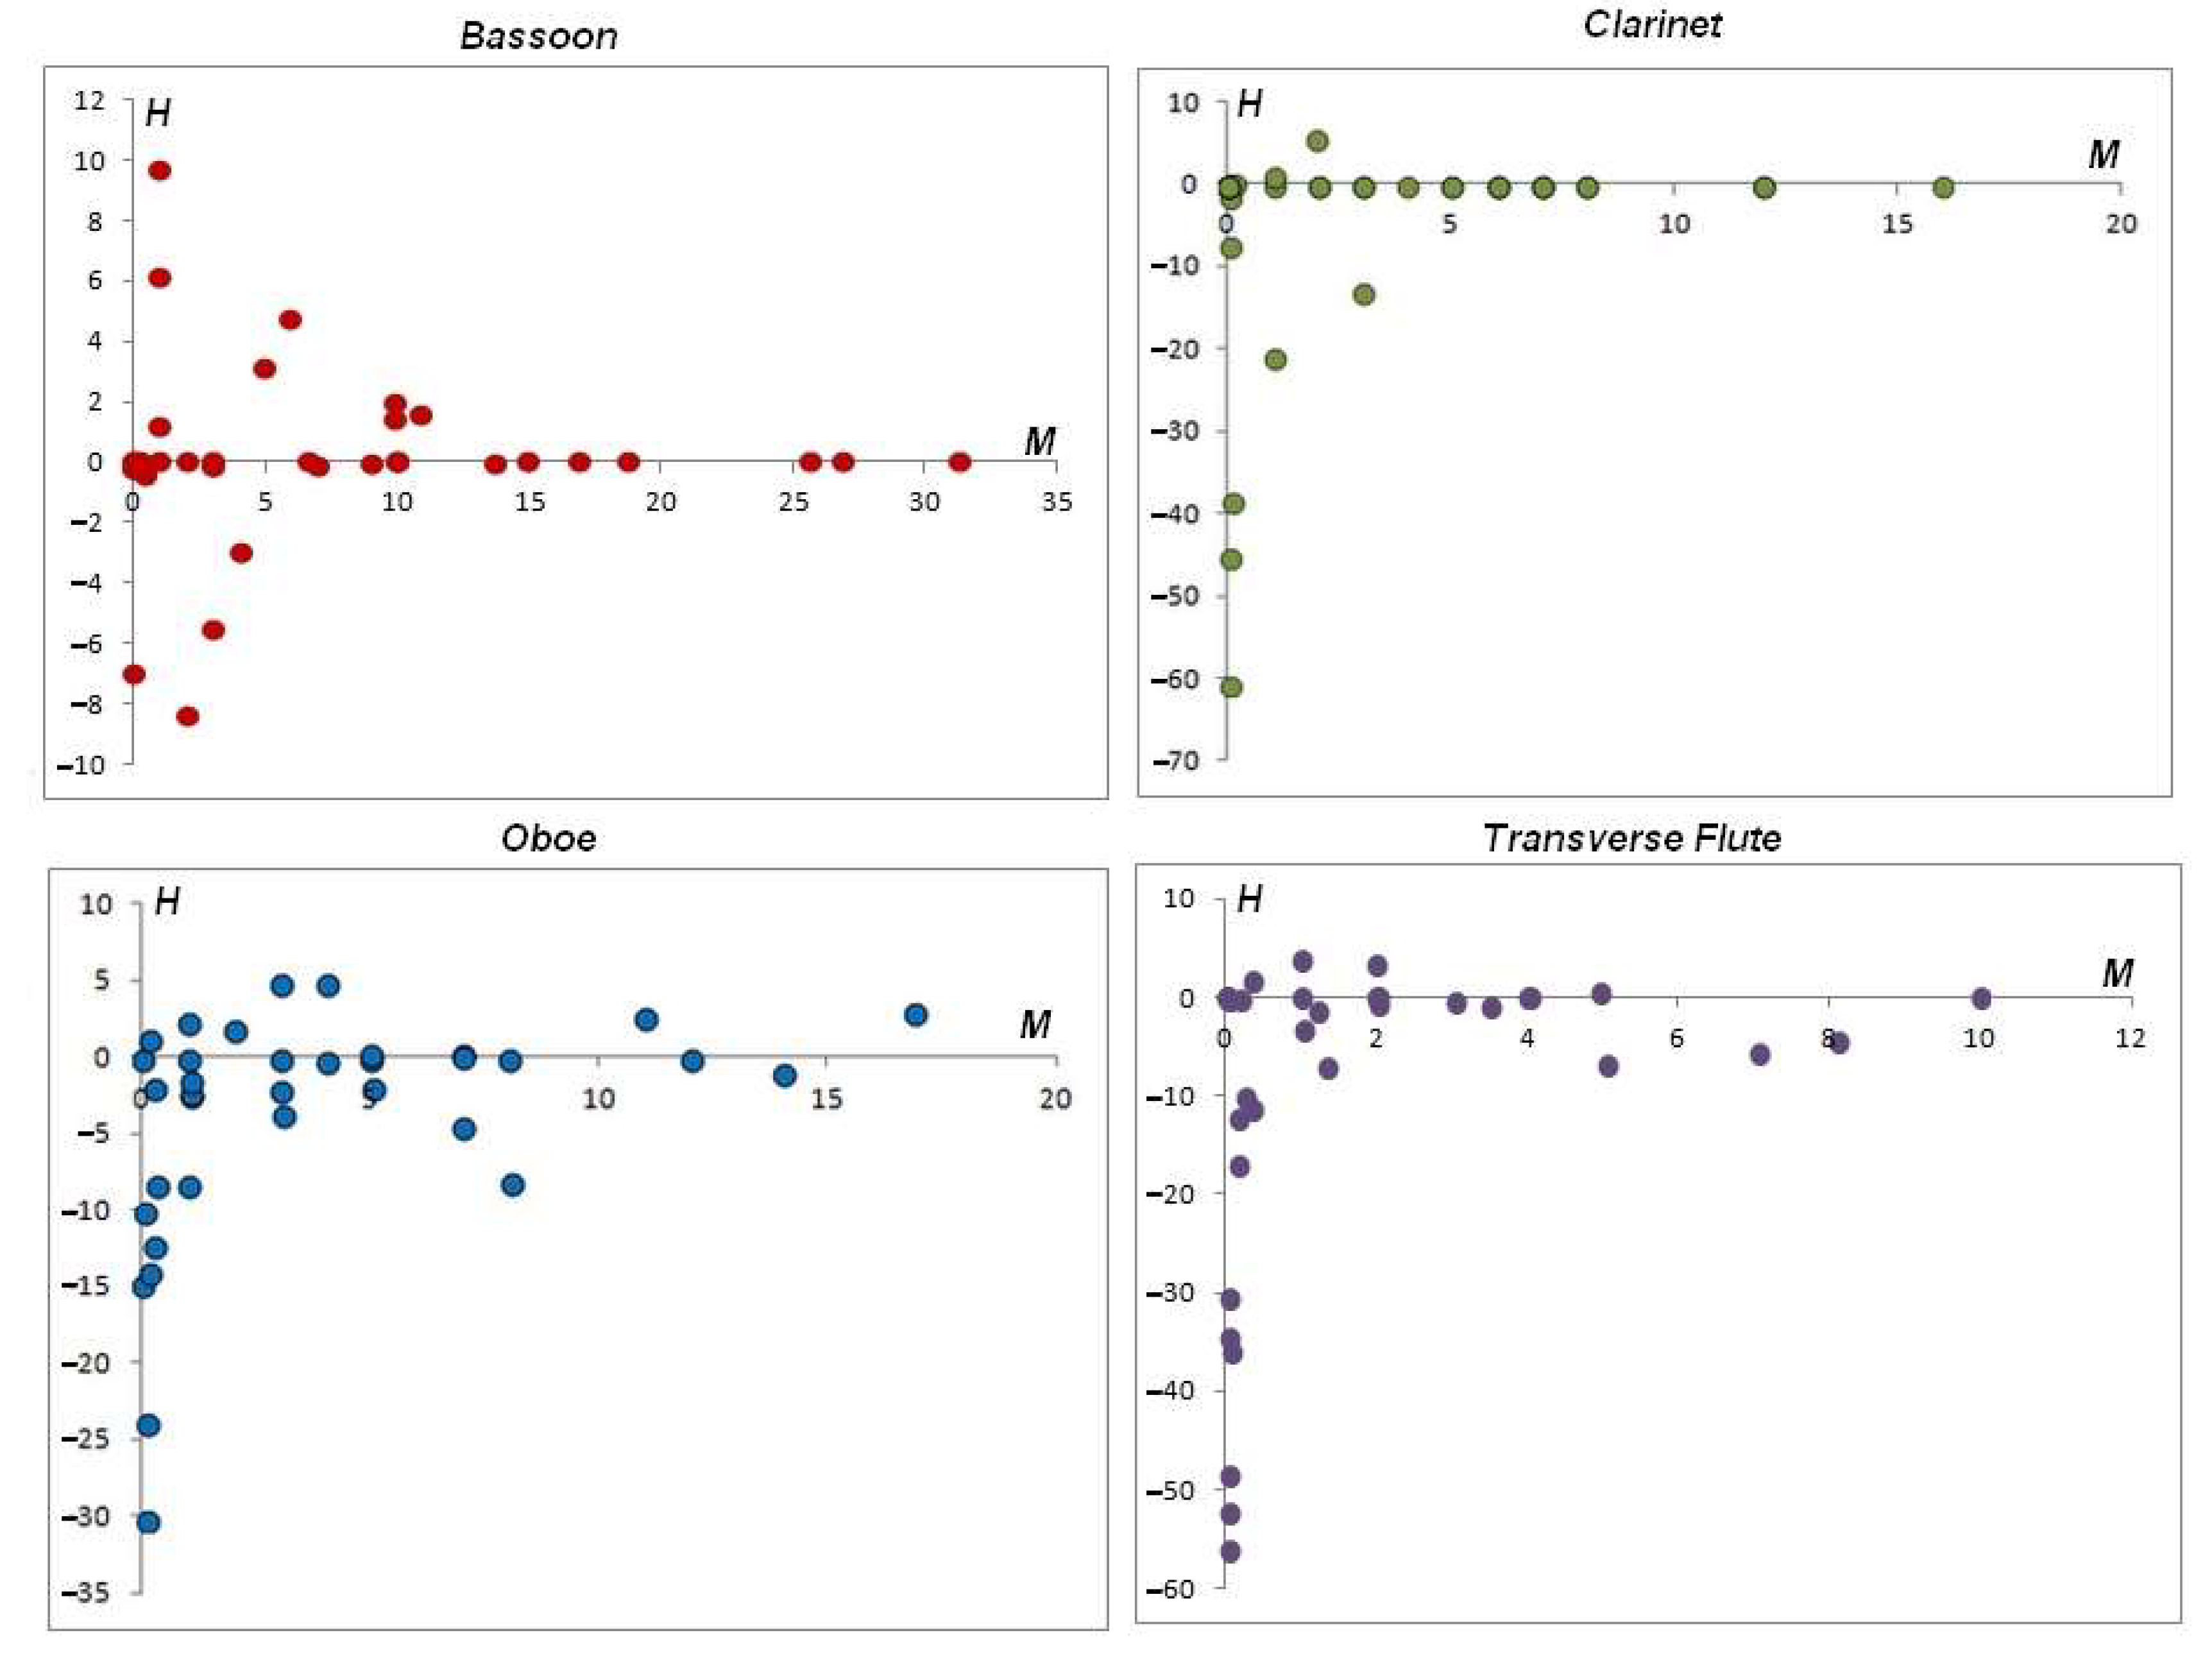
From the preceding analysis, it is inferred that the timbral characteristics of monophonic musical sounds can be represented by a set of six dimensioned coefficients. That is to say that each sound of the tempered scale of a musical instrument corresponds to one and only one point in an abstract space of six dimensions, with coordinates (
A, S, H, M, MA, MC). For certain musical instruments, the collection of points in that timbral space represents a bounded region, which characterizes it.
Figure 16,
Figure 17 and
Figure 18 illustrate this grouping using the two-dimensional projections of the planes
A–
S,
H–
M,
MA–
MC respectively of the sounds of the complete tessitura (
Table A1,
Table A2,
Table A3 and
Table A4 of the
Appendix A) in the aerophones studied. Any monophonic musical sound can be located in said space through the timbral coefficients already defined from the FFT of the audio register and its Euclidean distance from the delimited regions. Therefore, the proposed coefficients would allow, in principle, the evaluation of the timbral characteristics using that can be applied to large dimensional spaces. In future work, we plan to exploit unsupervised machine learning techniques, such as clustering algorithms, to identify patterns from the timbral characteristics.
5. Conclusions
Given the discrete nature of the frequency spectrum of musical sounds, it is possible to construct dimensionless statistical descriptors, which relate the timbral characteristics of the fundamental frequency and the harmonic distribution in the FFTs of simple monophonic musical registers for wooden aerophones. Thus, the proposed timbral descriptors, Affinity and Sharpness, allow distinguishing the timbre of Clarinet, Bassoon, Transverse Flute, and Oboe.
The coefficients of Harmonicity, Monotony, Mean Affinity, and Mean Contrast are sufficient to describe the distribution of harmonics in the FFTs of the aerophones studied, observing distinctions and variabilities between the different sounds of the musical scale for the same instrument.
The Spectral Signature of the wooden aerophones, which allows the identification of the timbre for the instruments studied, can be obtained through the FFT by the distribution of harmonics present outside the loudness range of the common tessitura (B3–D#5). The number of harmonics present and their succession does not always characterize the timbre between different aerophones, and there may be degeneration (two or more instruments with equal harmonics); however, with the proposed coefficients, the musical timbre, by monophonic musical sound, is uniquely identified in the studied aerophones.
The FFT coefficients proposed in this work allow analyzing digital audio records of musical sounds, generating a unique spectrum that characterizes them. This spectrum is a finite, bounded, and countable collection of discrete frequencies with different amplitudes. We verify that, with the six proposed coefficients, we are able to discriminate between timbre differences and similarities for the set of test audios.
Their visualization in two-dimensional arrangements reveals some grouping patterns for specific instruments. We believe that this approach can be further extended to use multidimensional unsupervised that can be analyzed using Machine Learning techniques, such as clustering. Therefore, the characterization of the musical timbre is susceptible to being extended and automated.
The proposed timbral coefficients allow us to reduce the problem of the timbral characterization of musical instruments to a grouping problem in an abstract space of six dimensions for monophonic musical sounds. Therefore, in future work, we plan to perform a correlation analysis with the proposed coefficients, in addition to using unsupervised machine learning techniques.
To sum up, it is concluded that the proposed descriptors sufficiently describe the timbral characteristics in the aerophones studied and differentiate them, allowing their recognition and classification from the FFTs of the audio records. Finally, it is important to highlight that the proposed timbral coefficients can be extended to any of the melodic musical instruments, since the used methods are indifferent to the instruments studied.
