Article

Estimation of Azimuth and Elevation for Multiple Acoustic Sources Using Tetrahedral Microphone Arrays and Convolutional Neural Networks

by
Saulius Sakavičius
and
Artūras Serackis
*
Department of Electronic Systems, Vilnius Gediminas Technical University (VILNIUS TECH), LT-03227 Vilnius, Lithuania
*
Author to whom correspondence should be addressed.
Electronics 2021, 10(21), 2585; https://doi.org/10.3390/electronics10212585
Submission received: 27 August 2021 / Revised: 14 October 2021 / Accepted: 18 October 2021 / Published: 22 October 2021
(This article belongs to the Special Issue Applications of Audio and Acoustic Signal)

Abstract

:
A method for multiple acoustic source localization using a tetrahedral microphone array and a convolutional neural network (CNN) is presented. Our method presents a novel approach for the estimation of acoustic source direction of arrival (DoA), both azimuth and elevation, utilizing a non-coplanar microphone array. In our approach, we use the phase component of the short-time Fourier transform (STFT) of the microphone array’s signals as the input feature for the CNN and a DoA probability density map as the training target. Our findings imply that our method outperforms the currently available methods for multiple sound source DoA estimation in both accuracy and speed.

1. Introduction

Sound source localization (SSL) is an important topic in robotics, autonomous vehicles, public security, conferencing, sound engineering, and other fields. Applications of sound source localization include speaker location search in teleconference, event detection and tracking, and robot movement in an unknown environment [1,2]. Sound source localization solutions, implemented on edge computing devices may be a complementary localization solution for human rescue challenges in Underground Mine [3], applied as a monitoring or predictive maintenance solution [4,5,6].
Direction of arrival (DoA) of one or more active sound sources may be used to steer the directivity pattern of a microphone array in ambient intelligence [7] or security-surveillance systems [8].
The DoA is most commonly represented as a set of two angles (azimuth, θ and elevation, ϕ). In most physical acoustic–electronic systems, the DoA is derived from the signals of a microphone array using a variety of signal processing methods.
Many numerical SSL methods for the localization of one or more sound sources were proposed throughout the years, such as generalized cross-correlation with phase transform (GCC-PHAT), steered-Response Power Phase Transform (SRP-PHAT) [9], minimum variance distortion-less Response (MVDR) beamformer, multiple signal classification (MUSIC) algorithm. These methods are often either computationally intensive or perform poorly in adverse (noisy, reverberant) acoustic conditions.
The performance of TDoA based SSL methods deteriorate in reverberant environments because of the multipath propagation, which, in the context of the image-source method, creates additional image sources and the real source position is mistaken for an image source position [10].
For another example, the SRP-PHAT algorithm has been shown to be one of the most robust sound source localization approaches operating in noisy and reverberant environments. However, its practical implementation is usually based on a costly fine grid-search procedure, making the computational cost of the method a real issue [11]. Due to the ability to approximate complex functions, learning-based sound source localization methods might be further advantageous in such circumstances.
In recent years, several authors proposed to apply an artificial neural network (ANN) for SSL [1,12,13,14]. A wide variety of input features were proposed, ranging from inter-aural level difference (ILD) [15] and inter-aural time difference (ITD) per frequency [16] to MUSIC eigenvectors [13,17]. The authors also used different output types: a set of the sound source coordinates [15,18]; a likelihood-based coding for localization of multiple active sound sources. An application of recurrent neural networks (RNNs) for SSL was investigated in [19]. Sound source localization using ANN is commonly formulated either as a classification [20,21,22,23,24,25,26,27,28], or a regression problem [29,30,31,32,33]. In the case of the regression problem, the output of the ANN is a one, two or three-dimensional vector (in the case of a single sound source [34,35]) or a set of vectors (in the case of a multiple source localization [36,37,38]). In the case of the classification problem, the input features are classified to an array of spatial classes, representing the source coordinates in one, two, or three dimensions.
An end-to-end (audio signal frame to sound source coordinates) solution was proposed by Vera-Diaz et al. [18], but only for a single active sound source. Moreover, for the generation of the data used for the training and evaluation of the ANN, the acoustics of the room were not considered.
A method for the estimation of the DoAs of an unknown number of sound sources using an ANN was proposed by He et al. [39]. The authors used a multi-layer perceptron (MLP) with GCC-PHAT coefficients as input features and a CNN with GCC-PHAT on a mel-scale filter bank as input features for the estimation of an unknown number of sound sources. The microphone array consisted of four coplanar microphones, mounted on a robot head. Features were calculated for 170 ms duration audio frames. The system was able to estimate the azimuth angles for two simultaneously active sound sources with features obtained from real audio recordings. He et al. proposed a format of ANN output coding that resembles a spatial spectrum, which is a function that peaks at the true DOAs and that is constructed using Gaussian kernels. The output coding is a vector that represents the probability density of a sound source being active at a particular azimuth.
A method for multiple acoustic source DoA estimation (azimuth only) using a CNN, trained on synthetic noise signals, was proposed by Chakrabarty and Habets [21]. Phase components of the STFT frame of the source signal were used as CNN input features and a vector representing the posterior probability of a sound source being active at a particular azimuth was used as a desired output during CNN training.
Laufer-Goldshtein et al. in their work showed that the multidimensional acoustic features lie on a manifold embedded in a low-dimensional space and that these multidimensional acoustic features exhibit spatial smoothness [40]. From their investigation, it was clear that for sound sources that are spatially close, the acoustic features are also close in the embedded low-dimensional space.
It might be speculated that the multipath propagation artefacts that manifest themselves in the acoustic features and that cause the deterioration of the performance of the conventional SSL algorithms, are used in an advantageous manner by the ANN to actually increase the accuracy of the predicted sound source location and also taking into account the spatial smoothness of the input feature space.

2. Materials and Methods

We propose a method for multiple acoustic source azimuth and elevation estimation using CNN. The neural network trained using the phase component of the STFT, estimated from the microphone array signals, as the input feature and a 2-dimensional map of DoA posterior probability, referred to as a DoA heatmap from now on, as the output feature.
Our method based on the idea of azimuth angle estimation for multiple acoustic sources proposed by Chakrabarty and Habets [21]. However, we extend the method to estimate the elevation of the acoustic source besides the azimuth angle.
We extend on our previous work [41], where we have used the same approach regarding the tetrahedral microphone array geometry and the structure of the target 2D DoA heatmap feature. However, instead of features based on a Cross-Correlation of frequency bands we now use the phase component of the STFT applied to the microphone array signals. Thus, we omit the explicit feature extraction step and rely on the CNN to learn the feature extraction during the training.
An additional contribution in this paper is the ability of our proposed method to estimate the azimuth and elevation for multiple active acoustic sources simultaneously.

2.1. Justification of Tetrahedral Array Geometry

It can be shown that by utilizing a co-planar array it is impossible to uniquely estimate the azimuth and elevation of the source, since there are two valid candidate positions for every source elevation that is not co-planar with the array [42]. To overcome this, we propose utilizing a non-co-planar microphone array. The simplest non-co-planar geometry is a tetrahedron. Therefore, as in our previous investigation, we used the same tetrahedral microphone array geometry [41].
Vertex coordinates M = [ A , B , C , D ] of a tetrahedron that is centered at m c and has a side length of m side are calculated as follows:
A = m c ( x ) m side 2 , m c ( y ) sin ( π / 3 ) · m side 2 , m c ( z ) sin ( π / 3 ) · m side 2 ,
B = m c ( x ) , m c ( y ) + sin ( π / 3 ) · m side 2 , m c ( z ) sin ( π / 3 ) · m side 2 ,
C = m c ( x ) + m side 2 , m c ( y ) sin ( π / 3 ) · m side 2 , m c ( z ) sin ( π / 3 ) · m side 2 ,
D = m c ( x ) , m c ( y ) , m c ( z ) + sin ( π / 3 ) · m side 2 .

2.2. The Role of the CNN in DoA Estimation

Acoustic source positions can be estimated from the acoustic signals received by a microphone array. We propose a CNN-based method to obtain the estimates of the azimuth and elevation of the acoustic sources with respect to the position and orientation of the microphone array. The CNN must be trained by providing training samples consisting of the input features and the corresponding outputs. After training, the CNN provides an estimate of the azimuth and elevation angle for a current set of features presented to the input.

2.3. Estimation of Input Features

Extending the work of Chakrabarty and Habets [21], we used the phase component of the STFT calculated for microphone array signals. However, we did not explicitly take into account the W-disjoint orthogonality of the signals. According to Chakrabarty and Habets [21], in the case of a NS-source scenario, each of the sources is simulated using the image-source method separately. Then the STFTs of the receiver signals are concatenated and randomly permuted in both time and frequency domains (leaving only the channel order unchanged). In our case, we permute the signals in the time and frequency domains, only preserving the original order of the channels, and we simulate all the NS acoustic sources at once, so their respective spectral components are present in each time frame.
The preparation of input features is carried out in several steps. First, the STFTs of the simulated microphone signals are calculated. For each of the NM = 4 microphone channels were set the number of Fast Fourier Transform (FFT) points equal to NSTFT = 512 , with 256 point overlap and a Hann windowing function. The number of frequency bins in the STFT was N f = N STFT / 2 + 1 = 257 . For each simulation NT = 4 temporal STFT frames were obtained. As a result, we created an array of size ( N S × N M ) × N f × N T .
Next, the concatenated STFT is randomly permuted along the time and frequency dimensions, keeping the original order of elements only in the channel dimension.
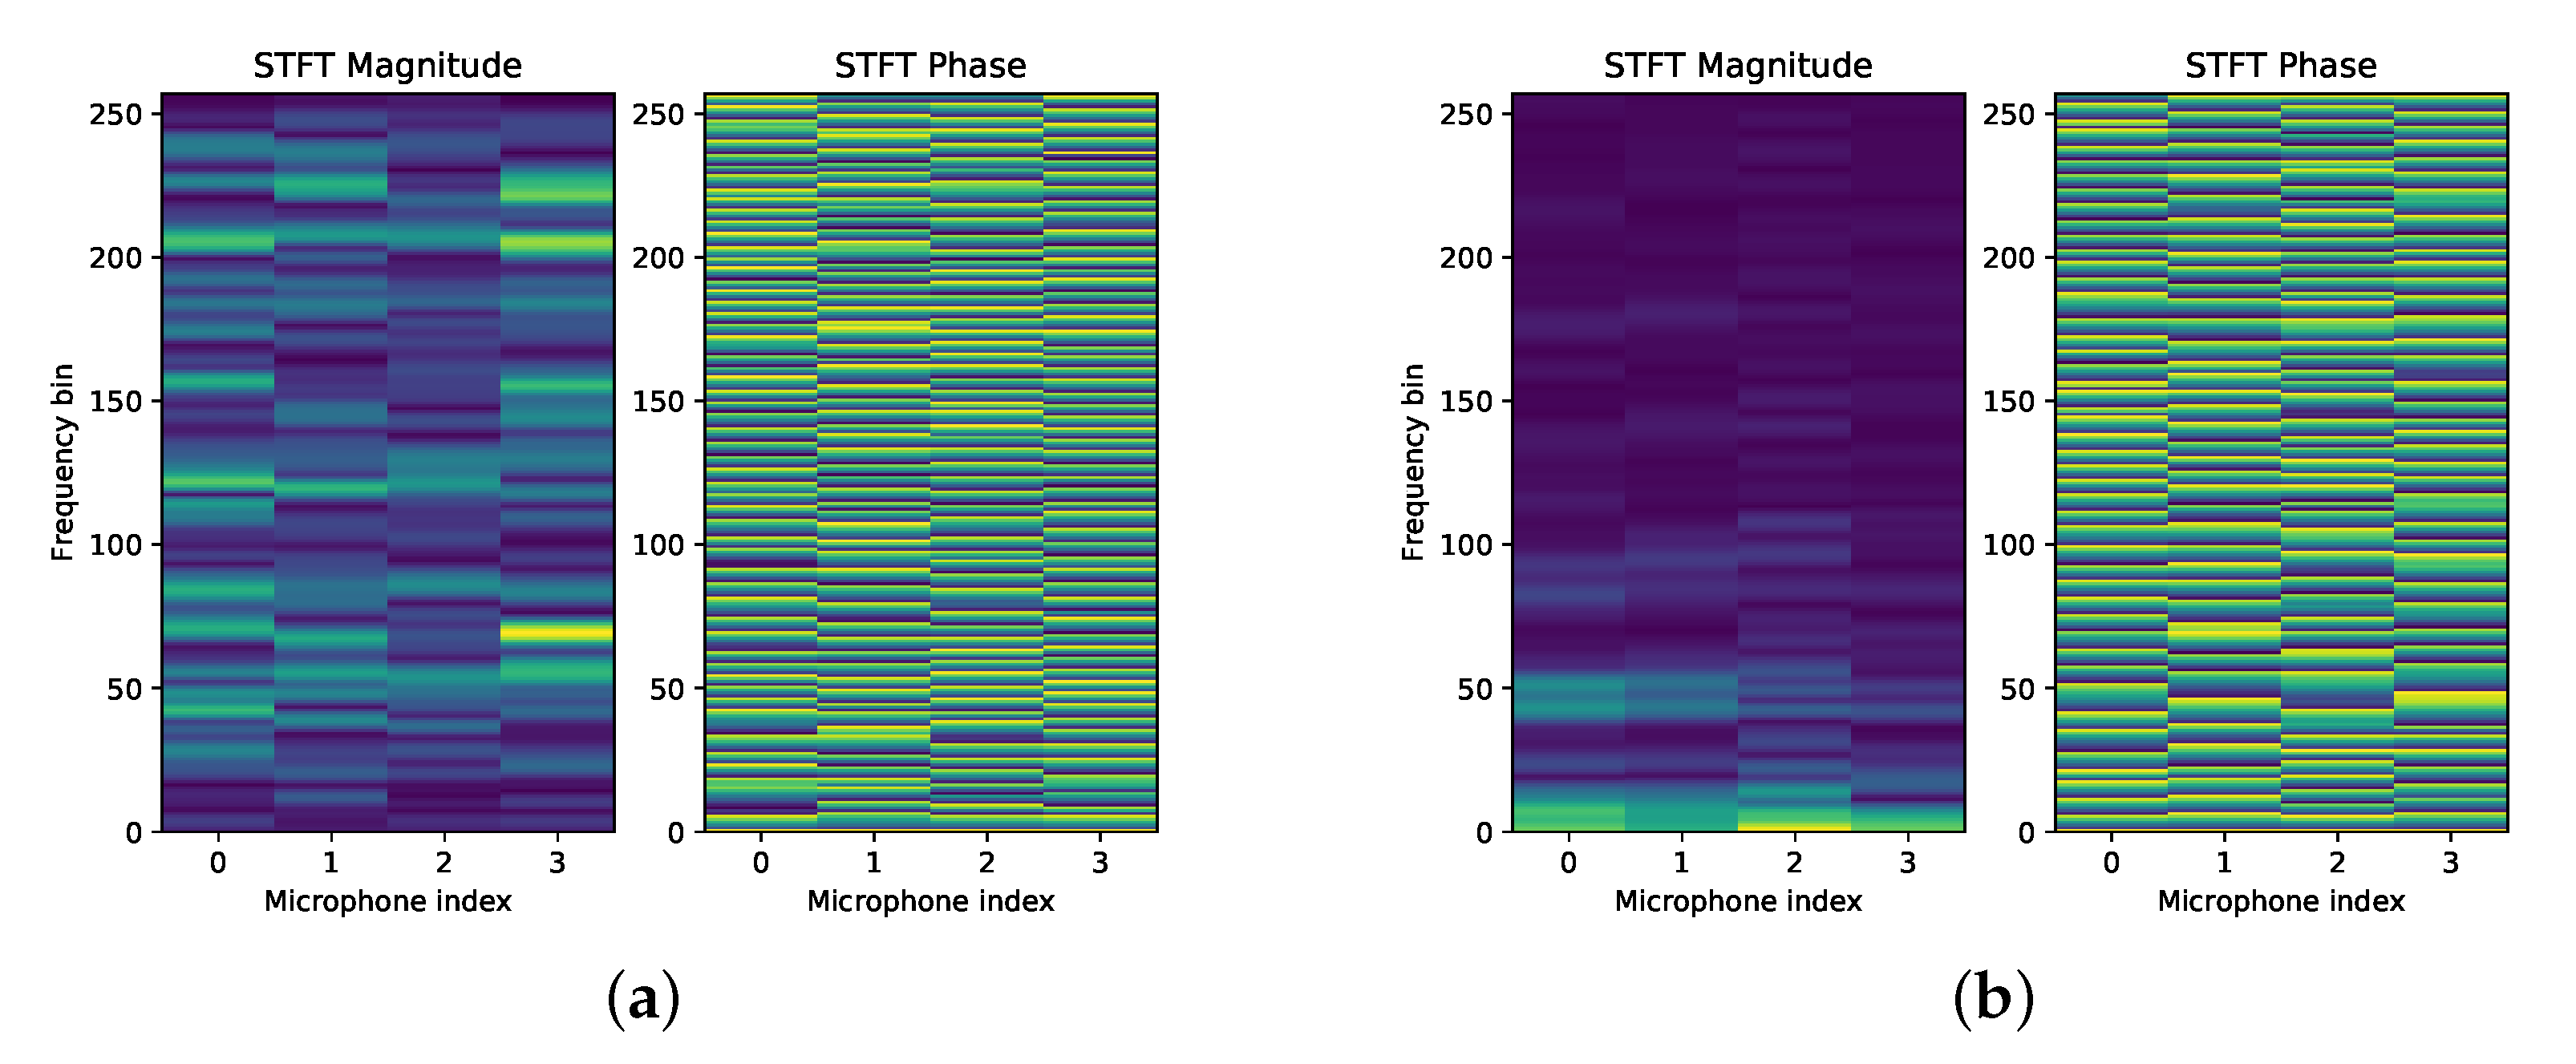
Examples of the prepared input features are presented in Figure 1. STFT frames for four microphones are presented; training STFT sample (noise signal) in Figure 1a and the testing STFT sample (speech sample) in Figure 1b.
As the input features, we use a single temporal frame of the resulting data structure—a matrix with N M × N f = 4 × 257 elements. Each matrix of input features in the training dataset has an associated desired output—a two-dimensional DoA heatmap.

2.4. Desired Outputs

In the proposed method, a 2D DoA heatmap is used as a desired output for each matrix of input features. The heatmap is a matrix of N × M elements, where each element represents a certain azimuth and elevation angle range. The value of each element represents the probability of an acoustic source being active at a particular azimuth and elevation. Total range of the DoA heatmap represents a 360° azimuth range along θ axis and a 180° elevation range along ϕ axis. The number of elements of the heatmap per azimuth and elevation axes, respectively, Qθ and Qϕ represent the angular resolution of the DoA heat map.
During the generation of the training dataset, to reduce the sparsity of the target feature, we additionally applied Gaussian blurring to the DoA heatmap using a 2D Gaussian kernel with separately controllable spread parameters σθ and σϕ on the θ and ϕ axes, respectively. Acoustic features exhibit spatial smoothness that is reflected in the feature space [40]. Conversely, an ANN is expected to classify such neighboring input features to neighboring classes in the output. Therefore, we speculate that the DoA heatmap blurring operation would allow the CNN to learn to map features that are nearby in the feature space to neighboring DoA classes. The values at the output layer of the ANN represent the posterior probability of a feature being obtained for a sound source at a particular DoA. A feature for a source with a particular DoA can be viewed as having lower but non-zero posterior probability of being obtained for a source with a slightly different (neighboring) DoA. Thus we believe that this angular smoothing of the DoA heatmap would be beneficial for the learning of the ANN as well as its robustness.
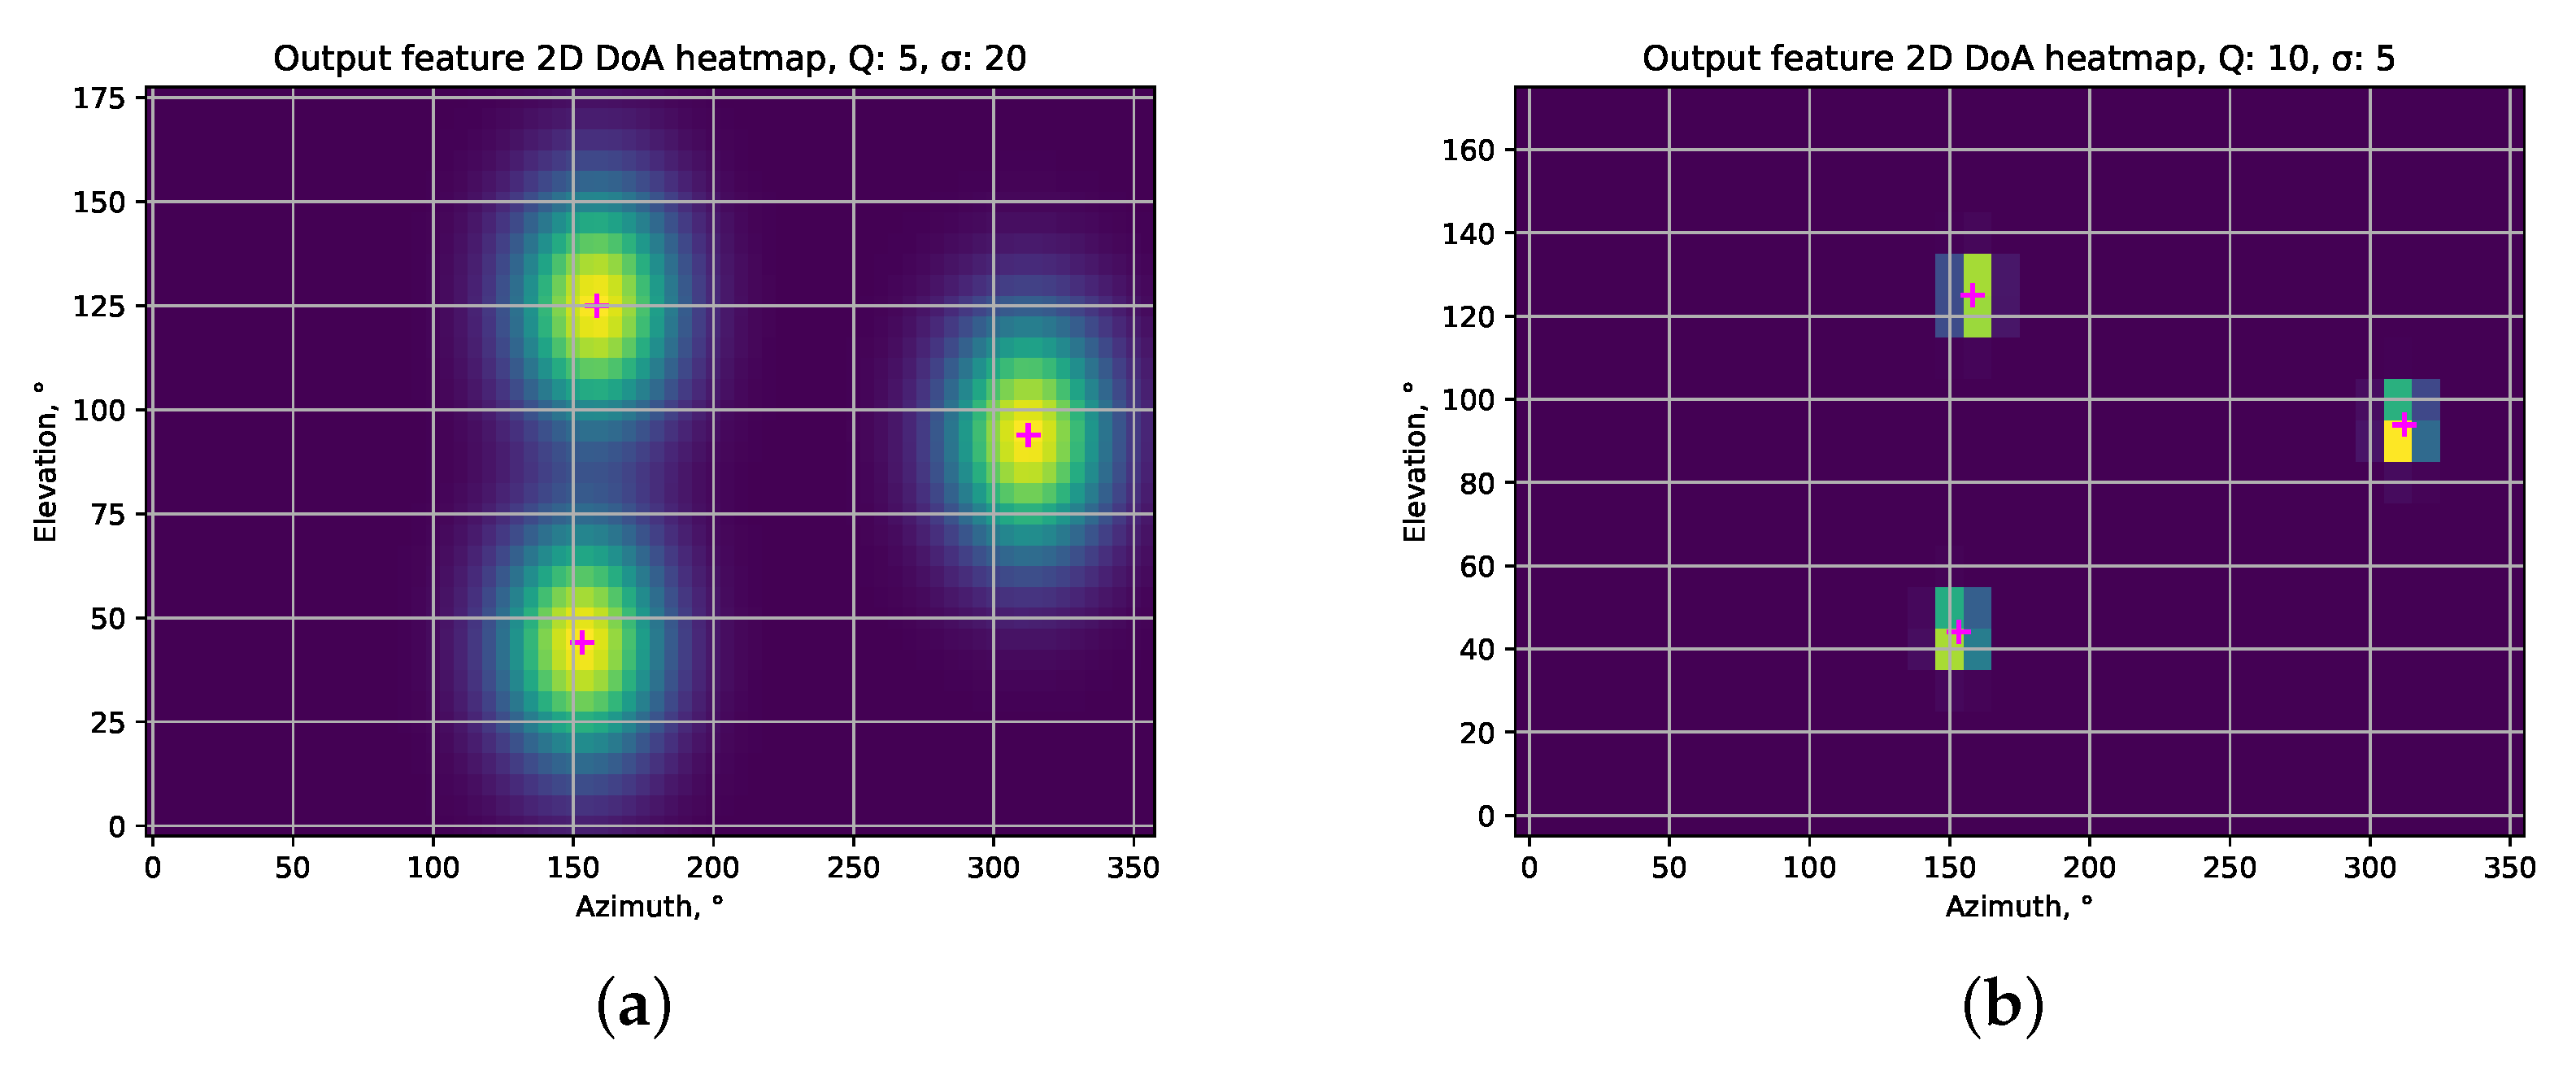
The values at each grid element are determined by first calculating the azimuth and elevation of the simulated acoustic source with respect to the center of the microphone array. An empty DoA heatmap grid is created, upon which a Gaussian kernel centered at exact azimuth and elevation is superimposed for each source DoA. The position of each of the Gaussian peaks corresponds to the 2D DoA of the source.
During the training, the CNN learns to extract features from the STFT phase component and to map those extracted features to the DoA heatmap.
Examples of the prepared desired outputs at respectively Q = 10 and σ = 5 and Q = 10 and σ = 5 are presented in Figure 2.

2.5. Post-Processing of the Outputs

To obtain the DoAs of the acoustic sources from the DoA heatmap, a peak detection is performed on the heatmap and the indices of the NS most prominent peak elements of the heatmap are converted to azimuth and elevation angles for each of the NS peaks. These angles correspond to the 2D DoA of the acoustic source with respect to the center of the microphone array.
A simple algorithm is used to find a local maxima. This operation dilates the original DoA heat map. After a comparison of the dilated and original image, this function returns the coordinates or a mask of the peaks where the dilated heat map equals the original image.

2.6. CNN Architecture

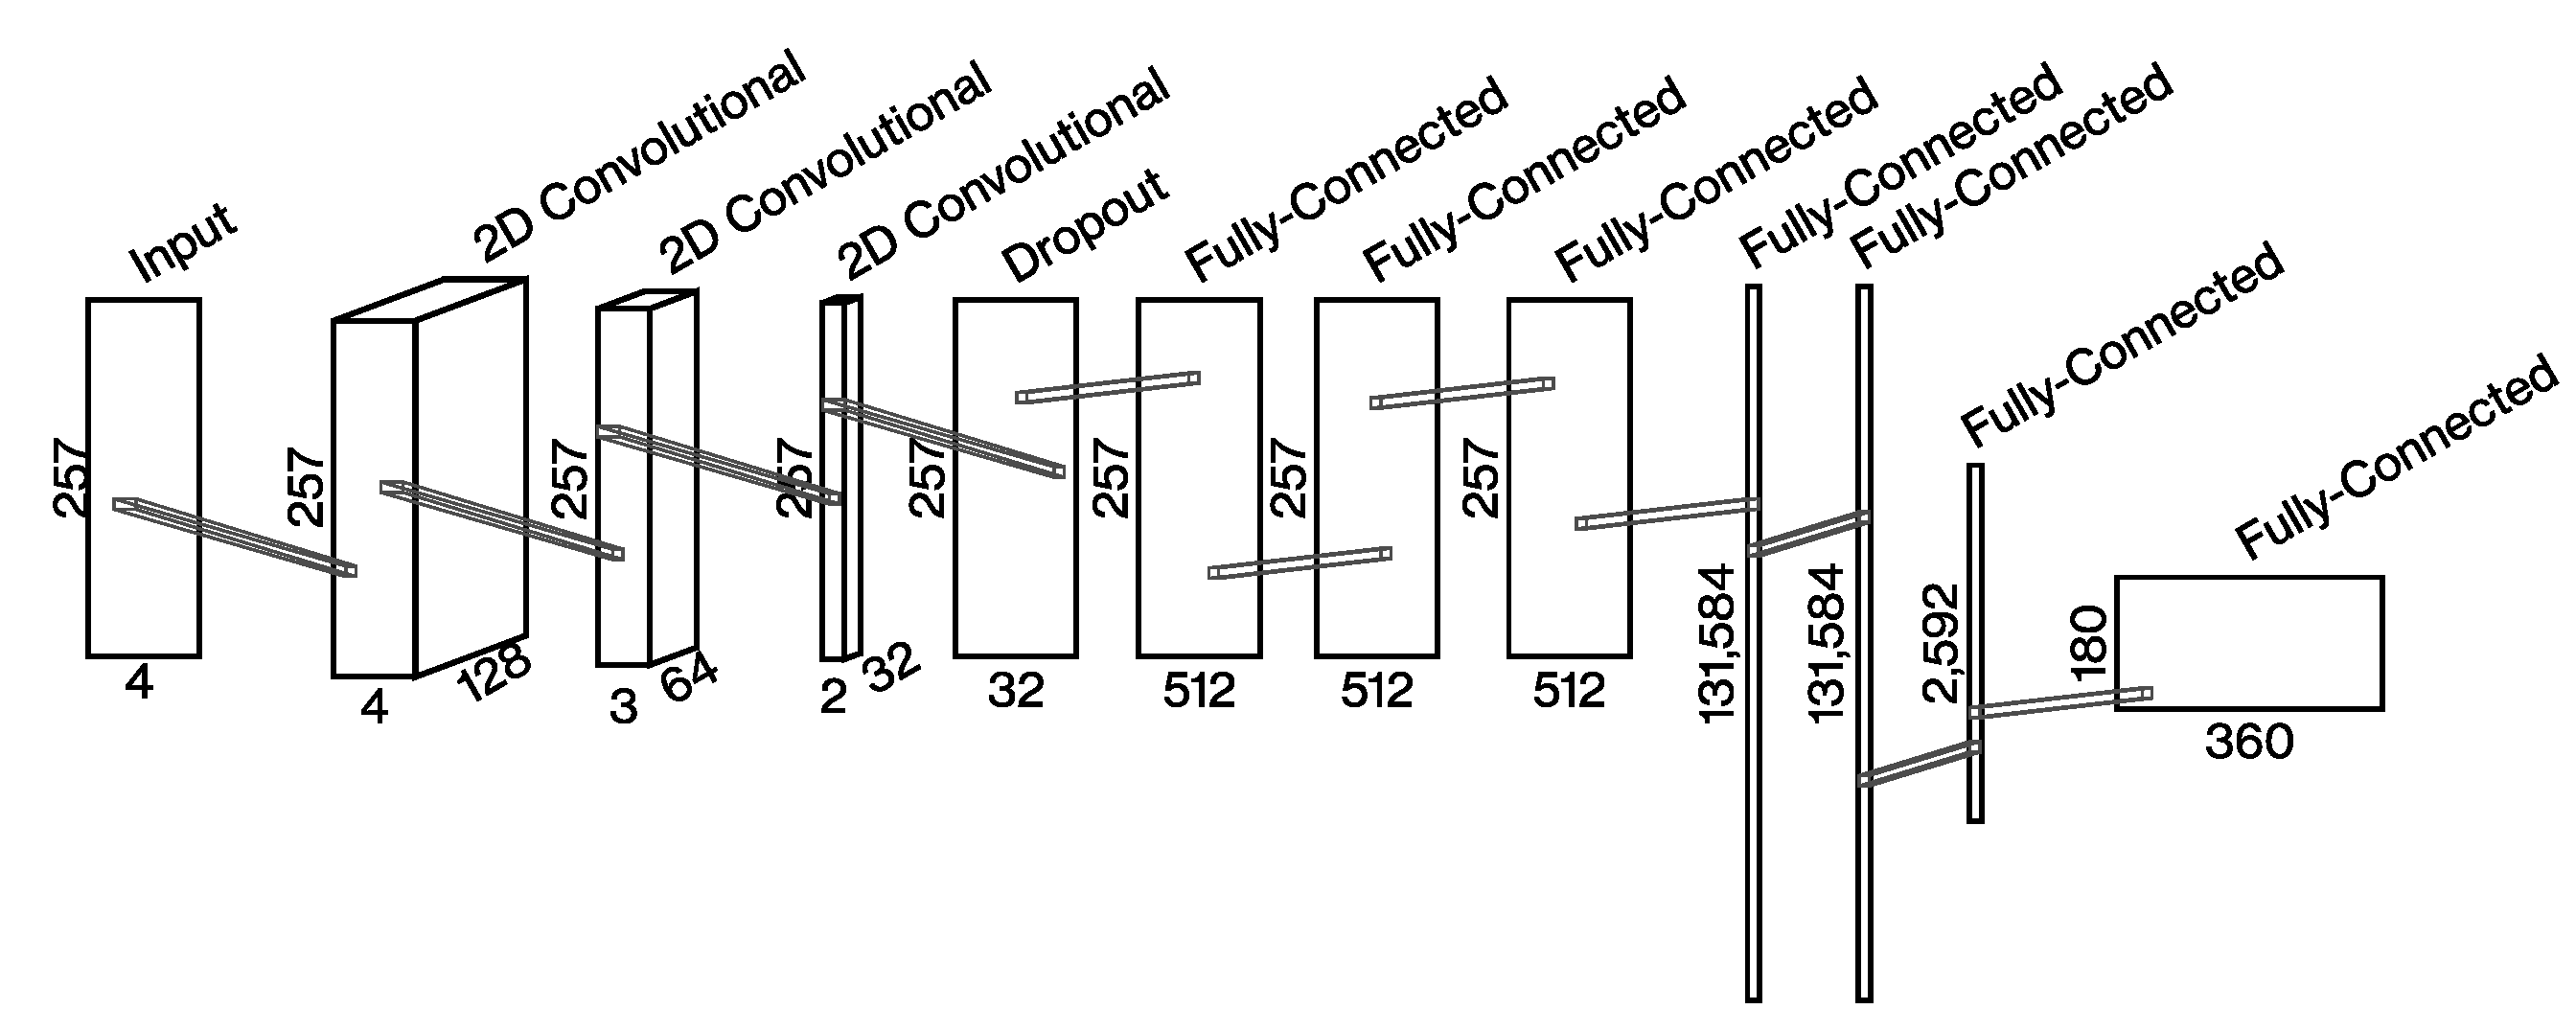
We used a similar architecture of the CNN as provided by Chakrabarty and Habets in their work [21], but we have altered the number of elements in each convolutional layer, as well as adjusted the number of output nodes to match the number of elements in the target DoA heatmap.
Chakrabarty and Habets provide an explanation that the architecture of the CNN used with NM-channel STFT phase features can have, at most, NM 1 convolution layers, where NM is the number of microphones (four in our case), since after NM 1 layers, performing 2D convolutions is no longer possible as the feature maps become vectors. They have also experimentally demonstrated that, indeed, NM 1 convolution layers are required to obtain the best DOA estimation performance for a given microphone array. In the convolution layers, small filters of size 2 × 1 were applied to learn the phase correlations between the neighboring microphones at each frequency sub-band separately. These learned features for each sub-band were then aggregated by the fully connected layers for the classification task.
We used a CNN with three convolutional layers, after which a dropout layer was used, as well as two deep fully-connected layers, followed by a dropout layer (see Figure 3). The output layer had the size of N DoA = Q θ × Q ϕ . The dropout rates were fixed to 0.125 and the Binary cross-entropy was used as the loss function.

2.7. Preparation of Training and Testing Dataset

To evaluate the performance of our method, we synthesized a set of datasets for training and testing. Training datasets were synthesized with white noise as the sources’ signals and the target DoA maps were synthesized with Q [ 5 , 10 , 20 ] and σ [ 5 , 10 , 15 , 20 ] . Training datasets contained 100,000 samples each. Training datasets were created with the STFT frequency random permutation, also without permutation, with one, two, or three active sound sources. Each sample in the datasets contained a matrix of input features and a desired output.
The testing dataset with speech signals from AMI Corpus [43] without STFT scrambling, assuming the W-disjoint orthogonality of speech signals.
We trained the proposed structure of CNN on each of the training datasets and evaluated its performance using a testing dataset with corresponding DoA heatmap grid resolution and Gaussian spread. A Keras implementation of CNN training was used during experimental investigation.
We synthesized the microphone array’s signals using an image source model implemented in the Pyroomacoustics package [44]. The acoustic signals were simulated in a cuboid shaped acoustic enclosure with dimensions matching a real room described in our previous experimental investigations [41]. The tetrahedral microphone array was set to have an arbitrarily selected side length of 0.4   m and its center was placed at an arbitrary location within an acoustic enclosure.
For all experiments, the geometry of the microphone array, its position and orientation remained constant. Simulated acoustic source coordinates were selected from a uniform random distribution within the volume of the simulated acoustic enclosure. CNN was trained on a training dataset with 100,000 samples during five epochs with a learning rate of 0.001.

2.8. Evaluation of the Proposed Method Performance

To compare the performance of our proposed method with alternatives, we used the Steered Response Power Phase Transform (SRP-PHAT) algorithm as a baseline. We used the pyroomacoustics implementation, which allowed us to estimate the response power of the beamformer and presented it as a 2D (azimuth and elevation) heatmap, which is compatible with the output of our proposed method. We estimated a DoA heatmap at the same resolution as with our proposed method.
We measured the Mean Average Error (MAE) of source 2D DoA prediction using our proposed method and the baseline method. The DoA estimation error is the Euclidean distance in the polar coordinate system between the estimated source DoA and the ground truth DoA.
The ground truth DoA was calculated geometrically from a known source and microphone array positions. The estimated DoA was obtained from the DoA heatmap using a simple 2D peak detection algorithm. The DoA estimation errors were obtained in two steps:
  • Euclidean distances between all pairs or ground truth and estimated DoAs were calculated;
  • NSsmallest errors were selected as the DoA prediction errors for NS sources.
This two-step approach allows the determination of the angular distance between the ground truth and the estimated closest candidate positions.
During the experimental investigation, for each STFT input frame the DoA heatmaps and DoA prediction errors were estimated to evaluate the performance of our proposed method and the baseline method. If the peak detection algorithm locates the number of peaks under inequality N Est < N S , only NEst errors are calculated.
The is calculated using the following equation:
MAE = 1 N T i N T j N Est e i j .

3. Results

We evaluated the performance of our proposed method at various DoA heatmap resolutions and Gaussian kernel spreads. Azimuth and elevation resolution were equal: Q θ = Q ϕ = Q , as well as azimuth and elevation Gaussian kernel spreads: σ θ = σ ϕ = σ . We performed experiments at resolution values Q [ 5 , 10 , 20 ] and Gaussian kernel spread values σ [ 5 , 10 , 15 , 20 ] . The results are presented in Figure 4. In this figure, errors of three sources DoA prediction for each testing sample are presented.
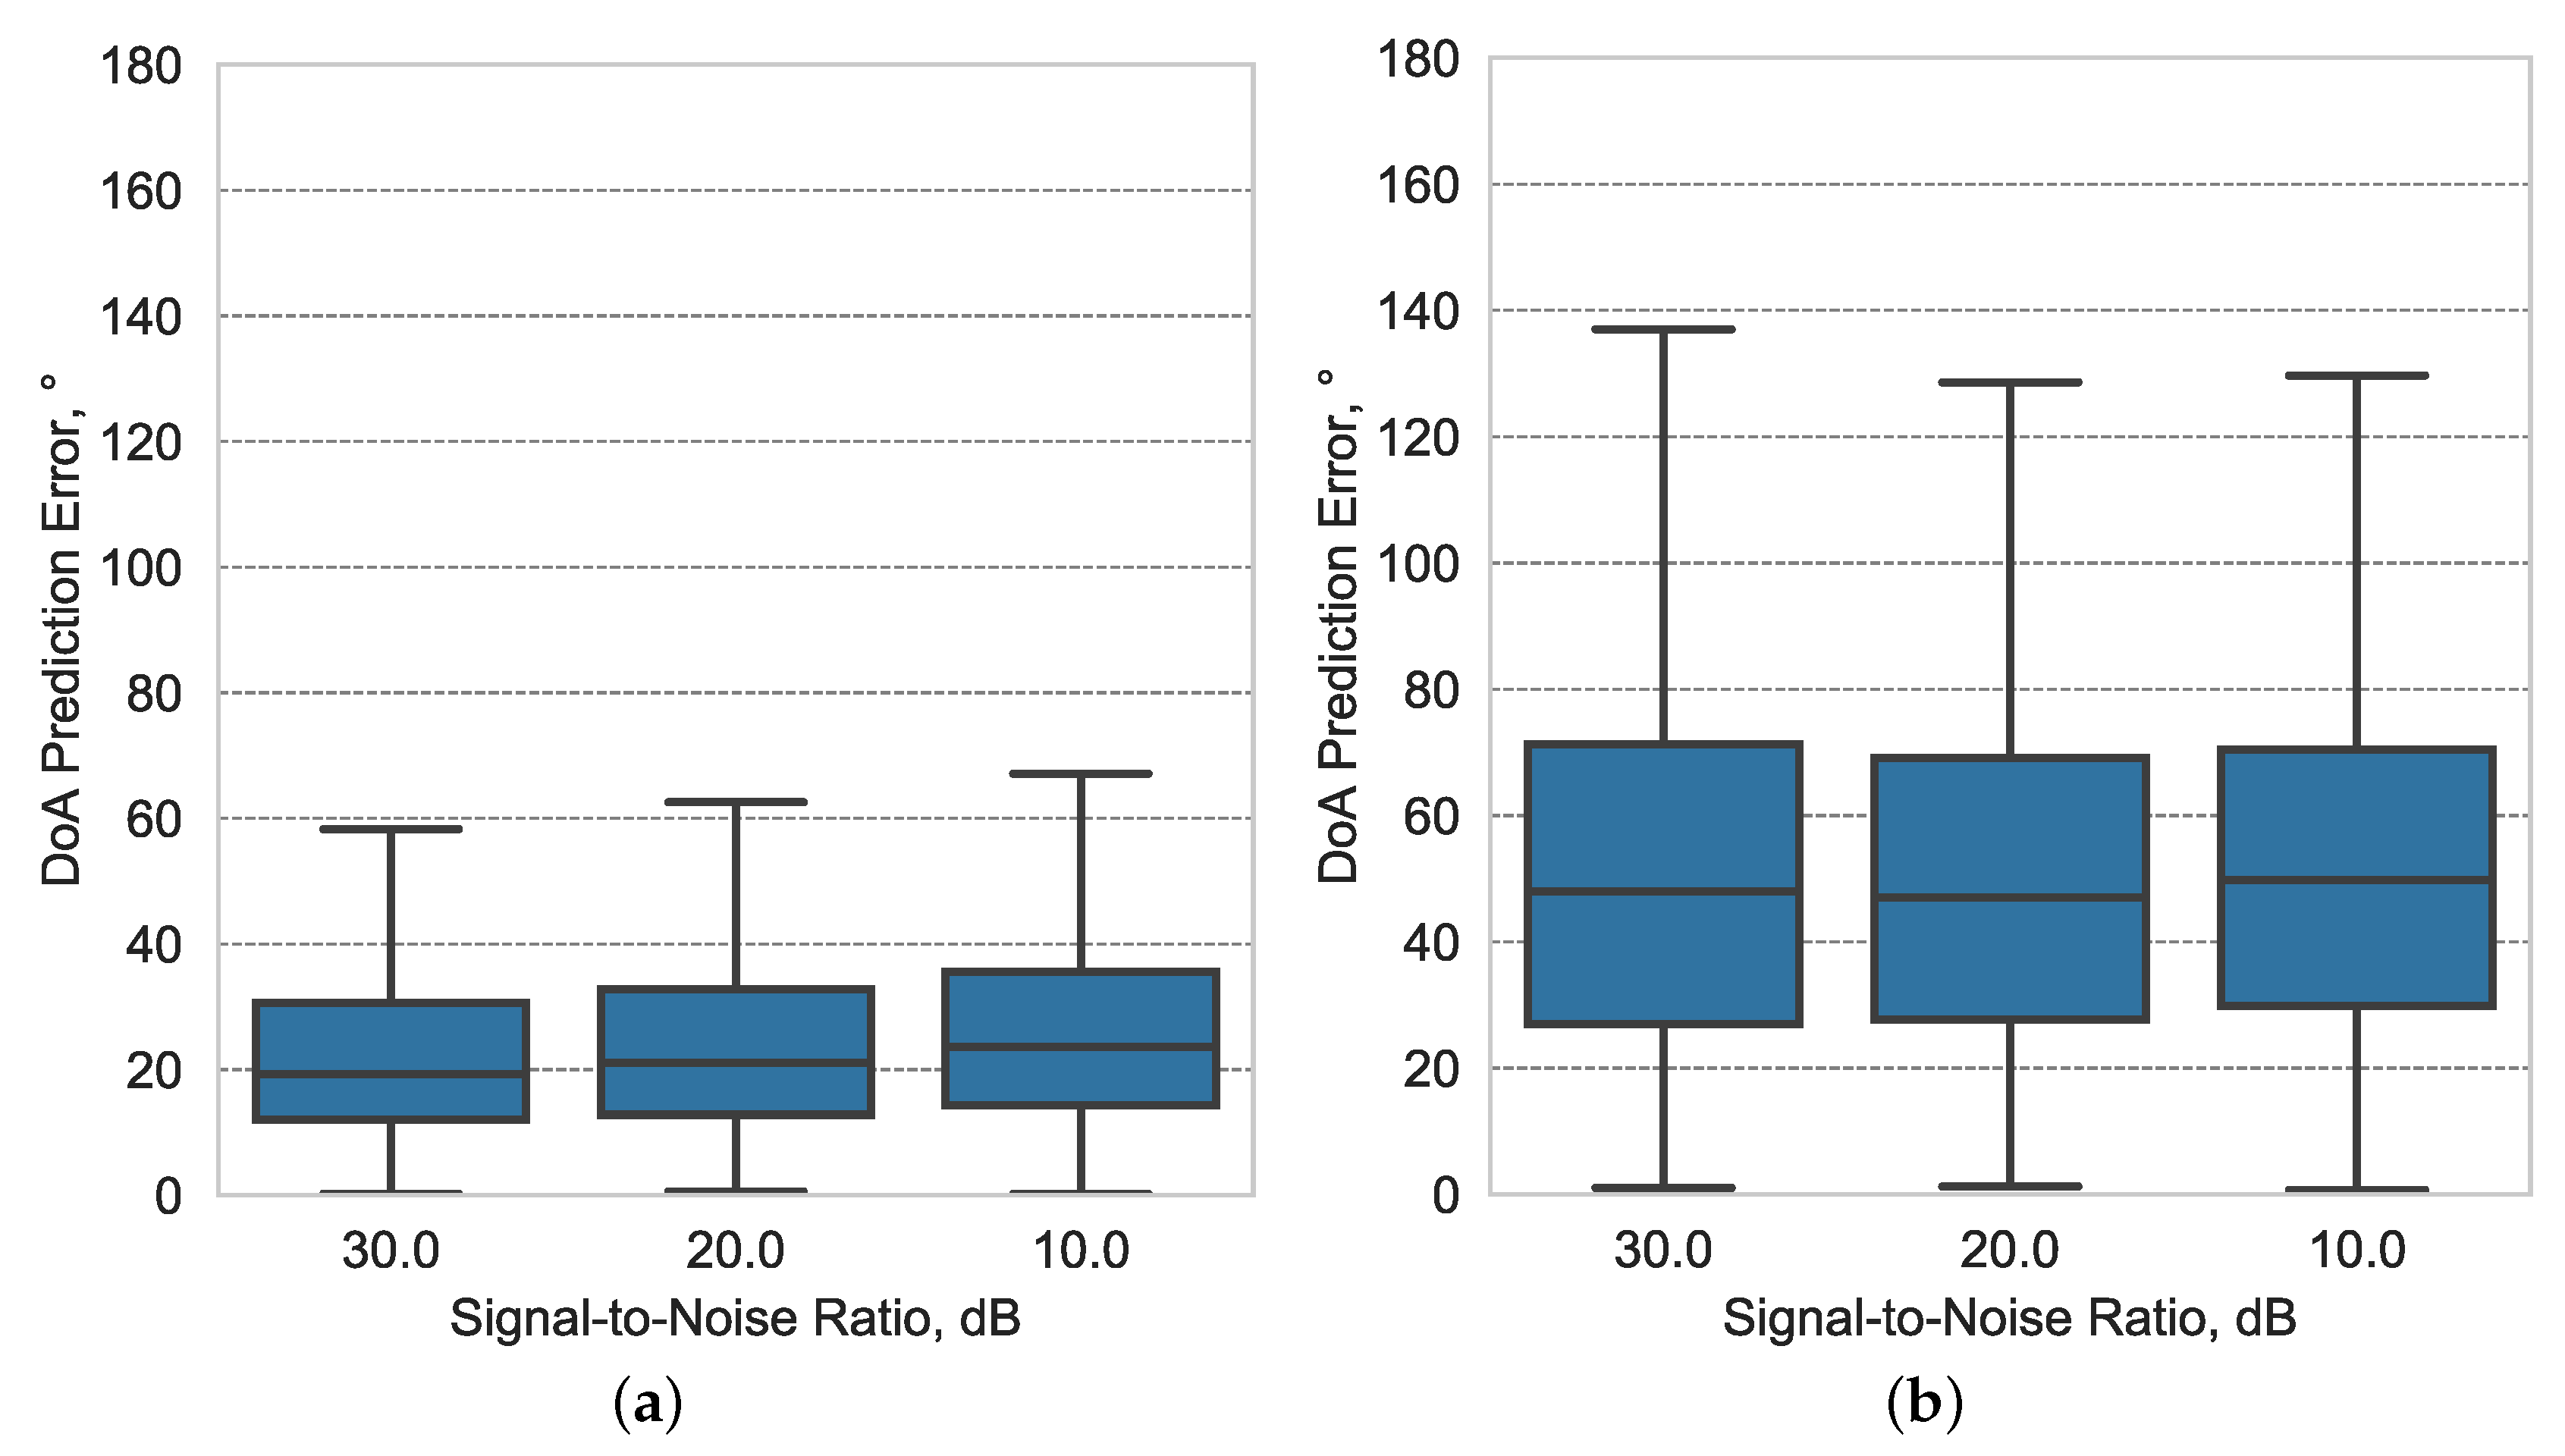
To evaluate the performance of the proposed method when subjected to background and acquisition system noise, experimentation with the best-performing Q and σ configuration was carried out with varying Signal-to-Noise Ratio (SNR) of the simulated microphone array signals. For the evaluation, the training dataset was augmented by adding an uncorrelated noise signal sampled from the uniform distribution to the original signal to obtain a signal with a specific SNR. The MAE of DoA estimation of three simultaneously active speech sources was obtained with testing signals with SNR = [ 30 , 20 , 10 ] dB, and the results are presented in Figure 5. It can be seen that the angular MAE of three sound source DoA estimation increases with increased noise level (decreased SNR) for both our proposed method and the baseline method. Nevertheless, our method has reached DoA estimation MAE as low as 23.13° with 30 dB SNR and 27.21° with 10 dB SNR. To compare, the SRP-PHAT method gives MAE 51.6° and 52.36° at respective SNR values. To summarize, our proposed method allows us to achieve at least 48% lower DoA estimation angular MAE than SRP-PHAT at all evaluated SNR values.
To determine the influence of the CNN architecture on the performance of the proposed method, three architecture variations were additionally evaluated, having only a single convolutional layer, two convolutional layers and also the originally proposed architecture with three convolutional layers, with 10° angular resolution output layer (36 × 18 elements), trained on a dataset with target feature σ = 10 . After the evaluation of these CNN architecture variations on a dataset with three active speech sources; it was discovered that a higher number of convolutional layers contributes positively to reducing the MAE of source DoA estimation, as shown in Figure 6. With only a single convolutional layer in the CNN, the source DoA estimation MAE was 19.8°, while increasing the number of convolutional layers to three allowed us to achieve source DoA estimation MAE of 18.14°, which is an 8.4% improvement.
Examples of DoA heatmaps are presented in Figure 7. These examples were obtained for an array audio frames with two speech sources active at DoAs situated respectively at ( 153.1 ° , 23.8 ° ) and at ( 46.3 ° , 22.6 ° ) . An example of a spatial power spectrum extracted using SRP-PHAT algorithm is presented in Figure 7a. Here the SRP objective function is evaluated on a grid with an angular resolution Q θ = Q ϕ = 5 ° ). An example ground truth DoA heatmap that is used to train the CNN is presented in Figure 7b. The angular resolution of the DoA heatmap is the same as SRP-PHAT spatial spectrum. The Gaussian spread selected to prepare the the desired outputs for this CNN training was σ θ = σ ϕ = 10 ° . An example of CNN DoA heatmap estimation using the proposed method is presented in Figure 7c).

4. Discussion

As can be seen from the Figure 4, our method outperforms the baseline SRP-PHAT algorithm in estimating the azimuth and elevation of multiple acoustic sources. While the lowest source DoA estimation MAE was 25° for the baseline method, at Q = 5 ° and σ = 20 , our method achieved MAE of 16° with the same and σ values. This can be interpreted as a performance increase by 36%.
Generally, our method outperformed the baseline in all experiments by at least 29%, with the largest performance increase by 70% at Q = 5 ° and σ = 10 . Thus, we can conclude that our proposed CNN-based multiple acoustic source 2D DoA estimation algorithm allows for a more precise source DoA estimation than the GCCPHAT-based method. Proposed method also outperformed the baseline in decreased SNR scenario, where at SNR = 30 dB, sound source DoA estimation MAE was 23.13°, which is a 55% improvement compared to the baseline method. The number of convolutional layers in the CNN architecture was found to improve the accuracy of the source DoA estimation; increasing the number of convolutional layers from one to three decreases the source DoA estimation error by 8.4%.
Further investigation of input and output feature processing and CNN hyperparameter optimization would be needed to potentially increase the performance of our proposed method. In addition, our method might be extended to 3D acoustic source position estimation, either in the Cartesian or polar coordinate systems, by constructing a 3D heatmap output feature instead of the 2D DoA heatmap feature. The authors are keen to investigate these possibilities.

Author Contributions

Conceptualization, S.S. and A.S.; methodology, S.S.; software, S.S.; validation, S.S.; formal analysis, S.S.; investigation, S.S.; resources, S.S. and A.S.; data curation, S.S.; writing—original draft preparation, S.S.; writing—review and editing, S.S. and A.S.; visualization, S.S.; supervision, A.S.; project administration, S.S. and A.S.; funding acquisition, A.S. All authors have read and agreed to the published version of the manuscript.

Funding

This research received no external funding.

Data Availability Statement

Datasets and Python code to run the experimentation are available at https://github.com/Sakavicius/2DDOA_CNN (accessed on 27 August 2021).

Conflicts of Interest

The authors declare no conflict of interest.

Abbreviations

The following abbreviations are used in this manuscript:
DoADirection of Arrival
ANNArtificial Neural Network
CNNConvolutional Neural Network
SRPSteered Response Power
PHATPhase Transform
MAEMean Average Error

References

  1. Argentieri, S.; Danès, P.; Souères, P. A survey on sound source localization in robotics: From binaural to array processing methods. Comput. Speech Lang. 2015, 34, 87–112. [Google Scholar] [CrossRef] [Green Version]
  2. Kotus, J. Multiple sound sources localization in free field using acoustic vector sensor. Multimed. Tools Appl. 2013, 74, 4235–4251. [Google Scholar] [CrossRef] [PubMed] [Green Version]
  3. Zimroz, P.; Trybała, P.; Wróblewski, A.; Góralczyk, M.; Szrek, J.; Wójcik, A.; Zimroz, R. Application of UAV in Search and Rescue Actions in Underground Mine—A Specific Sound Detection in Noisy Acoustic Signal. Energies 2021, 14, 3725. [Google Scholar] [CrossRef]
  4. Ravaglioli, V.; Cavina, N.; Cerofolini, A.; Corti, E.; Moro, D.; Ponti, F. Automotive Turbochargers Power Estimation Based on Speed Fluctuation Analysis. In Proceedings of the 70th Conference of the Italian Thermal Machines Engineering Association (ATI2015), Rome, Italy, 9–11 September 2015; pp. 103–110. [Google Scholar] [CrossRef] [Green Version]
  5. Gagliardi, G.; Tedesco, F.; Casavola, A. An Adaptive Frequency-Locked-Loop Approach for the Turbocharger Rotational Speed Estimation via Acoustic Measurements. IEEE Trans. Control Syst. Technol. 2021, 29, 1437–1449. [Google Scholar] [CrossRef]
  6. The American Society of Mechanical Engineers. Full Load Performance Optimization Based on Turbocharger Speed Evaluation via Acoustic Sensing, Volume 2: Instrumentation, Controls, and Hybrids; Numerical Simulation; Engine Design and Mechanical Development; Keynote Papers, Internal Combustion Engine Division Fall Technical Conference. 2014. Available online: https://asmedigitalcollection.asme.org/ICEF/proceedings-pdf/ICEF2014/46179/V002T05A006/4241913/v002t05a006-icef2014-5677.pdf (accessed on 16 October 2021).
  7. Brutti, A.; Omologo, M.; Svaizer, P. Localization of multiple speakers based on a two step acoustic map analysis. In Proceedings of the 2008 IEEE International Conference on Acoustics, Speech and Signal Processing, Las Vegas, NV, USA, 31 March–4 April 2008; pp. 4349–4352. [Google Scholar] [CrossRef] [Green Version]
  8. Lopatka, K.; Czyzewski, A. Acceleration of decision making in sound event recognition employing supercomputing cluster. Inf. Sci. 2014, 285, 223–236. [Google Scholar] [CrossRef]
  9. Brandstein, M.; Silverman, H. A robust method for speech signal time-delay estimation in reverberant rooms. In Proceedings of the 1997 IEEE International Conference on Acoustics, Speech, and Signal Processing, Munich, Germany, 21–24 April 1997; Volume 1, pp. 375–378. [Google Scholar] [CrossRef]
  10. DiBiase, J.H.; Silverman, H.F.; Brandstein, M.S. Robust localization in reverberant rooms. In Microphone Arrays; Springer: Berlin, Germany, 2001; pp. 157–180. [Google Scholar]
  11. Martí Guerola, A.; Cobos Serrano, M.; Aguilera Martí, E.; López Monfort, J.J. Speaker Localization and Detection in Videoconferencing Environments Using a Modified SRP-PHAT Algorithm; Instituto de Telecomunicaciones y Aplicaciones Multimedia (ITEAM): Valencia, Spain, 2011; Volume 3, pp. 40–47. [Google Scholar]
  12. Xiao, X.; Zhao, S.; Zhong, X.; Jones, D.L.; Chng, E.S.; Li, H. A learning-based approach to direction of arrival estimation in noisy and reverberant environments. In Proceedings of the 2015 IEEE International Conference on Acoustics, Speech and Signal Processing (ICASSP), South Brisbane, QLD, Australia, 19–24 April 2015; pp. 2814–2818. [Google Scholar] [CrossRef]
  13. Takeda, R.; Komatani, K. Discriminative multiple sound source localization based on deep neural networks using independent location model. In Proceedings of the 2016 IEEE Spoken Language Technology Workshop (SLT), South Brisbane, QLD, Australia, 19–24 April 2016; pp. 603–609. [Google Scholar] [CrossRef]
  14. Grumiaux, P.A.; Kitić, S.; Girin, L.; Guérin, A. A Survey of Sound Source Localization with Deep Learning Methods. arXiv 2021, arXiv:2109.03465. [Google Scholar]
  15. Sakavičius, S.; Plonis, D.; Serackis, A. Single sound source localization using multi-layer perceptron. In Proceedings of the 2017 Open Conference of Electrical, Electronic and Information Sciences (eStream), Vilnius, Lithuania, 27 April 2017; pp. 1–4. [Google Scholar] [CrossRef]
  16. Datum, M.S.; Palmieri, F.; Moiseff, A. An artificial neural network for sound localization using binaural cues. J. Acoust. Soc. Am. 1996, 100, 372–383. [Google Scholar] [CrossRef] [PubMed]
  17. Takeda, R.; Komatani, K. Sound source localization based on deep neural networks with directional activate function exploiting phase information. In Proceedings of the 2016 IEEE International Conference on Acoustics, Speech and Signal Processing (ICASSP), Shanghai, China, 20–25 March 2016; pp. 405–409. [Google Scholar] [CrossRef]
  18. Vera-Diaz, J.M.; Pizarro, D.; Macias-Guarasa, J. Towards End-to-End Acoustic Localization using Deep Learning: From Audio Signal to Source Position Coordinates. Sensors 2018, 18, 3418. [Google Scholar] [CrossRef] [PubMed] [Green Version]
  19. Krolikowski, R.; Czyzewski, A.; Kostek, B. Localization of Sound Sources by Means of Recurrent Neural Networks. In Rough Sets and Current Trends in Computing; Lecture Notes in Computer Science; Springer: Berlin/Heidelberg, Germany, 2000; pp. 603–610. [Google Scholar] [CrossRef]
  20. Hirvonen, T. Classification of spatial audio location and content using convolutional neural networks. In Proceedings of the 138th Audio Engineering Society (AES) International Convention, Warsaw, Poland, 7–10 May 2015. [Google Scholar]
  21. Chakrabarty, S.; Habets, E.A.P. Multi-Speaker DOA Estimation Using Deep Convolutional Networks Trained with Noise Signals. IEEE J. Sel. Top. Signal Process. 2019, 13, 8–21. [Google Scholar] [CrossRef] [Green Version]
  22. Ma, W.; Liu, X. Compression computational grid based on functional beamforming for acoustic source localization. Appl. Acoust. 2018, 134, 75–87. [Google Scholar] [CrossRef]
  23. Roden, R.; Moritz, N.; Gerlach, S.; Weinzierl, S.; Goetze, S. On sound source localization of speech signals using deep neural networks. In Proceedings of the Fortschritte der Akustik, DAGA 2015, Nurnberg, Germany, 16–19 March 2015; pp. 1510–1513. [Google Scholar]
  24. Hao, Y.; Küçük, A.; Ganguly, A.; Panahi, I. Spectral fluxbased convolutional neural network architecture for speech source localization and its real-time implementation. IEEE Access 2020, 8, 197047–197058. [Google Scholar] [CrossRef] [PubMed]
  25. Hübner, F.; Mack, W.; Habets, E.A. Efficient Training Data Generation for Phase-Based DOA Estimation. In Proceedings of the 2021 IEEE International Conference on Acoustics, Speech and Signal Processing (ICASSP), Toronto, ON, Canada, 6–11 June 2021; pp. 456–460. [Google Scholar]
  26. Vargas, E.; Hopgood, J.; Brown, K.; Subr, K. On improved training of CNN for acoustic source localisation. IEEE/ACM Trans. Audio Speech Lang. Process 2021, 29, 720–732. [Google Scholar] [CrossRef]
  27. Grumiaux, P.A.; Kitic, S.; Girin, L.; Guérin, A. Improved feature extraction for CRNN-based multiple sound source localization. arXiv 2021, arXiv:2105.01897. [Google Scholar]
  28. Bohlender, A.; Spriet, A.; Tirry, W.; Madhu, N. Exploiting temporal context in CNN based multisource DoA estimation. IEEE/ACM Trans. Audio Speech Lang. Process 2021, 29, 1594–1608. [Google Scholar] [CrossRef]
  29. Kim, Y. Convolutional Neural Networks for Sentence Classification. arXiv 2014, arXiv:cs.CL/1408.5882. Available online: http://xxx.lanl.gov/abs/1408.5882 (accessed on 15 August 2021).
  30. Youssef, K.; Argentieri, S.; Zarader, J.L. A learning-based approach to robust binaural sound localization. In Proceedings of the 2013 IEEE/RSJ International Conference on Intelligent Robots and Systems, Tokyo, Japan, 3–7 November 2013; pp. 2927–2932. [Google Scholar]
  31. Pertilä, P.; Cakir, E. Robust direction estimation with convolutional neural networks based steered response power. In Proceedings of the 2017 IEEE International Conference on Acoustics, Speech and Signal Processing (ICASSP), New Orleans, LA, USA, 5–9 March 2017; pp. 6125–6129. [Google Scholar]
  32. Cao, Y.; Iqbal, T.; Kong, Q.; Galindo, M.; Wang, W.; Plumbley, M. Two-Stage Sound Event Localization and Detection Using Intensity Vector and Generalized Cross-Correlation. Technical Report of Detection and Classification of Acoustic Scenes and Events 2019 (DCASE) Challange. 2019. Available online: http://personal.ee.surrey.ac.uk/Personal/W.Wang/papers/CaoIKGWP_DCASE_2019.pdf (accessed on 15 August 2021).
  33. Grondin, F.; Glass, J.; Sobieraj, I.; Plumbley, M. Sound event localization and detection using CRNN on pairs of microphones. In Proceedings of the 4th Workshop on Detection and Classification of Acoustic Scenes and Events (DCASE 2019), New York, NY, USA, 25–26 October 2019. [Google Scholar]
  34. Huang, Y.; Wu, X.; Qu, T. A time-domain unsupervised learning based sound source localization method. In Proceedings of the 2020 IEEE 3rd International Conference on Information Communication and Signal Processing (ICICSP), Shanghai, China, 12–15 September 2020; pp. 26–32. [Google Scholar]
  35. Park, S.; Suh, S.; Jeong, Y. Sound Event Localization and Detection with Various Loss Functions. Technical Report of Task 3 of DCASE Challenge. 2020, pp. 1–5. Available online: http://dcase.community/documents/challenge2020/technical_reports/DCASE2020_Park_89.pdf (accessed on 15 August 2021).
  36. Kapka, S.; Lewandowski, M. Sound Source Detection, Localization and Classification Using Consecutive Ensemble of CRNN Models. Technical Report of Detection and Classification of Acoustic Scenes and Events 2019 (DCASE) Challange. 2019. Available online: http://dcase.community/documents/challenge2019/technical_reports/DCASE2019_Kapka_26.pdf (accessed on 15 August 2021).
  37. Kim, Y.; Ling, H. Direction of arrival estimation of humans with a small sensor array using an artificial neural network. Prog. Electromagn. Res. 2011, 27, 127–149. [Google Scholar] [CrossRef] [Green Version]
  38. Yasuda, M.; Koizumi, Y.; Saito, S.; Uematsu, H.; Imoto, K. Sound event localization based on sound intensity vector refined by DNN-based denoising and source separation. In Proceedings of the 2020 IEEE International Conference on Acoustics, Speech and Signal Processing (ICASSP), Barcelona, Spain, 4–8 May 2020; pp. 651–655. [Google Scholar]
  39. He, W.; Motlicek, P.; Odobez, J. Deep Neural Networks for Multiple Speaker Detection and Localization. In Proceedings of the 2018 IEEE International Conference on Robotics and Automation (ICRA), Brisbane, QLD, Australia, 21–25 May 2018; pp. 74–79. [Google Scholar] [CrossRef] [Green Version]
  40. Laufer-Goldshtein, B.; Talmon, R.; Gannot, S. Semi-Supervised Sound Source Localization Based on Manifold Regularization. IEEE/ACM Trans. Audio Speech Lang. Process. 2016, 24, 1393–1407. [Google Scholar] [CrossRef] [Green Version]
  41. Sakavičius, S.; Serackis, A. Estimation of Sound Source Direction of Arrival Map Using Convolutional Neural Network and Cross-Correlation in Frequency Bands. In Proceedings of the 2019 Open Conference of Electrical, Electronic and Information Sciences (eStream), Vilnius, Lithuania, 25 April 2019; pp. 1–6. [Google Scholar] [CrossRef]
  42. Weng, J.; Guentchev, K.Y. Three-dimensional sound localization from a compact non-coplanar array of microphones using tree-based learning. J. Acoust. Soc. Am. 2001, 110, 310–323. [Google Scholar] [CrossRef] [PubMed]
  43. McCowan, I.; Carletta, J.; Kraaij, W.; Ashby, S.; Bourban, S.; Flynn, M.; Guillemot, M.; Hain, T.; Kadlec, J.; Karaiskos, V.; et al. The AMI meeting corpus. In Proceedings of the 5th international conference on methods and techniques in behavioral research, Wageningen, The Netherlands, 30 August–2 September 2005; Volume 88, p. 100. [Google Scholar]
  44. Scheibler, R.; Bezzam, E.; Dokmanić, I. Pyroomacoustics: A Python Package for Audio Room Simulation and Array Processing Algorithms. In Proceedings of the 2018 IEEE International Conference on Acoustics, Speech and Signal Processing (ICASSP), Calgary, AB, Canada, 15–20 April 2018; pp. 351–355. [Google Scholar] [CrossRef] [Green Version]
Figure 1. Examples of STFT input features: STFT magnitude and phase of a training sample ((a) noise signal; (b) speech signal).
Electronics 10 02585 g001
Figure 2. Examples of 2D DoA heatmap ((a) with parameters Q = 10 , σ = 5 ; (b) with parameters Q = 10 , σ = 5 ; ground truth DoAs are marked with magenta crosses).
Electronics 10 02585 g002
Figure 3. A schematic diagram of the CNN architecture, used for the experimental investigation.
Electronics 10 02585 g003
Figure 4. Angular errors of three sources DoA estimation using our method ((a) STFT not permuted; (b) STFT with permuted time and frequency dimensions; (c) GCCPHAT); data were unavailable for the CNN trained on STFT features with permuted time and frequency dimensions with σ [ 5 , 10 ] and CNN trained on regular STFT features with σ = 5 .
Electronics 10 02585 g004
Figure 5. Angular errors of source DoA estimation at different input signal SNR values: (a) method; (b) the baseline method; Q = 5 ° , σ = 20 .
Electronics 10 02585 g005
Figure 6. Angular errors of source DoA estimation at different number of CNN convolutional layers; Q = 10 ° , σ = 10 .
Electronics 10 02585 g006
Figure 7. Examples of DoA heatmap output: (a) SRP-PHAT spatial power spectrum; (b) ground truth (used as a target for training of the CNN; Q θ = Q ϕ = 5 ° ); (c) CNN estimated DoA heatmap ( Q θ = Q ϕ = 5 ° ); same STFT input feature was used for both and our CNN method.
Electronics 10 02585 g007
Publisher’s Note: MDPI stays neutral with regard to jurisdictional claims in published maps and institutional affiliations.