Article

AI Models for Predicting Readmission of Pneumonia Patients within 30 Days after Discharge

1
Department of Radiology, BenQ Medical Center, The Affiliated BenQ Hospital of Nanjing Medical University, Nanjing 210017, China
2
Department of Internal Medicine, Taipei Hospital, Ministry of Health and Welfare, New Taipei 24213, Taiwan
3
Department of Health Services Administration, China Medical University, Taichung 406040, Taiwan
4
Department of Management Information Systems, Central Taiwan University of Science and Technology, Taichung 406053, Taiwan
5
Department of Electrical and Computer Engineering, Brigham Young University, Provo, UT 84602, USA
6
Department of Dental Technology and Materials Science, Central Taiwan University of Science and Technology, Taichung 406053, Taiwan
*
Authors to whom correspondence should be addressed.
These authors contributed equally to this study.
Electronics 2022, 11(5), 673; https://doi.org/10.3390/electronics11050673
Submission received: 30 December 2021 / Revised: 15 February 2022 / Accepted: 20 February 2022 / Published: 22 February 2022

Abstract

:
A model with capability for precisely predicting readmission is a target being pursued worldwide. The objective of this study is to design predictive models using artificial intelligence methods and data retrieved from the National Health Insurance Research Database of Taiwan for identifying high-risk pneumonia patients with 30-day all-cause readmissions. An integrated genetic algorithm (GA) and support vector machine (SVM), namely IGS, were used to design predictive models optimized with three objective functions. In IGS, GA was used for selecting salient features and optimal SVM parameters, while SVM was used for constructing the models. For comparison, logistic regression (LR) and deep neural network (DNN) were also applied for model construction. The IGS model with AUC used as the objective function achieved an accuracy, sensitivity, specificity, and area under ROC curve (AUC) of 70.11%, 73.46%, 69.26%, and 0.7758, respectively, outperforming the models designed with LR (65.77%, 78.44%, 62.54%, and 0.7689, respectively) and DNN (61.50%, 79.34%, 56.95%, and 0.7547, respectively), as well as previously reported models constructed using thedata of electronic health records with an AUC of 0.71–0.74. It can be used for automatically detecting pneumonia patients with a risk of all-cause readmissions within 30 days after discharge so as to administer suitable interventions to reduce readmission and healthcare costs.

1. Introduction

Readmission refers to patients who have been admitted to inpatient wards again after being discharged from hospitals within a short period of time. It may be attributed to unsuccessful treatments, new diseases, worsening comorbidities, or degraded quality of care [1], and can be caused by clinical and non-clinical factors [2,3], resulting in increased healthcare cost. The non-clinical factors include poor social support, housing instability, and drug abuse [2], whereas the clinical factors are related to patents having a high Charlson comboridity index, using 10 or more medications, and living in a community with home care [3]. The readmission rate is generally considered as an indicator for evaluating the healthcare quality of a hospital [4], although it has been challenged that substantial errors were found when using it as a marker of healthcare quality [5]. In addition to improving hospital quality, the hospital readmission reduction program (HRRP) has also been shown to be useful for reducing healthcare cost and elevating patient satisfaction [6].

1.1. Policies for Reducing Readmissions

Appropriate policies, including financial incentives [7,8,9], care transition processes [10], and health information exchange (HIE) [11], as well as improved nursing environments [12] and integrated skilled nursing facilities (SNF) [8], are effective at decreasing patient readmissions. For example, due to the recent passage of US legislation of imposing financial penalties on hospitals with excessive patient readmissions, a system was designed to identify chronic obstructive pulmonary disease (COPD) patients who had a higher probability and higher healthcare cost of readmission for post-discharge interventions so as to save aftercare cost [9]. Compared to patients provided with costly aftercare, it saved 90% healthcare cost by identifying COPD patients with a high potential readmission and potentially the highest care cost from discharge summaries in order to perform readmission mitigation interventions [9]. Financial incentives provided by Medicare’s HRRP in the U.S. were also reported to have reduced the readmission rate by 0.3–1.2% for each of the five HRRP-targeted conditions, i.e., acute myocardial infarction, heart failure, COPD, pneumonia, and hip and/or knee surgery [7].
Care transition processes were also shown to be useful to reduce the risk standardized readmission rate (RSRR); among the 20 care transition processes evaluated in a study performed at ten veterans affairs hospitals in the U.S., more care transition processes performed before and after patient discharge could achieve a lower RSRR [10]. Additionally, health information exchange (HIE) is also a good strategy for reducing the readmission rate; hospitals are suggested to adopt HIE to exchange health information with primary care providers for the collaboration of patient care in order to reduce readmission rate [11].
In [12], the relationship between patient readmission and hospital nursing factors, including work environment, staffing level, and education, were studied and it was found that nurse work environment and staffing level were related to 30-day readmission among 23.2% heart failure, 19.1% acute myocardial infarction, and 17.8% pneumonia patients. Excessive nurse’s workload with one more patient per nurse was found to be related to a 7%, 9%, and 6% higher chance of readmission for heart failure, acute myocardial infarction, and pneumonia patients, respectively; furthermore, a good hospital healthcare environment was also related to a 7%, 6%, and 10% lower chance of readmission for heart failure, acute myocardial infarction, and pneumonia patients, respectively, when compared to a poor environment [12]. By analyzing the data of hospital and year fixed effects for both pneumonia and heart failure, except for investor-owned hospital, the vertical SNF integration was shown to be significantly associated with a reduction of 30-day pneumonia readmission in other types of hospitals. However, vertical SNF integration was not significantly associated in all types of hospitals for the reduction of 30-day heart failure readmission [8].

1.2. Factors Associated with Readmissions and Interventions for High-Risk Patients

Demographic (gender, age, income, resident region, and education), treatment and clinical (principal diagnosis, treatment department, surgery, clinical test results, number of accompanied treatments, number of comorbidities, depression, and mental health status), and healthcare utilization (length of hospital stay, number of out-patient visits, frequency of hospital admission, type of insurance, type of patient room, frequency of emergency visit, and route of admission) factors were reported to be the greatest risks for readmission [13,14,15]. As observed in [14], factors including unemployment, less than a high school education, and diagnosed diseases (chronic obstructive pulmonary disease and coronary artery disease) were found to be independent factors associated with readmissions. In [15], other diseases, including infection, neoplasm, heart failure, gastrointestinal disorder, and liver disorder, were also reported to be the most frequent primary diagnoses of potentially avoidable readmissions. Patient’s social risk factors and the community’s social determinant of health were also reported to effect the readmission rate in [16]. It was suggested that the readmission performance of the CMS HRRP readmission model may be improved by including factors of patient social risk and community social determinant of health, thereby removing unjustified penalties on hospitals located at geographic areas accommodating a large proportion of high-risk patients [16]. Hence, after being discharged, the comorbidities of high-risk patients should be carefully cared for by providing appropriate interventions in high-risk patients for effectively reducing readmission rate. It was noted that even simple interventions, such as telephonic case management, were useful for reducing all-cause readmissions in high-risk patients prioritized based on episodic risk group (ERG) score after discharge [17].
Charles et al. [18] adopted the LACE index to screen high-risk older patients in an acute care hospital for care coordination intervention by providing medications, equipment, and homecare services to the high-risk group, achieving lower rates of 30-day ED revisits (30.5%), as well as 90-day (39.3%) and 6-month (50.9%) readmissions, when compared to the non-intervention group (33.3%, 44.6%, and 58.4%, respectively). Although detecting patients with a high-risk readmission accompanied with a high care cost for aftercare intervention is useful to save hospital healthcare cost, patient safety is generally deemed as the main concern of HRRP. A clinical decision support system (CDSS) provides useful information and expert knowledge to improve the diagnostic performance, treatment outcome, or healthcare quality in the clinical setting [19], and has been widely applied in the detection of medical events [20,21,22,23,24,25,26,27,28,29,30,31,32]. In this study, we aimed to design a CDSS model for predicting readmissions of high-risk patients admitted with pneumonia, so that post-discharge intervention can be administrated to prevent all-cause readmissions and elevate patient safety.

1.3. AI Models for Predicting Associated Events of Hospital Admission and Readmission

Recent studies that have focused on constructing AI models for predicting associated events of hospital admission are summarized in Table 1. In [33], a model integrating multi-layer perceptron (MLP) and convolutional neural network (CNN), input with 24 numeric and categorical features, as well as four text notes at a triage of emergency departments (ED), respectively, was proposed for predicting hospital admission, with a performance reaching an AUC of 0.83. In [34], by analyzing the effectiveness of various machine learning (ML) models for predicting mortality, critical care outcome, and the need for hospitalization of ED patients reported in 11 studies, and showed that deep neural network (DNN) [35,36,37] and extreme gradient boosting (XGBoost) [37,38,39] achieved the greatest predictive accuracy among the assessed ML models, with an AUC of 0.782–0.92 and 0.922–0.962, respectively.
In [40], independent meteorological, pollen, and chemical pollution data were adopted to design predictive models using long short-term memories and CNN (LSTM + CNN) to forecast daily hospital admissions for patients due to respiratory- and circulatory-related disorders, which showed that the models could precisely forecast hospital admissions with a root mean squared error (RMSE) of 11.21 and 11.76 for circulatory and respiratory cases, respectively. Moreover, in [41], a neural network, namely COVID-Net Clinical ICU, was proposed to predict admission to intensive care units (ICU) for COVID patients with an accuracy of 96.9%.
In [42], a deep in-hospital resource utilization prediction (RUP) approach with multi-task learning from electronic medical records (EMRs) was proposed to estimate the in-hospital cost and length of stay (LOS) of admitted patients. Inputs for the multi-task learning included patient features, diagnosis/operation texts, and the diagnosis/operation IDs. The performance of the RUP model reached an RMSE of 7765 CNY and 7.056 days for in-hospital cost and LOS, respectively. Additionally, in [43], stacking regression was shown to outperform DNN, gradient boosting regression (GBR), and random forest in predicting LOS for cardiovascular hospitalization in the ICU, with a mean average error (MAE) of 1.92 days.
Recent studies on predicting associated events of hospital readmissions are summarized in Table 2. In [44], a trajectory-based deep learning (TADEL) method was proposed to capture series of admissions in the medical history for representing the patient’s readmission trajectory for being input to train the deep-learning model, reaching a predictive performance with a recall, precision, F1 score, and AUC of 99.3%, 77.9%, 87.3%, and 0.884, respectively, for predicting all-cause readmission.
In [45], an integrated gradient boosting machine with a genetic algorithm (GBM + GA) was applied to design a model for predicting 90-day hospital readmission with an accuracy as high as 97.05%. In [46], an enhanced version of the multi-objective bare-bones particle swarm optimization (EMOBPSO) method, which integrated machine learning models with feature selection algorithms, was proposed for constructing the model, and it reached a predictive performance of AUC = 0.9038 and precision = 43.43%. In [47], a joint imbalanced classification and feature selection (JICFS) algorithm, which included 1-norm regularization for class-imbalance aware feature selection, was proposed for constructing models for predicting readmissions using six open datasets, and it reached a predictive performance of AUC = 0.733–0.9299.
The graph-based method, which creates a similar AI model concept used for graph or image recognition, was also proposed for designing models for readmission prediction. For example, in [48], the graph-based class-imbalance learning (graph-CL) method was adopted for constructing within-class graphs (for positive and negative samples) as well as a between-class graph for learning the pattern discrimination from within-class and between-class samples, and it reached a predictive performance of AUC = 0.776–0.886 for predicting readmission.

1.4. State-of-the-Art Models for the Prediction of Pneumonia Readmissions

In [51], the predictive performances of 11 models in seven studies for predicting pneumonia readmission were reviewed. It was observed that the average rate of pneumonia readmission reported in these studies was 17.3%, showing a high readmission rate for patients admitted with pneumonia after being discharged. The predictive performances of the aforementioned models exhibited an AUC ranging from 0.59 to 0.77, with an average of 0.63 [51]. Table 3 compares the state-of-the-art studies on the prediction of readmissions for pneumonia patients.
In [52], the model constructed for predicting pneumonia-unrelated readmissions of pneumonia admitted patients using logistic regression analysis by including data retrieved from the EHR of a single hospital achieved a predictive performance of AUC = 0.77, while the AUC of the model constructed for predicting pneumonia-related readmission was only 0.65.
In [53], a logistic model for predicting 30-day all-cause readmission was designed using a dataset extracted from the EHR of a tertiary-care hospital, reaching a predictive performance of AUC = 0.71. The features included laboratory values, vital signs, age, sex, comorbidities, nursing home resident, marital status, income, prior admission, length of stay, etc. (Table 3). It suggested that income and number of previous admissions included for model construction significantly improved the predictive performance.
In [54], a full-stay model for predicting 30-day all-cause readmission was designed using the EHR data of 1463 pneumonia patients (13.6% were readmitted) collected from six hospitals, including safety net, community, teaching, and nonteaching hospitals, achieving a predictive performance of AUC = 0.731. The features selected for model construction included disposition status, vital sign instabilities on discharge, and an updated pneumonia severity index calculated using values from the day of discharge, etc. (Table 3). The full-stay pneumonia model (AUC = 0.731) outperformed the first-day pneumonia model (AUC = 0.695), Centers for Medicare and Medicaid Services pneumonia model (AUC = 0.64), and two pneumonia severity scores (updated PSI: AUC = 0.673 and CURB-65 score: AUC = 0.604).
In [55], a logistic model was created using an EHR dataset of 1295 pneumonia patients, in which 330 patients were readmitted within 30 days after discharge, with a readmission rate as high as 25.5%. A total of 13 features were adopted for the model design, in which linear or nonlinear relationship fitting between the continuous features and readmission outcome were obtained, and it achieved a predictive performance of AUC = 0.74.

1.5. Problem Statements and Research Objectives

As the readmission rate is deemed as an indicator of hospital healthcare quality [4], HRRP has been adopted to improve healthcare quality, reduce healthcare costs, and elevate patient satisfaction [6]. A predictive model designed to identify patients with a higher readmission probability is useful for post-discharge interventions to save aftercare cost; for example, identifying COPD patients with a high potential readmission for performing readmission mitigation interventions saved 90% of the healthcare cost when compared to patients provided with costly aftercare [9]. Hence, designing models to precisely predict high-risk readmissions patients admitted with pneumonia for post-discharge intervention is crucial for the prevention of patient readmissions and for decreasing the healthcare cost. However, most models for predicting the readmission of discharged pneumonia patients performed poorly, with AUCs ranging from 0.71 to 0.74 [53,55], and they were mostly designed based on data collected from a single medical center or were validated among older patients by excluding patients younger than 65 years old [53,55]. Although, in certain healthcare settings, these models might be useful in readmission prediction, we still need to enhance the predictive performance for admitted pneumonia patients caused by non-typical influenza, such as SARS, MERS, or COVID-19, which become more and more widespread.
In our previous report [56], we designed models for predicting readmissions for patients admitted with pneumonia by applying the IGS (integrated genetic algorithm with support vector machine) algorithm based on the data retrieved from the National Health Insurance Research Database (NHIRD) with 20 features adopted, and we achieved a predictive performance with an accuracy, sensitivity, specificity, and AUC of 69.33–71.44%, 66.27–69.41%, 69.32–72.24%, and 0.7518–0.7601, respectively. In the current study, our objective was to design predictive models using NHIRD with more features (49 features) to further improve the predictive performance in the identification of high-risk readmission patients admitted with pneumonia. Moreover, in contrast to data collected from a single hospital for model design, as reported in previous studies [53,55], NHIRD covers multiple hospital data submitted by more than 97% of hospitals scattered around different areas in Taiwan for claiming healthcare reimbursement from the Bureau of National Health Insurance. Additionally, deep neuro network (DNN) and logistic regression (LR) were also applied to design the predictive models, so as to be compared with the models created using the IGS algorithm.

2. Materials and Methods

2.1. Data Source

The data were retrieved from a subset including the claim data of 1 million patients randomly sampled from the NHIRD, containing information of medical facility registries, inpatient orders, ambulatory care, prescription drugs, and physicians providing services to the entire 23 million Taiwanese population enrolled in the NHI program. The diagnoses in the NHIRD dataset were coded according to the International Classification of Diseases, ninth edition, Clinical Modification (ICD-9-CM), and the dataset has been widely used for studying issues of public health and the causal relationship of a disease associated with other comorbidities [57].

2.2. Samples

Data of patients older than 20 years old admitted within 2010–2011 due to pneumonia (ICD Code 480.xx, 481, 482.xx, 483.0, 483.x, 485, 486, and 487.0) were retrieved from the NHIRD for constructing the predictive models. Patient claim data collected in 2010 were used for the training the models, while those collected in 2011 were used for the testing. The training and testing datasets included 3911 (761 readmissions and 3150 non-readmissions) and 3862 patient data (784 readmissions and 3078 non-readmissions), respectively, showing that the datasets were highly imbalanced, with the ratio of the majority to minority samples reaching 4.14 and 3.93, respectively. The readmitted patients were those who had been admitted again with all-cause conditions within 30 days after being discharged from the hospital. Table 4 compares the included variables between readmitted and non-readmitted patients of the combined training and testing datasets (1545 readmissions and 6228 non-readmissions).
When classifying the imbalanced dataset, it has to be noted that samples in the majority class outnumbered those in the minority class, which is often of more interest or importance, making the algorithms optimized with accuracy adopted as the objective function biased toward the majority class [58]. In general, the accuracies of these models are satisfactory, yet their sensitivities are quite low. Hence, alternative fitness functions, such as AUC [59] or weighted sum of accuracy, sensitivity, and specificity [60], have been proposed to solve this problems.

2.3. Variables

To design the predictive models, a total of 49 candidate variables were considered, including gender; age; comorbidity number and comorbidity index, i.e., Charlson comorbidity index (CCI) [61]; medical events (ED visits, hospitalizations, and outpatient visits) within 1 year before admissions; inpatient interventions, number of surgical operations, number of administrated medications, ventilator use/therapy (ventilator therapy, oxygen inhalation, humidity inhalation, or vapor/aerosol therapy), and other accompanied therapies (urinal indwelling, C.V.P. catheter, N-G feeding, respiratory suction, or tracheostomy care); category of admitted hospitals (medical center, regional hospital, or district hospital); length of admission; total healthcare cost; discharge status; diagnosed comorbidities included within CCI in outpatient visits; and hospitalizations within 1 year before pneumonia admission.

2.4. Statistica Analysis

The statistic tool (SPSS 22.0, IBM) was adopted for the descriptive and inferential analyses. Distribution differences in the demographic characteristics, events within 1 year before admission, inpatient interventions, category of admitted hospitals, and discharge status of readmitted and non-readmitted patients were compared using the Chi-square test. Difference in continuous variables were compared with the unpaired Student’s t-test. The statistical significance was defined as p < 0.05.

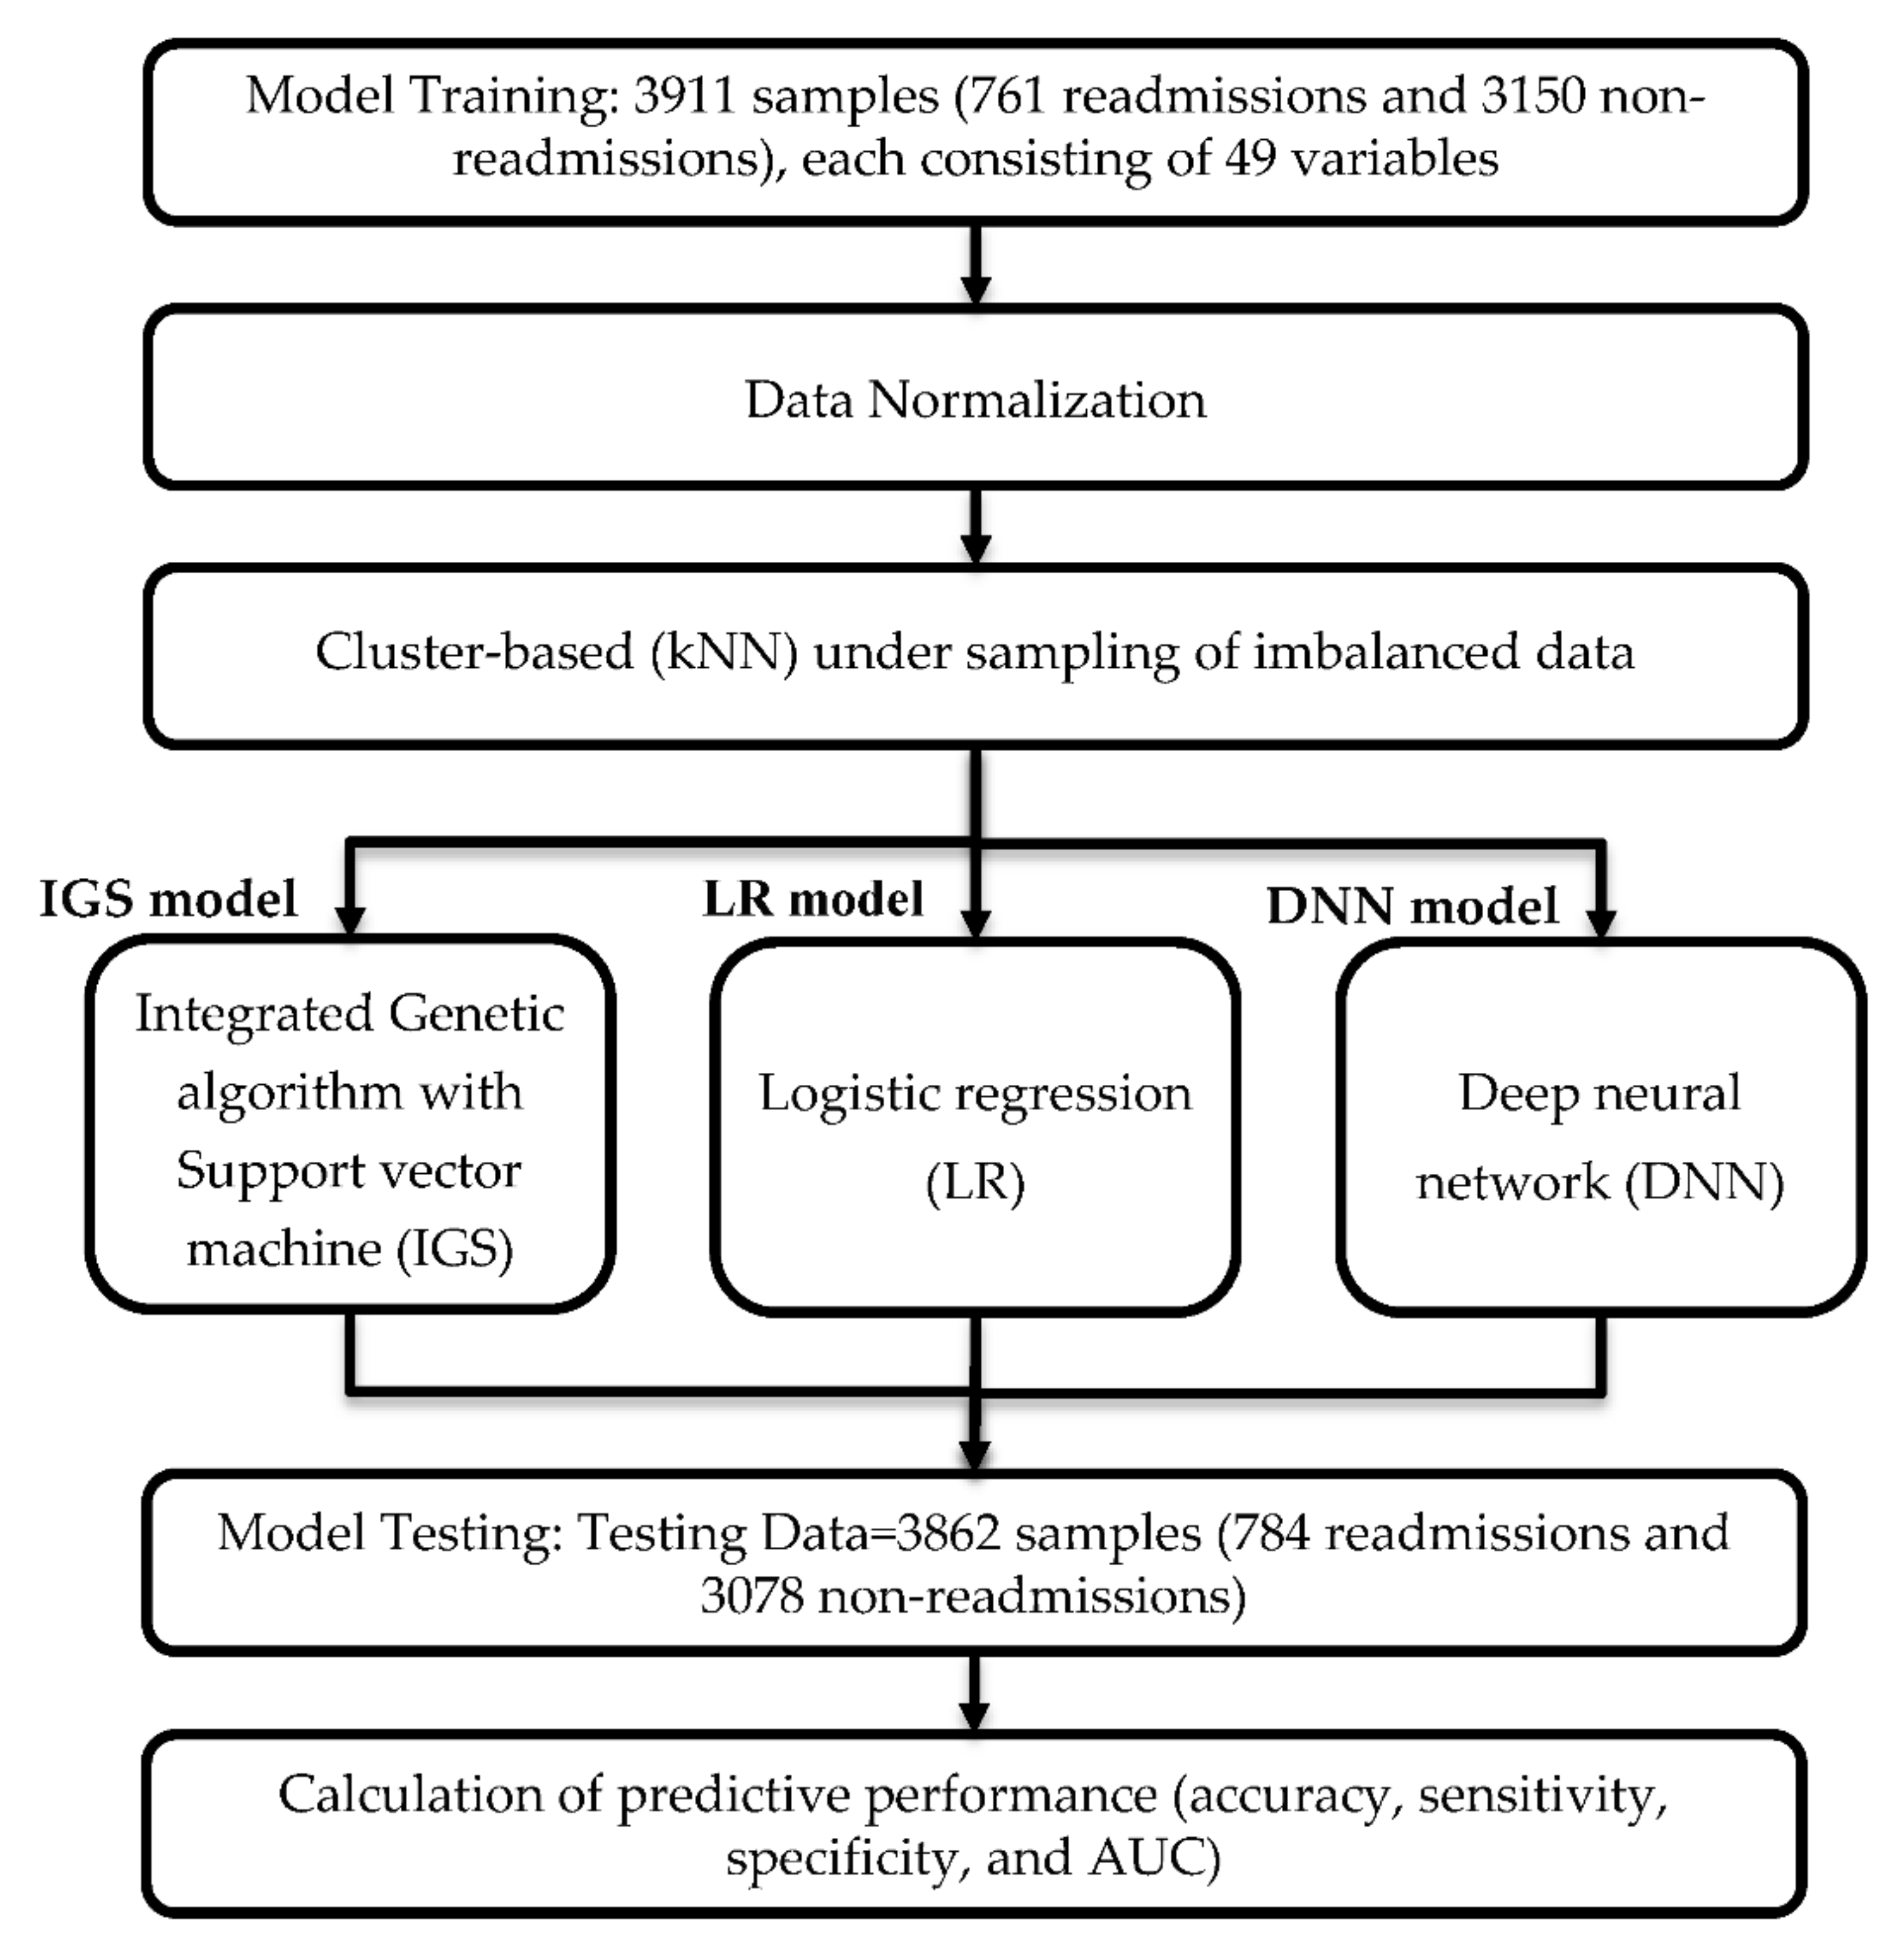
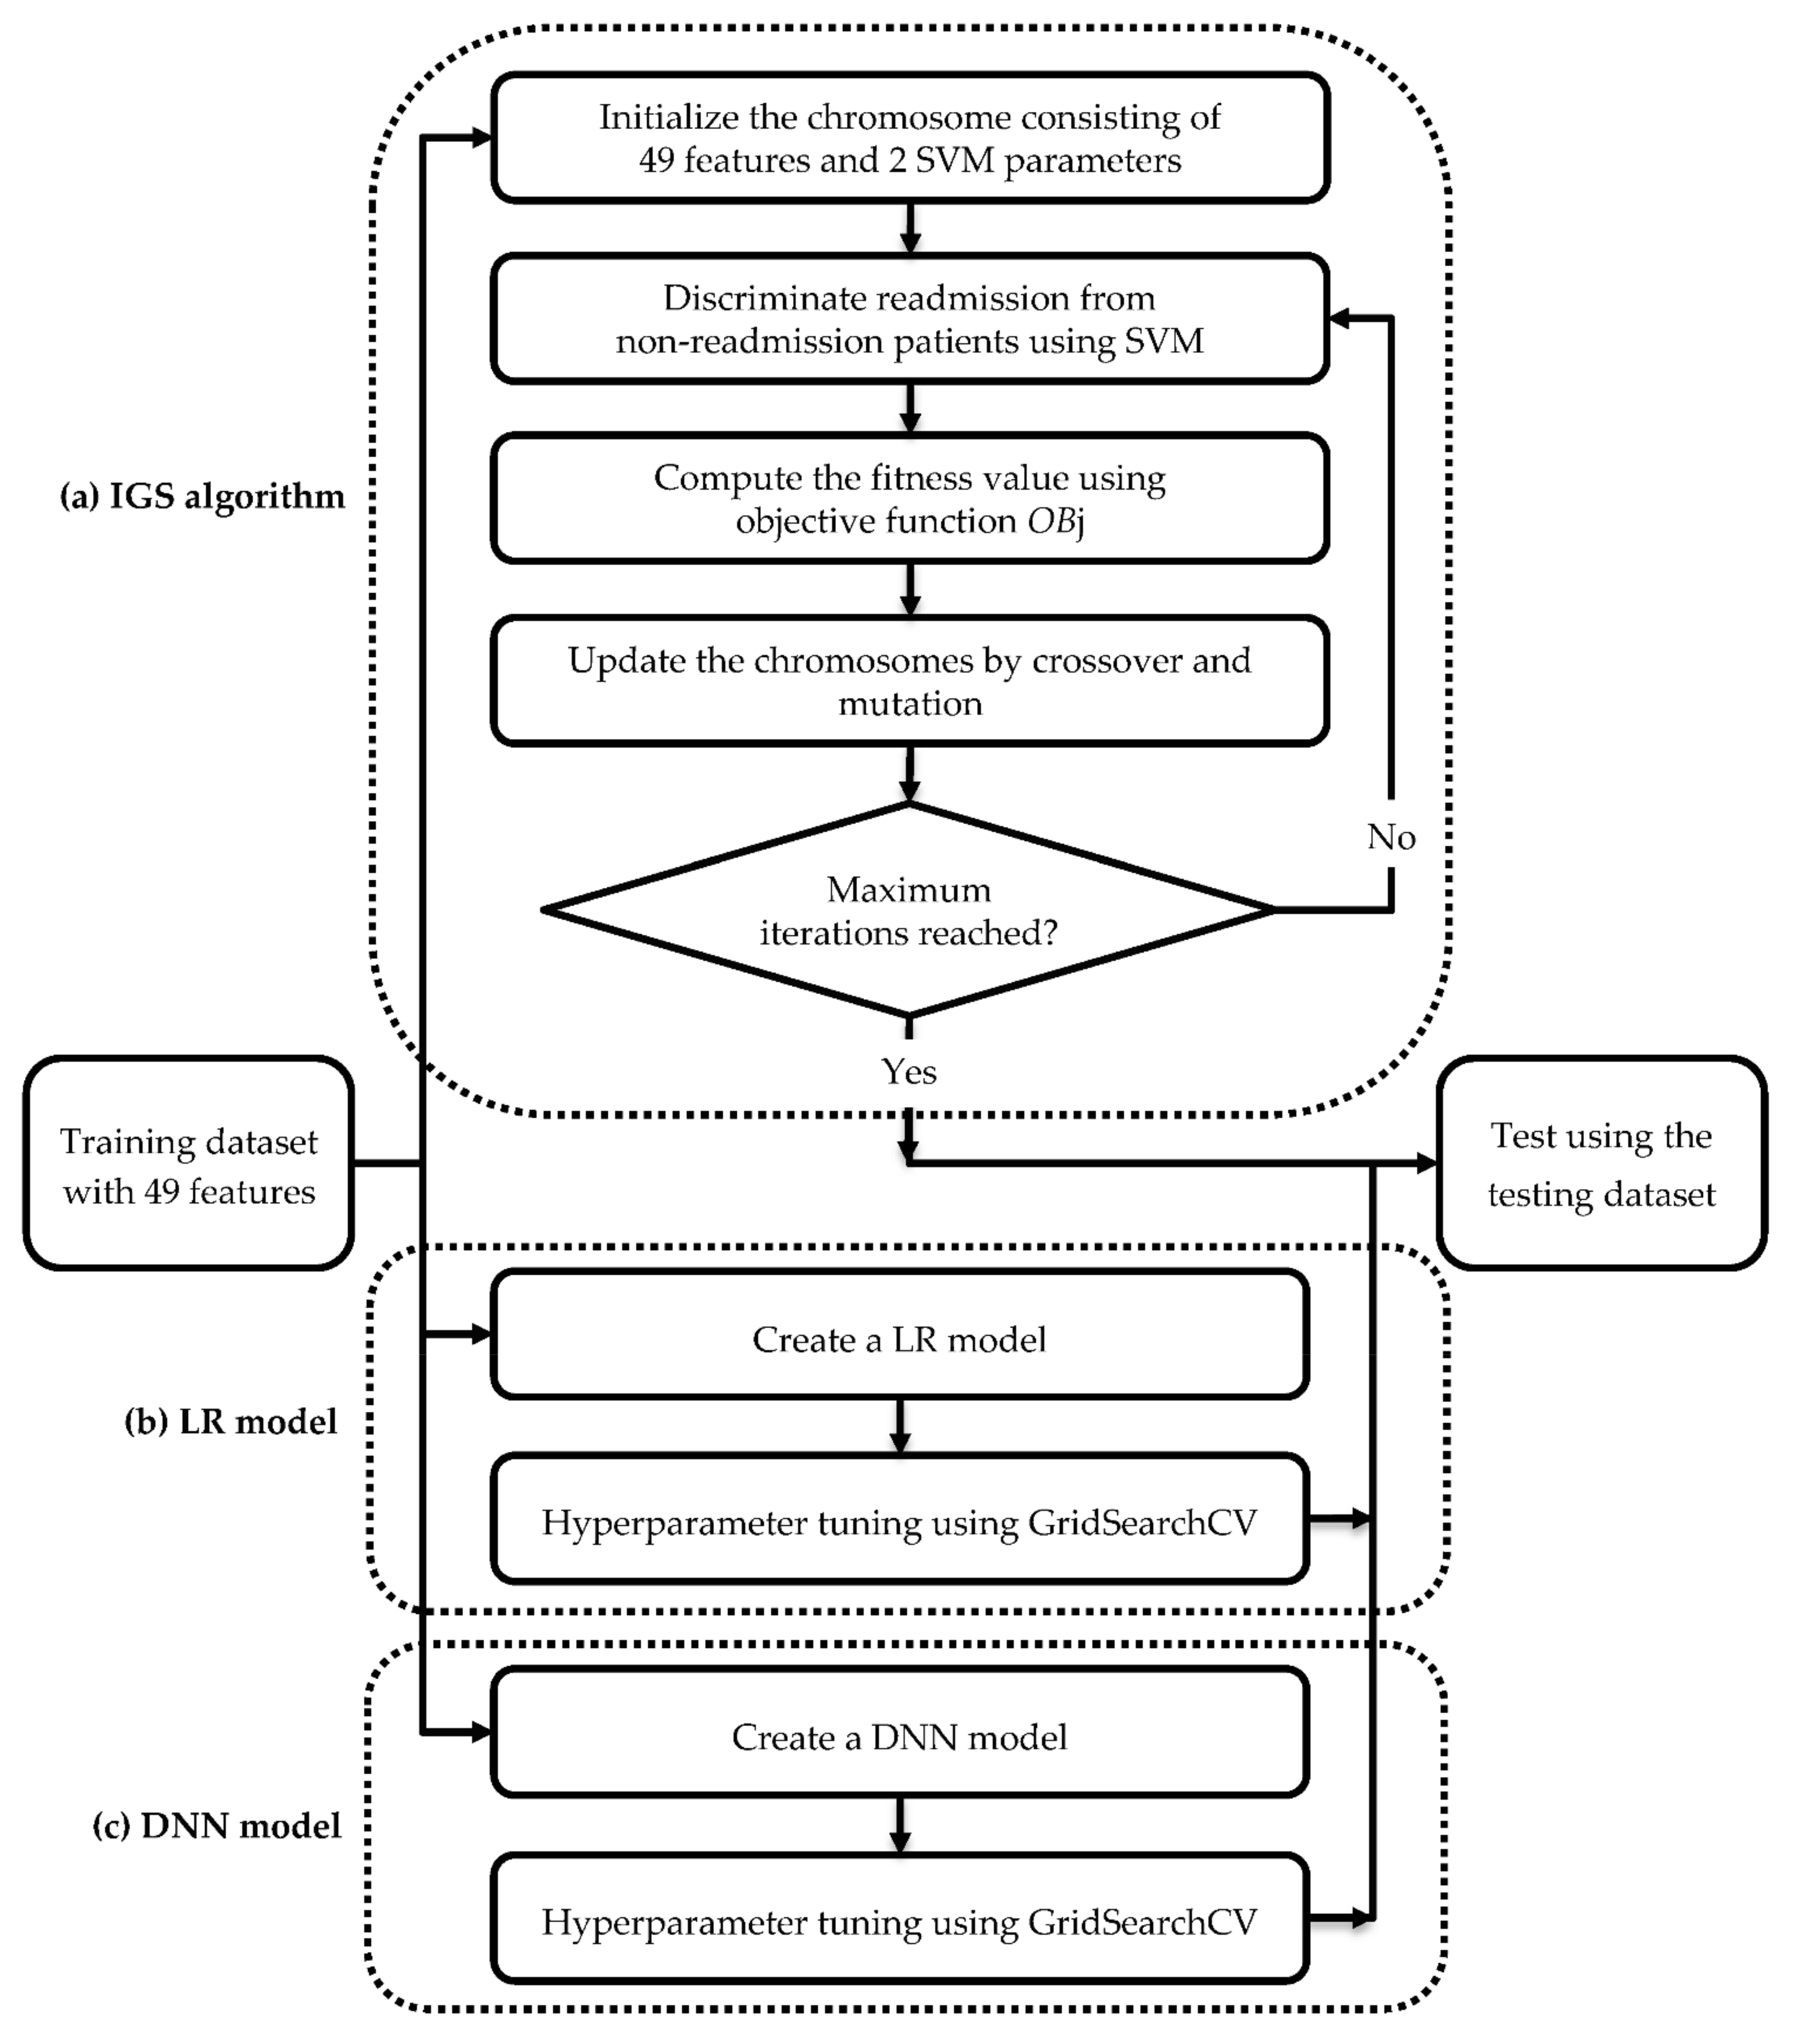
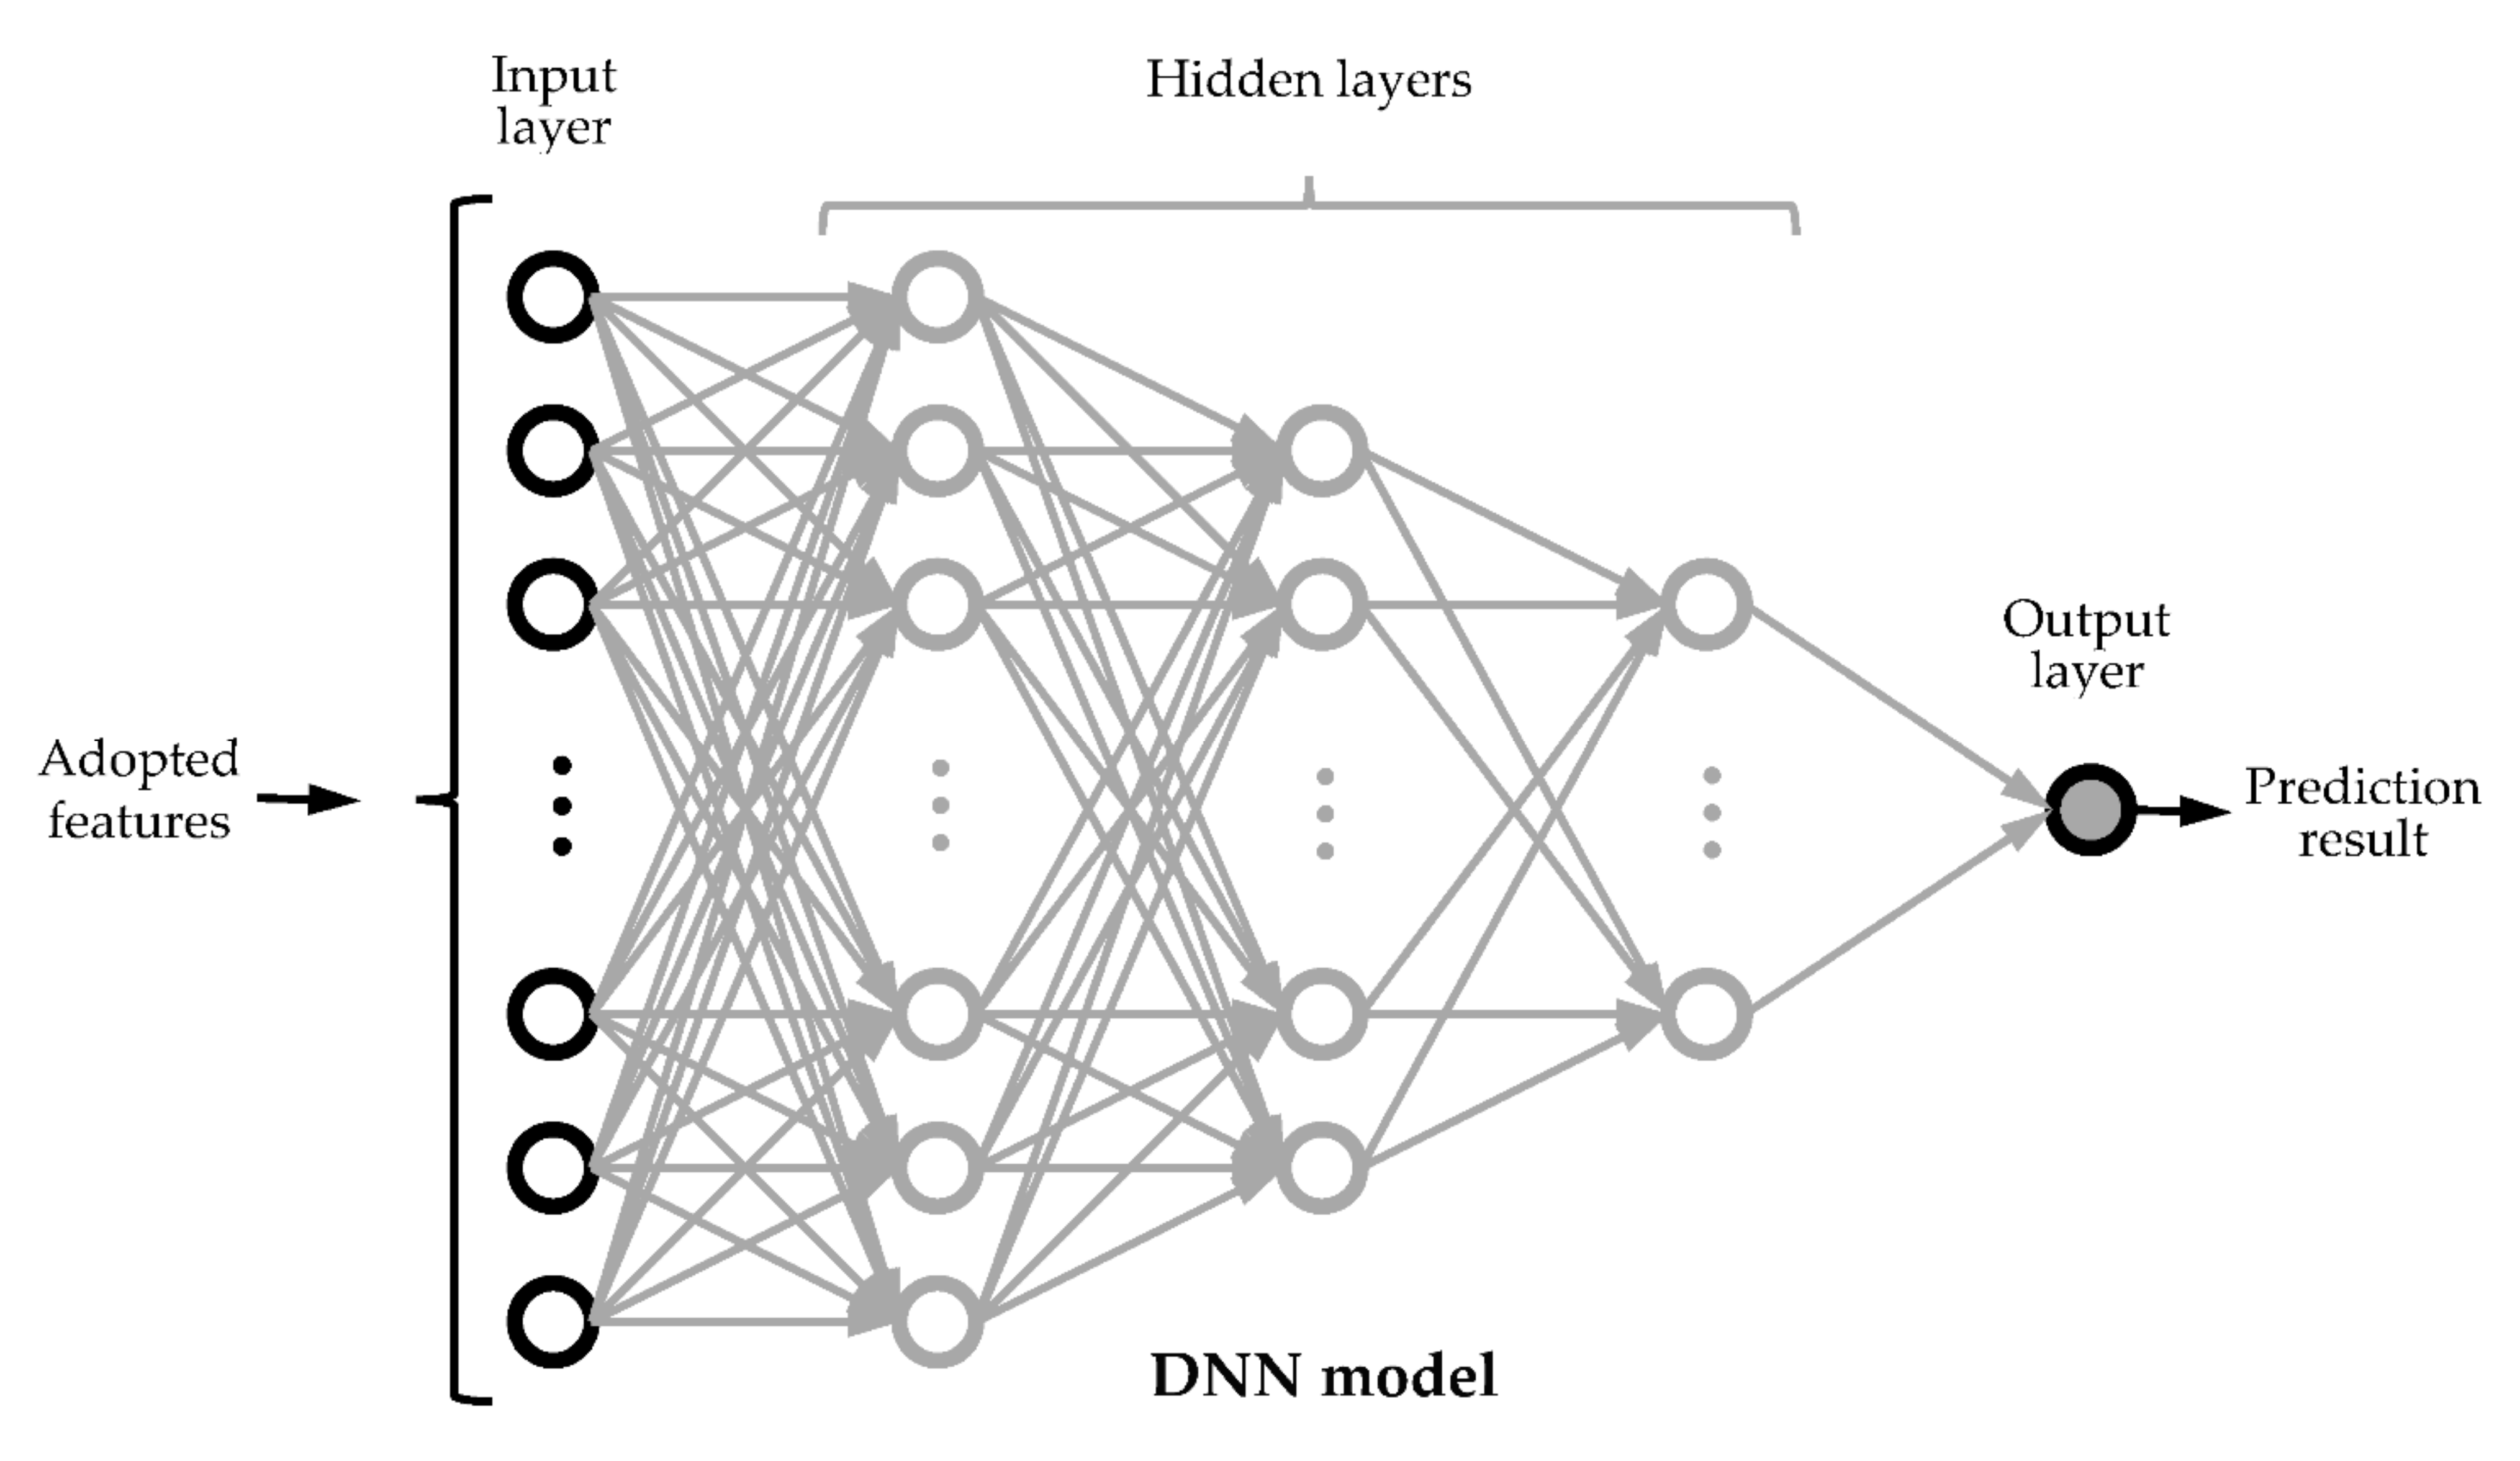
2.5. Design of Prediction Models

Figure 1 shows the experimental procedure with IGS, DNN, and LR algorithms used for creating the predictive models. Figure 2 shows the procedures of IGS, DNN, and LR algorithms for optimizing the predictive performances of the models. As illustrated in Figure 2a, in the IGS algorithm, GA was used for selecting the salient features and adjusting the SVM parameters (cost value and kernel parameter), whereas SVM was used for designing the predictive models based on three different objective functions [60]. For each iteration when optimizing the IGS model, the n chromosomes were updated by combining n/2 new chromosomes generated from crossover with the other n/2 chromosomes obtained from mutation. The aforementioned steps were repeated until the best objective value was obtained within the maximum number of iterations. As illustrated in Figure 2b,c, hyperparameter tuning adopting the GridSearchCV function was used for optimizing the LR and DNN models, respectively.
In the training phase, the cluster-based kNN (k-nearest neighbors) undersampling method [62] was adopted to prepare the training dataset. The samples in the majority class (with M samples) were clustered into m clusters that each consisted of M/m or M/m + 1 samples. Then, the kNN algorithm was applied to select the sample that was nearest to the center of gravity in each cluster, resulting in a balanced training set containing 2m samples (m samples obtained from the majority group and m samples of minority group) for cross validation. Ten-fold cross validation was adopted for training and validating the models in order to obtain a model with the best performance. In the testing phase, the imbalanced testing dataset was applied to test the constructed predictive models obtained in the training phase.
When designing the IGS models, selection of the objective function was crucial for obtaining the optimal models. As indicated in Equations (1)–(3), in this study, the cost-sensitive objective functions, including combined accuracy, sensitivity, and specificity, AUC, as well as g-mean, were used to obtain the optimal models with imbalanced datasets.
OB 1 = ACC SEN SPE
OB 2 = AUC
OB 3 = SEN × SPE
Notice that in Equation (1), the maximum fitness value is obtained by maximizing accuracy (ACC) and minimizing difference between sensitivity (SEN) and specificity (SPE) to avoid the decision hyperplane biasing toward the majority class. In the testing phase, the testing dataset was adopted for testing the models created in the training phase. Performances of the constructed models were quantitatively evaluated using the SEN, SPE, ACC, and AUC.
The IGS models were developed using the SVM package (LIBSVM [63,64]) and GA algorithms under a Visual C++ environment operated under a Windows 10 operating system in a personal computer with Intel i7-6700HQ 4-core CPU @2.60 GHz, 8 GB main memory, and NVidia GeForce GTX950M GPU. As illustrated in Figure 3, the structure of the DNN algorithm consisted of an input layer, three hidden layers, and an output layer with 49, 20-20-20, and 1 nodes, respectively, with a rectified linear (ReLU) function adopted in the hidden layer and sigmoid activation function applied in the output layer. In model training, the epoch was set to 80 and the batch size was set to 50. A personal computer consisted of Intel i7-7500U dual-core CPU @2.70 GHz, 8 GB main memory, and NVidia Geforce MX150 GPU and was operated under a Windows 10 operating system, and the Jupyter Notebook (Scikit-learn package, Tensorflow, Python) environment was used for designing the LR and DNN models [65,66,67].

3. Results

3.1. Comparisons of Demographic Characteristics, Comorbidities, Inpatient Interventions, and Related Variables between Readmitted and Non-Readmitted Patients

As shown in Table 4, data of readmitted (1545 patients; 1023 men and 522 women) and non-readmitted (6228 patients; 3495 men and 2733 women) patients retrieved from the NHIRD within 2010–2011 were compared. As indicated in the table, the age and gender distribution of the readmitted and non-readmitted patients were significantly different (p < 0.001). Readmitted patients were older and mostly male. Regarding comorbidity, readmitted patients had significantly more comorbidities (p < 0.001) and higher CCI (p < 0.001) scores than the non-readmitted patients. It was also noted that readmitted patients experienced significantly more ED visits (p < 0.001) and exhibited a significantly higher frequency of hospitalizations (p < 0.001) and outpatient visits (p < 0.001) within 1 year before admission.
During hospitalization, readmitted patients received significantly more surgical operations and administrated medications (p < 0.001) and also had a significantly higher chance of using a ventilator and receiving additional interventions (p < 0.001), including urinal indwelling, C.V.P. catheter, N-G feeding, respiratory suction, or tracheostomy care. In addition, readmitted patients had longer hospital stays and more healthcare expenditure than the non-readmitted patients (p < 0.001).
The category of admitted hospitals between readmitted and non-readmitted groups was significantly different (p < 0.01). The admission rate to district hospitals for the readmitted group was higher than the non-readmitted group. There was no significant difference (p = 0.654) regarding discharge status; the outpatient follow-up rate of the readmitted group was similar to the non-readmission group.
When comparing hospitalizations within 1 year before admission for 17 comorbidities, except chronic pulmonary disease (marginally significant with p = 0.052), the frequencies of all the other comorbidities in the admitted group were significantly higher (p < 0.05) than the non-readmitted group. In contrast, only four comorbidities, including congestive heart failure, cerebrovascular disease, dementia, and blood malignancy (leukemia or lymphoma), in the readmitted group exhibited a significant higher frequency of outpatient visits than the non-admitted group.

3.2. Predictve Performance

Table 5 compares the predictive performance among five different models designed using IGS, DNN, and LR algorithms, with the training dataset prepared using a cluster-based undersampling method (kNN). Accuracy was calculated as the fitness value for DNN and LR models, while three objective functions were applied for optimizing the IGS models. As shown in Table 5, the predictive performance of the DNN and LR models achieved 61.50%, 79.34%, 56.95%, and 0.7547, as well as 65.77%, 78.44%, 62.54%, and 0.7689 in ACC, SEN, SPE, and AUC, respectively. The IGS models using AUC as the objective function exhibited a better predictive performance than the other models with ACC, SEN, SPE, and AUC achieving 70.30–71.22%, 68.85–78.33%, 70.30–73.58%, and 0.7536–0.7729, respectively, in the training phase, as well as 68.20–70.11%, 70.40–74.61%, 66.56–69.59%, and 0.7599–0.7758, respectively, in the testing phase.
As indicated in Table 5, although the model trained using OB2 achieved a slightly better predictive performance, the IGS models optimized with objective functions OB1, OB2, and OB3 had a similar predictive performance in both the training and testing phases. The ACC, SEN, SPE, and AUC obtained in the testing phase were 68.20%, 74.61%, 66.56%, and 0.7727, respectively, for the IGS-OB1 model; 70.11%, 73.46%, 69.26%, and 0.7758, respectively, for IGS-OB2 model; and 69.75%, 70.40%, 69.59%, and 0.7599, respectively, for the IGS-OB3 model. The variables selected by the IGS models optimized with three objective functions were different (Table 4). The salient variables selected by the IGS method for designing the predictive models included gender, age, number of comorbidities, ED visits, frequency of hospitalizations and outpatient visits within 1 year before admission, number of administrated medications, ventilator use and accompanied therapies, other interventions, category of admitted hospital, length of admission, total healthcare cost, discharge status, and outpatient visits and hospitalizations visits for comorbidity within 1 year before admission.
The execution time was 70.2 s and 1.8 s for training and testing the DNN models, respectively, and 2.2 s and 1.6 s for training and testing the LR models, respectively. The time for training the IGS model with each objective function was much longer (around 1–2 weeks) compared to the LR and DNN models, while the time for testing the IGS model was around a few seconds only.

4. Discussions

4.1. Model Explainability

As shown in Table 4, among the 49 variables included for analysis, 34 showed significant differences (p < 0.05) between readmitted and non-readmitted patients. Variables including gender; comorbidity number; hospitalization number within 1 year before admission; adminstrated medication number and ventilator use/therpies, and other interventions; catergery of admitted hospitals; mean outpatient visits within 1 year before admission for myocardial infarction, peptic ulcer disease, diabetes with chronic complication, renal disease, and leukemia/lymphoma; and mean hospitalization within 1 year before admission for myocardial infarction, congestive heart failure, peripheral vascular disease, cerebrovascular disease, peptic ulcer disease, renal disease, leukemia/lymphoma, and moderate/severe liver disease were all selected by the three IGS models. Although highly statistically significant in discriminating the readmitted patients from the non-readmitted ones, variables, including age (p < 0.001); all-cause (p < 0.001), cerebrovascular disease (p < 0.01), and dementia (p < 0.01) outpatient visits within 1 year before admission; and mild liver disease (p < 0.001) and metastatic solid tumor (p < 0.001) hospitalizations within 1 year before admission, were selected by only one IGS model. On the other hand, although not reaching statistical significance, discharge status (p = 0.654) and outpatient visits within 1 year before admission for myocardial infarction (p = 0.594), peripheral vascular disease (0.128), chronic pulmonary disease (0.408), rheumatologic disease (0.833), peptic ulcer disease (0.069), mild liver disease (0.815), diabetes with chronic complication (0.25), hemiplegia/paraplegia (0.334), renal disease (0.283), moderate/severe liver disease (0.668), and AIDS/HIV (0.298) were selected by at least one IGS model. These findings verified that filter methods, such as statistical analysis, F-score, or entropy, may not be appropriate for selecting features when designing predictive models [60,64]. Moreover, it also revealed that non-significant variables observed by univariate statistical analysis may have compensatory effects for increasing the predictive performance of the created models. Variables that are highly correlated can also be adopted together to strengthen the predictive performances of the predictive models [64].
As indicated in Table 5, the AI model with the best predictive performance in the testing phase was the IGS model optimized with the OB2 objective function. As indicated in Table 4, the number of men was more than women in the readmission group, which is consistent with previous studies [21,22], but inconsistent with another study regarding pneumonia readmission [54]. The age of readmission group was significantly older than the non-readmission group, which is consistent with previous studies [21,54], indicating that the elder patients usually have worse health status and thus have a higher risk of readmission than the younger patients.
The number of comorbidities in the readmission group was significantly more than that of the non-readmission group, denoting that pneumonia patients with more comorbidities had a higher risk of readmission after discharge, which is consistent with a previous study [21]. Frequencies of ED visits and hospitalizations within 1 year before admission were both significantly more in the readmitted group than the non-readmitted group, which is consistent with previous studies [53,54,55], reinforcing that pneumonia patients with more recent ED visits or hospitalizations exhibited worse health status and thus had a higher risk of readmission after discharge.
During hospitalization, pneumonia patients received more administrated medications and also had higher rates of using ventilators and receiving additional interventions, again indicating that readmitted patients tended to have worse health status, resulting in a higher chance of readmission after discharge. The above inpatient intervention variables were adopted for designing our models, but not in the previous study [55]. In [55], only administrated opioids and time until first administered antibiotics were included. Notice that, as shown in Table 4, the number of surgical operations was not selected by any IGS models, even it was significantly different between the readmitted and non-readmitted groups.
Length of admission and total healthcare cost were both selected by the IGS-OB2 model and were also adopted in [44]. Pneumonia patients who stayed longer in hospital and accumulated higher medical expenses tended to be more severe and had a higher chance of future readmissions. Interestingly, for readmitted patients, only 4 among 17 comorbidities treated in outpatient visits within 1 year before admission were significantly more frequent (p < 0.05) than the non-readmitted patients, indicating that patients with frequent physician visit had better management of comorbidities and had the effect of preventing the deterioration of comorbidities [68], which in turn presented a lower chance of readmission. In contrast, 16 (and 1 marginally significant p = 0.052 for CPD) out of 17 comorbidities causing hospitalizations within 1 year before admission for the readmitted patients exhibited significantly higher rates than the non-readmitted patients, denoting that health status presented in recent hospital admissions, especially the last one, was useful for predicting the following readmission. Trajectory of previous admissions and prior readmissions were the most important features for precisely discriminating readmission from non-readmission patients [44].

4.2. Performance Comparison

Table 3 compares the state-of-the-art models for predicting the readmission of pneumonia patients after discharge. It can be observed that many previous works adopted logistic regression (LR) with different features extracted from EHRs for designing the predictive models. The IGS models presented in this study achieved an AUC of 0.7727–0.7758, which is similar to the model reported in [52] (0.77) and outperforms the models presented in [53] (0.71), [54] (0.731), and [55] (0.74), which are designed based on EHRs. In [52], the AUC of LR models for predicting 30-day pneumonia-unrelated and pneumonia–related readmissions for patients with pneumonia admission reached 0.77 and 0.65, respectively, in which only 52 cases of pneumonia-unrelated readmission and 29 pneumonia-related readmission were observed among the 1117 pneumonia admitted patients who were included for model construction.
On the other hand, in [53,55], younger cases < 65 y old were excluded from the extracted samples when designing the predictive models. In contrast, our study included patients ≥ 20 y old for the model design, and was more comprehensive and representative for readmission prediction. As demonstrated in Table 4, in general, elder patients had a significantly higher chance of readmission compared to the younger patients. In Taiwan, the NHI program provides healthcare to more than 99% of the 23 M citizens. NHIRD has collected more than 20 years of long-term patient data for almost all Taiwanese citizens from the data submitted by the participating healthcare institutions for claiming reimbursements. Most citizens intend to migrate around hospitals to visit physicians with a high reputation for better treatment due to the good accessibility, comprehensive population coverage, short waiting time, and low costs, making the long-term collection of healthcare data for an individual patient in a single hospital very difficult. The healthcare data of an individual are generally distributed in the EHRs of many hospitals situated in different areas of Taiwan. Therefore, in general, EHRs have recorded only incomplete or short-term patient healthcare data [22]. In this study, compared to the model constructed with EHRs, our models were designed based on the long-term NHIRD dataset, which is capable of exhibiting the long-term health status of a patient, resulting in an improved predictive performance.
The TADEL method reached an excellent predictive performance with an AUC of 0.884 for predicting the all-cause readmission for all-cause conditions, with the performance improvement mainly achieved by adopting an attenuation coefficient and amplification coefficient [44]. However, in [44], the ratios of the readmission group to the non-readmission group in numbers of admissions and ED visits were 16.3 and 16.8, respectively, which were very high compared to our study (admission: 1.5; ED visit: 1.1) and a recent study (admission: 1.6) for predicting all-cause readmission [21]. We suggest that data with such a high ratio of readmission to non-readmission groups in the number of hospitalizations and ED visits presented in [44] could enable the designed model to achieve a higher predictive performance. Furthermore, a balanced dataset was adopted for designing the TADEL model in [44]; in contrast, our model and other models reported in previous studies were designed based on the imbalanced dataset, more similar to the real world, with a ratio of readmission to non-readmission case number of 4 in our model, 13.8 in [52], 6.5 in [53], 7.4 in [54], and 3.9 in [55], which greatly degraded the predictive performance of the created models.
As demonstrated in [69], laboratory test results, including the white blood cell count and albumin at discharge, as well as the number of comorbidities, are independent risk factors of readmission for pneumonia patients. However, compared to the predictive models presented in [54,55], variables associated with laboratory test results (concentration of platelets, albumin, and blood urea nitrogen) were not used in our models, as they were not available in the NHIRD. Although not significant (p = 0.654) in the discrimination readmitted from non-readmitted patients, discharge status (with/without outpatient follow-up) was selected by constructing two IGS models. As noted in [70], discharge disposition was an independent predictor of readmission for community-acquired pneumonia patients, and follow-up interventions after patient discharge is necessary for reducing morbidities and mortalities.
Variables that were used for creating the predictive models in this study and also adopted in previous studies include age, gender, CCI, LOS, previous admissions, and disposition status at hospital discharge, as well as related comorbidities, including congestive heart failure, coronary heart disease, cerebrovascular disease, chronic lung disease, renal disease, diabetes mellitus, and major psychiatric disorders [52,53,54,55].

4.3. Future Works

Only a moderate predictive performance (AUC < 0.8) has been achieved so far for models designed for predicting the readmission of pneumonia admission. In contrast, models for predicting all-cause readmissions of discharged patients admitted with all-cause conditions exhibited a higher predictive performance with an AUC as high as 0.877–0.9038 [46]. As shown in Table 4, the laboratory test results, physiological parameters, and social determinants of health available in EHRs were not included in the NHIRD dataset and were not available for our model design. Future work will focus on applying transfer learning algorithm [71,72,73] to transfer the knowledge learned from models obtained using the long-term NHIRD dataset to train models based on the short-term EHRs for improving the predictive performance.
In addition to transfer learning, other advanced AI methods, such as extreme gradient boosting (XGBoost) [37,38,39], time trajectory learning of adopted features [44], integrated AI models [45], feature selection algorithms [46,47], and graph-based methods [48] mentioned in Section 1.3, may also be adopted for model construction to further elevate the predictive performance of pneumonia readmission prediction.

5. Conclusions

According to the analytical results, it was observed that the IGS model for predicting pneumonia readmissions designed using NHIRD outperformed the models designed using data retrieved from EHRs presented in previous studies. It could be adopted to assist physicians in detecting pneumonia patients who have a higher risk of readmission after being discharged so that appropriate aftercare interventions can be administrated to prevent readmissions in order to reduce morbidities, mortalities, and healthcare cost. Future research will focus on further improving the predictive performance by using advanced AI methods as well as more significant features.

Author Contributions

Conceptualization, D.-J.L. and Y.-F.C.; Data curation, H.-H.L. and C.-S.L.; Formal analysis, J.-C.H. and H.-H.L.; Funding acquisition, F.-H.W. and Y.-F.C.; Investigation, F.-H.W. and C.-S.L.; Methodology, J.-C.H., F.-H.W. and H.-H.L.; Project administration, Y.-F.C.; Resources, J.-C.H. and C.-S.L.; Software, J.-C.H. and H.-H.L.; Supervision, D.-J.L. and Y.-F.C.; Writing—original draft, F.-H.W.; Writing—review & editing, F.-H.W. and Y.-F.C. All authors have read and agreed to the published version of the manuscript.

Funding

This research was funded by Ministry of Science and Technology, Taiwan (grant nos. MOST109-2410-H-166-001 and MOST110-2410-H-166-001–SSS) and China Medical University, Taiwan (grant no. CMU110-N-07).

Institutional Review Board Statement

This study was approved by the Institute of Reviewing Board (No. 109-32) of Jen-Ai Hospital, Taichung, Taiwan.

Acknowledgments

The authors would like to express their appreciation to Ministry of Science and Technology, Taiwan and China Medical University, Taiwan for financial supports to Y.F. Chen and F.H. Wu, respectively.

Conflicts of Interest

The authors declare no conflict of interest.

References

  1. Kansagara, D.; Englander, H.; Salanitro, A.; Kagen, D.; Theobald, C.; Freeman, M.; Kripalani, S. Risk prediction models for hospital readmission: A systematic review. JAMA 2011, 306, 1688–1698. [Google Scholar] [CrossRef] [PubMed] [Green Version]
  2. Navathe, A.S.; Zhong, F.; Lei, V.J.; Chang, F.Y.; Sordo, M.; Topaz, M.; Navathe, S.B.; Rocha, R.A.; Zhou, L. Hospital readmission and social risk factors identified from physician notes. Health Serv. Res. 2018, 53, 1110–1136. [Google Scholar] [CrossRef] [PubMed]
  3. Glans, M.; Ekstam, A.K.; Jakobsson, U.; Bondesson, Å.; Midlöv, P. Risk factors for hospital readmission in older adults within 30 days of discharge—A comparative retrospective study. BMC Geriatr. 2020, 20, 467. [Google Scholar] [CrossRef] [PubMed]
  4. Dharmarajan, K.; Hsieh, A.F.; Lin, Z.; Bueno, H.; Ross, J.S.; Horwitz, L.I.; Barreto-Filho, J.A.; Kim, N.; Suter, L.G.; Bernheim, S.M. Hospital readmission performance and patterns of readmission: Retrospective cohort study of Medicare admissions. BMJ 2013, 347, f6571. [Google Scholar] [CrossRef] [Green Version]
  5. Rumball-Smith, J.; Blakely, T.; Sarfati, D.; Hider, P. The mismeasurement of quality by readmission rate: How blunt is too blunt an instrument? A quantitative bias analysis. Med. Care 2013, 51, 418–424. [Google Scholar] [CrossRef]
  6. Ayabakan, S.; Bardhan, I.; Zheng, Z. Triple Aim and the Hospital Readmission Reduction Program. Health Serv. Res. Manag. Epidemiol. 2021, 8, 2333392821993704. [Google Scholar] [CrossRef]
  7. Hoffman, G.J.; Yakusheva, O. Association between financial incentives in Medicare’s hospital readmissions reduction program and hospital readmission performance. JAMA Netw. Open 2020, 3, e202044. [Google Scholar] [CrossRef] [Green Version]
  8. Hogan, T.H.; Lemak, C.H.; Hearld, L.R.; Wheeler, J.; Sen, B.P.; Menachemi, N. Vertical integration into skilled nursing facilities and hospital readmission rates. J. Healthc. Qual. JHQ 2020, 42, 91–97. [Google Scholar] [CrossRef]
  9. Baechle, C.; Agarwal, A. A framework for the estimation and reduction of hospital readmission penalties using predictive analytics. J. Big Data 2017, 4, 37. [Google Scholar] [CrossRef]
  10. Pugh, J.; Penney, L.S.; Noël, P.H.; Neller, S.; Mader, M.; Finley, E.P.; Lanham, H.J.; Leykum, L. Evidence based processes to prevent readmissions: More is better, a ten-site observational study. BMC Health Serv. Res. 2021, 21, 189. [Google Scholar] [CrossRef]
  11. Kash, B.A.; Baek, J.; Davis, E.; Champagne-Langabeer, T.; Langabeer, J.R. II Review of successful hospital readmission reduction strategies and the role of health information exchange. Int. J. Med. Inform. 2017, 104, 97–104. [Google Scholar] [CrossRef] [PubMed]
  12. McHugh, M.D.; Ma, C. Hospital nursing and 30-day readmissions among Medicare patients with heart failure, acute myocardial infarction, and pneumonia. Med. Care 2013, 51, 52–59. [Google Scholar] [CrossRef] [PubMed] [Green Version]
  13. Lee, E.W. Selecting the best prediction model for readmission. J. Prev. Med. Public Health 2012, 45, 259. [Google Scholar] [CrossRef] [PubMed]
  14. Jasti, H.; Mortensen, E.M.; Obrosky, D.S.; Kapoor, W.N.; Fine, M.J. Causes and risk factors for rehospitalization of patients hospitalized with community-acquired pneumonia. Clin. Infect. Dis. 2008, 46, 550–556. [Google Scholar] [CrossRef]
  15. Donzé, J.; Lipsitz, S.; Bates, D.W.; Schnipper, J.L. Causes and patterns of readmissions in patients with common comorbidities: Retrospective cohort study. BMJ 2013, 347, f7171. [Google Scholar] [CrossRef] [Green Version]
  16. Baker, M.C.; Alberti, P.M.; Tsao, T.-Y.; Fluegge, K.; Howland, R.E.; Haberman, M. Social Determinants Matter For Hospital Readmission Policy: Insights From New York City: Study examines social determinants and hospital readmissions. Health Aff. 2021, 40, 645–654. [Google Scholar] [CrossRef]
  17. Melton, L.D.; Foreman, C.; Scott, E.; McGinnis, M.; Cousins, M. Prioritized post-discharge telephonic outreach reduces hospital readmissions for select high-risk patients. Am. J. Manag. Care 2012, 18, 838–844. [Google Scholar]
  18. Charles, L.; Jensen, L.; Torti, J.M.; Parmar, J.; Dobbs, B.; Tian, P.G.J. Improving transitions from acute care to home among complex older adults using the LACE Index and care coordination. BMJ Open Qual. 2020, 9, e000814. [Google Scholar] [CrossRef]
  19. Garg, A.X.; Adhikari, N.K.; McDonald, H.; Rosas-Arellano, M.P.; Devereaux, P.J.; Beyene, J.; Sam, J.; Haynes, R.B. Effects of computerized clinical decision support systems on practitioner performance and patient outcomes: A systematic review. JAMA 2005, 293, 1223–1238. [Google Scholar] [CrossRef]
  20. Rajkomar, A.; Oren, E.; Chen, K.; Dai, A.M.; Hajaj, N.; Hardt, M.; Liu, P.J.; Liu, X.; Marcus, J.; Sun, M. Scalable and accurate deep learning with electronic health records. NPJ Digit. Med. 2018, 1, 18. [Google Scholar] [CrossRef]
  21. Lai, H.J.; Tan, T.H.; Lin, C.S.; Chen, Y.F.; Lin, H.H. Designing a clinical decision support system to predict readmissions for patients admitted with all-cause conditions. J. Ambient. Intell. Humaniz. Comput. 2020, 1–10. [Google Scholar] [CrossRef]
  22. Wu, F.H.; Lai, H.J.; Lin, H.H.; Chan, P.C.; Tseng, C.M.; Chang, K.M.; Chen, Y.F.; Lin, C.S. Predictive models for detecting patients more likely to develop acute myocardial infarctions. J. Supercomput. 2022, 78, 2043–2071. [Google Scholar] [CrossRef]
  23. Porat, T.; Kostopoulou, O.; Woolley, A.; Delaney, B.C. Eliciting user decision requirements for designing computerized diagnostic support for family physicians. J. Cogn. Eng. Decis. Mak. 2016, 10, 57–73. [Google Scholar] [CrossRef] [Green Version]
  24. Horng, S.; Sontag, D.A.; Halpern, Y.; Jernite, Y.; Shapiro, N.I.; Nathanson, L.A. Creating an automated trigger for sepsis clinical decision support at emergency department triage using machine learning. PLoS ONE 2017, 12, e0174708. [Google Scholar] [CrossRef] [Green Version]
  25. Hsu, J.C.; Chen, Y.F.; Chung, W.S.; Tan, T.H.; Chen, T.S.; Chiang, J.Y. Clinical verification of a clinical decision support system for ventilator weaning. Biomed. Eng. Online 2013, 12, S4. [Google Scholar] [CrossRef] [PubMed] [Green Version]
  26. Luo, G.; Nkoy, F.L.; Gesteland, P.H.; Glasgow, T.S.; Stone, B.L. A systematic review of predictive modeling for bronchiolitis. Int. J. Med. Inform. 2014, 83, 691–714. [Google Scholar] [CrossRef] [Green Version]
  27. Dunn Lopez, K.; Gephart, S.M.; Raszewski, R.; Sousa, V.; Shehorn, L.E.; Abraham, J. Integrative review of clinical decision support for registered nurses in acute care settings. J. Am. Med. Inform. Assoc. 2017, 24, 441–450. [Google Scholar] [CrossRef]
  28. Scheepers-Hoeks, A.-M.J.; Grouls, R.J.; Neef, C.; Ackerman, E.W.; Korsten, E.H. Physicians’ responses to clinical decision support on an intensive care unit—Comparison of four different alerting methods. Artif. Intell. Med. 2013, 59, 33–38. [Google Scholar] [CrossRef]
  29. Oluoch, T.; Katana, A.; Kwaro, D.; Santas, X.; Langat, P.; Mwalili, S.; Muthusi, K.; Okeyo, N.; Ojwang, J.K.; Cornet, R. Effect of a clinical decision support system on early action on immunological treatment failure in patients with HIV in Kenya: A cluster randomised controlled trial. Lancet HIV 2016, 3, e76–e84. [Google Scholar] [CrossRef] [Green Version]
  30. Otto, A.K.; Dyer, A.A.; Warren, C.M.; Walkner, M.; Smith, B.M.; Gupta, R.S. The development of a clinical decision support system for the management of pediatric food allergy. Clin. Pediatrics 2017, 56, 571–578. [Google Scholar] [CrossRef]
  31. Ammenwerth, E.; Schnell-Inderst, P.; Machan, C.; Siebert, U. The effect of electronic prescribing on medication errors and adverse drug events: A systematic review. J. Am. Med. Inform. Assoc. 2008, 15, 585–600. [Google Scholar] [CrossRef] [PubMed] [Green Version]
  32. Baypinar, F.; Kingma, H.J.; van der Hoeven, R.T.; Becker, M.L. Physicians’ compliance with a clinical decision support system alerting during the prescribing process. J. Med. Syst. 2017, 41, 96. [Google Scholar] [CrossRef] [PubMed]
  33. Arnaud, É.; Elbattah, M.; Gignon, M.; Dequen, G. Deep learning to predict hospitalization at triage: Integration of structured data and unstructured text. In Proceedings of the 2020 IEEE International Conference on Big Data (Big Data), Atlanta, GA, USA, 10–13 December 2020; pp. 4836–4841. [Google Scholar]
  34. Sánchez-Salmerón, R.; Gómez-Urquiza, J.L.; Albendín-García, L.; Correa-Rodríguez, M.; Martos-Cabrera, M.B.; Velando-Soriano, A.; Suleiman-Martos, N. Machine learning methods applied to triage in emergency services: A systematic review. Int. Emerg. Nurs. 2022, 60, 101109. [Google Scholar] [CrossRef] [PubMed]
  35. Kwon, J.-M.; Jeon, K.-H.; Lee, M.; Kim, K.-H.; Park, J.; Oh, B.-H. Deep learning algorithm to predict need for critical care in pediatric emergency departments. Pediatric Emerg. Care 2021, 37, e988–e994. [Google Scholar] [CrossRef]
  36. Raita, Y.; Goto, T.; Faridi, M.K.; Brown, D.F.; Camargo, C.A.; Hasegawa, K. Emergency department triage prediction of clinical outcomes using machine learning models. Crit. Care 2019, 23, 64. [Google Scholar] [CrossRef] [PubMed] [Green Version]
  37. Hong, W.S.; Haimovich, A.D.; Taylor, R.A. Predicting hospital admission at emergency department triage using machine learning. PLoS ONE 2018, 13, e0201016. [Google Scholar] [CrossRef] [PubMed] [Green Version]
  38. Choi, S.W.; Ko, T.; Hong, K.J.; Kim, K.H. Machine learning-based prediction of Korean triage and acuity scale level in emergency department patients. Healthc. Inform. Res. 2019, 25, 305–312. [Google Scholar] [CrossRef]
  39. Klug, M.; Barash, Y.; Bechler, S.; Resheff, Y.S.; Tron, T.; Ironi, A.; Soffer, S.; Zimlichman, E.; Klang, E. A gradient boosting machine learning model for predicting early mortality in the emergency department triage: Devising a nine-point triage score. J. Gen. Intern. Med. 2020, 35, 220–227. [Google Scholar] [CrossRef]
  40. Navares, R.; Aznarte, J.L. Deep learning architecture to predict daily hospital admissions. Neural Comput. Appl. 2020, 32, 16235–16244. [Google Scholar] [CrossRef]
  41. Chung, A.; Famouri, M.; Hryniowski, A.; Wong, A. COVID-Net Clinical ICU: Enhanced Prediction of ICU Admission for COVID-19 Patients via Explainability and Trust Quantification. arXiv 2021, arXiv:2109.06711. [Google Scholar]
  42. Yu, K.; Yang, Z.; Wu, C.; Huang, Y.; Xie, X. In-hospital resource utilization prediction from electronic medical records with deep learning. Knowl.-Based Syst. 2021, 223, 107052. [Google Scholar] [CrossRef]
  43. Alsinglawi, B.; Alnajjar, F.; Mubin, O.; Novoa, M.; Alorjani, M.; Karajeh, O.; Darwish, O. Predicting Length of Stay for Cardiovascular Hospitalizations in the Intensive Care Unit: Machine Learning Approach. In Proceedings of the 2020 42nd Annual International Conference of the IEEE Engineering in Medicine & Biology Society (EMBC), Montreal, QC, Canada, 20–24 July 2020; pp. 5442–5445. [Google Scholar]
  44. Xie, J.; Zhang, B.; Ma, J.; Zeng, D.; Lo-Ciganic, J. Readmission prediction for patients with heterogeneous medical history: A trajectory-based deep learning approach. ACM Trans. Manag. Inf. Syst. TMIS 2021, 13, 1–27. [Google Scholar] [CrossRef]
  45. Choudhury, A.; Greene, C.M. Evaluating patient readmission risk: A predictive analytics approach. arXiv 2018, arXiv:1812.11028. [Google Scholar] [CrossRef]
  46. Jiang, S.; Chin, K.S.; Qu, G.; Tsui, K.L. An integrated machine learning framework for hospital readmission prediction. Knowl.-Based Syst. 2018, 146, 73–90. [Google Scholar] [CrossRef]
  47. Du, G.; Zhang, J.; Luo, Z.; Ma, F.; Ma, L.; Li, S. Joint imbalanced classification and feature selection for hospital readmissions. Knowl.-Based Syst. 2020, 200, 106020. [Google Scholar] [CrossRef]
  48. Du, G.; Zhang, J.; Ma, F.; Zhao, M.; Lin, Y.; Li, S. Towards graph-based class-imbalance learning for hospital readmission. Expert Syst. Appl. 2021, 176, 114791. [Google Scholar] [CrossRef]
  49. Junqueira, A.R.B.; Mirza, F.; Baig, M.M. A machine learning model for predicting ICU readmissions and key risk factors: Analysis from a longitudinal health records. Health Technol. 2019, 9, 297–309. [Google Scholar] [CrossRef]
  50. Ryu, B.; Yoo, S.; Kim, S.; Choi, J. Development of Prediction Models for Unplanned Hospital Readmission within 30 Days Based on Common Data Model: A Feasibility Study. Methods Inf. Med. 2021, 60, e65–e75. [Google Scholar]
  51. Weinreich, M.; Nguyen, O.K.; Wang, D.; Mayo, H.; Mortensen, E.M.; Halm, E.A.; Makam, A.N. Predicting the risk of readmission in pneumonia. A systematic review of model performance. Ann. Am. Thorac. Soc. 2016, 13, 1607–1614. [Google Scholar] [CrossRef] [Green Version]
  52. Capelastegui, A.; Yandiola, P.P.E.; Quintana, J.M.; Bilbao, A.; Diez, R.; Pascual, S.; Pulido, E.; Egurrola, M. Predictors of short-term rehospitalization following discharge of patients hospitalized with community-acquired pneumonia. Chest 2009, 136, 1079–1085. [Google Scholar] [CrossRef]
  53. Mather, J.F.; Fortunato, G.J.; Ash, J.L.; Davis, M.J.; Kumar, A. Prediction of pneumonia 30-day readmissions: A single-center attempt to increase model performance. Respir. Care 2014, 59, 199–208. [Google Scholar] [CrossRef] [PubMed]
  54. Makam, A.N.; Nguyen, O.K.; Clark, C.; Zhang, S.; Xie, B.; Weinreich, M.; Mortensen, E.M.; Halm, E.A. Predicting 30-day pneumonia readmissions using electronic health record data. J. Hosp. Med. 2017, 12, 209. [Google Scholar] [CrossRef] [PubMed] [Green Version]
  55. Hatipoğlu, U.; Wells, B.J.; Chagin, K.; Joshi, D.; Milinovich, A.; Rothberg, M.B. Predicting 30-day all-cause readmission risk for subjects admitted with pneumonia at the point of care. Respir. Care 2018, 63, 43–49. [Google Scholar] [CrossRef] [Green Version]
  56. Lai, H.J.; Chan, P.C.; Lin, H.H.; Chen, Y.F.; Lin, C.S.; Hsu, J.C. A web-based decision support system for predicting readmission of pneumonia patients after discharge. In Proceedings of the 2018 IEEE International Conference on Systems, Man, and Cybernetics (SMC), Miyazaki, Japan, 7–10 October 2018; pp. 2305–2310. [Google Scholar]
  57. Chang, C.C.; Liao, C.C.; Chen, T.L. Perioperative medicine and Taiwan National Health Insurance Research Database. Acta Anaesthesiol. Taiwanica 2016, 54, 93–96. [Google Scholar] [CrossRef]
  58. Farquad, M.; Bose, I. Preprocessing unbalanced data using support vector machine. Decis. Support Syst. 2012, 53, 226–233. [Google Scholar] [CrossRef]
  59. Hu, J.; Yang, H.; Lyu, M.R.; King, I.; So, A.M.C. Online nonlinear AUC maximization for imbalanced data sets. IEEE Trans. Neural Netw. Learn. Syst. 2017, 29, 882–895. [Google Scholar] [CrossRef] [PubMed]
  60. Chen, Y.F.; Lin, C.S.; Wang, K.A.; Rahman, L.O.A.; Lee, D.J.; Chung, W.S.; Lin, H.H. Design of a clinical decision support system for fracture prediction using imbalanced dataset. J. Healthc. Eng. 2018, 2018, 9621640. [Google Scholar] [CrossRef] [Green Version]
  61. Charlson, M.E.; Pompei, P.; Ales, K.L.; MacKenzie, C.R. A new method of classifying prognostic comorbidity in longitudinal studies: Development and validation. J. Chronic Dis. 1987, 40, 373–383. [Google Scholar] [CrossRef]
  62. Lin, W.C.; Tsai, C.F.; Hu, Y.H.; Jhang, J.S. Clustering-based undersampling in class-imbalanced data. Inf. Sci. 2017, 409, 17–26. [Google Scholar] [CrossRef]
  63. Chang, C.C.; Lin, C.J. LIBSVM: A Library for Support Vector Machines. Available online: https://www.csie.ntu.edu.tw/~cjlin/libsvm/faq.html#f203 (accessed on 29 December 2021).
  64. Chen, Y.F.; Huang, P.C.; Lin, K.C.; Lin, H.H.; Wang, L.E.; Cheng, C.C.; Chen, T.P.; Chan, Y.K.; Chiang, J.Y. Semi-automatic segmentation and classification of pap smear cells. IEEE J. Biomed. Health Inform. 2013, 18, 94–108. [Google Scholar] [CrossRef]
  65. Pedregosa, F.; Varoquaux, G.; Gramfort, A.; Michel, V.; Thirion, B.; Grisel, O.; Blondel, M.; Prettenhofer, P.; Weiss, R.; Dubourg, V. Scikit-learn: Machine learning in Python. J. Mach. Learn. Res. 2011, 12, 2825–2830. [Google Scholar]
  66. Abadi, M.; Agarwal, A.; Barham, P.; Brevdo, E.; Chen, Z.; Citro, C.; Corrado, G.S.; Davis, A.; Dean, J.; Devin, M. TensorFlow: Large-scale Machine Learning on Heterogeneous Systems. arXiv Prepr. 2016, arXiv:1603.04467. [Google Scholar]
  67. Pilgrim, M.; Willison, S. Dive into Python 3; Springer: Berlin/Heidelberg, Germany, 2009; Volume 2. [Google Scholar]
  68. Chen, Y.F.; Lin, C.S.; Hong, C.F.; Lee, D.J.; Sun, C.M.; Lin, H.H. Design of a clinical decision support system for predicting erectile dysfunction in men using NHIRD dataset. IEEE J. Biomed. Health Inform. 2019, 23, 2127–2137. [Google Scholar] [CrossRef] [PubMed]
  69. Petersen, P.T.; Egelund, G.B.; Jensen, A.V.; Andersen, S.B.; Pedersen, M.F.; Rohde, G.; Ravn, P. Associations between biomarkers at discharge and co-morbidities and risk of readmission after community-acquired pneumonia: A retrospective cohort study. Eur. J. Clin. Microbiol. Infect. Dis. 2018, 37, 1103–1111. [Google Scholar] [CrossRef] [PubMed] [Green Version]
  70. Dong, T.; Cursio, J.F.; Qadir, S.; Lindenauer, P.K.; Ruhnke, G.W. Discharge disposition as an independent predictor of readmission among patients hospitalised for community-acquired pneumonia. Int. J. Clin. Pract. 2017, 71, e12935. [Google Scholar] [CrossRef] [PubMed]
  71. Danso, S.O.; Zeng, Z.; Muniz-Terrera, G.; Ritchie, C.W. Developing an explainable machine learning-based personalised dementia risk prediction model: A transfer learning approach with ensemble learning algorithms. Front. Big Data 2021, 4, 21. [Google Scholar] [CrossRef] [PubMed]
  72. Zhuang, F.; Qi, Z.; Duan, K.; Xi, D.; Zhu, Y.; Zhu, H.; Xiong, H.; He, Q. A comprehensive survey on transfer learning. Proc. IEEE 2020, 109, 43–76. [Google Scholar] [CrossRef]
  73. Feuz, K.D.; Cook, D.J. Collegial activity learning between heterogeneous sensors. Knowl. Inf. Syst. 2017, 53, 337–364. [Google Scholar] [CrossRef]
Figure 1. Experimental procedure for designing IGS, DNN, and LR predictive models.
Electronics 11 00673 g001
Figure 2. Optimization procedures of (a) IGS, (b) LR, and (c) DNN algorithms.
Electronics 11 00673 g002
Figure 3. Structure of deep neural network (DNN).
Electronics 11 00673 g003
Table 1. Recent AI models for predicting associated events of hospital admissions.
Study (Year)Prediction EventMethodDatasetUsed Features or InputPredictive PerformanceIssue
[33]
(2020)
Hospital admission at EDMLP with numeric and categorical features + CNN with textual data260,000 ED records of a hospital in France collected within 2015–201928 features of numeric, categorical, and textual dataAUC = 0.83
[40]
(2020)
Daily hospital admission due to respiratory- and circulatory-related disordersLSTM + CNNPatients ≥ 65 y due to circulatory or respiratory disorders across the region of Madrid, Spain, within 2001–201313 locations and 12 features of chemical air pollutants, weather observations, and pollen observationsRMSE = 11.21 and 11.76 for circulatory and respiratory cases, respectivelyPatients with
age < 65 y were excluded
[41]
(2021)
ICU admission for COVID-19 patientsCOVID-Net Clinical ICU1925 COVID-19 patient records retrieved from a hospital in Canada in 2020228 clinical features in fields of demographic information, previous diseases, blood results, and vital signs for each patientACC = 96.9%
[42] (2021)In-hospital cost and LOS of admitted patientsRUP750,000 EMRs of discharged patients from 2012 to 2015 collected from a hospital quality monitoring system of ChinaPatient features, diagnosis texts, operation texts, diagnosis IDs, and operation IDsRMSE = 7765 CNY and 7.056 days for cost and LOS predictions respectively
[43]
(2020)
LOS for cardiovascular hospitalization in ICUStacking regressionHealth data of 61,532 ICU stays in the MIMIC-III dataset provided by MIT LabDemographics, vital signs, laboratory tests, medications, and more clinical variablesMAE = 1.92 days
Table 2. Recent AI models for predicting hospital readmissions.
Study (Year)Prediction EventMethodDatasetCategories of FeaturesAUCIssue
[44]
(2021)
30-day hospital readmissionTADEL by capturing dynamic medical historyA balanced dataset of 72,668 readmission and 72,663 non-readmission patients acquired from national Medicare claims of all hospitals in the US from 2011 to 2015Health status
factors, insurance coverage and payment, history of health service utilizations and hospitalizations, and sociodemographic information
0.884Using a balanced dataset for testing is not the real situation in practice, the dataset is usually very imbalanced, which may degrade the predictive performance
[45]
(2018)
90-day hospital readmissionGBM + GA69,984 encounters retrieved from 10-year dataset of 130 US hospitals55 attributes (including HbA1c, gender, discharge disposition, admission source, specialty of the admitting physician, primary diagnosis (9), race, age, time in hospital, etc.)Not shown, ACC = 97.05%AUC not shown
[46]
(2018)
30-day hospital readmission, etc.SVM + feature selection algorithm (EMOBPSO), etc.2871 and 40,460 readmission and non-readmission cases from the HIS of a hospital in northeast China21 fields of 3 databases (outpatient information, EMR, and inpatient information) in the HIS0.9038Low precision (43.43%)
[47]
(2020)
hospital readmissionsJICFS (including 1-norm regularization for class-imbalance aware feature selection)6 open readmission datasets (all-cause, LACE-score, MIMIC, T-carer, RA, and diabetic)15–243 features0.733–0.9299Low MCC for 2 datasets ranging from 0.5012–0.546
[48]
(2021)
hospital readmissionsGraph-CL6 open readmission datasets (All-cause, LACE-score, MIMIC, T-carer, RA, and diabetic)Adopted 15–75 features0.776–0.886Low MCC for 3 datasets ranging from 0.561–0.617
[49]
(2019)
30-day ICU readmissionMLPMIMIC-III dataset with 42,307 ICU stays of 31,749 patients
from a US hospital in 2001 to 2012
12 features0.642
[50]
(2021)
30-day hospital readmissionGBM (AI model) + CDM (for applying trained AI model to multiple institutions)106,304 hospitalizations with 32,242 readmissions retrieved from EHR of Seoul National University Hospital in 2017–2018, etc.Demographics, clinical index score, diagnosis, medication, visit records, surgeries, and clinical examination test.0.8414(1) Precise features adopted for model creation and prediction are not clear;
(2) predictive parameters except AUC are not shown;
(3) the predictive performance degrades when applying the model trained in a hospital to another hospital
MCC   =   TP × TN FP × FN / TP + FP TP + FN TN + FP TN + FN
Table 3. Comparison of state-of-the-art studies in the prediction of readmissions for pneumonia patients.
Study (Year)Prediction EventMethodDatasetAdopted
Features
AUCIssue
[52]
(2009)
30-day pneumonia-
unrelated readmission #1
LR #21117 pneumonia patients
discharged at Galdakao Hospital in Basque country, Spain
Age, CCI #3, and
decompensated comorbidities
0.77The predictive performances obtained using only 52/29 pneumonia-
unrelated/
related readmission cases were less representative
30-day pneumonia-
related readmission #1
Treatment failure and instability factors0.65
[53]
2014
30-day
all-cause readmission
LR965 cases (148 readmissions) of pneumonia
admission
collected at Hartford hospital, Connecticut
16 significant features (5 demographic items, previous admissions,
income, 7 comorbidities, and 2 lab values) selected from 31 variables
0.71Patients with age < 65 y were excluded
[54]
2017
30-day
all-cause readmission
LREHRs #4 of 1463 patients (199
readmissions)
hospitalized with pneumonia
collected from 6 hospitals in northern Texas
Income, platelets, prior hospitalizations in past year, vital sign instabilities #5 on discharge, updated PSI #6, and disposition status at hospital discharge0.731Readmissions to hospitals beyond 100-mile radius of Dallas were not counted
[55]
(2018)
30-day
all-cause readmission
LREHRs of 1295
hospitalizations (330 readmissions) with pneumonia at the Cleveland clinic main campus in Ohio
13 significant features (age, cancer, CHD #7, stroke, antibiotics, opioids, temperature, BUN #8, hemoglobin, albumin, sodium, INR #9, and prior admissions within 6 months)0.74Excluded
age < 65 y
Pilot study [56]
(2018)
30-day
all-cause readmission #1
IGS1103/4331 w/wo readmissions of pneumonia patients retrieved from NHIRD
(medical
administrative
records) in
Taiwan
20 features
(demographics, comorbidity no., comorbidity index, events within 1 year before admission, inpatient interventions, category of admitted hospitals, LoA #10, healthcare cost, discharge status, and dosage of antibiotics)
0.76Physiological signals, laboratory test
results, and social determinants, were not included in NHIRD and not adopted in our pilot study
This study30-day
all-cause readmission #1
IGS,
DNN, and
LR
1545/6228 w/wo readmissions of pneumonia patients retrieved from NHIRD
(medical
administrative
records) in
Taiwan
49 features listed in Table 40.7758,
0.7547, and
0.7689
Physiological signals, laboratory test
results, and social determinants were not included in NHIRD and not adopted in this study
#1 of pneumonia patients; #2 logistic regression; #3 CCI = Charlson comorbidity index; #4 EHR = electronic health record; #5 vital sign instabilities were defined as temperature ≥ 37.8 °C, heart rate > 100 beats/min, respiratory rate > 24 breaths/min, systolic blood pressure ≤ 90 mmHg, or oxygen saturation < 90%; #6 PSI = pneumonia severity index; #7 CHD = coronary heart disease; #8 BUN = blood urea nitrogen; #9 INR = international normalized ratio; #10 LoA = length of admission (days).
Table 4. Comparisons between pneumonia patients with and without readmission.
VariablesReadmissionp-Value
Yes (n = 1545)No (n = 6228)
Gendera, b, c, n(%) <0.001
 Men1023 (66.2%)3495 (56.1%)
 Women522 (33.8%)2733 (43.9%)
Ageb in year, mean (SD)74.7 (15.1)65.7 (20)<0.001
Comorbidity, mean (SD)
 No. a, b, c3.6 (0.9)2.8 (1.4)<0.001
 CCI score2.2 (1.9)0.9 (1.3)<0.001
Events within 1 year before admission
 ED visits b, c, n (%)1224 (79.2%)4621 (74.2%)<0.001
 Hospitalizations a, b, c, mean (SD)2.2 (1.9)1.5 (1.1)<0.001
 Outpatient visits c, mean (SD)20.2 (19.8)17 (17.7)<0.001
Inpatient Interventions
 Surgical operations, mean (SD)1.1 (1.4)0.7 (1.1)<0.001
 Adm. Medications a, b, c, mean (SD)18.2 (8.3)15 (7.3)<0.001
 Ventilator use/therapy a, b, c, n (%)1149 (74.4%)3650 (58.6%)<0.001
 Other interventions a, b, c, n (%)820 (53.1%)1717 (27.6%)<0.001
Category of admitted hospitalsa, b, c, n (%) <0.01
 Medical center333 (21.6%)1410 (22.6%)Chi-square = 9.658; p = 0.008
 Regional hospital713 (46.1%)3056 (49.1%)
 District hospital499 (32.3%)1762 (28.3%)
Length of admissionb, c, mean (SD) days11.4 (6.7)8.4 (5.5)<0.001
Total healthcare costa, b, mean (SD) NT$54,268 (46,311)36,975 (39,346)<0.001
Discharge statusb, c 0.654
 No follow-up, n (%)49 (3.2%)184 (3.0%)
 Outpatient follow-up, n (%)1496 (96.8%)6044 (97.0%)
Outpatient visits within 1 year before admission, mean (SD)
 Myocardial infarction a, b, c0.2 (2)0.2 (1.9)0.594
 Congestive heart failure2.5 (7.8)1.7 (6.2)<0.001
 Peripheral vascular disease b, c0.4 (2.7)0.3 (2.4)0.128
 Cerebrovascular disease b8 (18.1)6.3 (17.3)0.001
 Dementia a2.9 (8.4)2.3 (8.1)0.008
 Chronic pulmonary disease b0.2 (2.2)0.1 (2.1)0.408
 Rheumatologic disease a, c0.5 (5.6)0.5 (4.9)0.833
 Peptic ulcer disease a, b, c2.4 (6.3)2.1 (6.1)0.069
 Mild liver disease a1.3 (6.4)1.3 (5.9)0.815
 Diabetes w/o chron. compl.6.1 (13.8)5.6 (13.1)0.214
 Diabetes w chron. compl. a, b, c1.1 (4.9)1.3 (6)0.25
 Hemiplegia or paraplegia a, c0.7 (6.7)0.6 (5.4)0.334
 Renal disease a, b, c4.1 (14.3)3.6 (14.6)0.283
 Leukemia or lymphoma a, b, c5.6 (15.5)3.6 (14.4)<0.001
 Moderate/severe liver disease b, c0 (0.6)0 (0.6)0.668
 Metastatic solid tumor0.2 (2.9)0.1 (2)0.069
 AIDS/HIV b, c0.1 (1.7)0 (0.9)0.298
Hospitalizations within 1 year before admission, mean (SD)
 Myocardial infarction a, b, c0.1 (0.3)0 (0.2)<0.001
 Congestive heart failure a, b, c0.6 (1.4)0.2 (0.9)<0.001
 Peripheral vascular disease a, b, c0.1 (0.3)0 (0.2)<0.001
 Cerebrovascular disease a, b, c0.6 (1.4)0.3 (1)<0.001
 Dementia b, c0.1 (0.6)0.1 (0.4)<0.001
 Chronic pulmonary disease a, b0 (0.3)0 (0.2)0.052
 Rheumatologic disease b, c0.1 (0.7)0 (0.3)0.007
 Peptic ulcer disease a, b, c0.3 (0.8)0.1 (0.5)<0.001
 Mild liver disease c0.3 (1.3)0.1 (0.6)<0.001
 Diabetes w/o chron. compl. a, b1.1 (2.3)0.5 (1.2)<0.001
 Diabetes w chron. compl. a, c0.1 (0.7)0.1 (0.4)<0.001
 Hemiplegia or paraplegia b, c0.1 (0.7)0 (0.3)<0.001
 Renal disease a, b, c0.5 (1.7)0.2 (1)<0.001
 Leukemia or lymphoma a, b, c1 (2.9)0.3 (1.1)<0.001
 Moderate/severe liver disease a, b, c0.1 (0.7)0 (0.2)<0.001
 Metastatic solid tumor b0.5 (2)0.1 (0.6)<0.001
 AIDS/HIV b, c0 (0.2)0 (0.1)0.043
Note: Variables selected by IGS models with a OB1, b OB2, and c OB3, respectively.
Table 5. Predictive performances of models designed by the IGS, DNN, and LR methods.
MethodObjective FunctionACC (%)SEN (%)SPE (%)AUC
Training Phase
IGSOB170.3070.3070.300.7536
OB270.6378.3372.930.7729
OB371.2268.8573.580.7595
DNNACC65.8165.0466.540.7266
LRACC69.1865.4572.760.7543
Testing Phase
IGSOB168.2074.6166.560.7727
OB270.1173.4669.260.7758
OB369.7570.4069.590.7599
DNNACC61.5079.3456.950.7547
LRACC65.7778.4462.540.7689
Publisher’s Note: MDPI stays neutral with regard to jurisdictional claims in published maps and institutional affiliations.

