Article

Indoor Propagation Analysis of IQRF Technology for Smart Building Applications

1
Department of Electronic Systems, Norwegian University of Science and Technology, 2821 Gjovik, Norway
2
Department of Avionics, Atilim University, Incek Golbasi, 06830 Ankara, Turkey
3
Department of Electronics and Telecommunications Engineering, University of Dar es Salaam, Dar es Salaam 14112, Tanzania
4
Department of Computer Science, Norwegian University of Science and Technology, 2821 Gjovik, Norway
*
Authors to whom correspondence should be addressed.
Electronics 2022, 11(23), 3972; https://doi.org/10.3390/electronics11233972
Submission received: 30 September 2022 / Revised: 13 November 2022 / Accepted: 28 November 2022 / Published: 30 November 2022

Abstract

:
Owing to its efficiency in the Internet of Things (IoT) applications in terms of low-power connectivity, IQRF (Intelligent Connectivity using Radio Frequency) technology appears to be one of the most reasonable IoT technologies in the commercial market. To realize emerging smart building applications using IQRF, it is necessary to study the propagation characteristics of IQRF technology in indoor environments. In this study, preliminary propagation measurements are conducted using IQRF transceivers that operate on the 868 MHz band in a peer-to-peer (P2P) configured system. The measurements are conducted both in a single corridor of a building in a Line-of-Sight (LoS) link and two perpendicular corridors in a Non-Line-of-Sight (NLoS) with one single knife-edge link. Moreover, the measured path loss values are compared with the predicted path loss values in order to comparatively assess the prediction accuracy of the well-known empirical models, such as log-distance, ITU, and WINNER II. According to the results, it is concluded that the ITU-1 path loss model agrees well with the measurements and could be used in the planning of an IQRF network deployment in a typical LoS corridor environment. For NLoS corridors, both ITU-3 and WINNERII-2 models could be used due to their higher prediction accuracy. We expect that the initial results achieved in this study could open new perspectives for future research on the development of smart building applications.

1. Introduction

Recent developments in the Internet of Things (IoT) have led to the concept of smart buildings becoming popular due to the benefits and services offered [1,2]. These smart building and their applications can mainly be realized using a system of sensors connecting wirelessly, known as Wireless Sensor Networks (WSNs) [3]. In the deployment of WSNs, one needs to give extra attention to, among others, the cost of the IoT wireless technology, its power consumption, and coverage. In this context, well-known wireless communication technologies, such as Low-Energy Bluetooth, Wi-Fi, and XBee/ZigBee, using unlicensed ISM (Industrial, Scientific, and Medical) bands are mostly preferred to be used in smart building applications [4,5,6]. However, the main concern in their implementation can be linked to the limited network coverage. In order to solve this concern, Low-Power Wide Area Networks (LPWANs) technologies, such as SigFox and LoRa, have appeared [7,8]. Among the LPWANs technologies, LoRa has gained much more popularity as it provides large network coverage with low deployment cost and power consumption [9].
Alternatively, IQRF technology has been introduced for the IoT commercial market [10]. IQRF is a cost-effective IoT wireless technology that enables low-power connectivity. Its efficiency in IoT applications has been addressed by many studies in the literature [11,12,13,14,15,16]. Additionally, its usability in smart city applications is discussed by evaluating its network coverage performance in outdoor environments [17]. Overall, from the results achieved from these studies, it can be inferred that IQRF can be used in many IoT solutions without a doubt of its effectiveness. Here, it is important to note that the coverage provided by IQRF in outdoor environments is relatively inferior when compared to LoRa. Nevertheless, it is still possible to compensate for this concern with the help of IQRF mesh network topology (IQMESH).
On the other hand, in recent years, the demands on smart buildings have increased around the world, as it offers an environment where people can live more securely and comfortably. The concept of smart buildings has become more intelligent because of the growing developments in the IoT based on the use of WSNs. For such networks, choosing a proper IoT technology enabling low-power consumption and wide network coverage is a key issue that needs to be addressed in order to realize smart building applications. In this context, IQRF appears to be one of the reasonable IoT technologies due to its efficiency in terms of low-power connectivity. However, in order to realize smart building applications using IQRF, the characteristics of IQRF links in indoor environments need to be comprehensively studied. In the literature, only a few studies that focus on the deployment of IQRF networks in indoor scenarios have been presented. In [18], the operability and stability of the IQRF mesh topology in an indoor scenario are analysed using the measured Received Signal Strength Indicator (RSSI) values. The presented results show that IQRF performs well in terms of communication range, sensitivity, and power management. In [19], the RSSI values of an IQRF network are measured in a multi-floor building. Instead of evaluating the communication range performance of IQRF, the main efforts are directed at the measurements of the packet transmission delay and the RSSI by varying the number of walls/ceilings. The obtained results show that the stability of the IQRF network is directly affected by the transmission power. In [20], experimental measurements using IQRF nodes and simulations are performed by considering both indoor and outdoor scenarios in order to evaluate the performance of IQRF in terms of communication parameters, including range, network latency, and convergence. For indoor cases, measurements are performed in a room that is divided into grids with specific spacing to build a peer-to-peer (P2P) network. From the indoor measurements based on the RSSI values, it is concluded that IQRF provides good signal coverage in a typical indoor room consisting of multiple walls.
As can be deduced from the discussion above, propagation modelling techniques to achieve the accurate deployment of IQRF networks in indoor environments have not been studied in the literature yet. However, it is necessary to comprehensively analyse the propagation impairments that might affect the IQRF links. It is widely known that one of the most significant propagation impairments that can be considered is path loss (PL) [21]. Basically, path loss defines the variation in the received signal power over the distance between the transmitter (Tx) and receiver (Rx). Inevitably, the environment in which the sensor network is planned to be deployed highly affects path loss. For this reason, the environmental conditions that might influence path loss are often taken into consideration. Thus, accurate path loss modelling is strictly required in the deployment of the IQRF network in indoor environments in order to predict the transmission range (network coverage) and performance.
This study aims to describe some preliminary propagation measurements that can be used to build WSN based on IQRF technology in an indoor environment. To this end, first, the propagation measurements were carried out in an indoor environment at 868 MHz through the IQRF transceivers (TRs). In the measurements, two different measurement scenarios are used within the context of a P2P configured system. In the first scenario, IQRF TRs were assumed to be connected to each other in the same corridor of a building in a Line-of-Sight (LoS) link. In the second scenario, a simple Non-Line-of-Sight (NLoS) link was built by considering a single knife-edge link where IQRF TRs were assumed to be connected to each other at two perpendicular corridors. Then, for the sake of simplicity, well-known empirical path loss models, namely the Log-distance, ITU, and WINNER II, were accounted for, and their prediction accuracies were assessed by comparing the predicted and measured PL values. From the comparison results, the empirical PL models that fit the measurements with more prediction accuracy were proposed to be used for the deployment of IQRF networks in the considered indoor environments. To the best of our knowledge, this is the first study that provides the assessment of popular empirical path loss models for IQRF links in an indoor environment.
The structure of this article is organized as follows. Section 2 discusses empirical PL models that are compared with the IQRF-obtained PL models for IQRF network deployment in the indoor environment. The experimental setup and the measurements are described in Section 3. The measurement results and their analyses are then presented in Section 4. The article is concluded in Section 5.

2. Empirical Path Loss Models

In the following, we briefly discuss various well-known empirical path loss models for indoor propagation to be compared with the IQRF path loss model.

2.1. Free-Space Model

The free-space path loss (FSPL) model is a fundamental way t estimate the losses over the link. In this model, the antennas for both transmitting and receiving purposes are considered to be located in an open area where no obstacles or reflecting surfaces exist. Therefore, the path loss is simply calculated by [22]
L FS ( D , f ) [ d B ] = 32.44 + 20 log ( D ) + 20 log ( f )
where D is the separation distance between Tx and Rx in km and f represents the frequency in MHz.

2.2. Log-Distance Model

The log-distance is a widely used path loss model that can be expressed as
P L LG ( d ) [ dB ] = L ( d 0 ) [ dB ] + 10 n log d d 0
where n is the path loss exponent depending upon the surroundings and the type of the building, L ( d 0 ) is the path loss at a reference distance d 0 in meters, and d is the separation distance between the transmitter (Tx) and the receiver (Rx) in meters. The path loss value can be varied because of multi-path effects. In order to consider these effects, Equation (2) can be enhanced as follows
P L LG ( d ) [ dB ] = L ( d 0 ) [ dB ] + 10 n log d d 0 + X σ
where X σ denotes a zero-mean Gaussian random variable with standard deviation σ expressed in the dB scale. It generally represents the shadowing effects, as discussed in [23]. Moreover, the parameters L ( d 0 ) and n given in Equation (3) can be roughly calculated by linear regression of the measurements, whereas parameter σ ( d B ) can be defined from experiments by
σ ( dB ) = i = 1 N ( L m e a s ( i ) L p r e d ( i ) ) 2 N
where L m e a s ( i ) is the measured average path loss while L p r e d ( i ) is the predicted average path loss value at point i. Moreover, the total number of path loss samples is represented by N [24].

2.3. ITU-R P.1238-9 Model

In the ITU-R Recommendation Series P.1238-9 indoor propagation model [25,26], the path loss is estimated within a closed area inside a building delimited by walls. This model is applicable only to the indoor environment with a coverage frequency range of 300 MHz to 100 GHz. It approximates the total path loss an indoor link may experience. Mathematically, the approximation of the ITU-R P.1238-9 path loss model is expressed as
P L ITU ( d ) [ dB ] = 20 log ( f ) + N log ( d ) + L f 28
where d is the separation distance between the Tx and Rx in meters, f is the frequency in MHz, N is the distance power loss coefficient for both office and commercial areas, and L f is the floor penetration loss factor, which varies with frequency, type of floor, and the number of floors. Table 1 lists the parametric values of N and L f for the ITU-R P.1238-9 model. Using three different configurations of the ITU-R P.1238-9 model, we derive three different models that we call ITU-1, ITU-2, and ITU-3. These models are compared with the IQRF-obtained PL models.

2.4. WINNERII Model

In the WINNERII model [27,28], the path loss is estimated by
P L WINNERII ( d ) [ dB ] = A log ( d ) + B + C log F 5 + X
where d is the separation distance between the Tx and Rx in meters, F is the frequency in GHz, A is the path loss exponent, B is the intercept, C is a parameter dependent on the frequency, and X is a parameter specific to the WINNERII NLoS for a corridor-room and heavy walls environment ( W - NLoS corridor ). Table 2 describes the parametric values of the WINNERII model in two scenarios, W−LoS and W - NLoS corridor . Similarly, based on the two scenarios, W−LoS and W - NLoS corridor , we give two names that we call: WINNERII-1 and WINNERII-2, respectively. As presented in Table 2, the value of C is taken to be 20 dB for both scenarios. Moreover, the corresponding values of A and B are also mentioned. Our propagation measurements are performed in a corridor with heavy walls. For this reason, the value of X is calculated using the relation in the table where n w is the number of walls.

3. Measurement Campaigns

In order to comparatively assess the prediction accuracy of the popular empirical path loss models to be used for the deployment of the IQRF networks in specific indoor environments, various propagation measurements are performed. The details of the measurement setup and the scenarios are described in the following sections.

3.1. Measurement Scenarios and Methodology

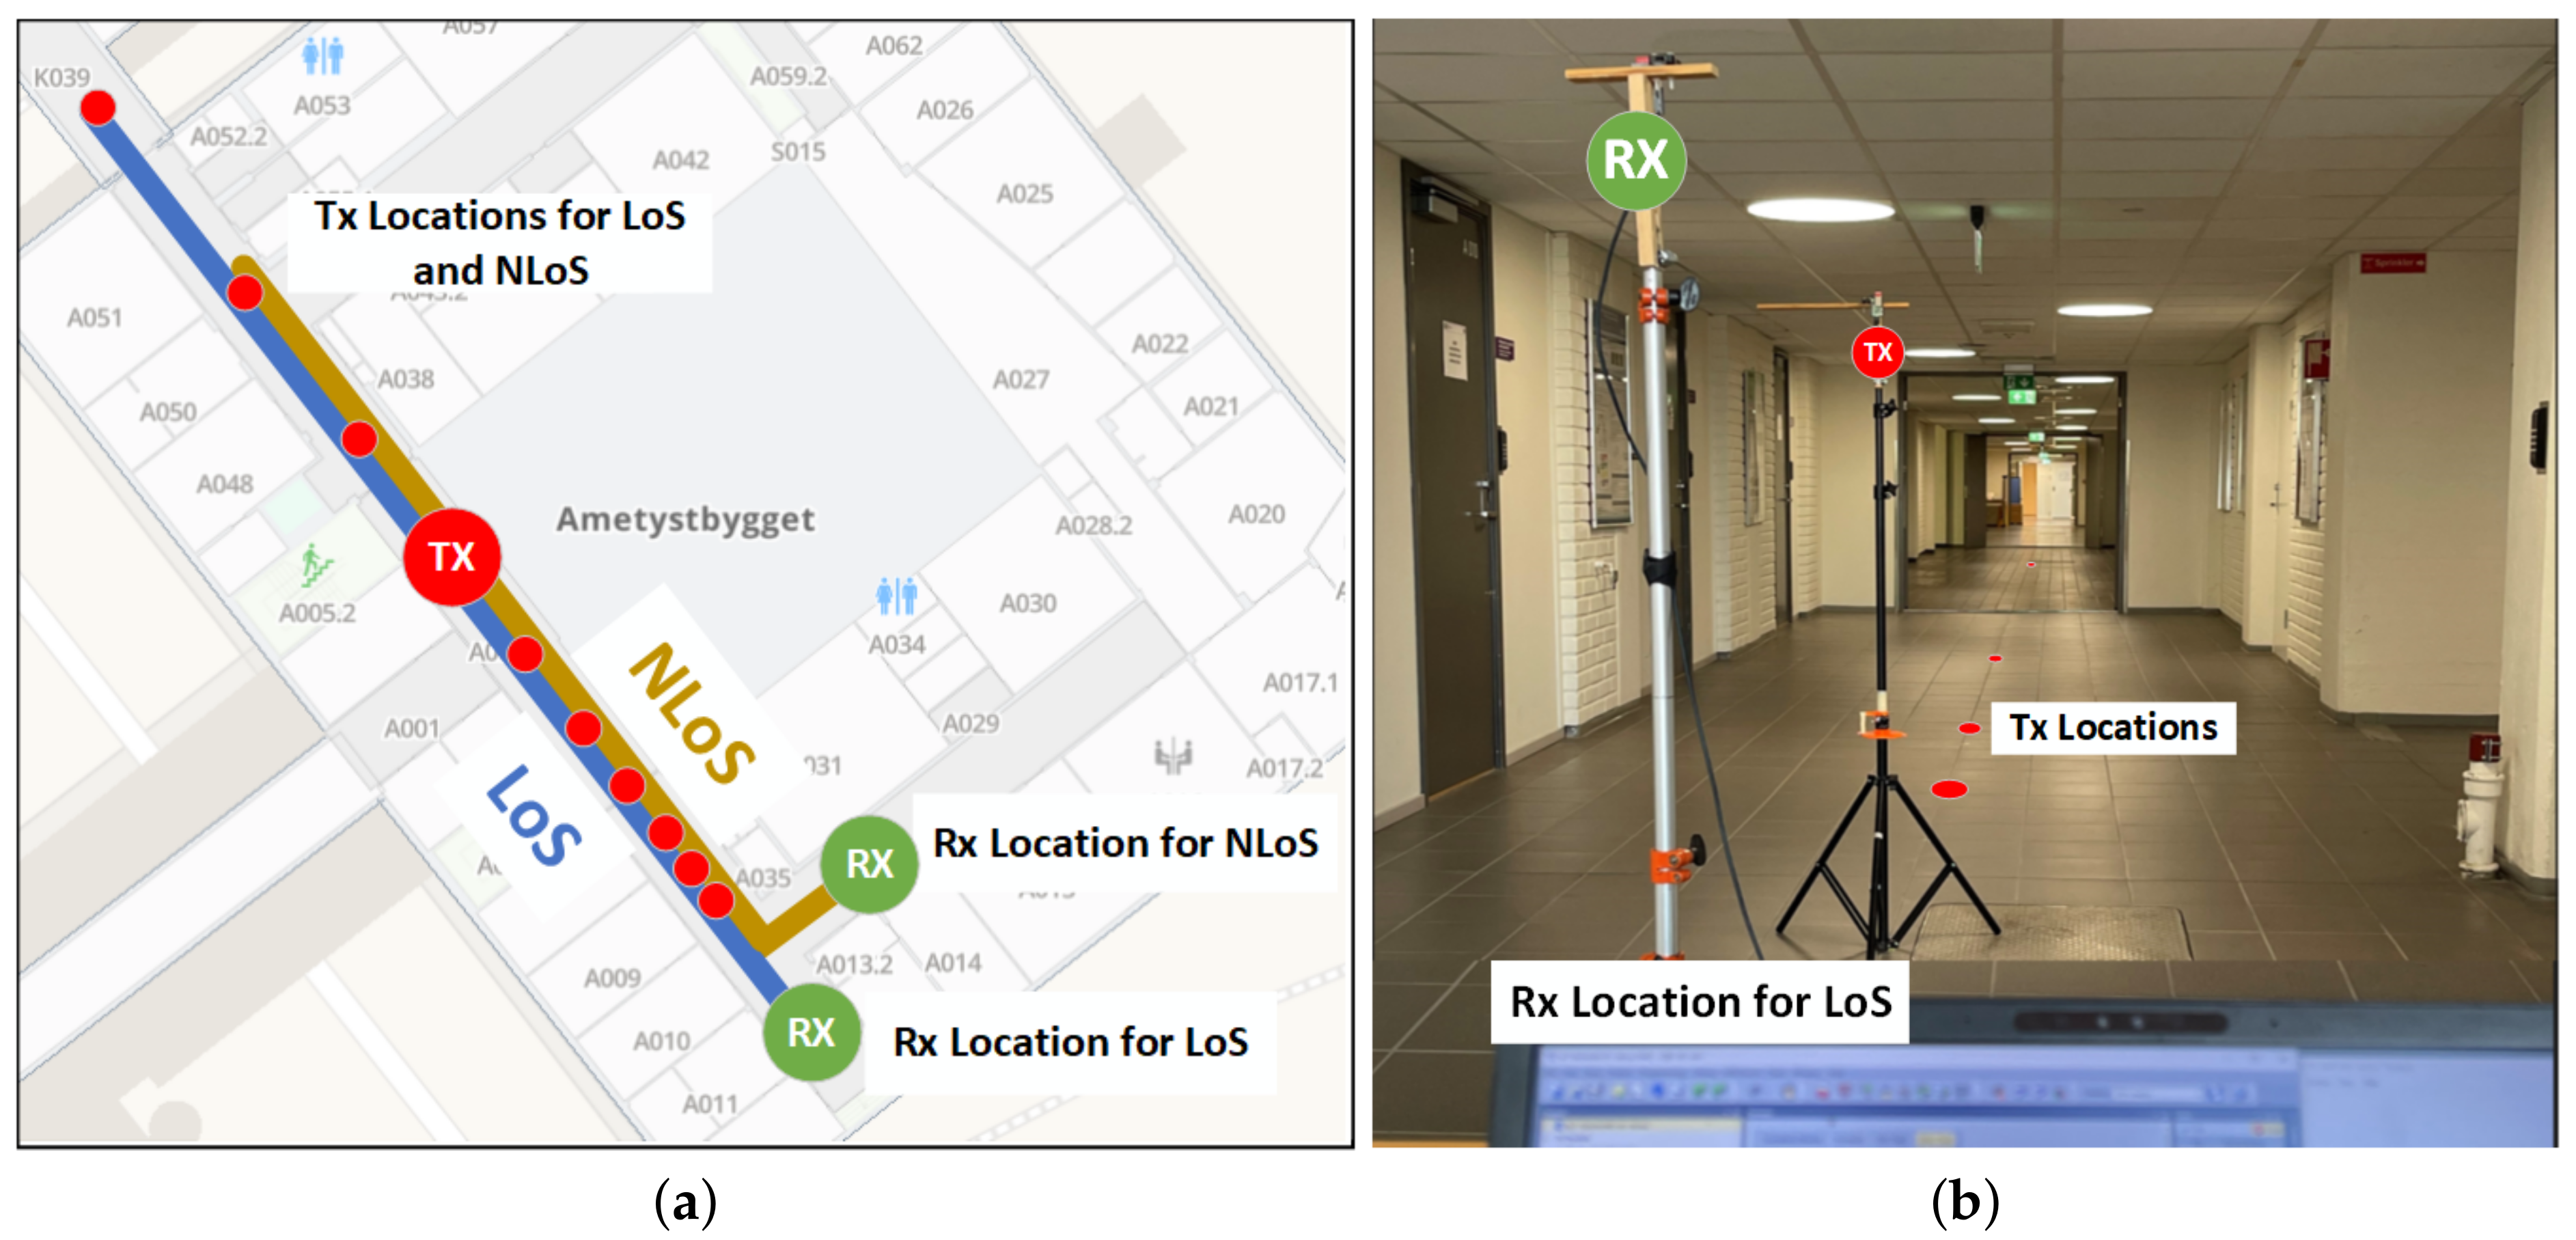
WSNs enable the physical world to be controlled and monitored. For instance, in an indoor environment, such as a home or a commercial building, modern equipment is used to improve indoor infrastructure resources management, such as heating, lighting, etc., together with sensors that provide feedback to the users. In this study, we consider two different indoor scenarios, LoS and NLoS, that lead to two different radio links, as depicted in Figure 1a. Figure 1b shows the environment where the measurements are performed. The two radio links are described in the following subsections.

3.1.1. Scenario I-Line-of-Sight (LoS) Link

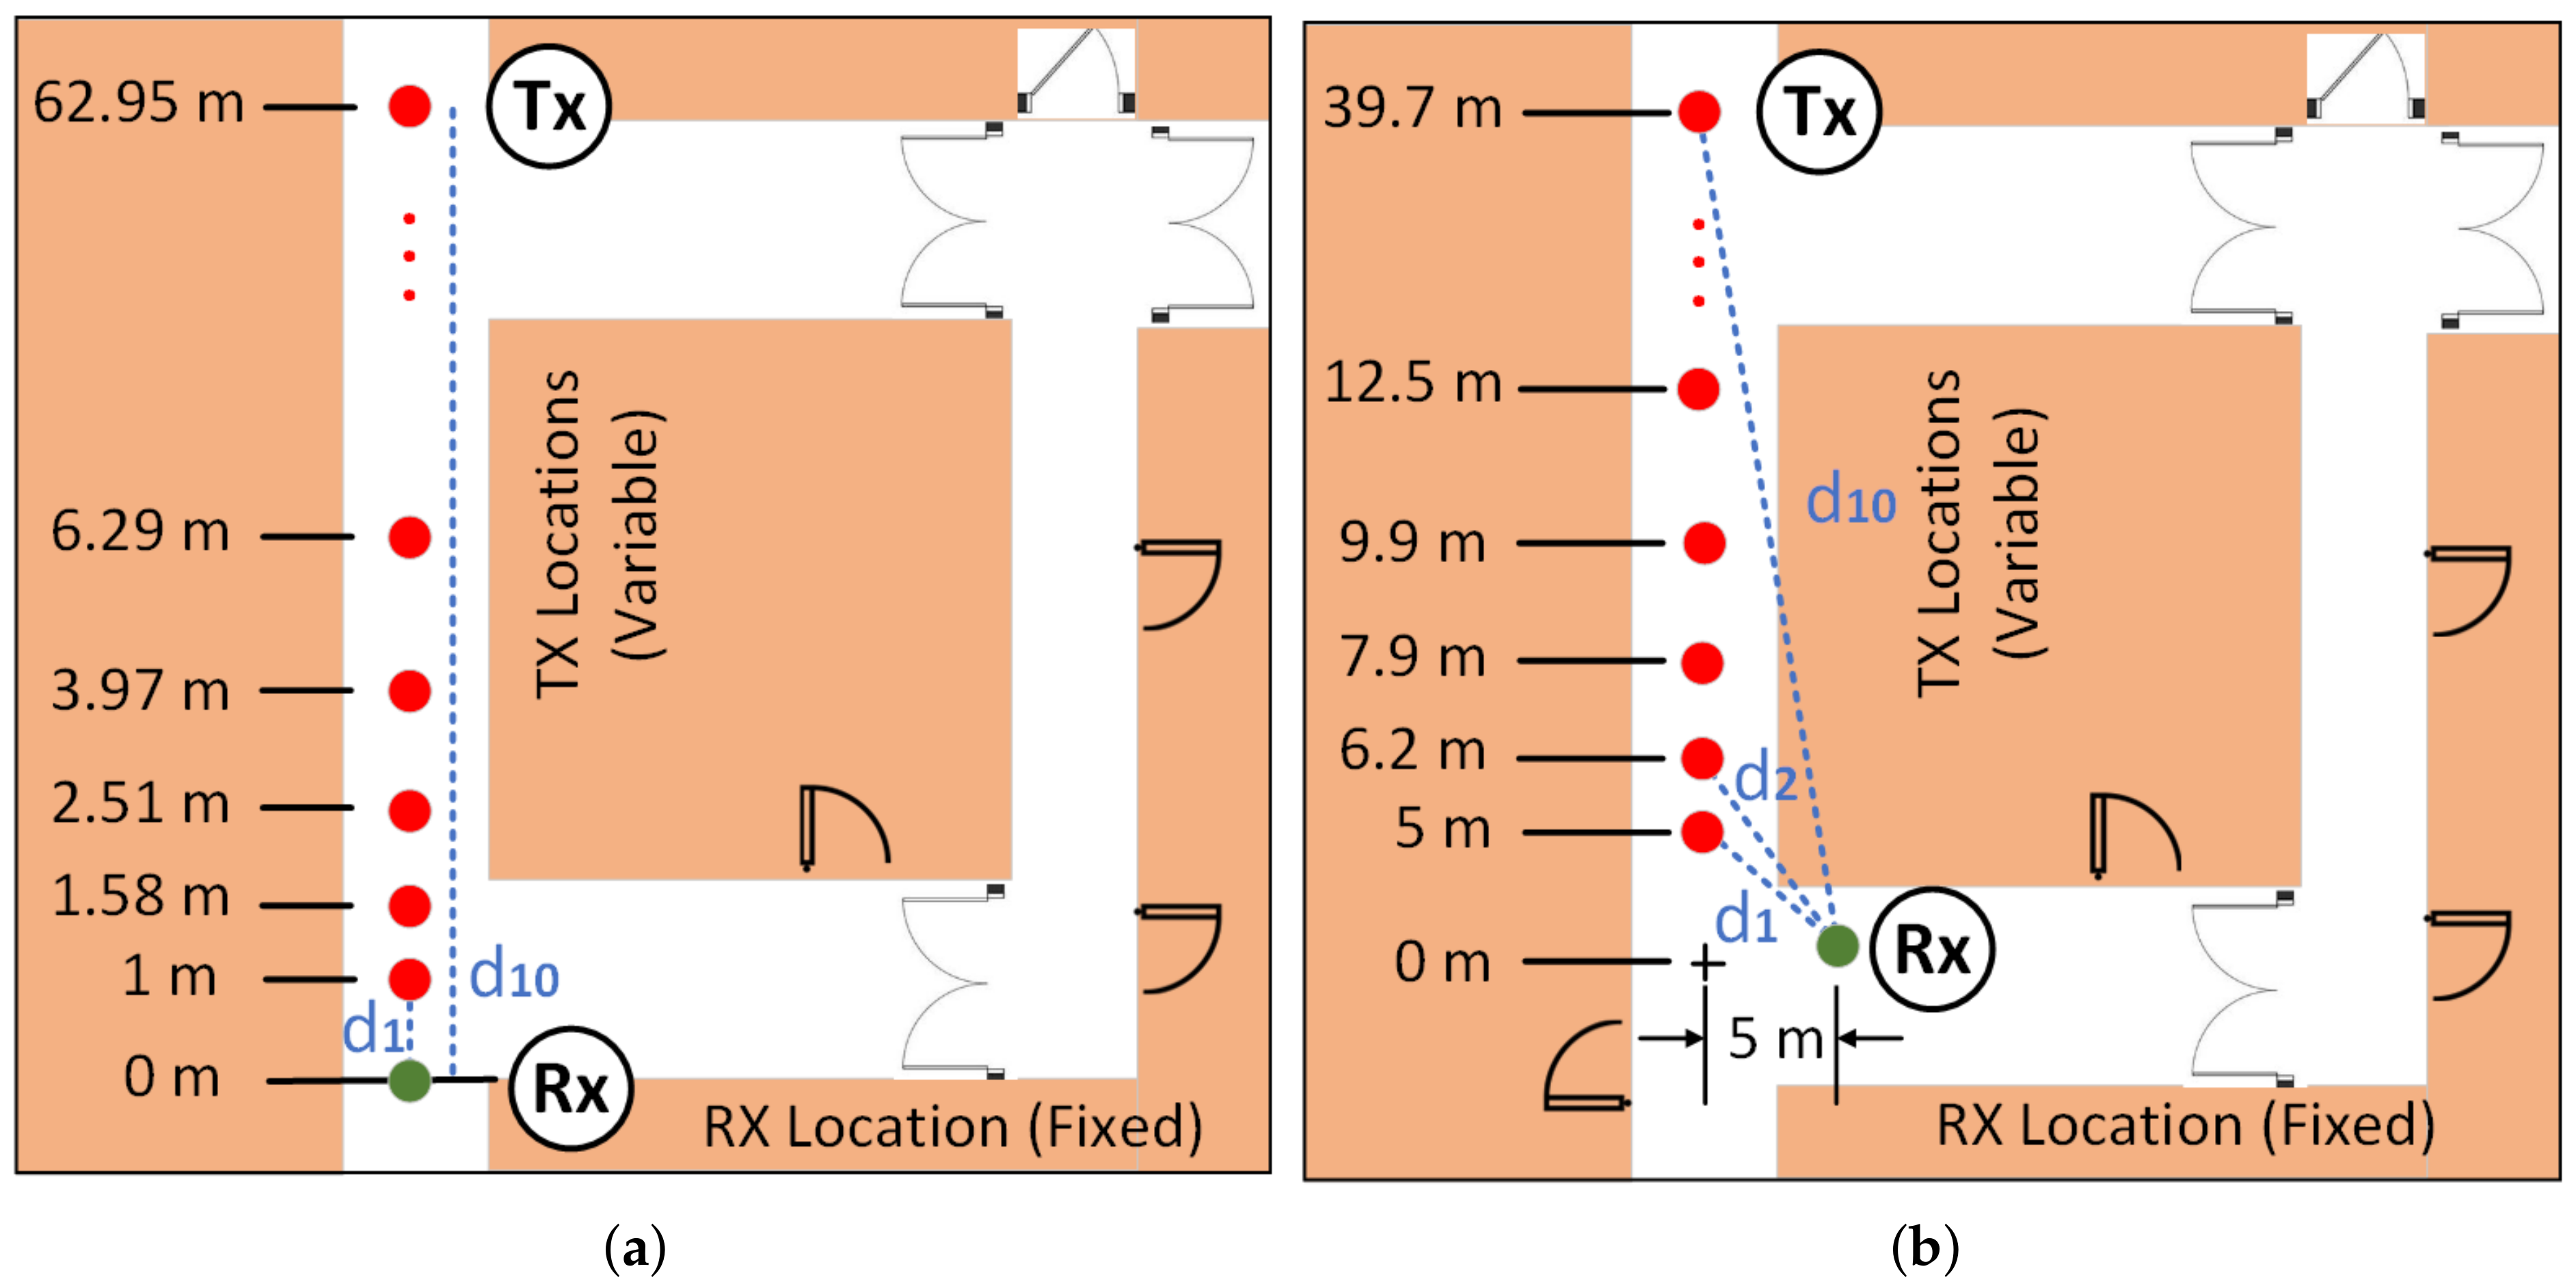
In this scenario, it is assumed that the Tx and Rx are placed on the same straight section of a single corridor of a building. In Figure 2a, the locations of the Tx and Rx and the measurement environment are depicted. In this scenario, d i represents the Tx-Rx separation distance. The logarithmic values of distances d i at reference distance d 0 = 1 m are presented in Table 3. Notably, there are partitions that may be moved, such as chairs, boxes, lockers, doors, etc., and which do not span to the ceiling, although the TRs are placed in the same corridor.

3.1.2. Scenario II—Non-Line-of-Sight (NLoS) Link

In this scenario, the Tx and Rx used in the measurements are placed in the corridors that intersect each other. For this scenario, it is considered that the radio signal transmitted from the Tx reaches the Rx through a single-knife link. Figure 2b illustrates the locations of the Tx and Rx and the measurement environment. In this figure, d i represents the shortest distance between the Tx and Rx in meters, which is calculated using Pythagoras’ theorem. In this scenario, the logarithmic values of distances d i at reference distance d 0 = 5 m are presented in Table 4.
It is worth mentioning that the Tx-Rx separation distance is varied logarithmically on site when the measurements are performed, as shown in Figure 2a,b. The reason behind this choice is that when a linear Tx-Rx separation distance is used, the measured data of the far locations from the Rx will statistically have more weight in deciding the PL model tendency as the Signal to Noise Ratio (SNR) is lower at these locations. In other words, as the power decreases logarithmically, the use of a linear scale in Tx-Rx separation distance will not give the best reconstruction of the curve for the power versus the distance. Moreover, although actual sensors provide a cost-effective mechanism to measure the received signal, they are, at the same time, less precise and more sensitive to background noise, calibration and to some other factors compared to specialised equipment, such as spectrum analysers [29]. Thus, the closest locations (samples) to the Rx are the most important to consider, as the SNR is higher at these locations. Finally, for practical reasons, the Rx stand is stationary in all scenarios while the Tx stand is moving, as shown in Figure 2a,b.

3.2. Measurement Setup

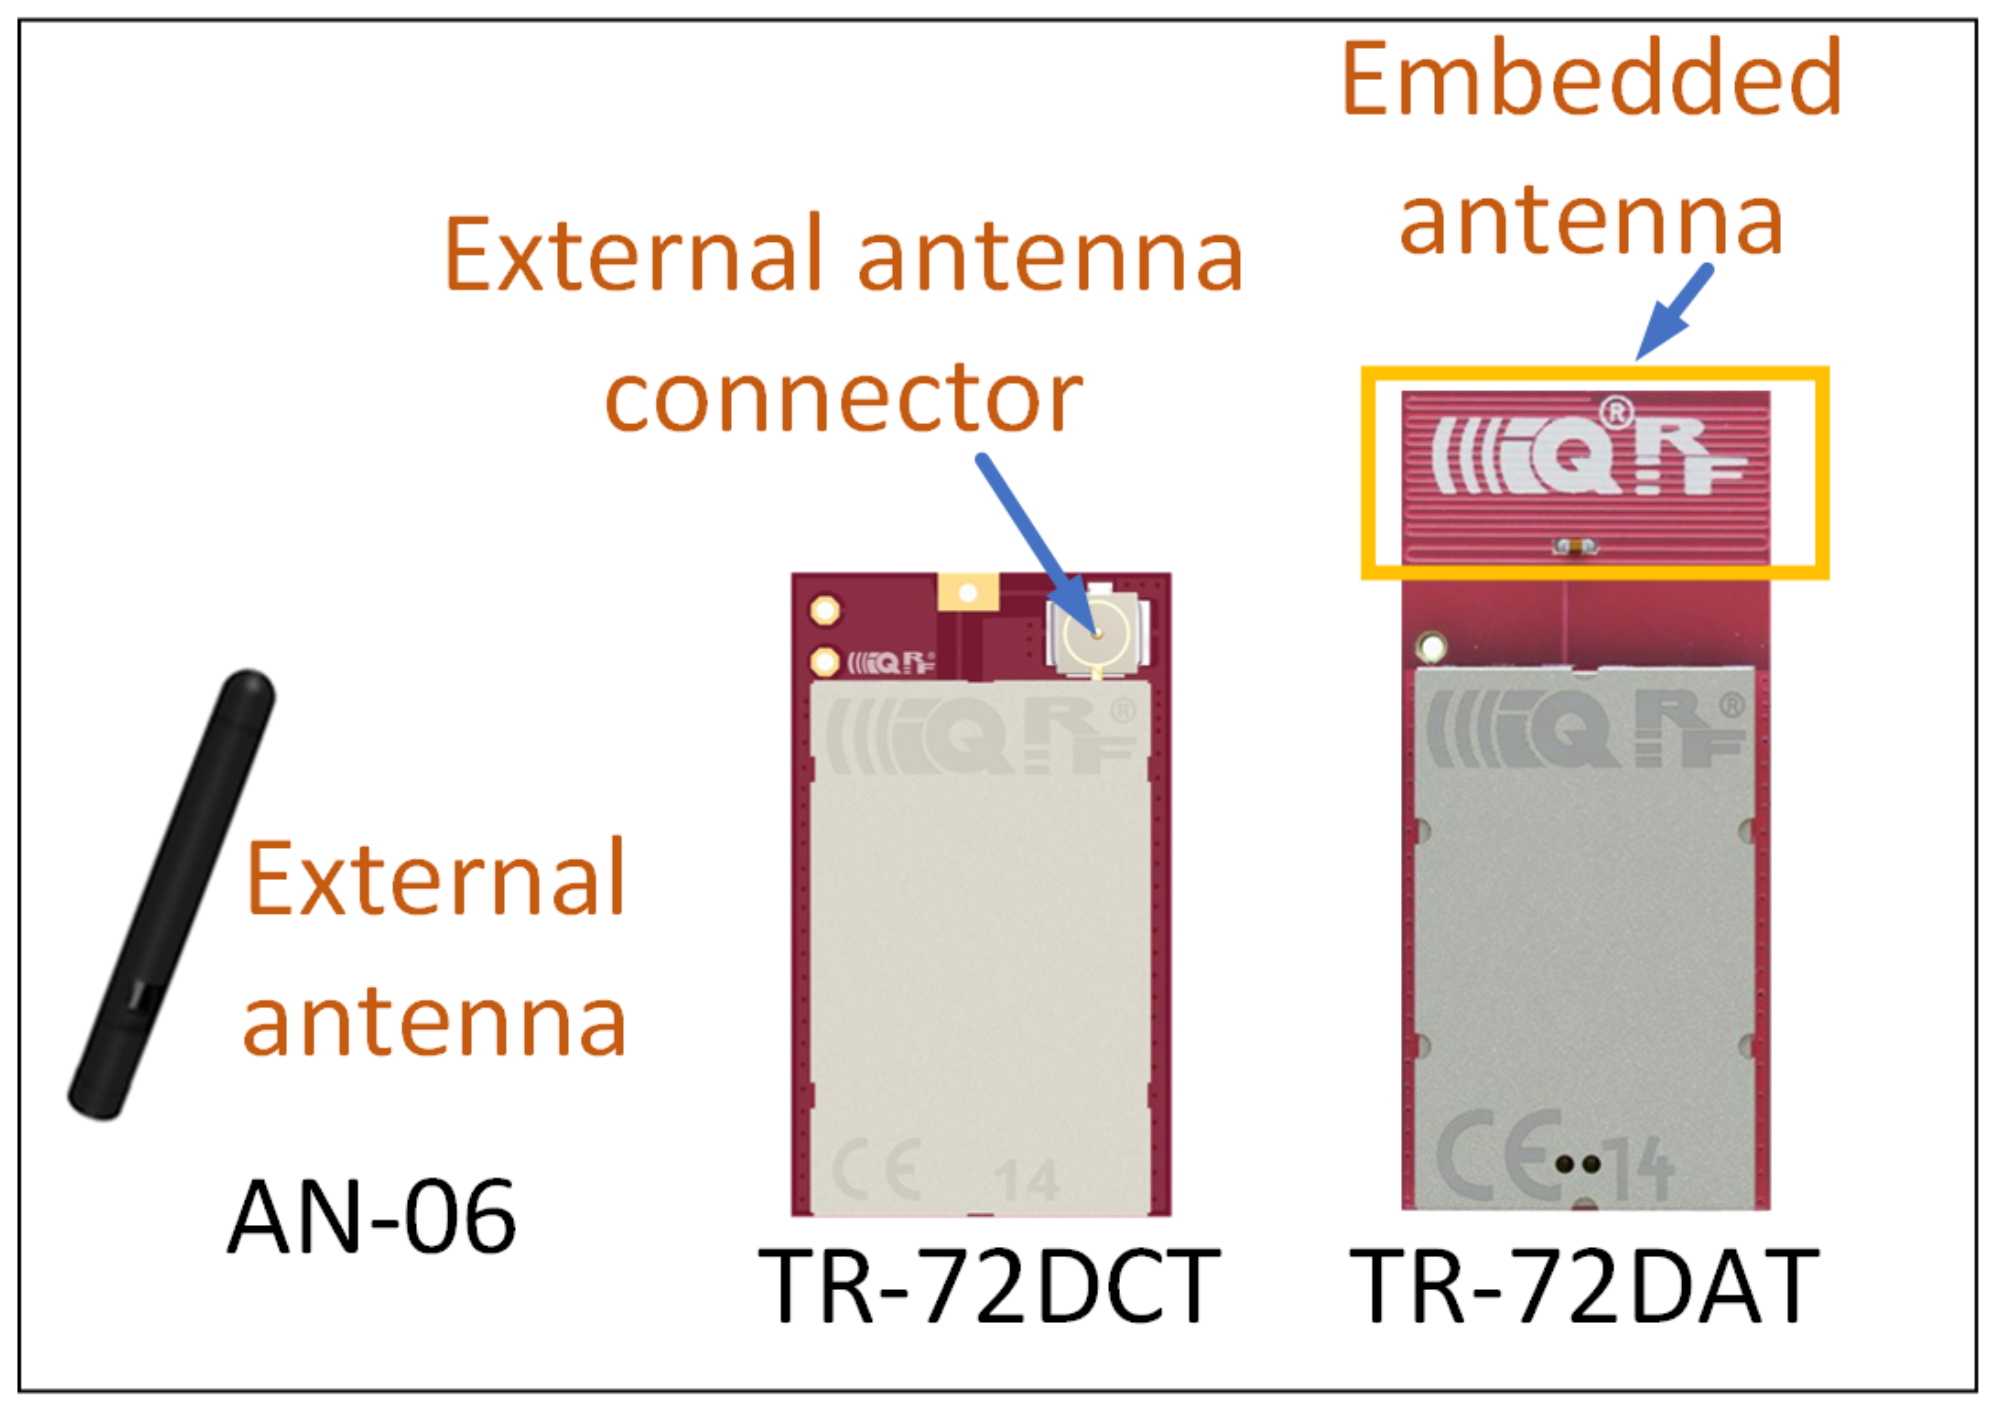
In the measurements, two types of IQRF TRs are used. One comprises a Meander Line Antenna (MLA) embedded on the Printed Circuit Board (PCB) of the TR itself, which requires no external components. We call this type a TR with an embedded antenna. The second type comes with a connector to connect an external Straight-Line Dipole Antenna (SLDA). We call this type a TR with an external antenna. In Figure 3, both types of TRs are depicted.
For a simple network (setup) implementation, a P2P topology is decided to be used in the measurements. In this network, one TR is configured as Tx, which continuously transmits packets, while the other TR is configured as Rx, receiving the packets. The same topology is used for both LoS and NLoS scenarios. Moreover, both Tx and Rx antennas were placed 1.5 m from the ground. During the entire experiment, the Tx is configured to transmit one packet every 25 ms, thereby generating a sampling frequency of 40 packets/s, which is the maximum packet sending rate that could be reached. Each received packet in the Rx consists of the RSSI that indicates the signal strength of the last received packet. Moreover, the packet number is also provided to be used for packet loss calculation. Additionally, for each scenario, measurements are performed in two stages. In the first stage, the data are collected through the TRs with embedded antennas installed on both Tx and Rx sides. In the second stage, the TRs with an external antenna is used to collect the data. The number of locations for each scenario is fixed to 10 where the Tx-Rx separation distance is increasing logarithmically, as mentioned earlier. To reduce the multi-path effects and other variables due to environmental reflections and dynamics, 25 measurements (runs) were performed, resulting in 25 averaged data points at each Tx location. The used parameters and configurations are summarized in Table 5.

4. Results Analysis and Discussion

4.1. IQRF Path Loss Obtained Models

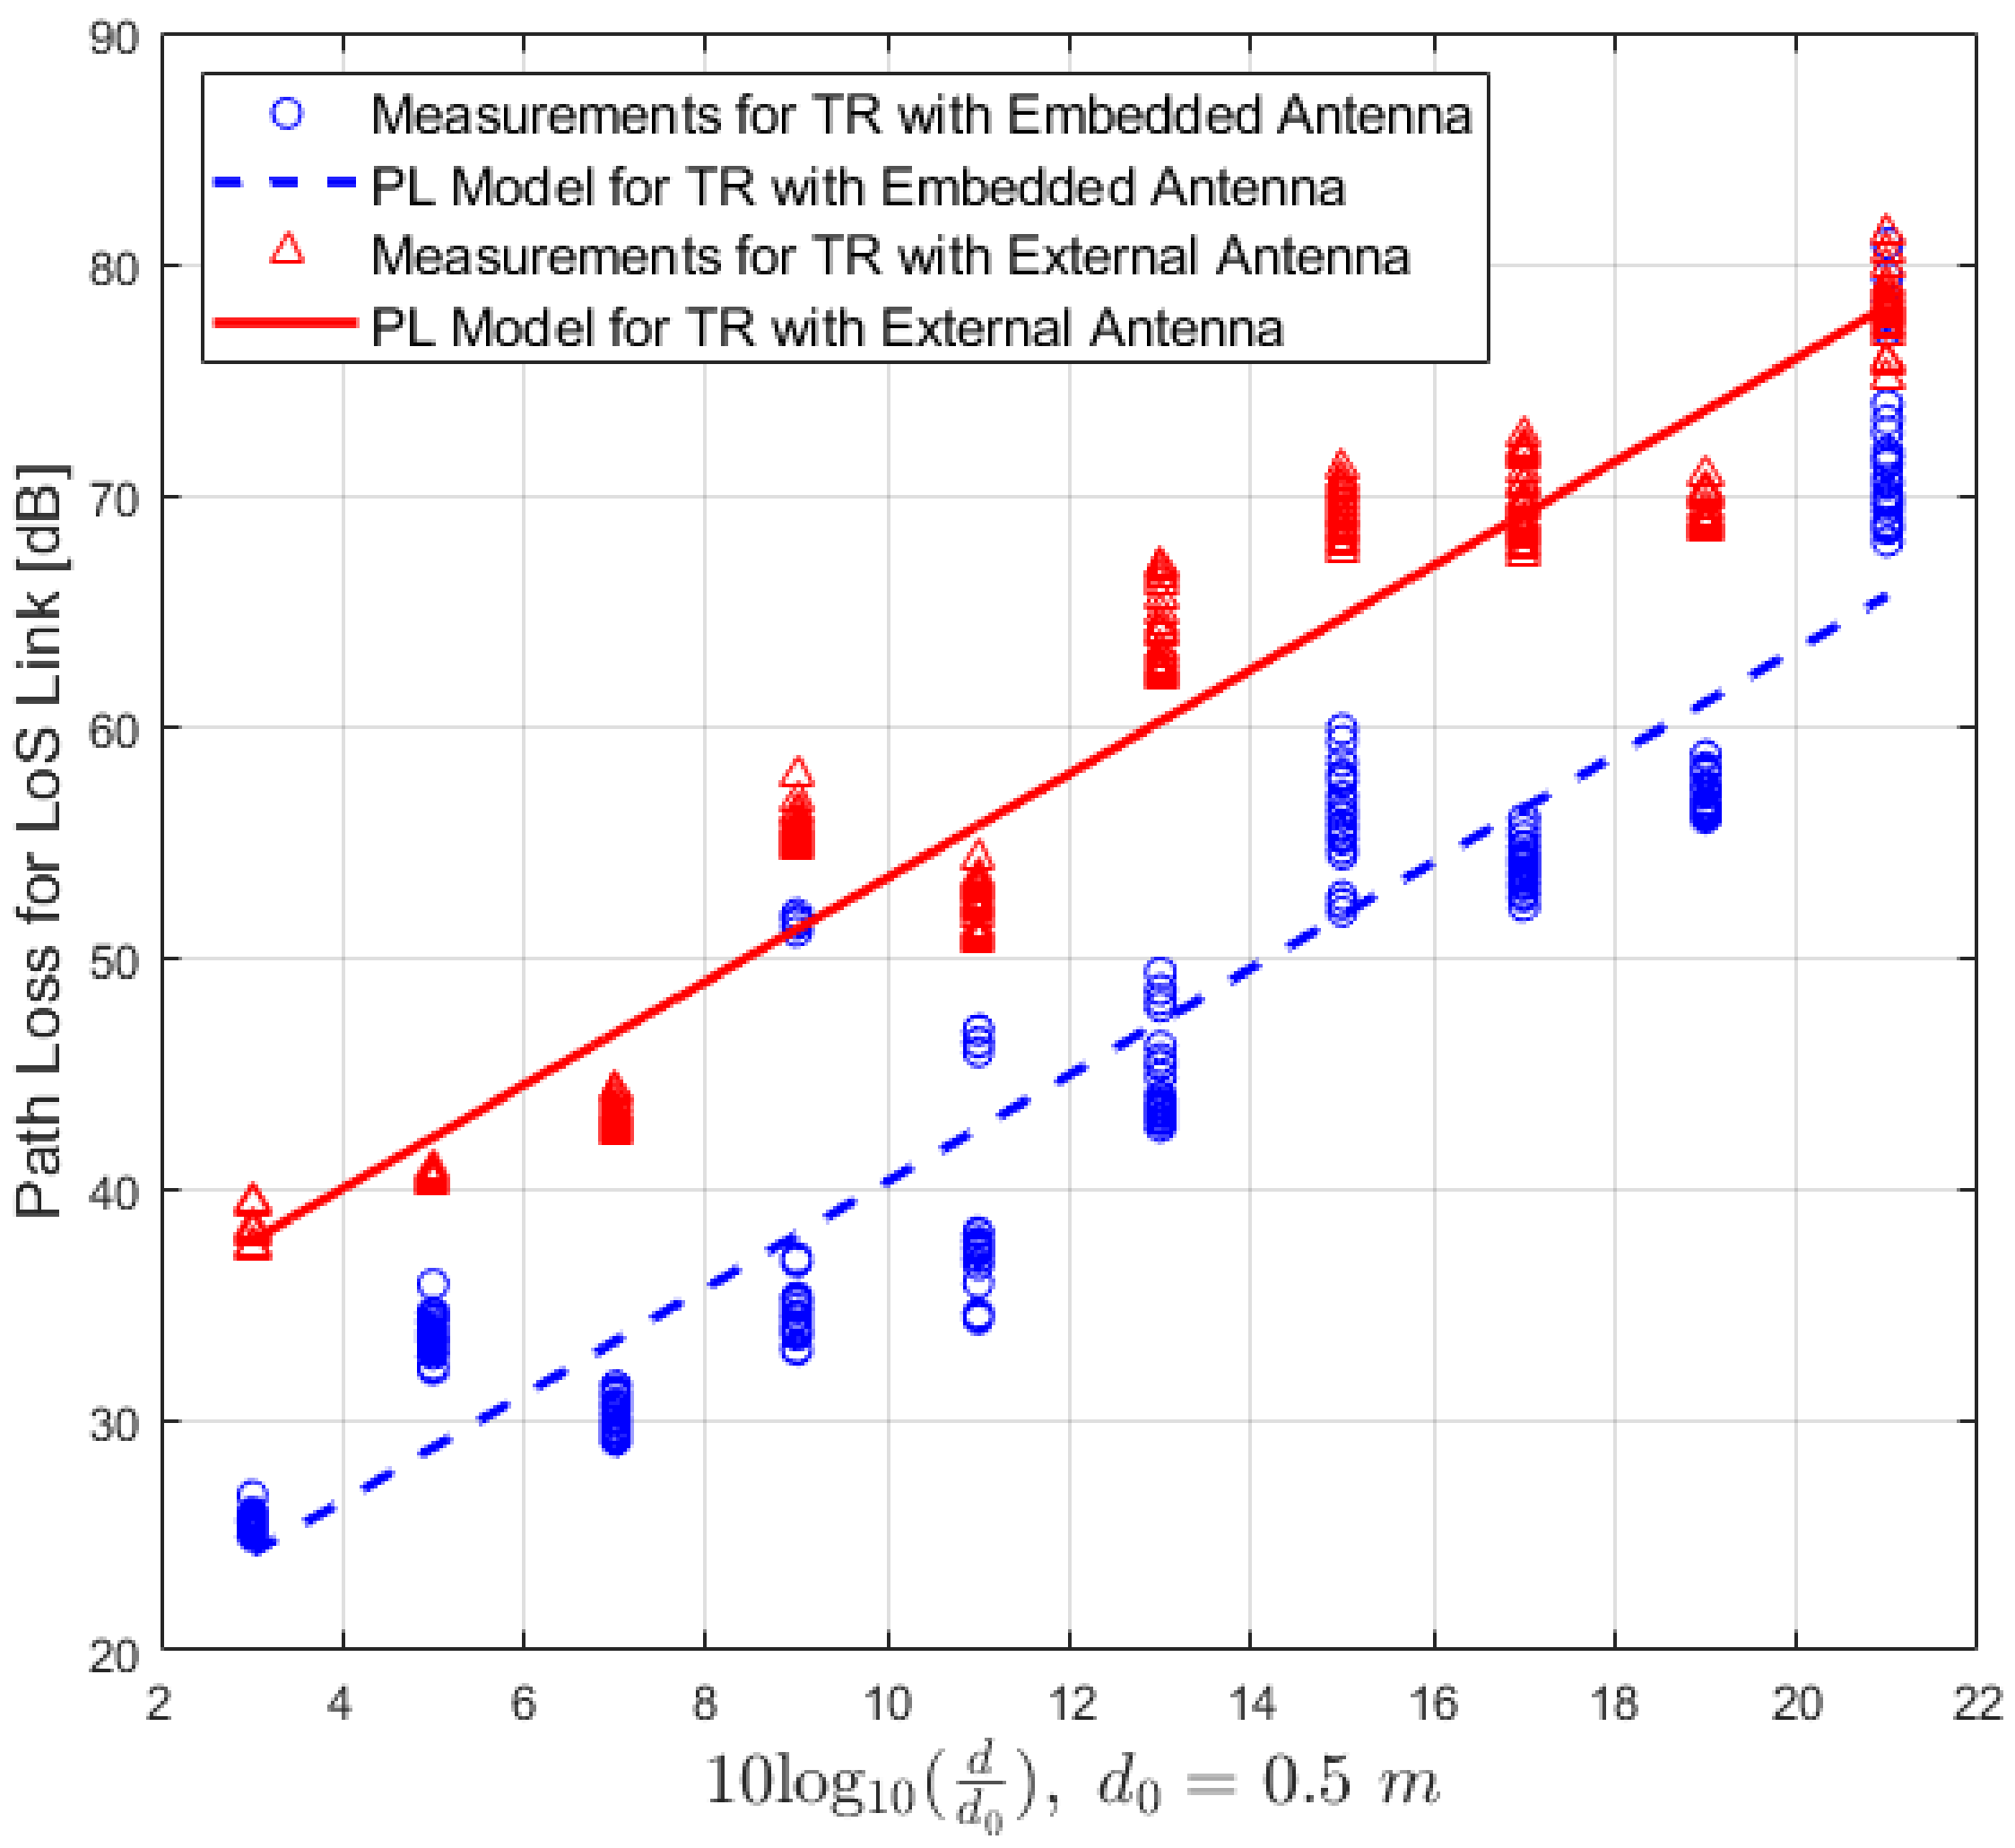
In order to study the performance of the IQRF network in the sub-GHz band in an indoor environment, we pay close attention to the characteristics of signal propagation in the wireless channel of this environment by exploring both LoS and NLoS scenarios. Therefore, the received signal is recorded from both IQRF TRs with embedded and external antennas and from the recorded data, the path loss is derived. The path loss of Equation (3) is estimated using
P L LG ( d ) ( d B ) = P Tx + G Tx + G Rx P Rx ( d ) .
where P Tx is the power of the transmitter, G Tx is the gain of the transmitter antenna, G Rx is the gain of the receiver antenna, and P Rx ( d ) is the measured received signal power. The obtained path loss values from Figure 4, together with the normalized log-distance are used as input in regression analysis to obtain the path loss models. The regression analysis of the data applied the least squares method (LSM), and the resulting models are presented in Figure 4 and Figure 5 for LoS and NLoS links, respectively. The Packet Delivery Ratio (PDR) for the measured data at each location is also calculated, and the PDR values for the corresponding scenarios, LoS and NLoS, are shown in Table 3 and Table 4, respectively. It is worth noting that the PDR is only used as an indication to validate the received data for path loss calculation, and it is not intended to be studied in this work. Hence, only values of the received power at the locations where the total number of successfully received packets is higher than 90 % are included in the path loss calculation. The obtained models’ regression parameters, such as path loss exponent (PE) n, losses L ( d 0 ) at a far-field reference distance d 0 ( d 0 = 0.5 m for LoS and d 0 = 5 m for NLoS), the correlation factor between measured and predicted values represented by R 2 , and finally, the fitting error ϵ for LoS and NLoS links, are presented in Table 6 and Table 7, respectively.
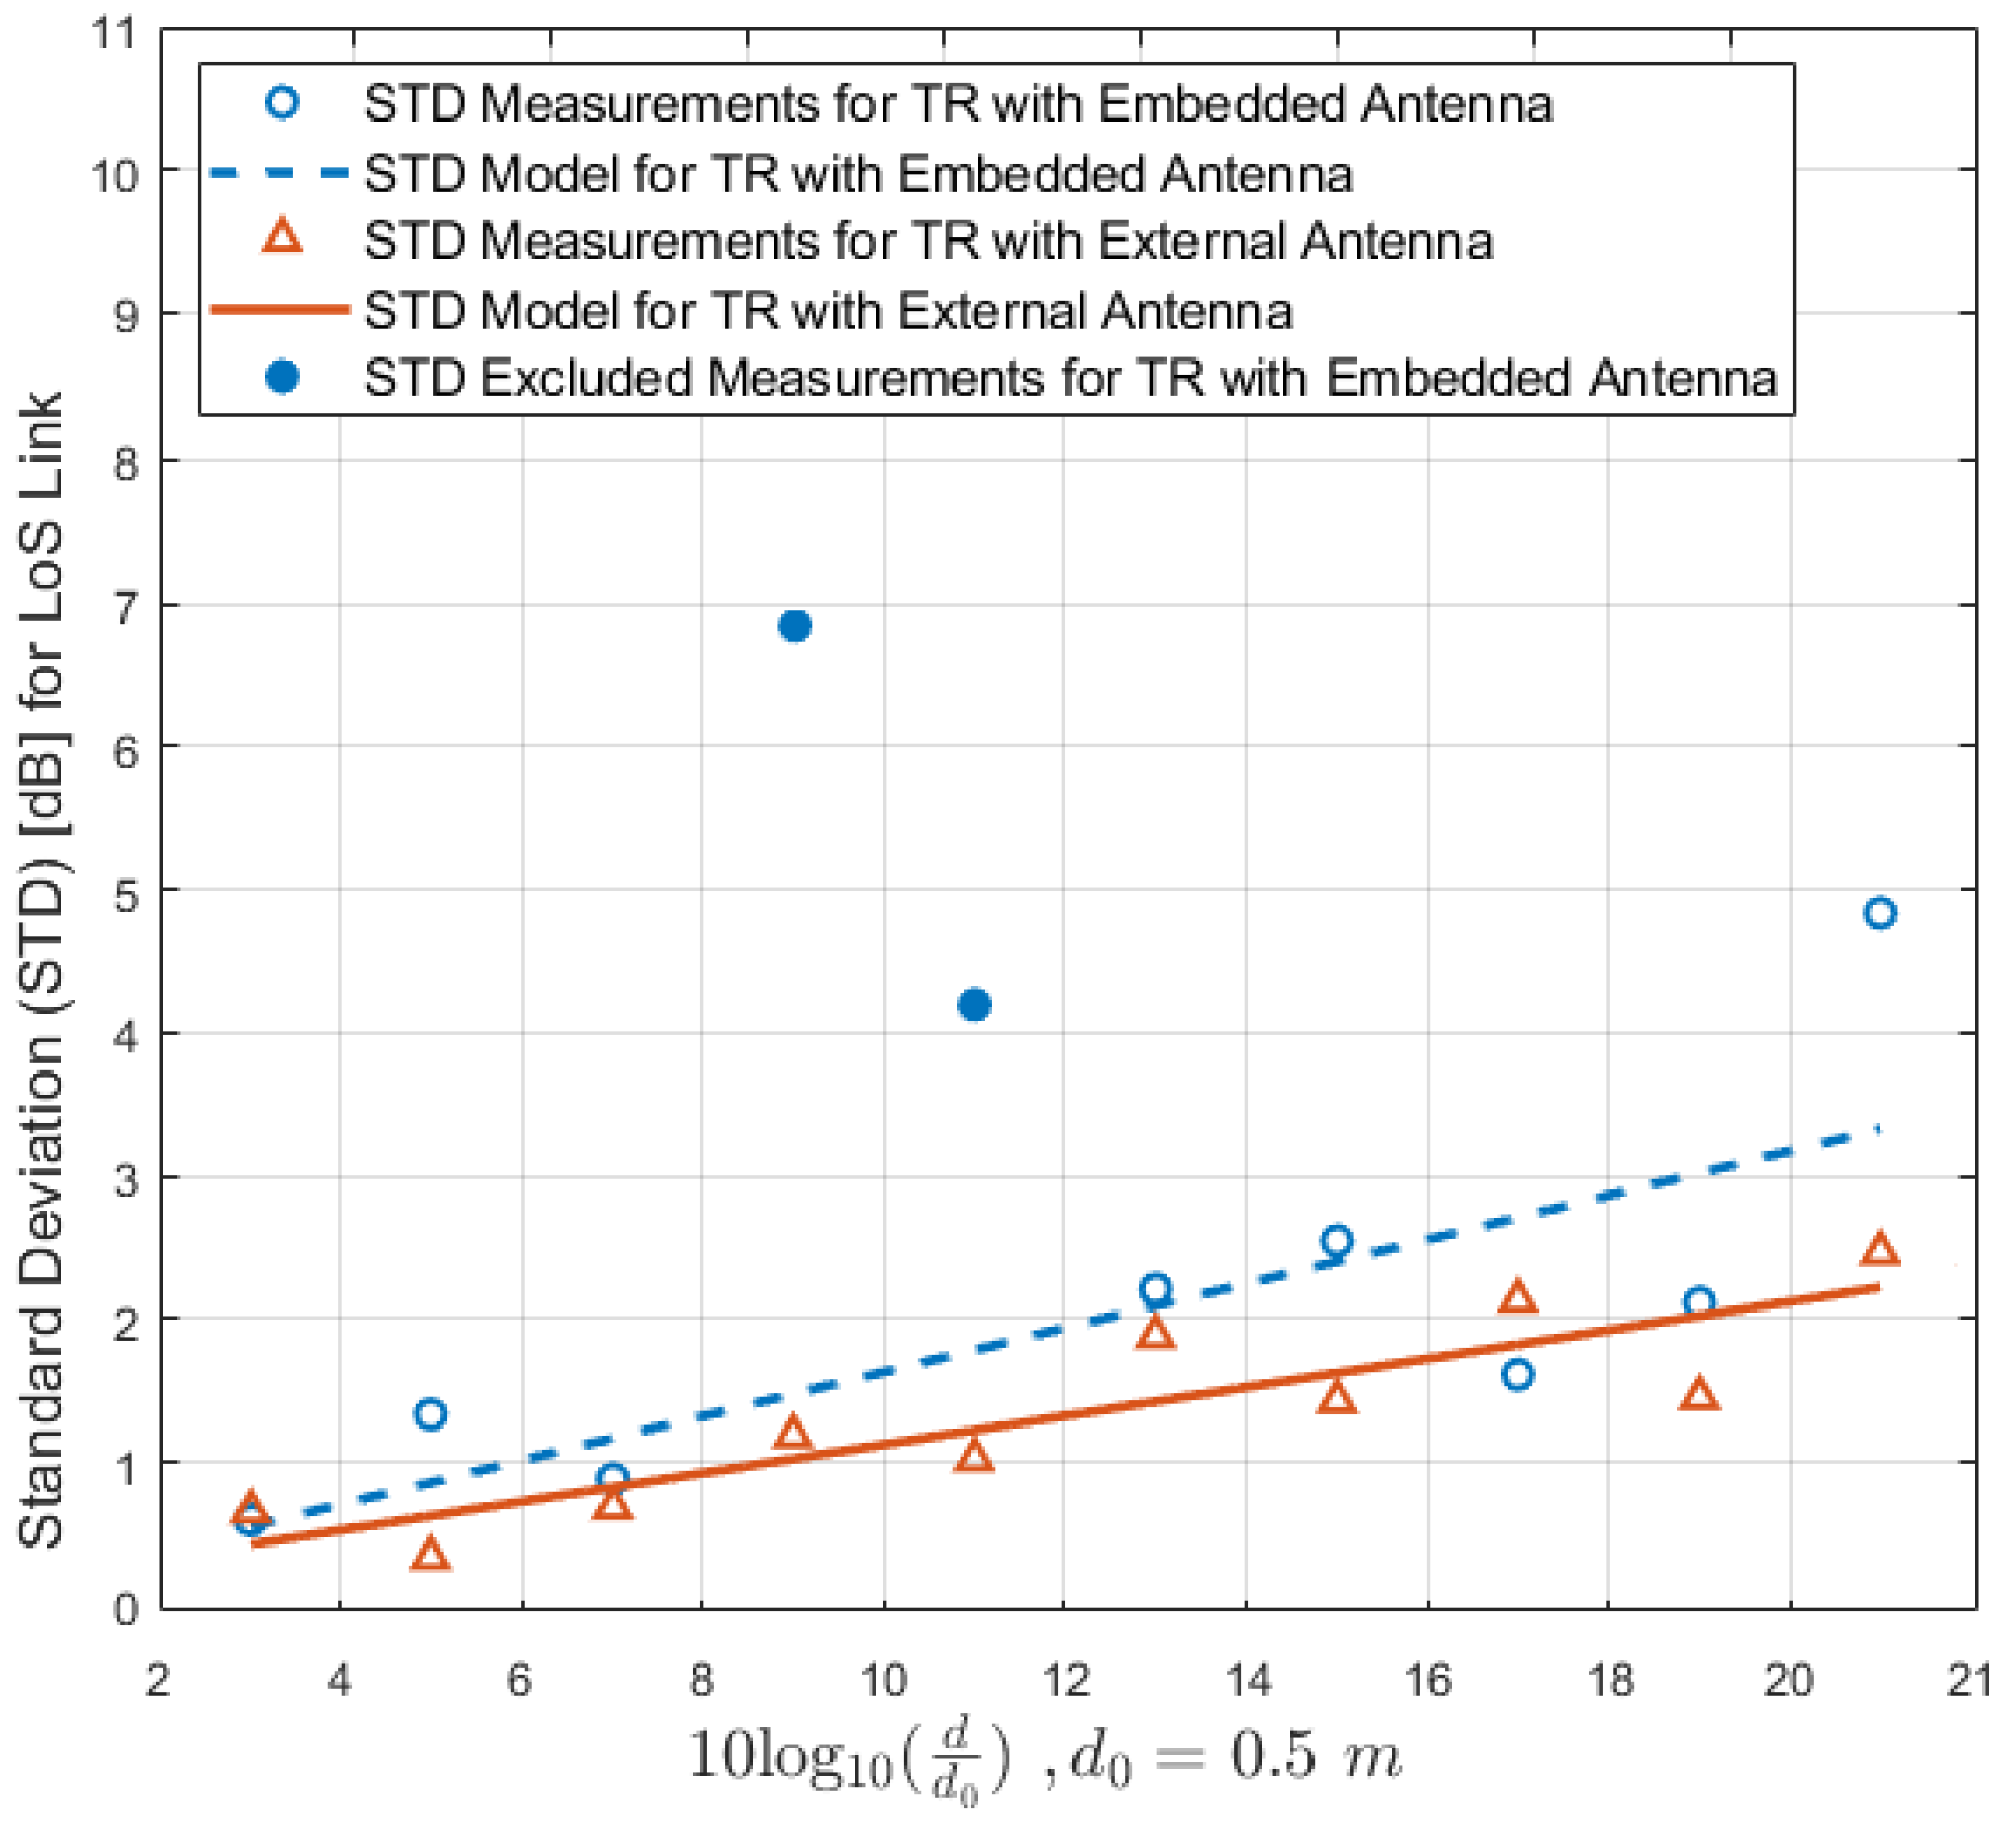
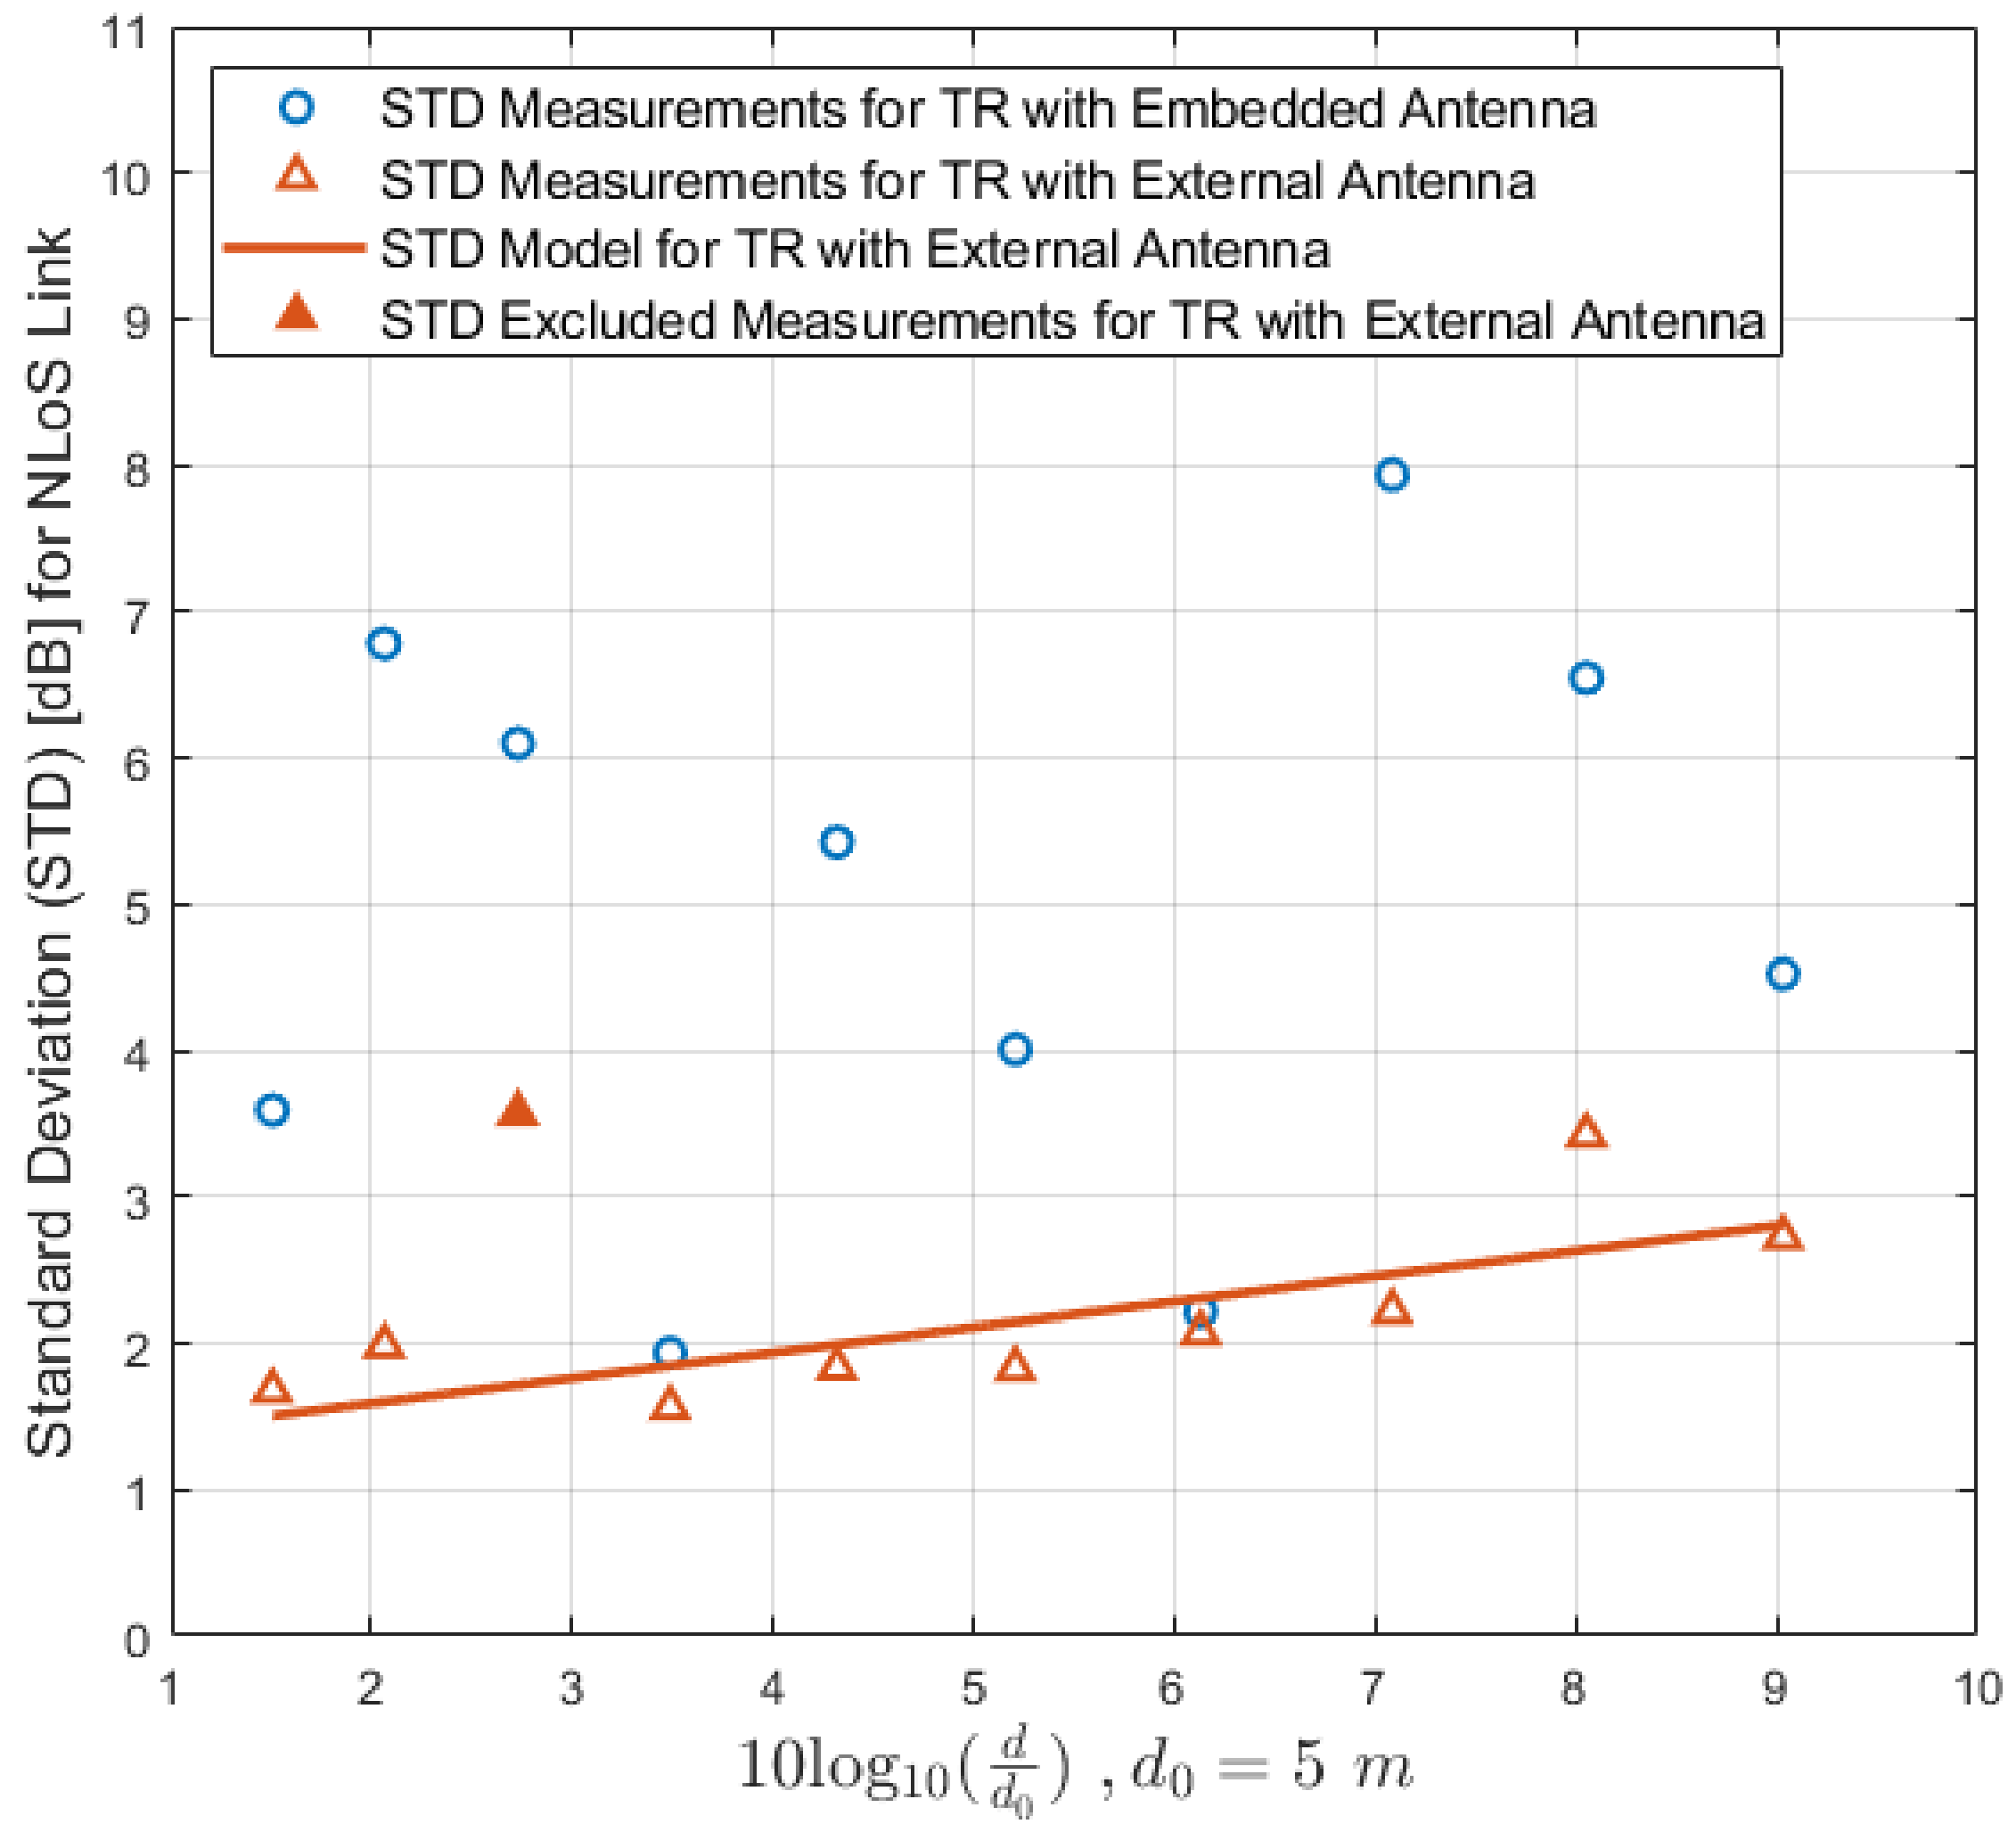
In addition, the standard deviation (STD) of the log-normal distribution X σ at each location is also calculated using the recorded raw data from both types of TRs in each scenario. Hence, four sets of STD data are obtained. In order to observe the changes in the STD versus the Tx-Rx separation distance, each set of the calculated STD data is fitted with a line using LSM. However, it is worth mentioning that the STD dataset values of the TR with an embedded antenna in the NLoS scenario are not fitted, as the correlation factor, in this case, will be very low for linear regression. Moreover, STD data values for locations 4 and 5 of TR with an embedded antenna in the LoS scenario and the one for location 3 of TR with an external antenna in the NLoS scenario are considered outliers and are excluded from the fitting.
The four STD datasets and the corresponding fittings for the LoS and NLoS scenarios are presented in Figure 6 and Figure 7, respectively.
From Table 6 and Table 7, the PE results are promising in both scenarios for both types of IQRF TRs. In the LoS scenario, approximately similar path loss exponents (PEs) are obtained; n = 2.30 and n = 2.25 for TR with an embedded antenna and the TR with an external antenna, respectively. However, a slight difference in PE is observed in the NLoS scenario; n = 3.11 for TR with an embedded antenna compared to the one with an external antenna, where n = 2.72 . This will result in a faster decrease in power for TRs with an embedded antenna compared to the ones with an external antenna. Moreover, a difference in power (offset) between the obtained path loss models for both types of TRs in both LoS and NLoS scenarios can be seen in Figure 4 and Figure 5, respectively. This is not ideal and could be explained by the instability of IQRF TRs with an embedded antenna, as discussed in [17]. When comparing the performances of both types of TRs, the results presented in [17] show that IQRF TRs with an embedded antenna (MLDA) show not only a drop in power due to its lower gain (−8.5 dB) but also a larger spread of the recorded values at each location compared to TRs with an external antenna (SLDA). This can also be observed in Figure 6 and Figure 7, where IQRF TRs with an embedded antenna tend to have a larger spread when compared to the IQRF TRs with an external antenna.
Overall, the results show that using IQRF TRs with an external antenna provides a stable received power at the expense of an additional part (antenna) and, accordingly, a larger size of the node in practice. However, if the size of the node is considered a limitation of the system, TRs with an embedded antenna are still a good option in shorter distances, especially in a LoS environment.

4.2. Comparison with Other Models

This section is devoted to evaluating the accuracy of IQRF-obtained models and their applicability and usability in the planning and deployment of IQRF wireless networks in an indoor environment. Therefore, the obtained IQRF PL models are compared with the models presented in Section 2. It is important to note that the choice of the empirical PL models is based on the similarities between the chosen model and the measurement conditions, such as the environment (indoor), the operating frequency, and the PE. Figure 8 and Figure 9 depict the IQRF PL models for both types of TRs obtained for both scenarios, LoS and NLoS, respectively. For easier comparison, we also draw the same set of models presented in Section 2 on both figures.
Although there is a difference in the power between IQRF PL models, as discussed earlier, still IQRF PL with an embedded antenna is compared with other empirical indoor models. The RMSE between IQRF PL obtained models, and each of the other indoor models for both LoS and NLoS scenarios is calculated, and the results are presented in Table 8. Based on the obtained results, in the LoS scenario, the ITU-1 model has better accuracy for both IQRF TRs with an embedded antenna and with an external antenna with minimal errors of 7.18 and 8.37 dB, respectively. In addition, the corresponding PEs are also close to the one of the ITU-1 model. However, for the best use of this model in IQRF network planning, an offset in power (losses) must be added to the ITU-1 model, which is approximately the RMSE error found. Thus, −7 dB for the IQRF model with an embedded antenna and +8 dB for the IQRF model with an external antenna.
On the other side, in the NLoS scenario, the best match for the IQRF model with an embedded antenna is ITU-3, with an added power offset of approximately +1.5 dB. Moreover, for the IQRF model with an external antenna, the closest models that can be considered are WINNER-2 and ITU-3, with minimal errors of 6.65 and 8.55 dB, respectively. The offset in power, in this case, is approximately +8 dB to be added to the ITU-3 model and approximately +6 dB to be added to the WINNER-2 model. However, PE should be considered if WINNER-2 is the chosen model for this case.
Finally, it is worth mentioning that the estimated range of IQRF d Max is also calculated using the obtained models and the sensitivity of the Rx transceiver (−131 dB). The results are presented in Table 6 and Table 7 for LoS and NLoS links, respectively.

5. Conclusions

The deployment of IQRF networks in indoor environments requires accurate signal analysis and PL modelling to estimate network coverage and performance. In this paper, preliminary propagation measurements using IQRF TRs that operate on the 868 MHz band were conducted. The PL parameters were measured in an indoor corridor environment for LoS and NLoS links using IQRF TRs with an embedded antenna and with an external antenna. After that, indoor empirical PL models for the IQRF network are obtained. In order to analyse the accuracy of IQRF PL models, the obtained models are compared with other well-known indoor models. The comparison results show that in the LoS scenario, the model that better matches the IQRF models obtained using TRs with embedded and external antennas is the ITU-1 path loss model that is established at 800 MHz in an office environment. On the other hand, for the NLoS scenario, the best fit with the IQRF PL model obtained using an embedded antenna is ITU-3 at 900 MHz in commercial areas. While for the IQRF PL model using TR with an external antenna, both ITU-3 at 900 MHz in commercial areas and WINNERII-2 for a NLoS corridor are considered. Additionally, the STD at each location is also calculated for the different TRs and scenarios. Finally, the maximum range values of both types of IQRF TRs are also presented.
This work is a preliminary study of IQRF in an indoor environment. Another future study is planned for the same environment by conducting comprehensive measurements that cover a larger portion of the indoor scenarios, such as inside rooms or between floors.
Author Contributions

Conceptualisation, M.B., N.G., M.M. and Y.D.; methodology M.B., N.G., M.M. and Y.D.; formal analysis M.B., M.M. and Y.D.; investigation M.B., N.G., M.M. and Y.D.; writing—original draft preparation, M.B. and N.G.; writing—review and editing, M.B., M.M., Y.D., N.G., M.D. and F.A.C.; supervision M.D. and F.A.C. All authors have read and agreed to the published version of the manuscript.

Funding

This research was funded by the Norwegian University of Science and Technology (NTNU).

Data Availability Statement

The data presented in this study are available on request from the corresponding author.

Conflicts of Interest

The authors declare no conflict of interest.

References

  1. Apanaviciene, R.; Vanagas, A.; Fokaides, P.A. Smart building integration into a smart city (SBISC): Development of a new evaluation framework. Energies 2020, 13, 2190. [Google Scholar] [CrossRef]
  2. Minoli, D.; Sohraby, K.; Occhiogrosso, B. IoT considerations, requirements, and architectures for smart buildings—Energy optimization and next-generation building management systems. IEEE Internet Things J. 2017, 4, 269–283. [Google Scholar] [CrossRef]
  3. Chen, J.; Lai, K.L. Stochastic geometry and performance analysis of large scale wireless networks. J. Trends Comput. Sci. Smart Technol. (TCSST) 2021, 3, 161–174. [Google Scholar] [CrossRef]
  4. Ali, A.; Zorlu Partal, S. Development and performance analysis of a ZigBee and LoRa-based smart building sensor network. Front. Energy Res. 2022, 10, 933743. [Google Scholar] [CrossRef]
  5. Eras, L.; Domínguez, F.; Martinez, C. Viability characterization of a proof-of-concept Bluetooth mesh smart building application. Int. J. Distrib. Sens. Netw. 2022, 18, 15501329221097819. [Google Scholar] [CrossRef]
  6. Sung, W.T.; Hsiao, S.J. Building an indoor air quality monitoring system based on the architecture of the Internet of Things. EURASIP J. Wirel. Commun. Netw. 2021, 2021, 1–41. [Google Scholar] [CrossRef]
  7. Azari, A.; Masoudi, M. Interference management for coexisting Internet of Things networks over unlicensed spectrum. Ad Hoc Netw. 2021, 120, 102539. [Google Scholar] [CrossRef]
  8. Mahdi Elsiddig Haroun, F.; Mohamad Deros, S.N.; Ahmed Alkahtani, A.; Md Din, N. Towards Self-Powered WSN: The Design of Ultra-Low-Power Wireless Sensor Transmission Unit Based on Indoor Solar Energy Harvester. Electronics 2022, 11, 2077. [Google Scholar] [CrossRef]
  9. Almuhaya, M.A.; Jabbar, W.A.; Sulaiman, N.; Abdulmalek, S. A survey on Lorawan technology: Recent trends, opportunities, simulation tools and future directions. Electronics 2022, 11, 164. [Google Scholar] [CrossRef]
  10. Bouzidi, M.; Dalveren, Y.; Cheikh, F.A.; Derawi, M. Use of the IQRF Technology in Internet-of-Things-Based Smart Cities. IEEE Access 2020, 8, 56615–56629. [Google Scholar] [CrossRef]
  11. Pies, M.; Hajovsky, R. Using the IQRF technology for the internet of things: Case studies. In Proceedings of the International Conference on Mobile and Wireless Technology; Springer: Berlin/Heidelberg, Germany, 2017; pp. 274–283. [Google Scholar]
  12. Ursuţiu, D.; Neagu, A.; Samoilă, C.; Jinga, V. MODULARITY Applied to SMART HOME. In Online Engineering & Internet of Things; Springer: Berlin/Heidelberg, Germany, 2018; pp. 56–67. [Google Scholar]
  13. Velicka, J.; Pies, M.; Hajovsky, R. Wireless measurement of carbon dioxide by use of IQRF technology. IFAC-PapersOnLine 2018, 51, 78–83. [Google Scholar] [CrossRef]
  14. Hajovsky, R.; Pies, M.; Velicka, J. Monitoring the condition of the protective fence above the railway track. IFAC-PapersOnLine 2019, 52, 145–150. [Google Scholar] [CrossRef]
  15. Pieš, M.; Hájovskỳ, R. Use of accelerometer sensors to measure the states of retaining steel networks and dynamic barriers. In Proceedings of the 2018 19th International Carpathian Control Conference (ICCC), Szilvasvarad, Hungary, 28–31 May 2018; pp. 416–421. [Google Scholar]
  16. Sulc, V.; Kuchta, R.; Vrba, R. IQRF smart house-a case study. In Proceedings of the 2010 Third International Conference on Advances in Mesh Networks, Venice, Italy, 18–25 July 2010; pp. 103–108. [Google Scholar]
  17. Bouzidi, M.; Mohamed, M.; Dalveren, Y.; Moldsvor, A.; Cheikh, F.A.; Derawi, M. Propagation Measurements for IQRF Network in an Urban Environment. Sensors 2022, 22, 7012. [Google Scholar] [CrossRef] [PubMed]
  18. Angelov, K.; Sadinov, S.; Kogias, P. Deployment of mesh network in an indoor scenario for application in IoT communications. In Proceedings of the IOP Conference Series: Materials Science and Engineering; IOP Publishing: Borovets, Bulgaria, 2021; Volume 1032, p. 012004. [Google Scholar]
  19. Pluta, S.; Roszkowski, P. Properties of a wireless mesh network constructed with the use of IQRF modules in the indoor environment. Int. J. Electron. Telecommun. 2020, 66, 537–544. [Google Scholar]
  20. Fujdiak, R.; Mlynek, P.; Malina, L.; Orgon, M.; Slacik, J.; Blazek, P.; Misurec, J. Development of IQRF technology: Analysis, simulations and experimental measurements. Elektron. ir Elektrotechnika 2019, 25, 72–79. [Google Scholar] [CrossRef] [Green Version]
  21. Bertoni, H.L. Radio Propagation for Modern Wireless Systems; Pearson Education: London, UK, 1999. [Google Scholar]
  22. Rappaport, T.S. Wireless Communications–Principles and Practice, (The Book End). Microw. J. 2002, 45, 128–129. [Google Scholar]
  23. Cheffena, M.; Mohamed, M. Empirical path loss models for wireless sensor network deployment in snowy environments. IEEE Antennas Wirel. Propag. Lett. 2017, 16, 2877–2880. [Google Scholar] [CrossRef] [Green Version]
  24. Olasupo, T.O.; Otero, C.E.; Olasupo, K.O.; Kostanic, I. Empirical path loss models for wireless sensor network deployments in short and tall natural grass environments. IEEE Trans. Antennas Propag. 2016, 64, 4012–4021. [Google Scholar] [CrossRef]
  25. Series, P. Propagation data and prediction methods for the planning of indoor radiocommunication systems and radio local area networks in the frequency range 300 MHz to 100 GHz. International Telecommunication Union (ITU), Recommendation P.1238-9, Geneva. 2017. Available online: https://www.itu.int/rec/R-REC-P.1238-9-201706-S/en (accessed on 1 November 2022).
  26. Acuña-Aroni, J.S.; Alvarado-Gomez, B.W.; Roman-Gonzalez, A. QoS Analysis to Optimize the Indoor Network IEEE 802.11 at UNTELS. Int. J. Adv. Comput. Sci. Appl. 2019, 10, 570–574. [Google Scholar] [CrossRef] [Green Version]
  27. Meinilä, J.; Kyösti, P.; Jämsä, T.; Hentilä, L. WINNER II Channel Models; John Wiley & Sons: Hoboken, NJ, USA, 2009. [Google Scholar]
  28. Obeidat, H.; Alabdullah, A.; Elkhazmi, E.; Suhaib, W.; Obeidat, O.; Alkhambashi, M.; Mosleh, M.; Ali, N.; Dama, Y.; Abidin, Z.; et al. Indoor environment propagation review. Comput. Sci. Rev. 2020, 37, 100272. [Google Scholar]
  29. Sandoval, R.M.; Garcia-Sanchez, A.J.; Garcia-Haro, J. Improving RSSI-based path-loss models accuracy for critical infrastructures: A smart grid substation case-study. IEEE Trans. Ind. Inform. 2017, 14, 2230–2240. [Google Scholar] [CrossRef]
Figure 1. Experimental indoor location, Ametystbygget NTNU, Gjøvik. (a) Top view of the building in which the measurements were conducted. (b) The corridor where the experiment is performed.
Electronics 11 03972 g001
Figure 2. Measurement scenarios. (a) Scenario I—Line-of-Sight scenario, (b) Scenario II—Non-Line-of-Sight scenario.
Electronics 11 03972 g002
Figure 3. IQRF transceivers used in the measurement.
Electronics 11 03972 g003
Figure 4. IQRF path loss model for the Line-of-Sight link.
Electronics 11 03972 g004
Figure 5. IQRF path loss model for the Non-Line-of-Sight link.
Electronics 11 03972 g005
Figure 6. Standard deviation at each location for the Line-of-Sight links using both types of IQRF transceivers.
Electronics 11 03972 g006
Figure 7. Standard deviation at each location for the Non−Line−of−Sight links using both types of IQRF transceivers.
Electronics 11 03972 g007
Figure 8. IQRF path loss model comparison with the other model for the Line-of-Sight link.
Electronics 11 03972 g008
Figure 9. IQRF path loss model comparison with the other model for the Non-Line-of-Sight link.
Electronics 11 03972 g009
Table 1. Parameters of the ITU Model.
Model NamePower Loss Coefficient NFloor Penetration Loss Factor L f
OfficeCommercial L f ( dB )
ITU-1 (0.8 GHz)22.5-0 (same floor) [t]
ITU-2 (0.9 GHz)20-0 (same floor)
ITU-3 (0.9 GHz)-330 (same floor)
Table 2. Parameters for the WINNERII Model.
Model NameScenarioABCX
WINNERII-1W−LoS18.746.820
WINNERII-2 W - NLoS corridor 36.843.820 12 ( n w 1 )
Table 3. Packet Delivery Ratio (PDR) for Line-of-Sight Scenario.
Antenna TypeParameter 10 log 10 d d 0 , d 0 = 0.5  (m)
3.015.007.019.0011.0013.0015.0017.0019.0021.00
EmbeddedPDR (%)97.0097.1997.0197.0297.0796.9596.9297.0097.0196.81
ExternalPDR (%)97.0196.6597.2896.9496.9597.2497.0896.9697.1797.00
Table 4. Packet Delivery Ratio (PDR) for the Non-Line-of-Sight Scenario.
Antenna TypeParameter 10 log 10 d d 0 , d 0 = 5 (m)
1.502.062.733.494.325.216.137.088.059.03
EmbeddedPDR (%)97.1097.0996.8496.9697.0196.9896.7997.0597.1196.93
ExternalPDR (%)97.0297.1096.9396.7897.1096.8897.0497.0097.2696.95
Table 5. Measurement setup parameters.
ParameterValueUnit
Transmission Frequency868.45MHz
Tx power−20dB
Embedded antenna gain−8.5dBi
External antenna gain2.15dBi
Tx antenna height1.5m
Rx antenna height1.5m
Packets rate40Packet/s
Packet size3Bytes
Measurement duration25min/location
Table 6. Path Loss Regression Coefficients and Statistical Results for the Line-of-Sight Scenario.
Antenna Typen L ( d 0 ) (dB) R 2 ϵ (dB) d Max (m)
Embedded2.3017.270.894.76540
External2.2530.990.933.431390 [t]
Table 7. Path Loss Regression Coefficients and Statistical Results for the Non-Line-of-Sight Scenario.
Antenna Typen L ( d 0 ) (dB) R 2 ϵ (dB) d Max (m)
Embedded3.1156.640.665.5256
External2.7265.200.912.06258 [t]
Table 8. Comparison of the IQRF Models with Empirical Models for LoS and NLoS Scenarios.
Path Loss ModelPath Loss Exponent nRMSE for LoS (dB)RMSE for NLoS (dB)
Embedded n = 2.30 External n = 2.25 Embedded n = 3.11 External n = 2.72
Free-space2.006.639.4818.0223.73
ITU-12.257.188.3716.2221.88
ITU-22.006.549.6118.1523.87
ITU-33.3017.517.515.738.55
WINNERII-11.876.4010.3519.1824.93
WINNERII-23.6830.2218.1013.746.65
Publisher’s Note: MDPI stays neutral with regard to jurisdictional claims in published maps and institutional affiliations.