
Research on Topology Recognition Technology Based on Intelligent Measurement Switches


Abstract
1. Introduction
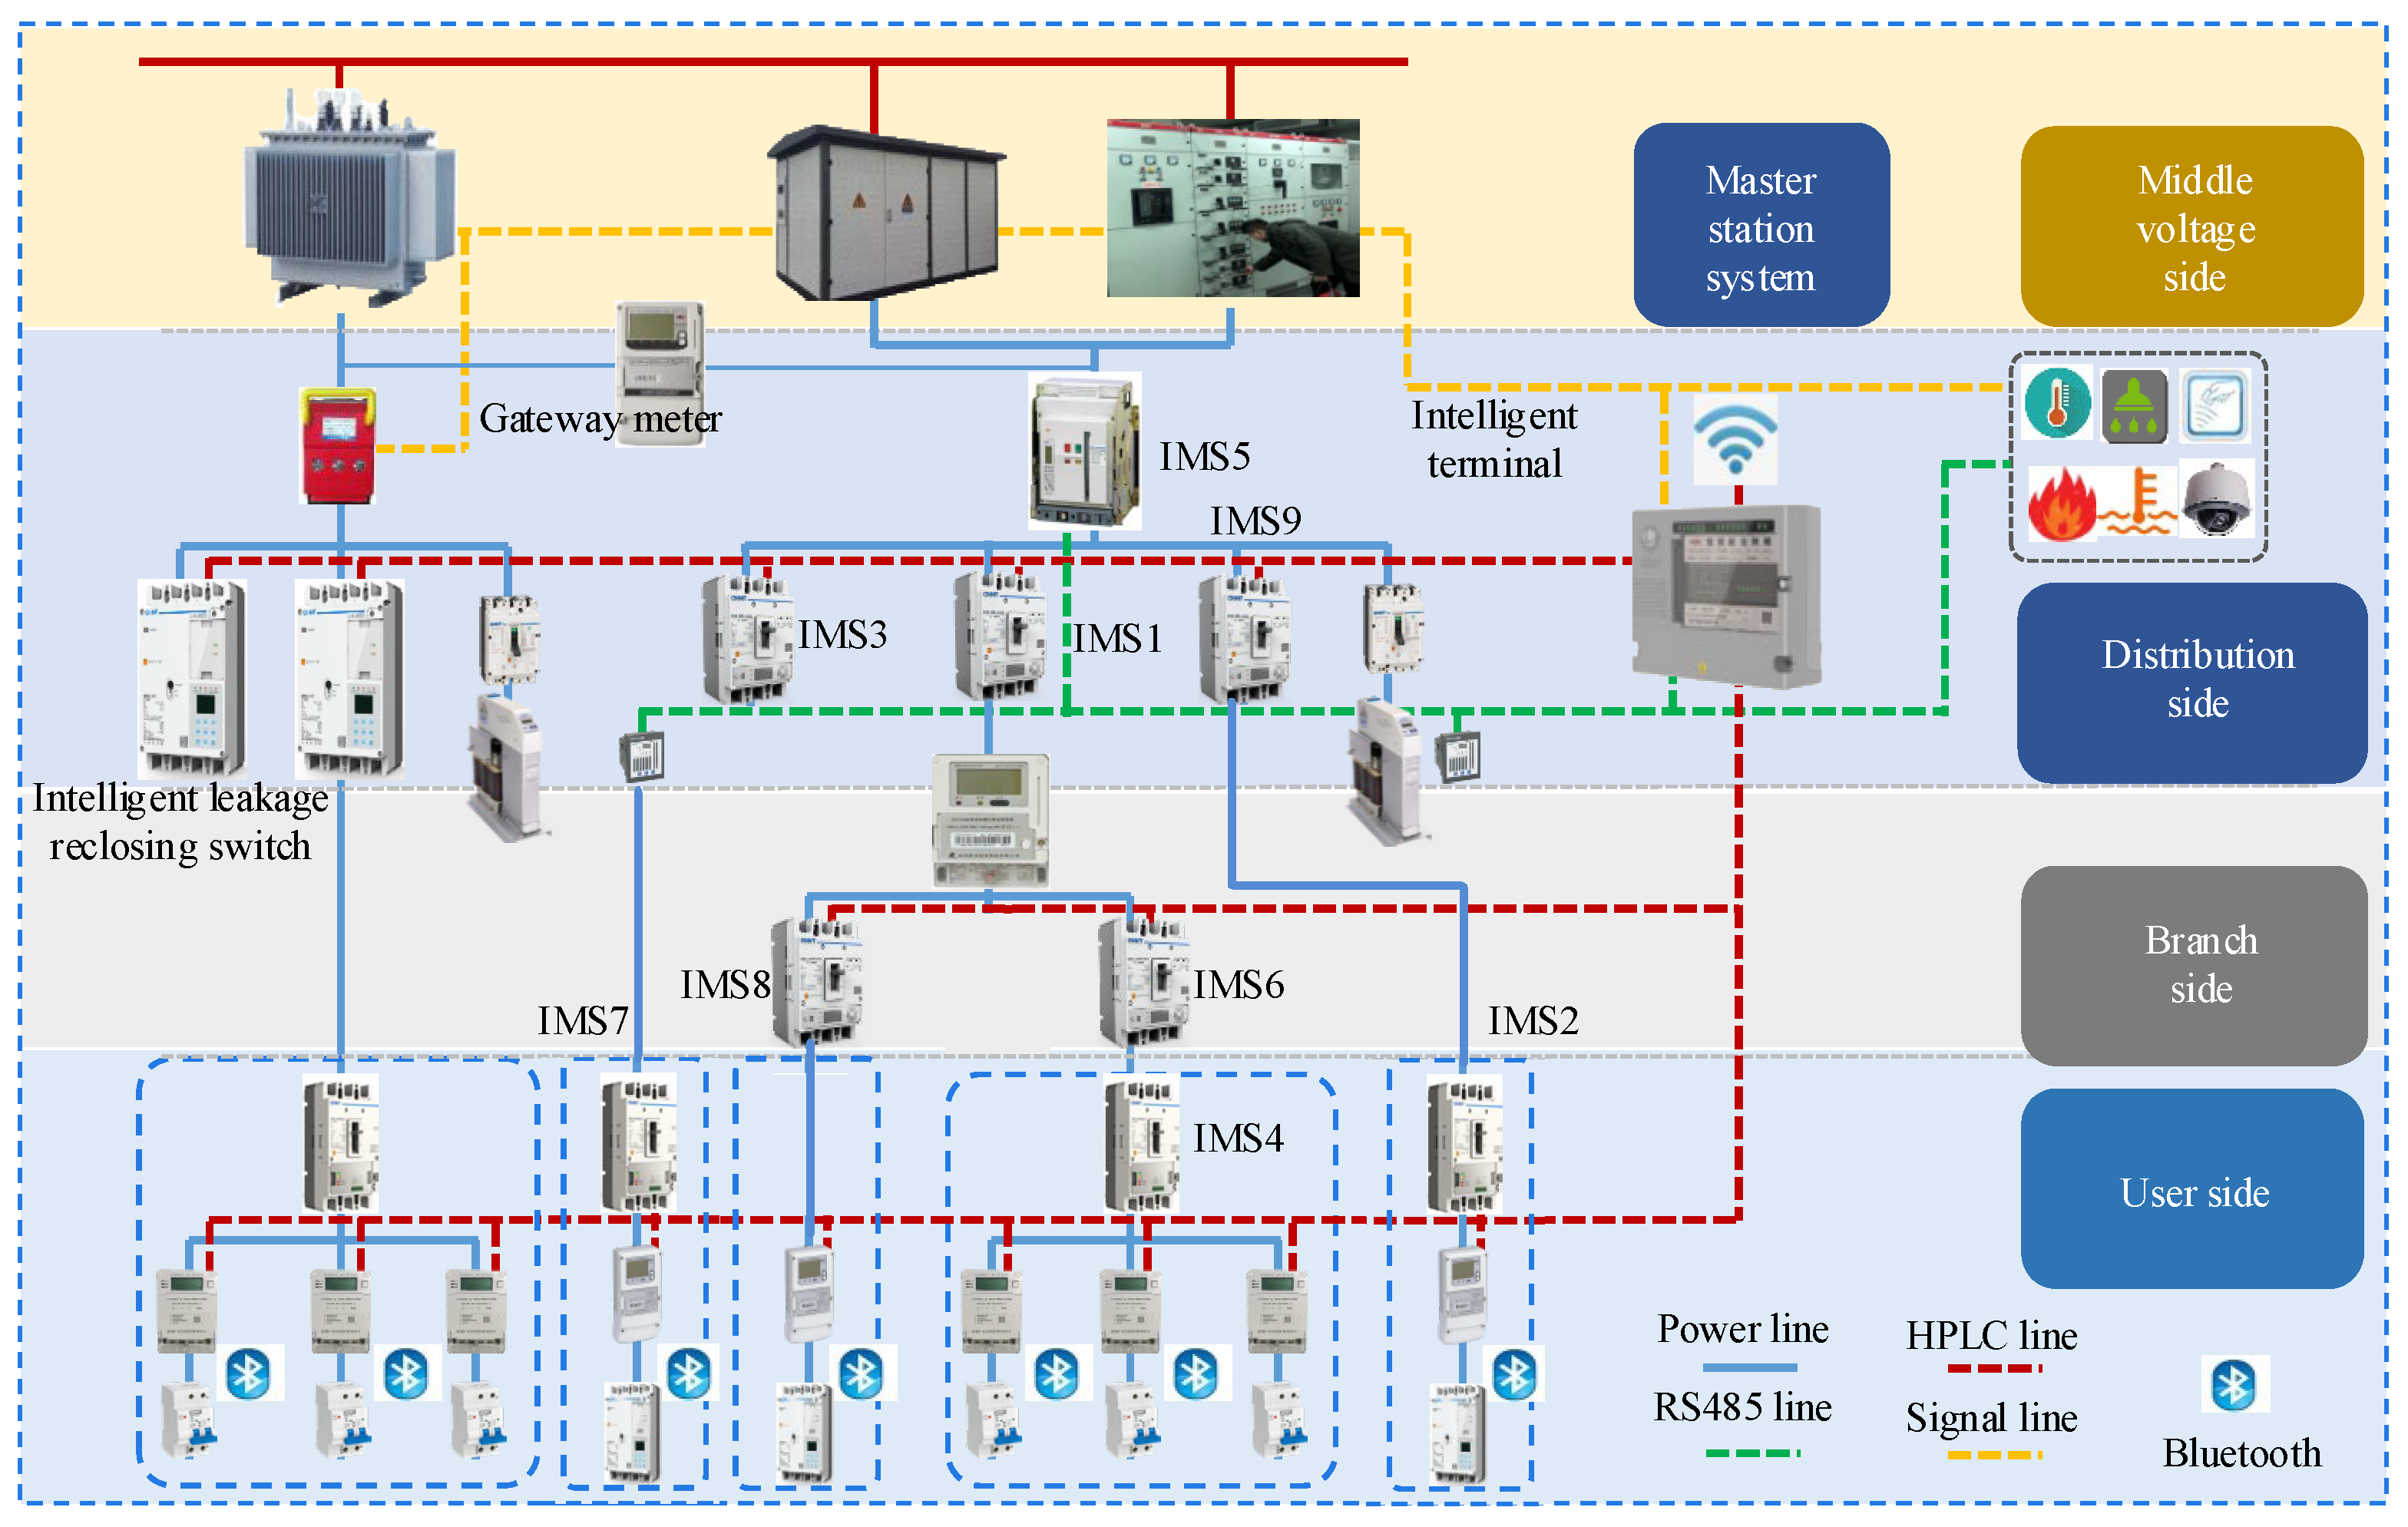
2. Topology Identification Technology Solution
3. Key Technology of Topology Identification
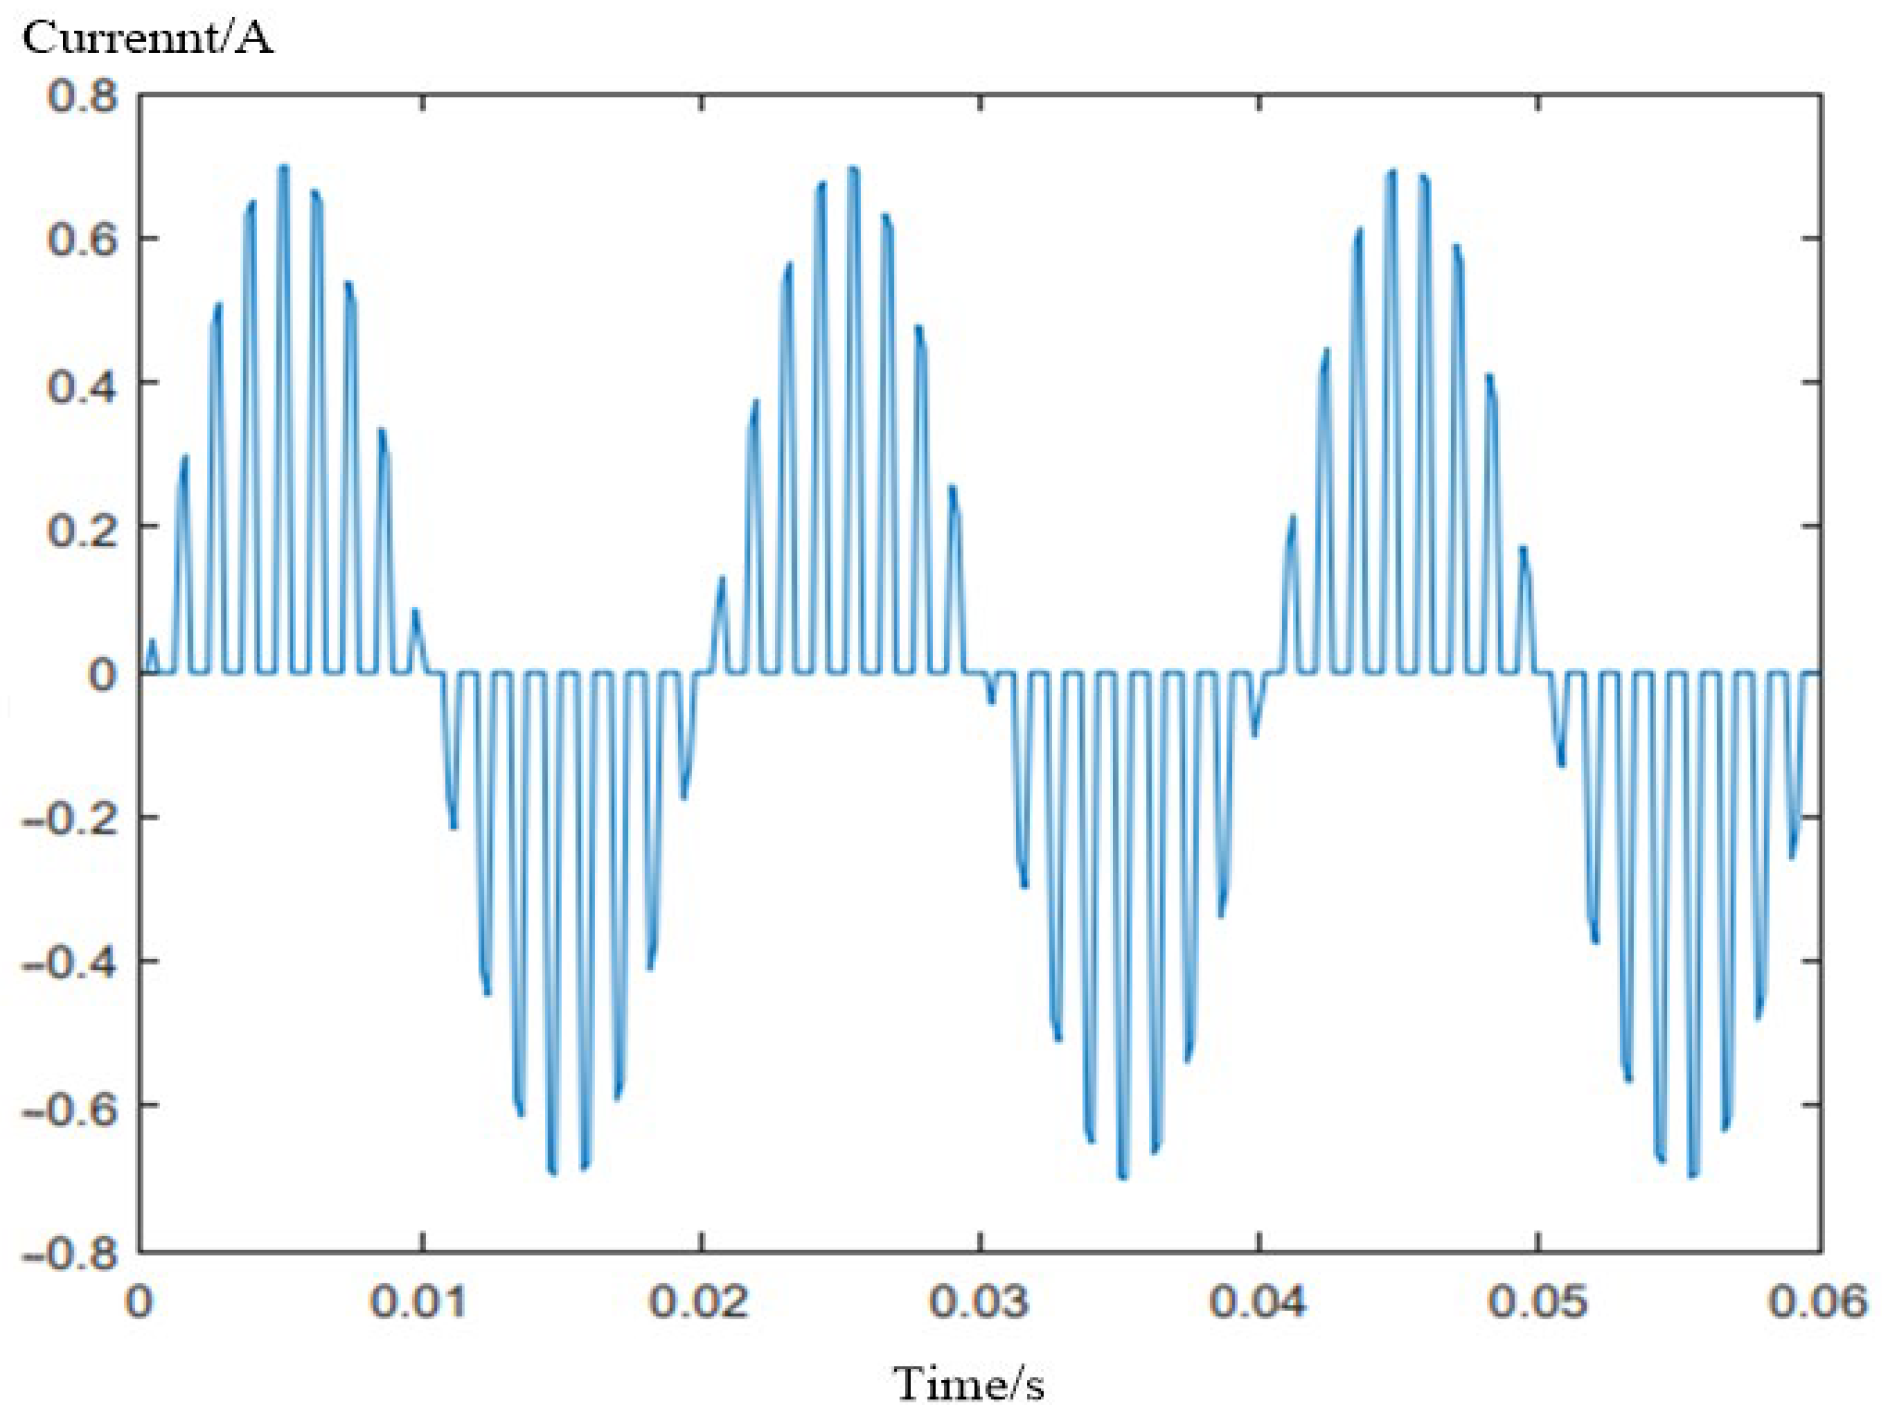
3.1. Topology Identification Mechanism Based on the Characteristic Current
3.2. Modulation Method Design
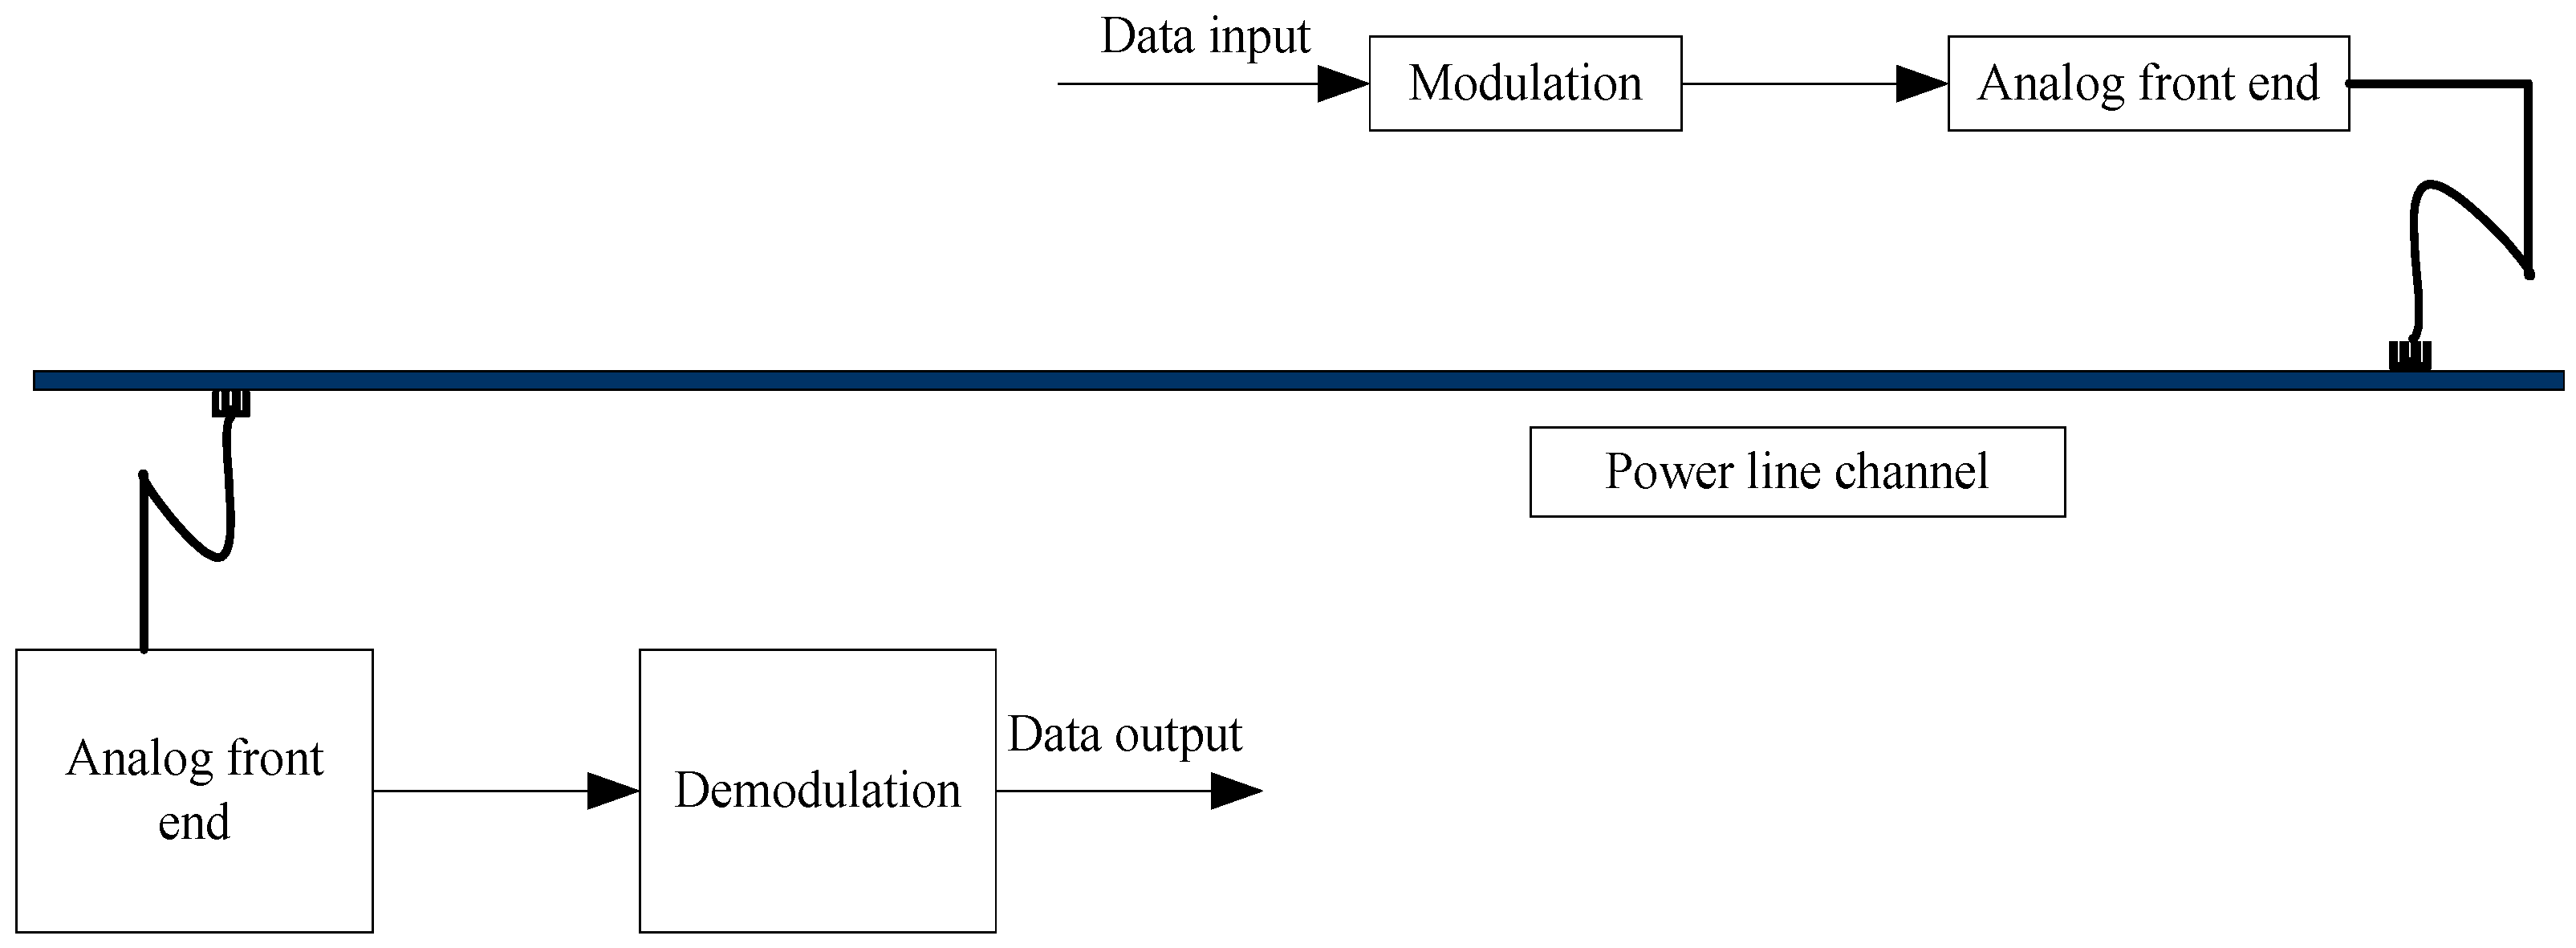
3.2.1. Modulation and Demodulation Process
3.2.2. Modulation and Demodulation Process
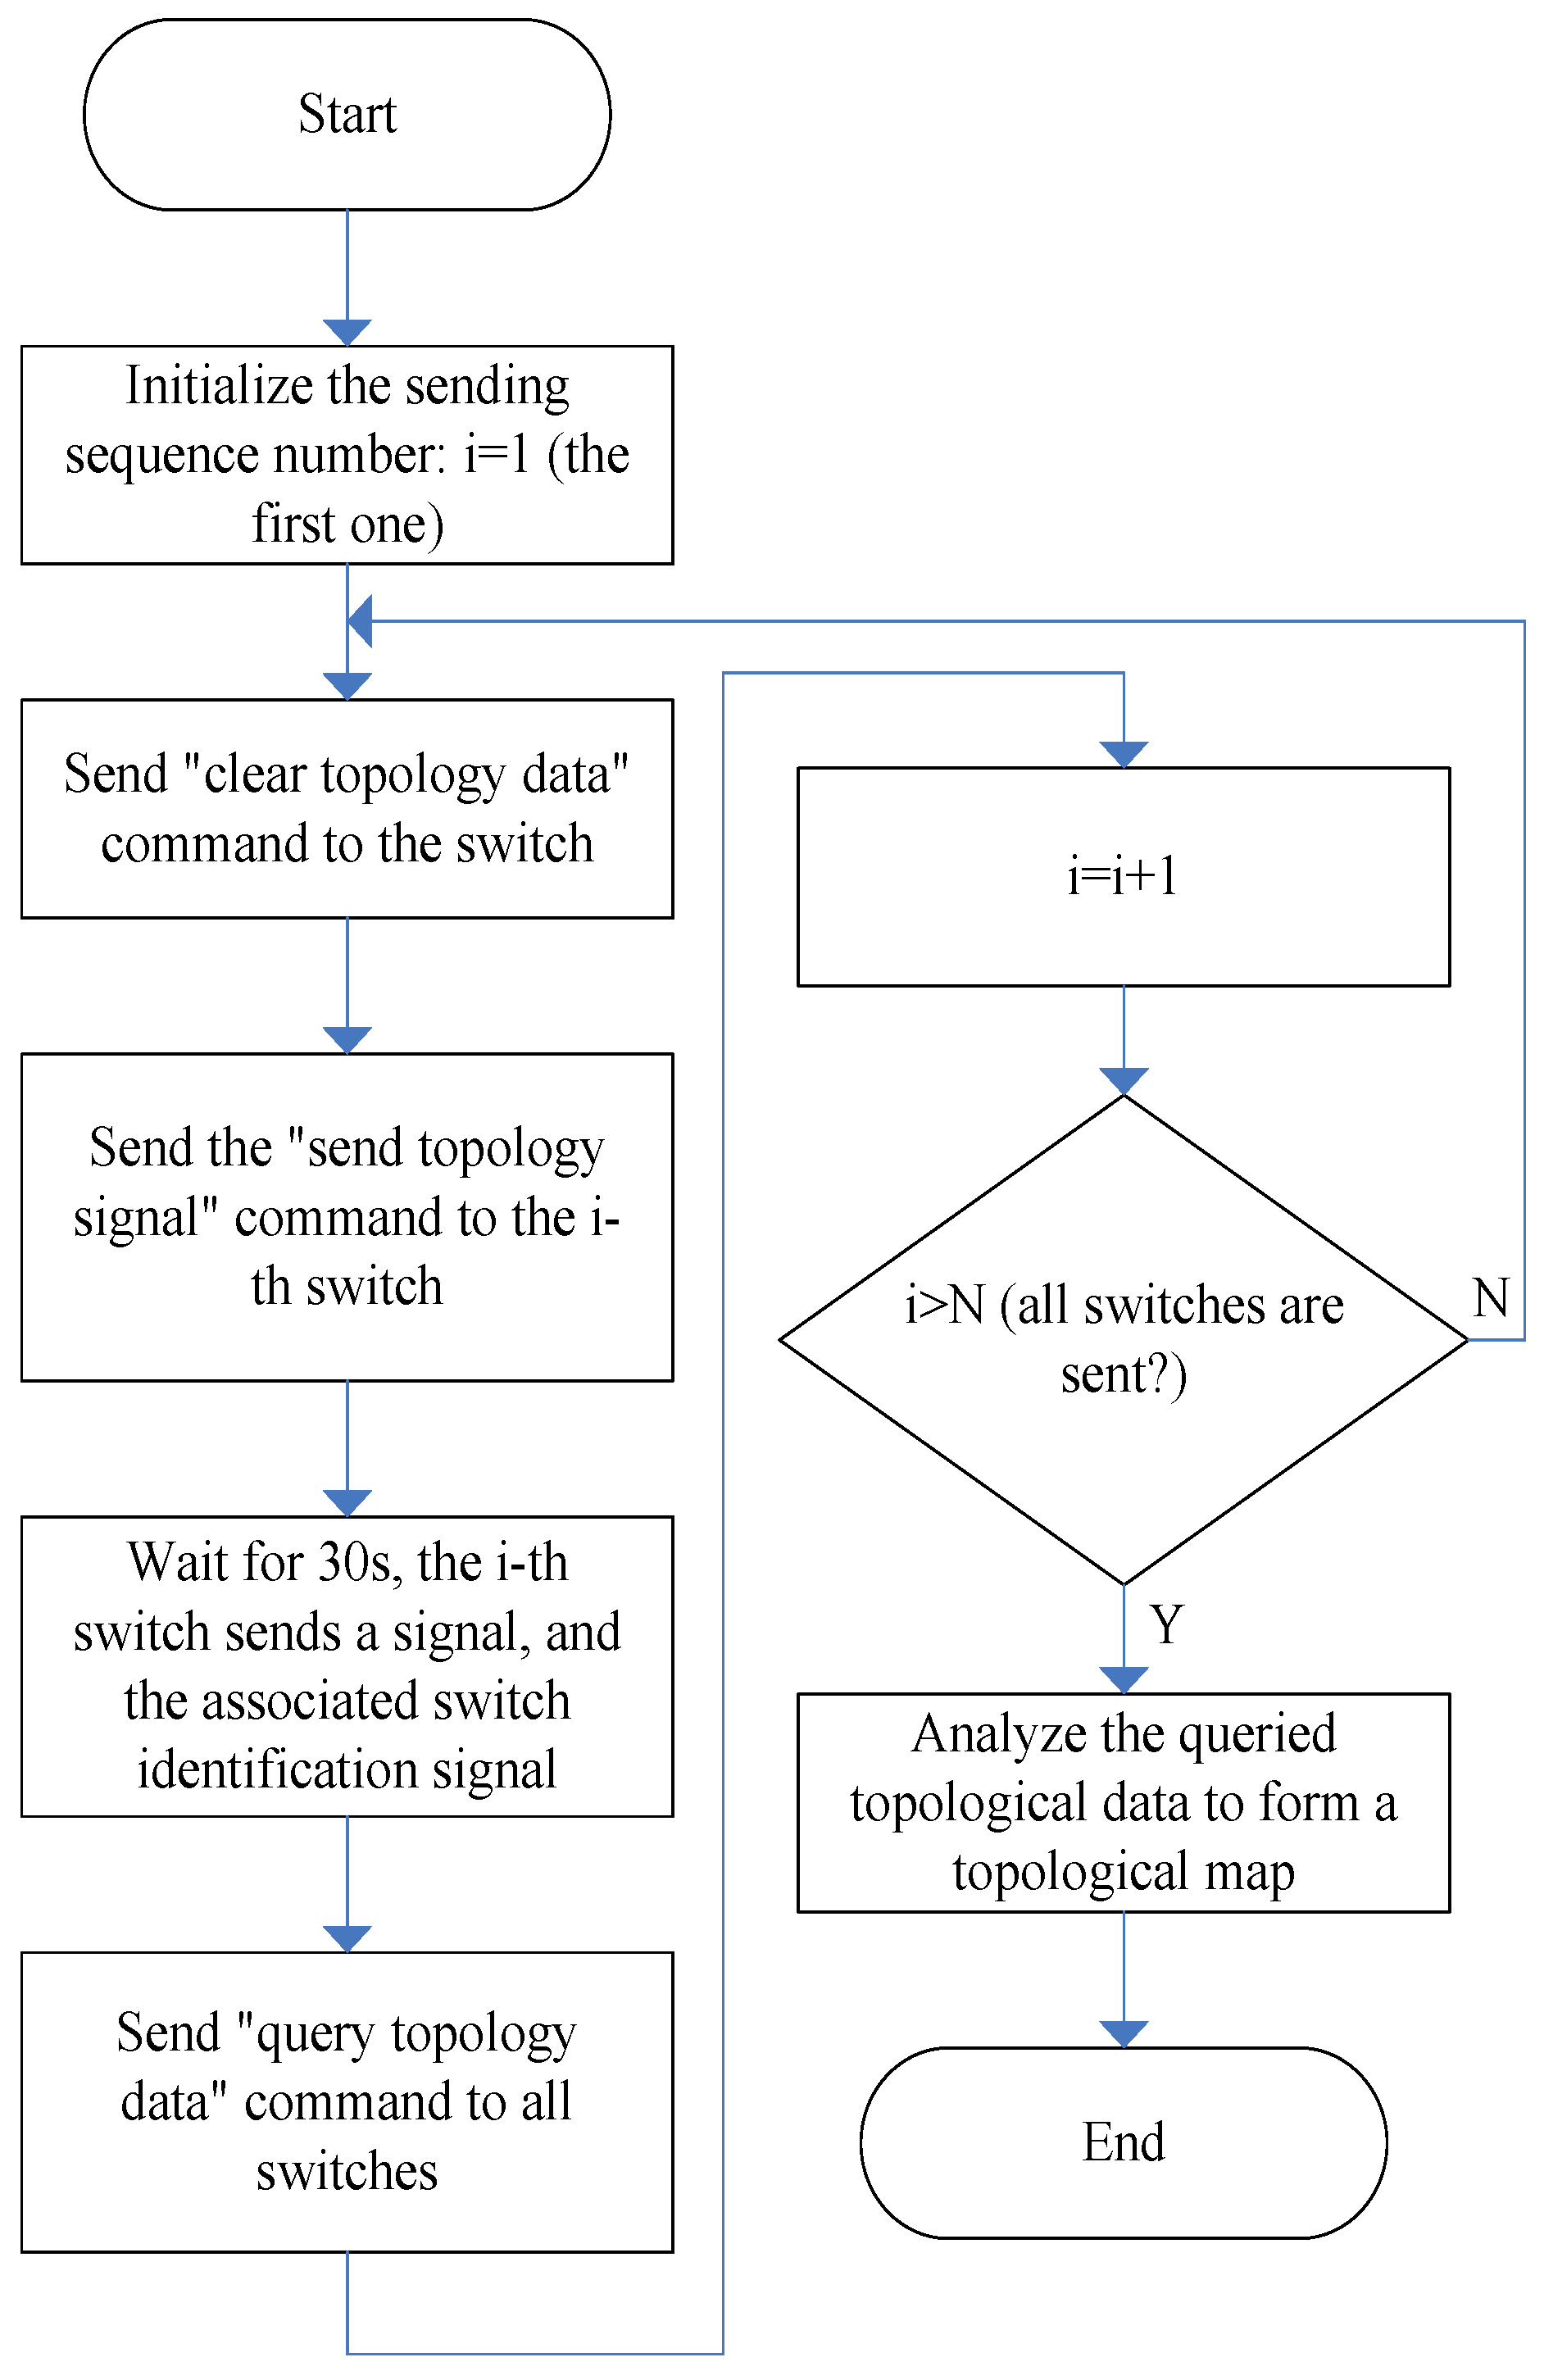
3.3. Topology Identification Program Flow
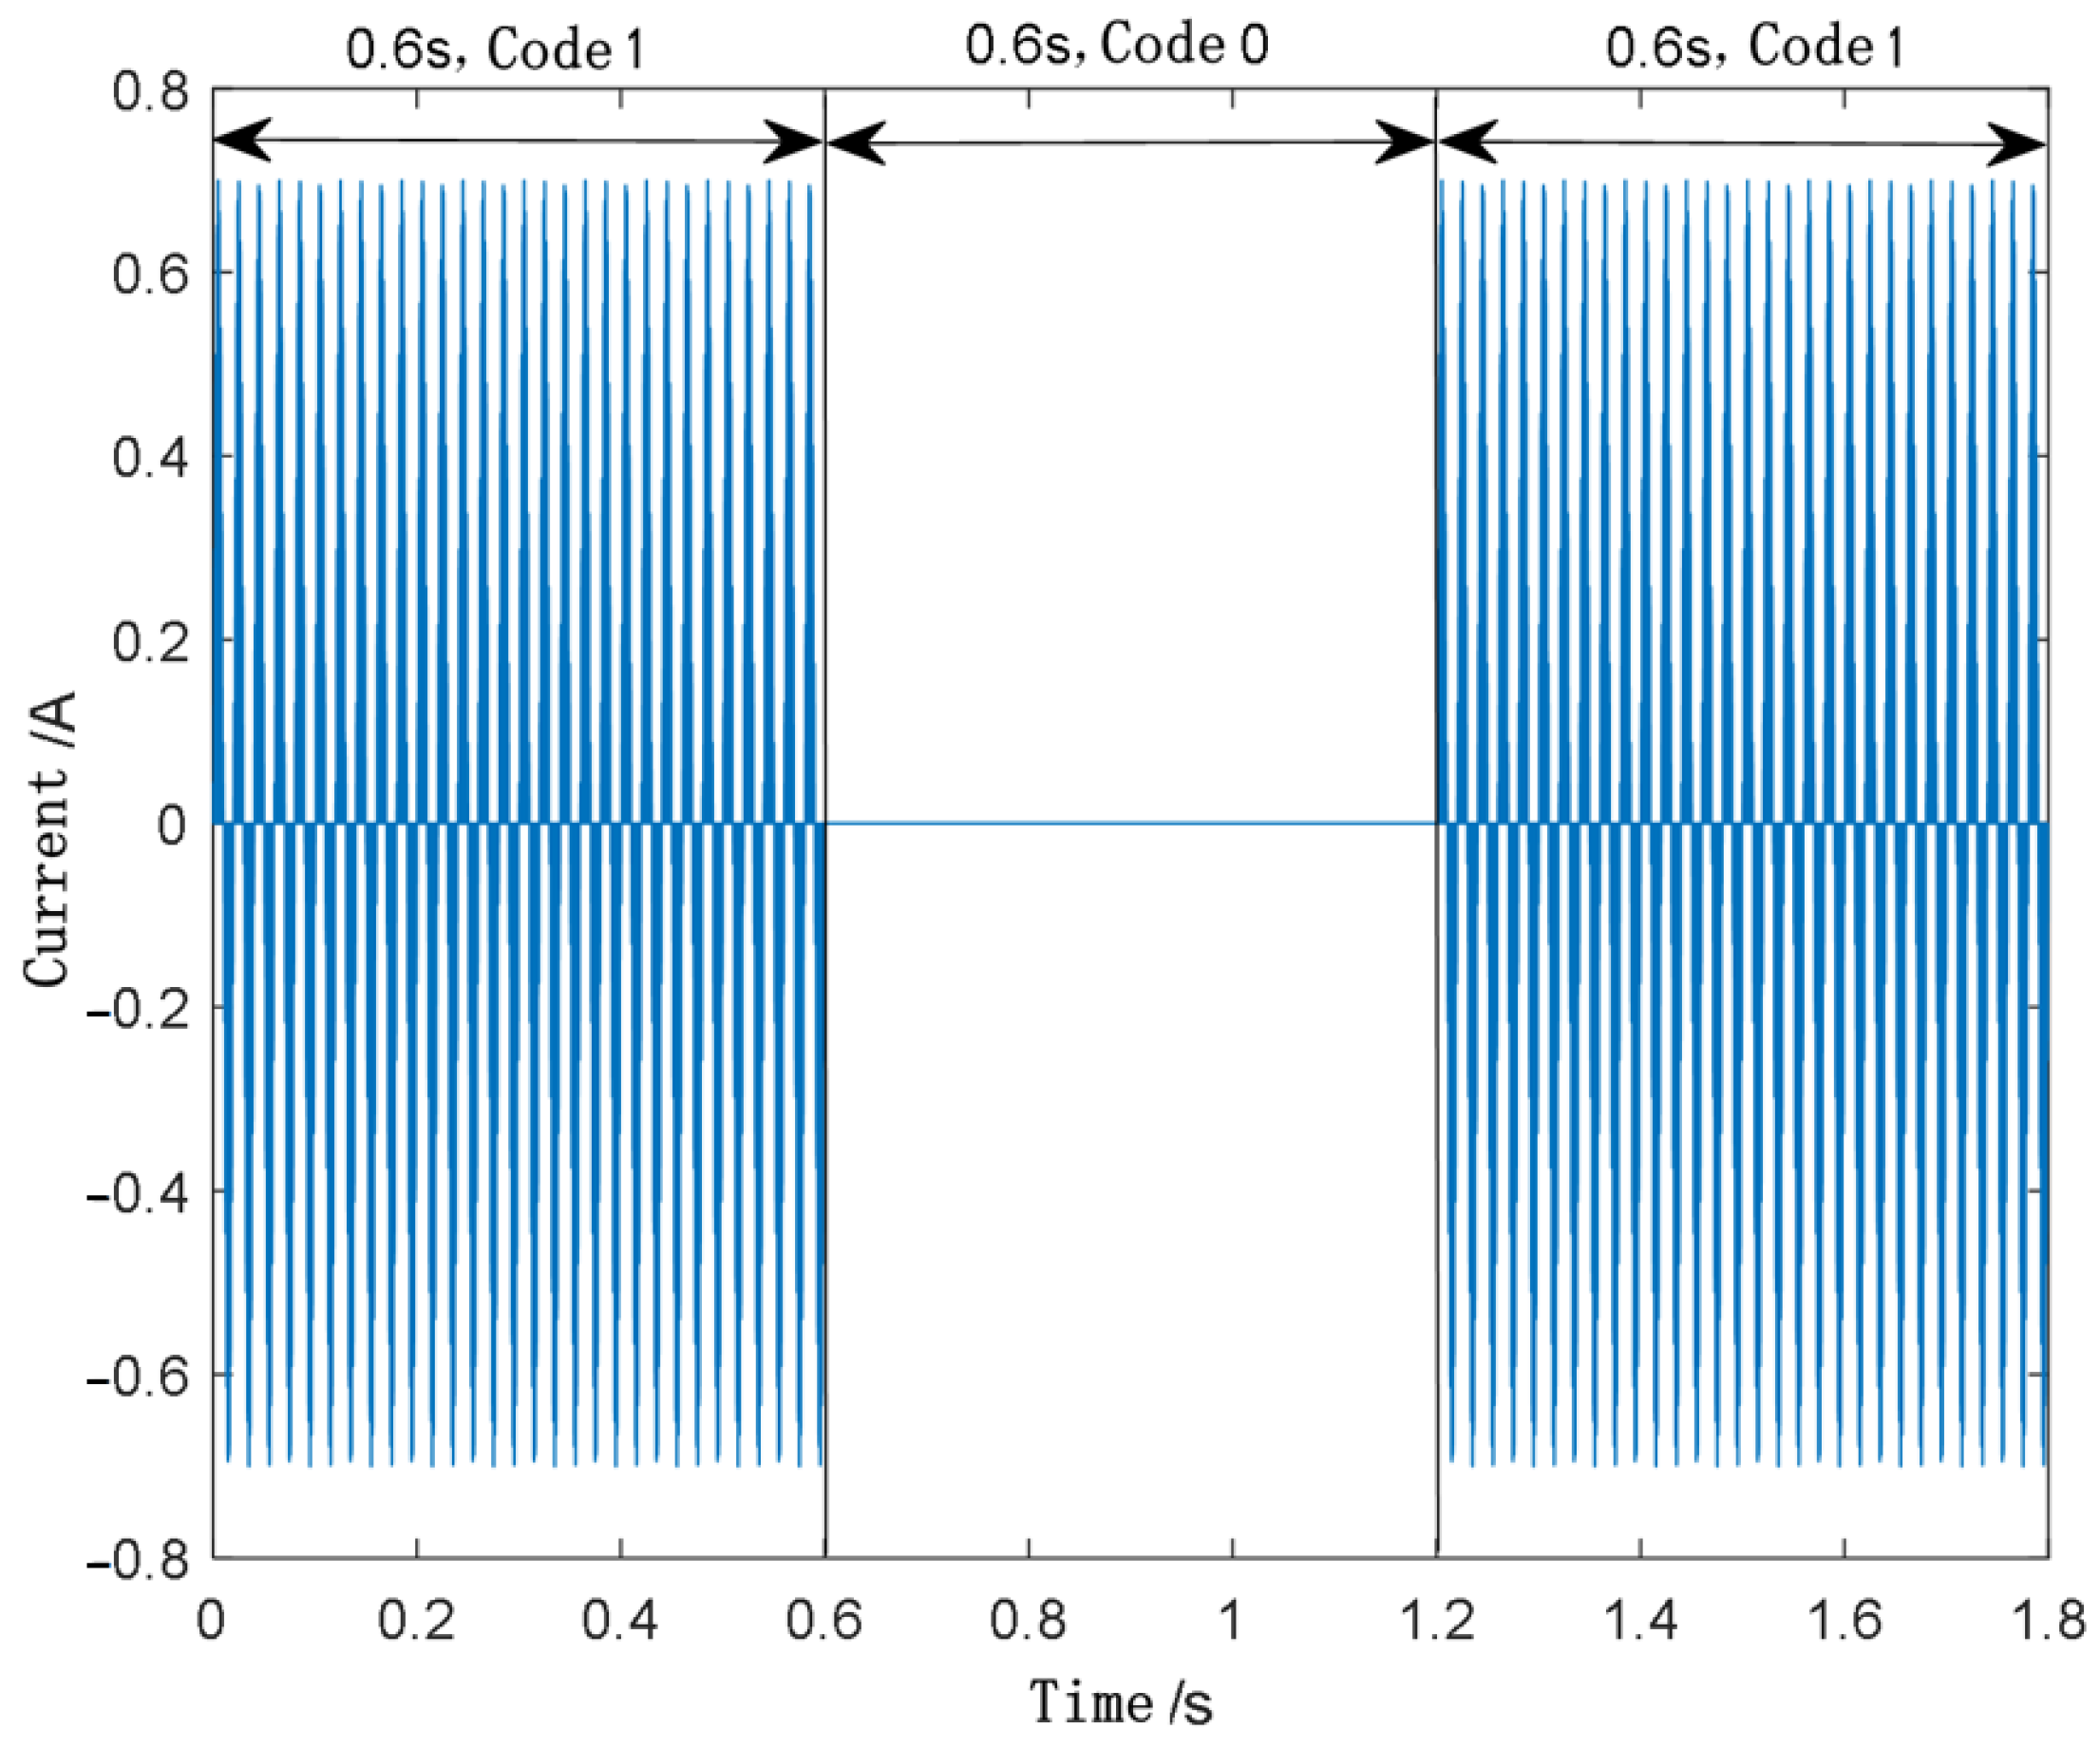
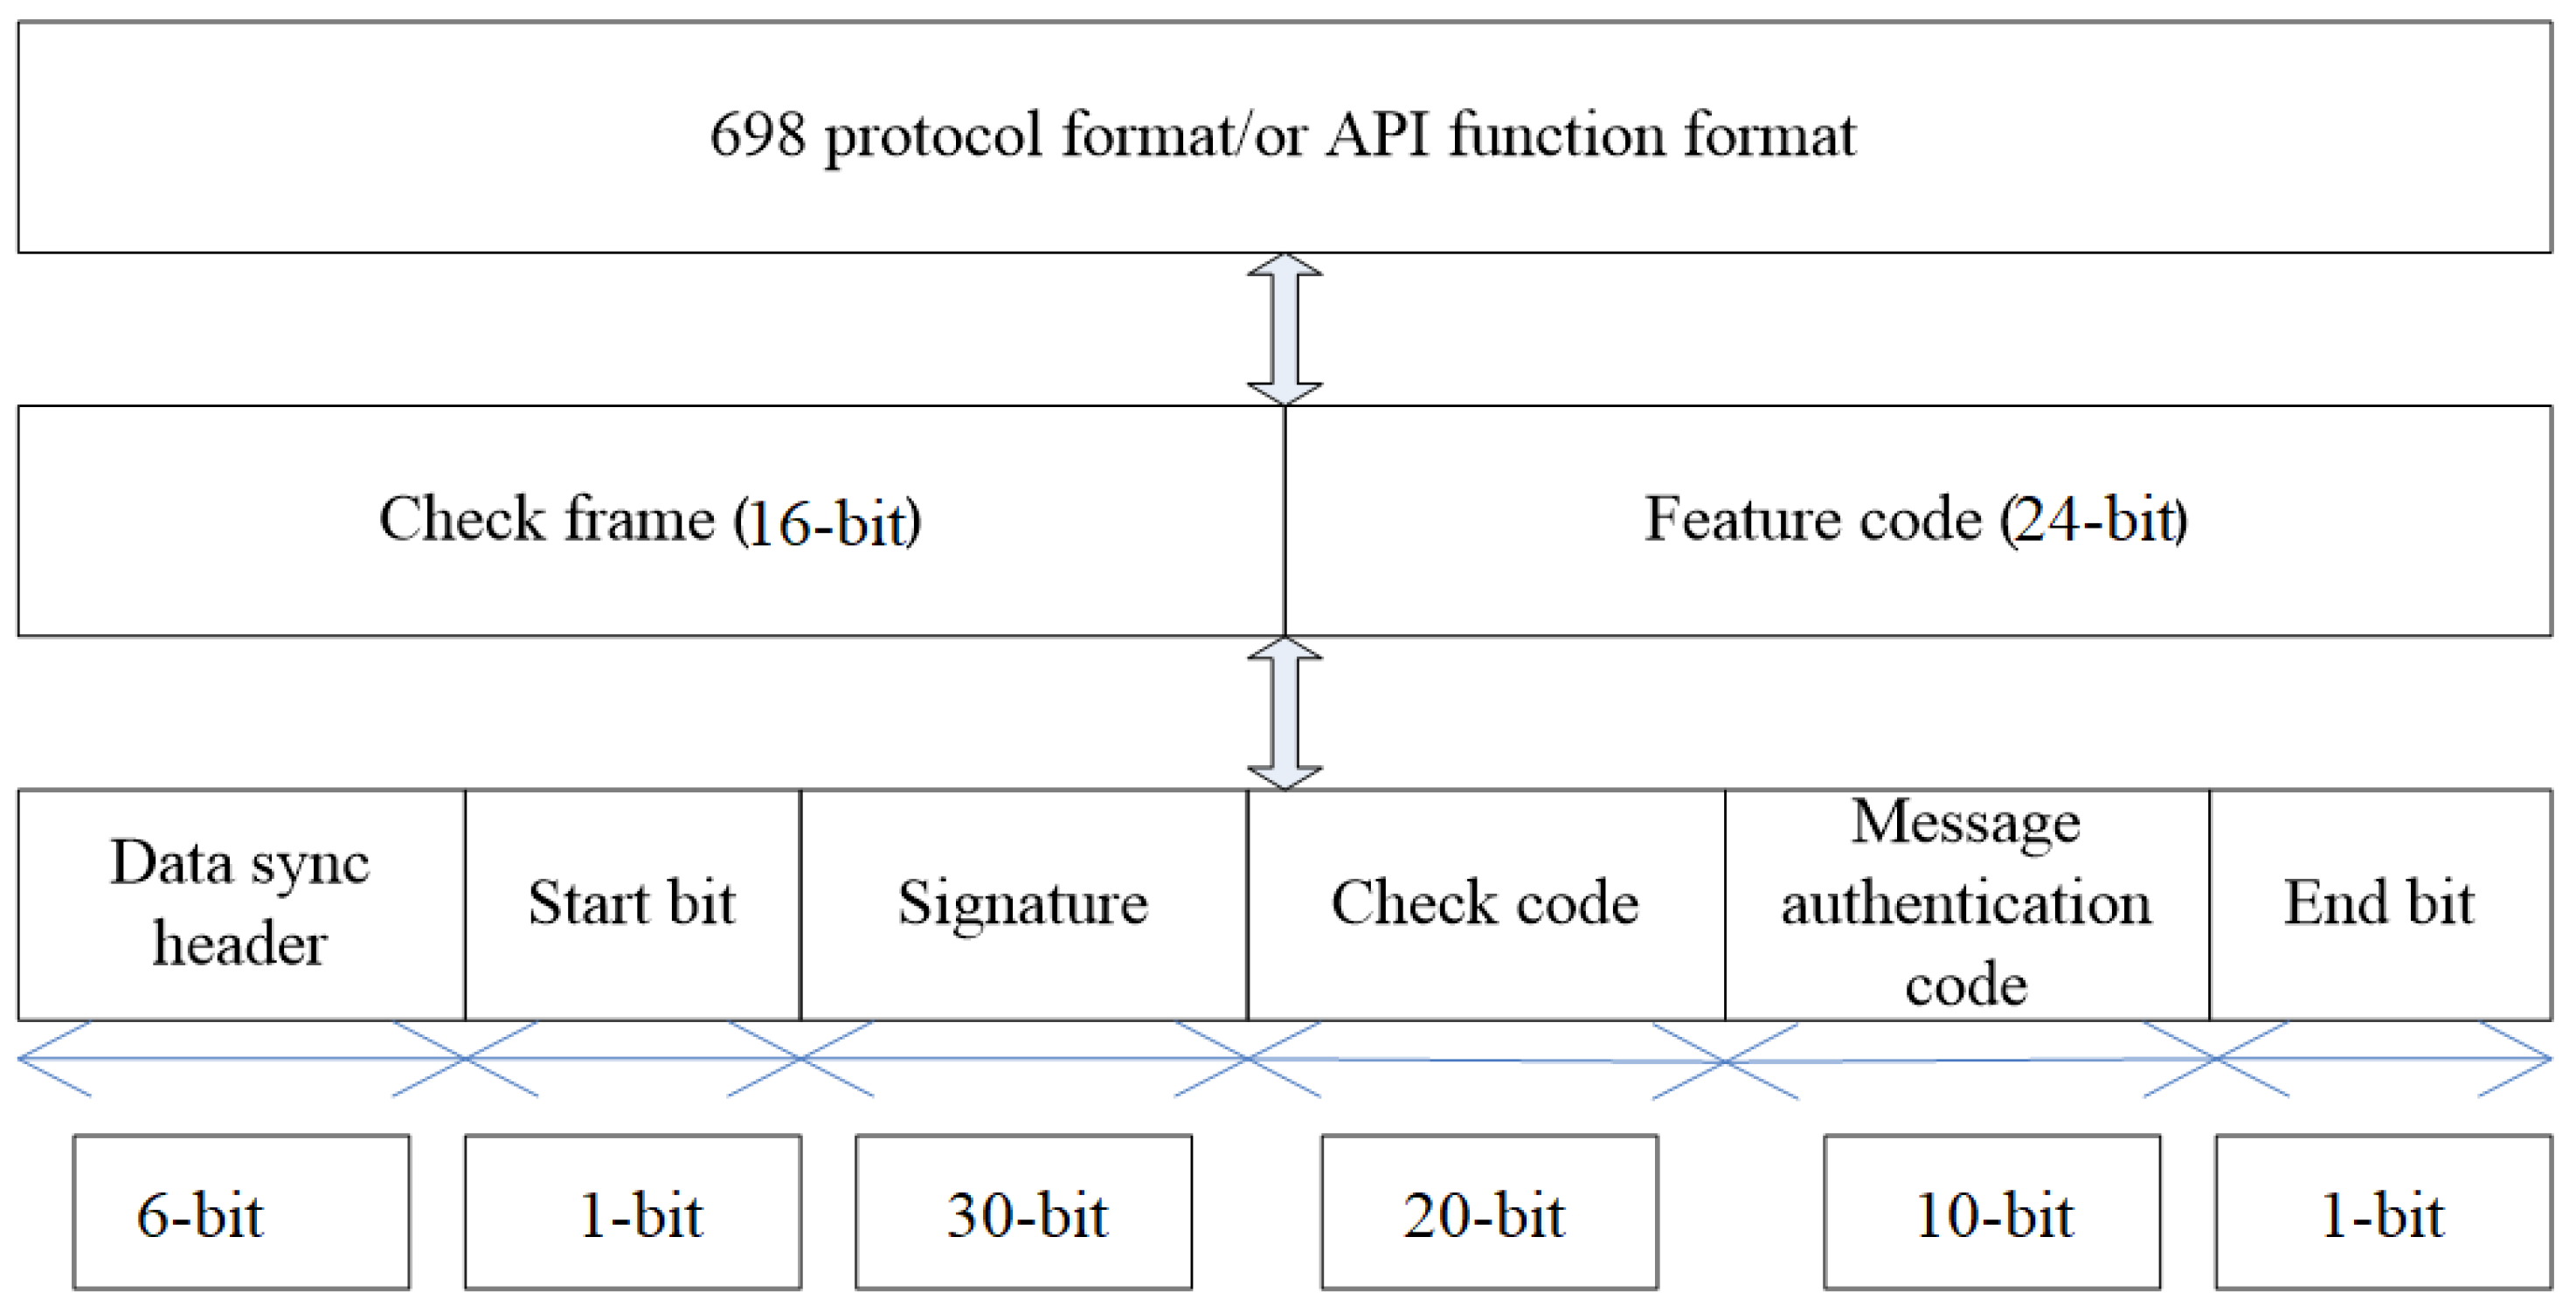
3.4. Encoding
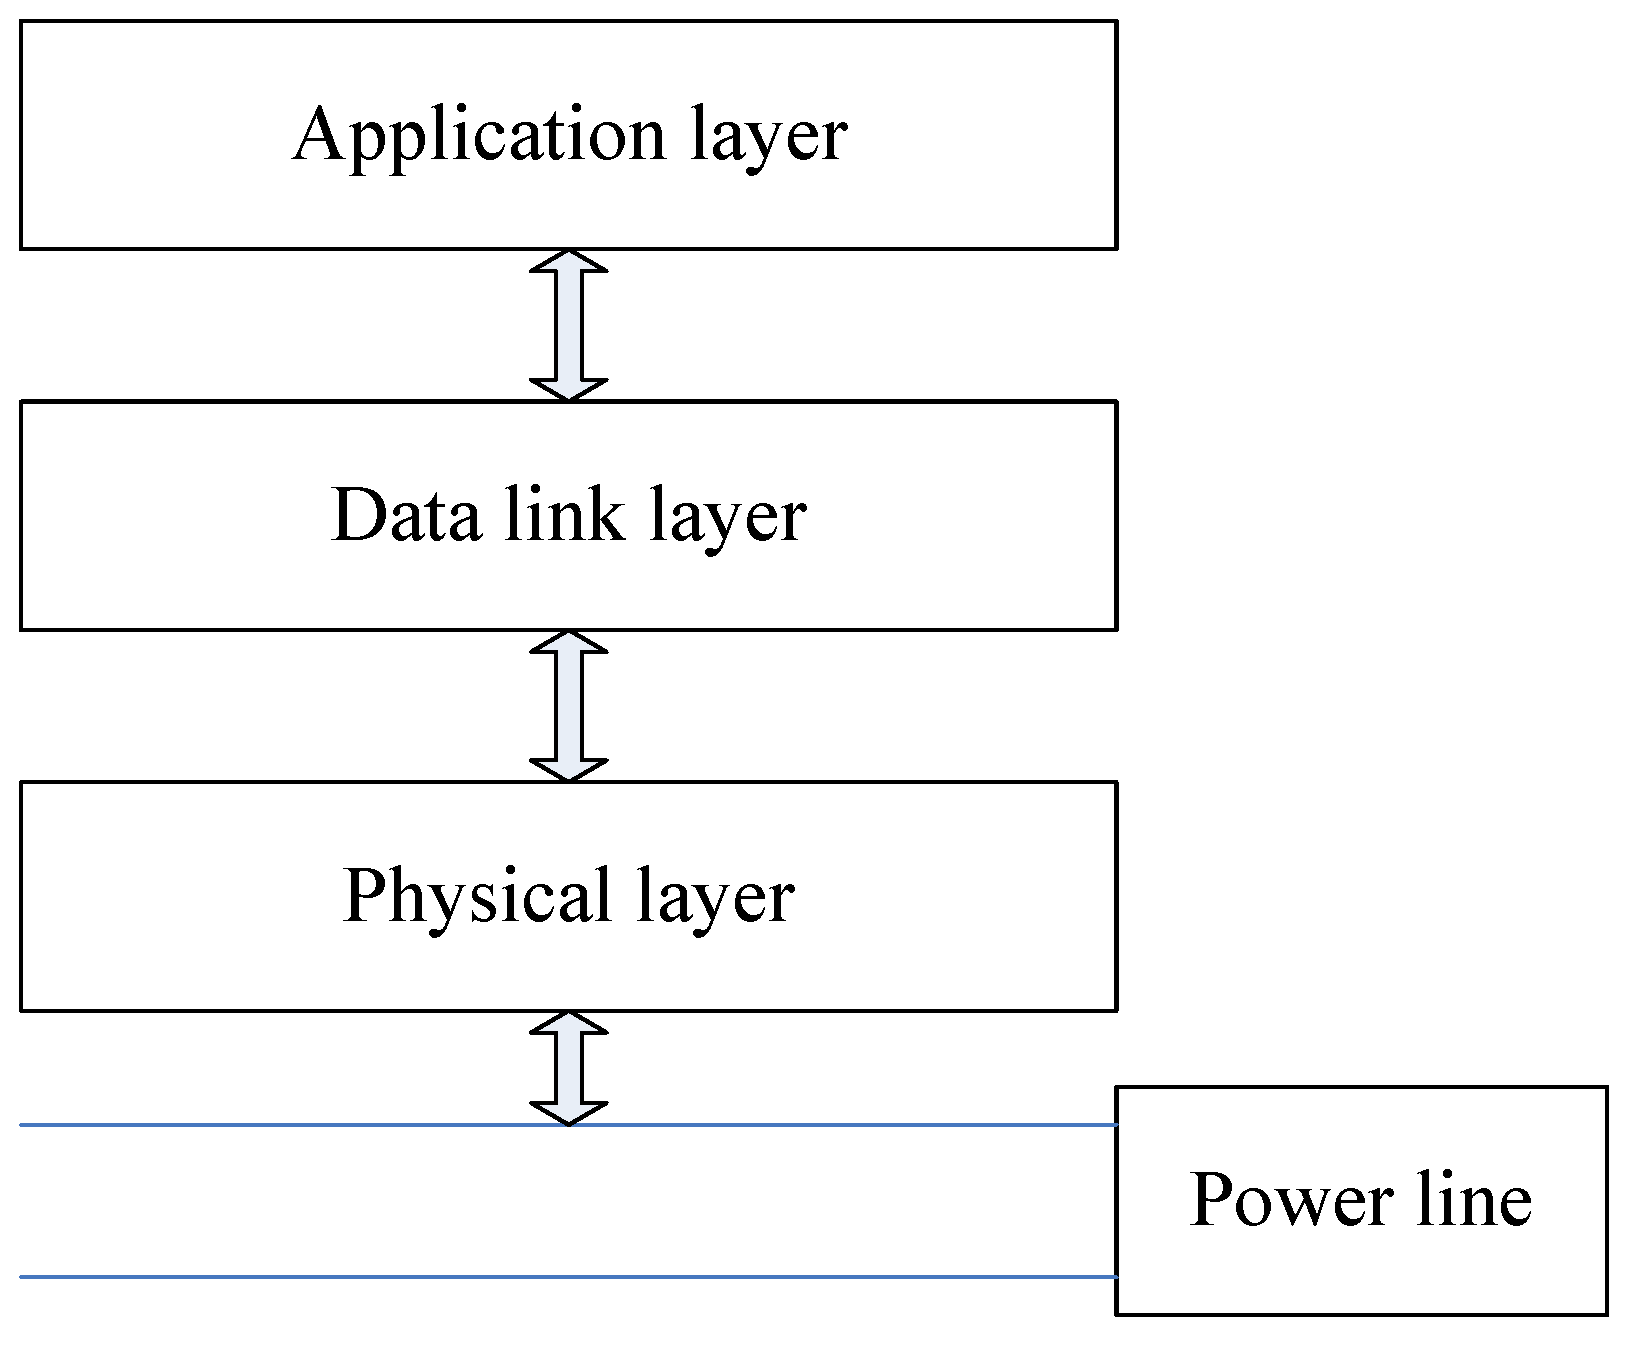
3.5. Communication Protocol Stack Structure
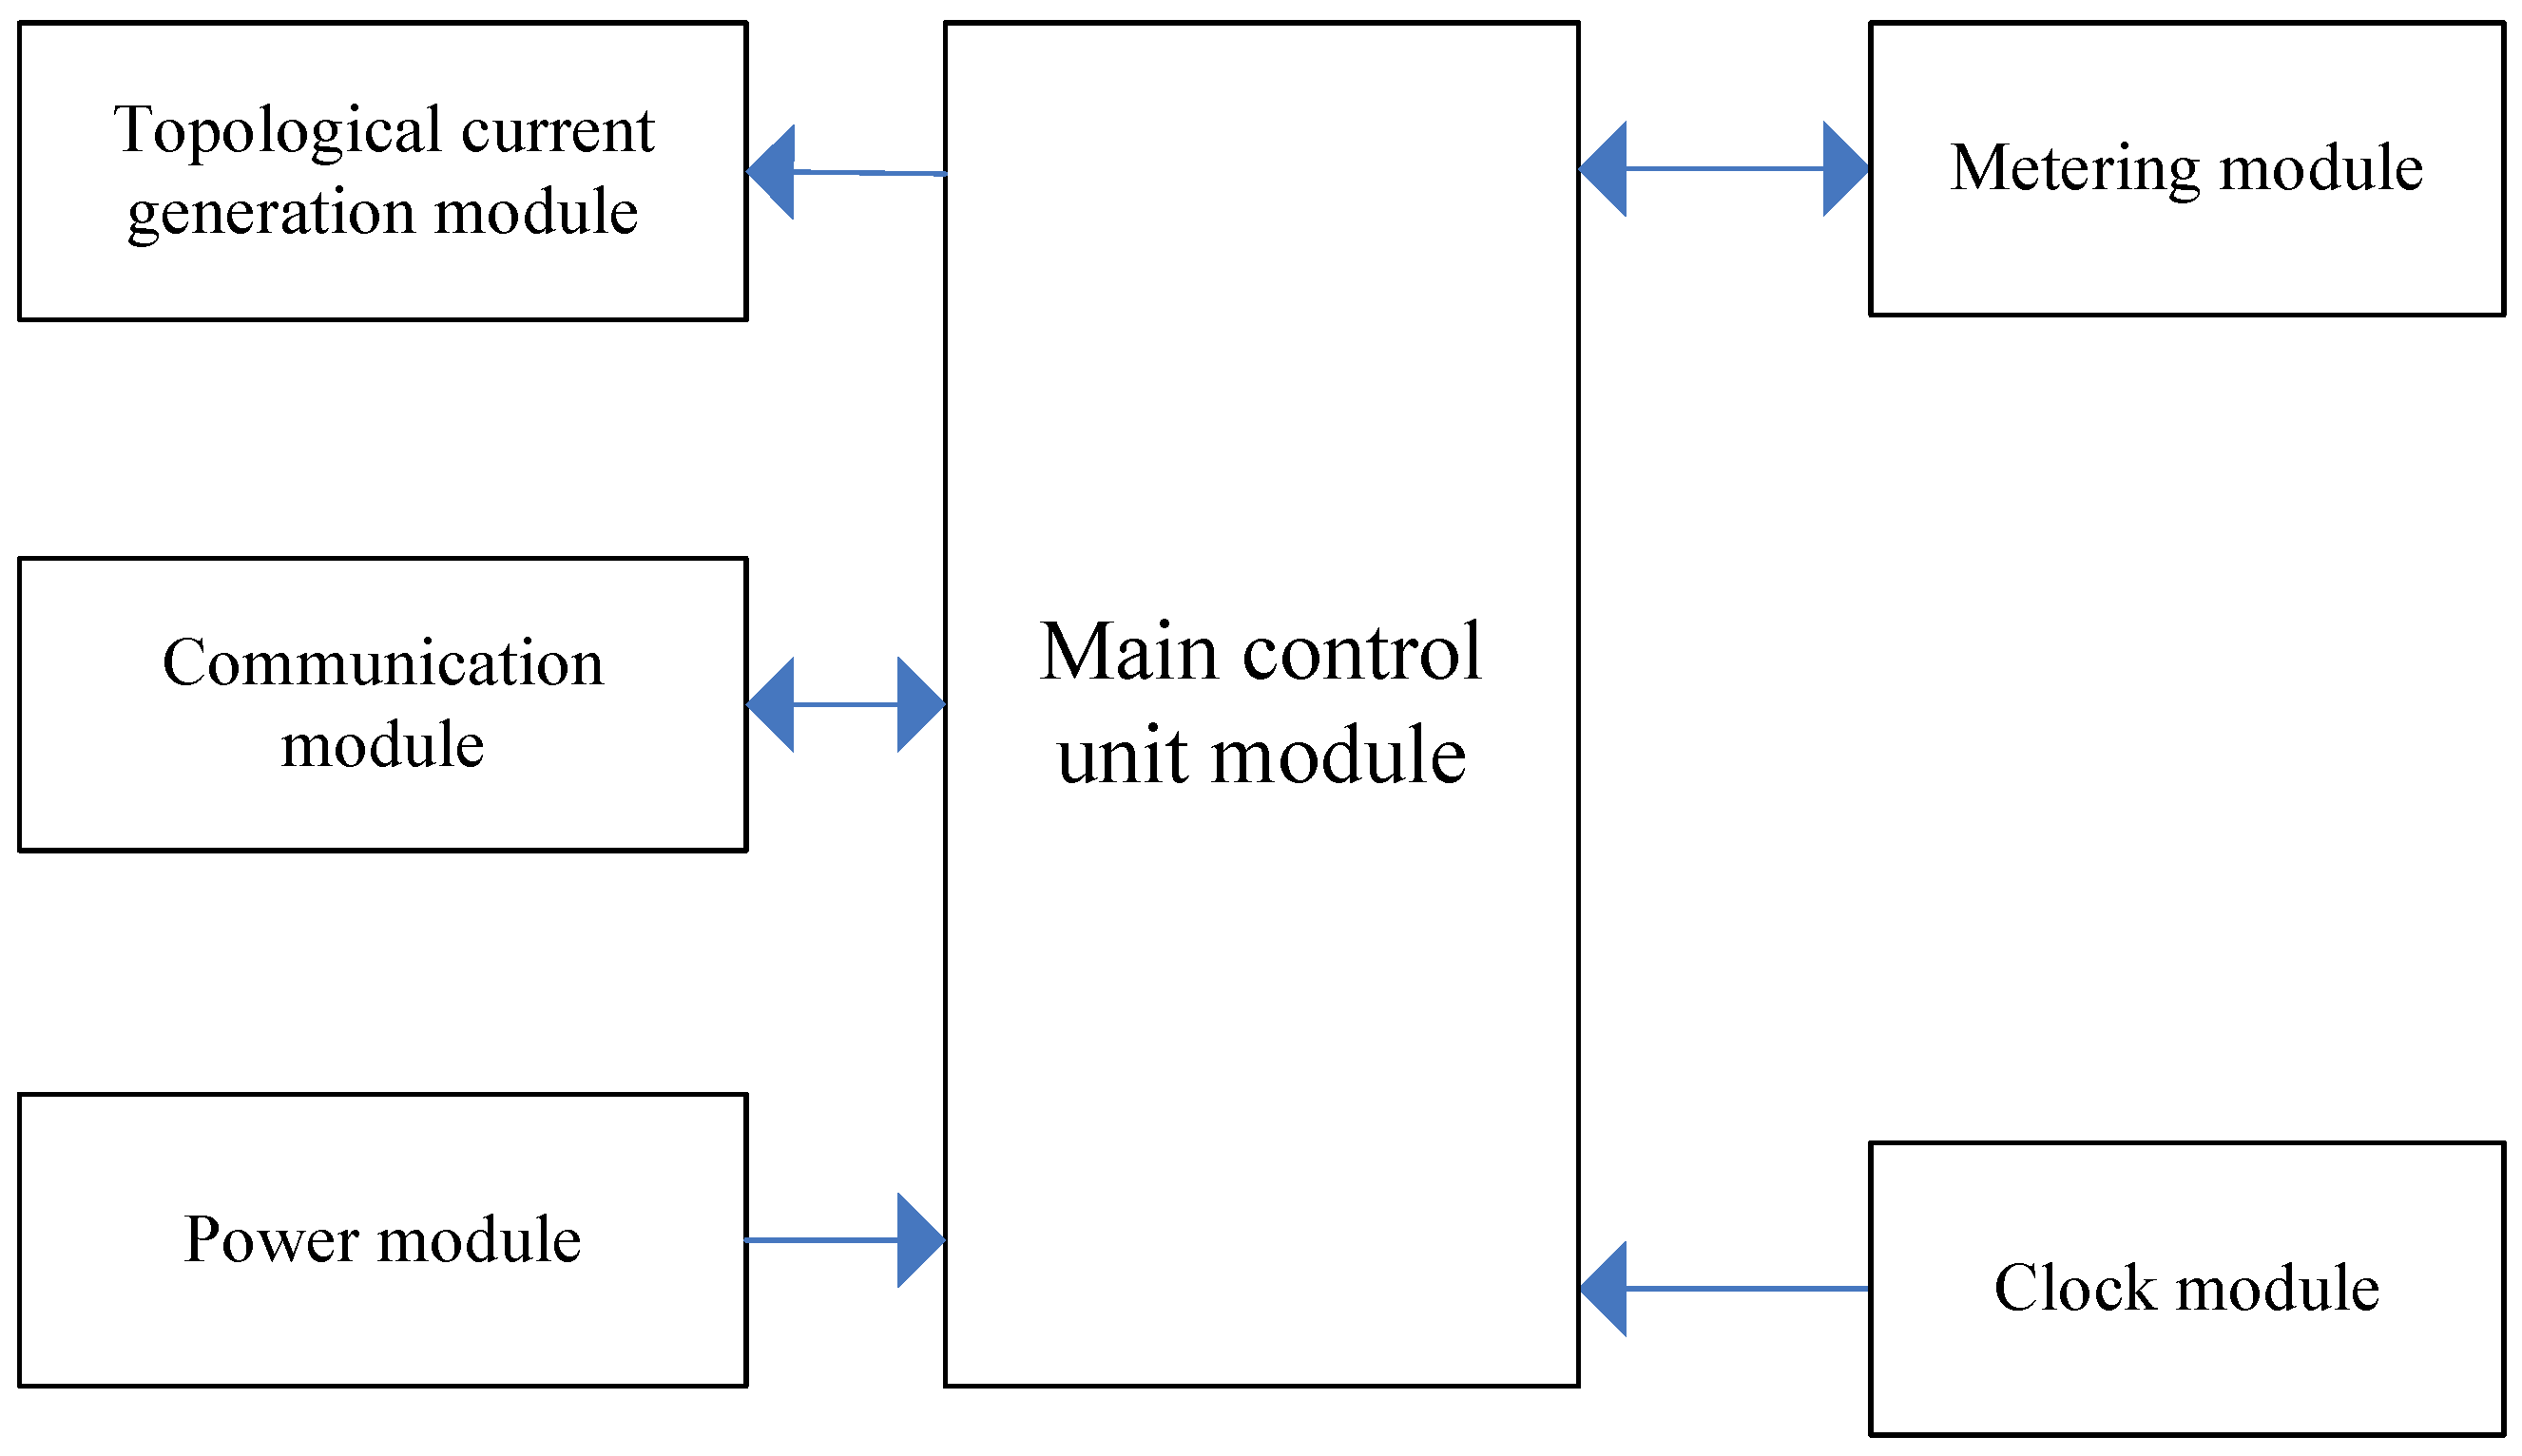
4. Design of the Intelligent Measurement Switch
4.1. Design of the Power Supply
4.2. Design of Current Sampling
4.3. Design of Functions and Interfaces
- (1)
- HPLC meter reading communication: Data transmission in low-voltage power lines is used in the meter network for data communication and meter reading with meters and concentrators.
- (2)
- Feature current transmitting: A frequency-adjustable current amplitude of 0.38–0.45 A is sent using a constant current load with the support of recording the last ~ten sent records, including the sent start time and end time. The number of local storage records should be no less than 10.
- (3)
- Topology identification: With the characteristic current receiving function, the sampling frequency of the receiving module’s current signal is not less than 4 kHz. Identification equipment should support the record storage of the relevant information of the received signal, including the receiving time of the signal’s identification, the phase to which the characteristic current belongs, the current size and signal noise, etc. The amount of signal information for storage is not less than 2000 while supporting the reading of historical records, and stored information is not lost when power is lost.
5. Experiment and Effect Analysis
6. Conclusions
Author Contributions
Funding
Data Availability Statement
Conflicts of Interest
References
- Liu, Y.L.; Jin, T.; Mohamed, M.A.; Wang, Q.J. A novel three-step classification approach based on time-dependent spectral features for complex power quality disturbances. IEEE Transact. Instrum. Meas. 2021, 70, 3000814. [Google Scholar] [CrossRef]
- Song, J.; Zhang, J.; Wen, H. Accurate dynamic phasor estimation by matrix pencil and Taylor weighted least squares method. IEEE Transact. Instrum. Meas. 2021, 70, 9002211. [Google Scholar] [CrossRef]
- Liu, Z.P.; Li, W.K.; Cheng, S.P. Control strategy and design of grid-connected microinverter based on interleaved flyback structure. China Meas. Test 2015, 41, 73–77+92. [Google Scholar]
- Lin, X.F.; Yu, J.R.; Yu, R.X.; Zhang, J.; Yan, Z.Z.; Wen, H. Improving small-signal stability of grid-connected inverter under weak grid by decoupling phase-lock loop and grid impedance. IEEE Transact. Ind. Electron. 2022, 69, 7040–7053. [Google Scholar] [CrossRef]
- Yang, J.X.; Xin, M.Y.; Ou, J.X.; Wang, J.R.; Song, Q. Distribution network line loss location and evaluation method study based on big data. China Meas. Test 2019, 45, 19–24. [Google Scholar]
- Yan, Z.Z.; Wen, H. Electricity theft detection base on extreme gradient boosting in AMI. IEEE Transact. Instrum. Meas. 2021, 70, 2504909. [Google Scholar] [CrossRef]
- Li, Y.; Liu, H.; Li, Z. Topology identification and inner desynchronization of Hindmarsh-Rose neural network. In Proceedings of the 2020 Chinese Control and Decision Conference (CCDC), Hefei, China, 1 August 2020; pp. 1642–1646. [Google Scholar]
- Chen, Y.; Chen, J.; Jiao, H.; Guo, Y.; Jiang, W.; Tang, H. Two-stage topology identification method for distribution network via clustering correction. In Proceedings of the 2019 IEEE Innovative Smart Grid Technologies—(ISGT Asia), Chengdu, China, 1 May 2019; pp. 280–284. [Google Scholar]
- Shen, Y.; Fu, X.; Giannakis, G.B.; Sidiropoulos, N.D. Topology identification of directed graphs via joint diagonalization of correlation matrices. IEEE Transact. Signal Inf. Process. Over Netw. 2020, 6, 271–283. [Google Scholar] [CrossRef]
- Li, S.; Gao, S.; Wu, J.; Xie, D.; Qi, L. Research on topology identification of distribution network under the background of big data. In Proceedings of the 2020 IEEE 4th Conference on Energy Internet and Energy System Integration (EI2), Wuhan, China, 30 October 2020; pp. 4294–4297. [Google Scholar]
- Xu, C.; Lei, Y.; Zou, Y. A method of low voltage topology identification. In Proceedings of the 2020 IEEE Conference on Telecommunications, Optics and Computer Science (TOCS), Shenyang, China, 11 December 2020; pp. 318–323. [Google Scholar]
- Chen, Y.; Jiang, T.; Lai, F. Automatic topology generation of 21 bit chipless radio frequency identification tags using a noniterative technique. IEEE Antennas Wirel. Propag. Lett. 2019, 18, 293–297. [Google Scholar] [CrossRef]
- Liu, Y.; Sun, J.; Chen, Q.; Xia, M. Distribution network topology error identification method based on D-PMU and branch state function. In Proceedings of the 2019 IEEE Innovative Smart Grid Technologies—Asia (ISGT Asia), Chengdu, China, 1 May 2019; pp. 821–826. [Google Scholar]
- Xiang, Z.; Huang, K.; Deng, W.; Yang, C. Blind topology identification for smart grid based on dictionary learning. In Proceedings of the 2019 IEEE Symposium Series on Computational Intelligence (SSCI), Xiamen, China, 20 February 2020; pp. 1319–1326. [Google Scholar]
- Deng, W.; Zhang, Z.; Duan, J.; Qiao, X.; Zhu, L.; Li, Y. Improved topology identification algorithm of distribution network mutual information. In Proceedings of the 2019 IEEE Sustainable Power and Energy Conference (iSPEC), Beijing, China, 1 November 2019; pp. 1791–1795. [Google Scholar]
- Van Waarde, H.J.; Tesi, P.; Camlibel, M.K. Topology identification of heterogeneous networks of linear systems. In Proceedings of the 2019 IEEE 58th Conference on Decision and Control (CDC), Nice, France, 1 December 2019; pp. 5513–5518. [Google Scholar]
- Farajollahi, M.; Shahsavari, A.; Mohsenian-Rad, H. Topology identification in distribution systems using line current sensors: An MILP approach. IEEE Transact. Smart Grid 2020, 11, 1159–1170. [Google Scholar] [CrossRef]
- Wang, Y.; Wu, X.; Lü, J.; Lu, J.; D’Souza, R.M. Topology identification in two-layer complex dynamical networks. IEEE Transact. Netw. Sci. Eng. 2020, 7, 538–548. [Google Scholar] [CrossRef]
- Coutino, M.; Isufi, E.; Maehara, T.; Leus, G. State-space network topology identification from partial observations. IEEE Transact. Signal Inf. Process. Over Netw. 2020, 6, 211–225. [Google Scholar] [CrossRef]
- Zhao, J.; Li, L.; Xu, Z.; Wang, X.; Wang, H.; Shao, X. Full-scale distribution system topology identification using Markov random field. IEEE Transact. Smart Grid 2020, 11, 4714–4726. [Google Scholar] [CrossRef]
- Cavraro, G.; Bernstein, A. Bus clustering for distribution grid topology identification. IEEE Transact. Smart Grid 2020, 11, 4080–4089. [Google Scholar] [CrossRef]


| Project | Coding Method Definition | |
|---|---|---|
| Data frame format | Data sync header + start bit + data bit + insert bit + parity bit + end bit | |
| Data sync header | 6 digits ‘1’ (i.e., no current time lasting for more than 360 ms) | |
| Start bit | 1 bit ‘0’ | |
| Data | Signature | A total of 24 bits, with 1 insertion bit inserted every 4 bits. A total of 30 bits; the inserted bit is opposite to the previous data bit. |
| Check code | A total of 16 bits, with an insertion bit inserted every 4 bits. A total of 20 bits; the inserted bit is opposite to the previous data bit. | |
| Check (message authentication code) | A total of 8 bits, with 1 insert bit inserted every 4 bits. A total of 10 bits; the inserted bit is opposite to the previous data bit. | |
| End bit | 1-bit ‘0’ | |
| HPLC operating frequency band | 2~12 M, 2.5~5.7 M, 0.7~3 M, 1.7~3 MHz |
| Serial communication rate | 1200 bps, 2400 bps, 4800 bps, 9600 bps |
| Operating frequency | 50 Hz (45–55 Hz) |
| Operating voltage AC | 220 VAC (176~264 V) |
| Operating voltage DC | Analog power supply for communication modules, provided by the base board voltage range; 12 ± 1 V |
| Operating temperature | −40 °C~+85 °C |
| Relative humidity | ≤75% |
| Communication tange | Entire distribution substation area |
| Damp heat | 55 °C/90% R.H |
| Characteristic current emitting Circuit devices: temperature rise | ≤70 °C |
| Add a 100 Ω resistor to the whole board | Temperature rise ≤55 °C |
| Pin | Input/Output | PIN | Description |
|---|---|---|---|
| 1 | \ | N | 220 V zero wire |
| 2 | \ | L | 220 V fire wire |
| 3 | \ | HPLC_N | HPLC differential coupling signal (coupling transformer required) |
| 4 | \ | HPLC_P | HPLC differential coupling signal (coupling transformer required) |
| 5 | GND | GND | Power ground |
| 6 | O | TXD_MCU | TXD serial port for communication with circuit breaker master (for module definition) |
| 7 | I | RXD_MCU | Communication with circuit breaker master serial port RXD (for module definition) |
| 8 | I/O | GPIO24 | GPIO24 port (reserved) |
| 9 | I | ZC_A | A-phase over-zero signal input |
| 10 | I | EVENT | Event up, active high, need to connect pull-down 10 K resistor |
| 11 | I | RST | Module resets the signal input; low-level reset |
| 12 | I | IA+ | A-phase current transformer positive input ±0.4 V |
| 13 | I | IA− | A-phase current transformer negative input ±0.4 V |
| 14 | I | IB+ | B-phase current transformer positive input ±0.4 V |
| 15 | I | IB− | B-phase current transformer negative input ±0.4 V |
| 16 | I | IC+ | C-phase current transformer positive input ±0.4 V |
| 17 | I | IC− | C-phase current transformer negative input ±0.4 V |
| 18 | ADC/I/O | ADC3_CH2/PM_ GPIO13 | ADC3_CH2/PM_GPIO13 (reserved) |
| 19 | PWR | 3.3 V_OUT | Reserved for external 3.3 V (supercapacitor charging) %; it is recommended to use the bottom 3.3 V to charge the supercapacitor |
| 20 | I | 12 V_ADC | 12 V power-down detection signal input |
| 21 | PWR | 12 V | Module DC power supply interface; input range of 12 ± 1 V, ripple 2% |
| 22 | GND | GND | Power Ground |
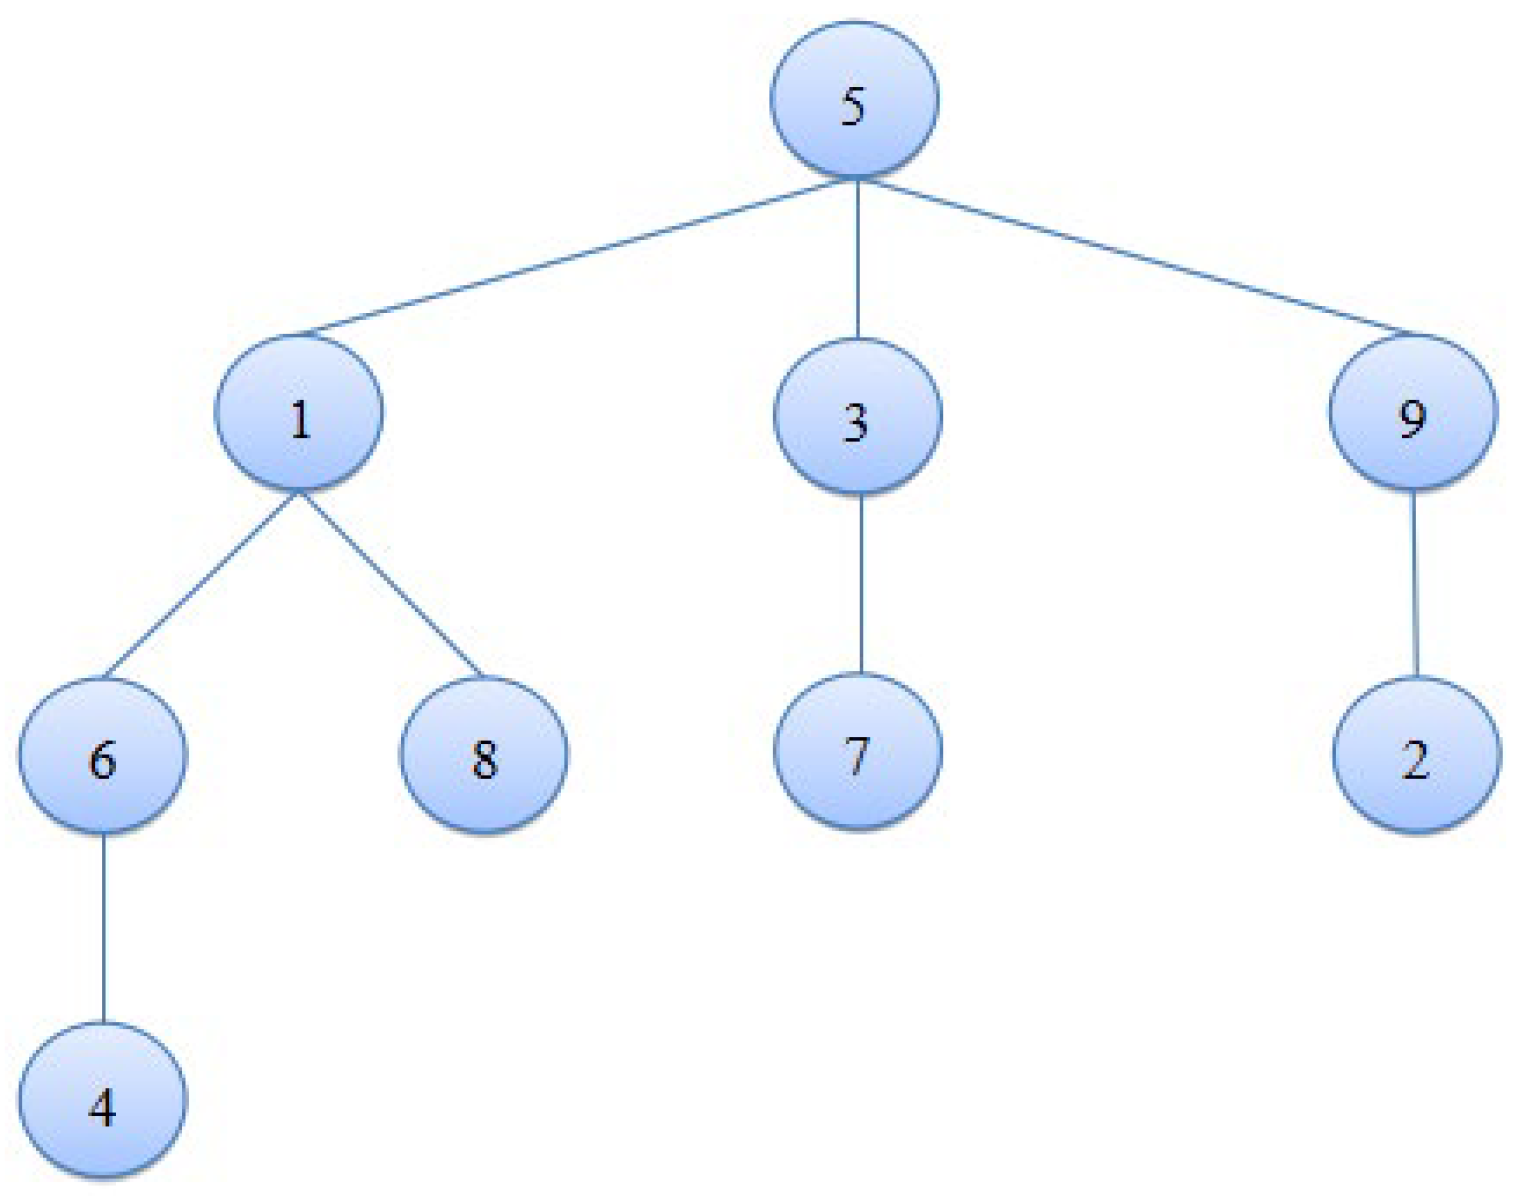
| Switch to Send Topological Signal | Switches That Recognize Topological Signals | Level |
|---|---|---|
| ① | ① ⑤ | 2 |
| ② | ② ⑤ ⑨ | 3 |
| ③ | ③ ⑤ | 2 |
| ④ | ① ④ ⑤ ⑥ | 4 |
| ⑤ | ⑤ | 1 |
| ⑥ | ① ⑤ ⑥ | 3 |
| ⑦ | ③ ⑤ ⑦ | 3 |
| ⑧ | ① ⑤ ⑧ | 3 |
| ⑨ | ⑤ ⑨ | 2 |
| No. | Major Test Items | Test Sub-Item | Center Frequency | Characteristic Code | Test Results |
|---|---|---|---|---|---|
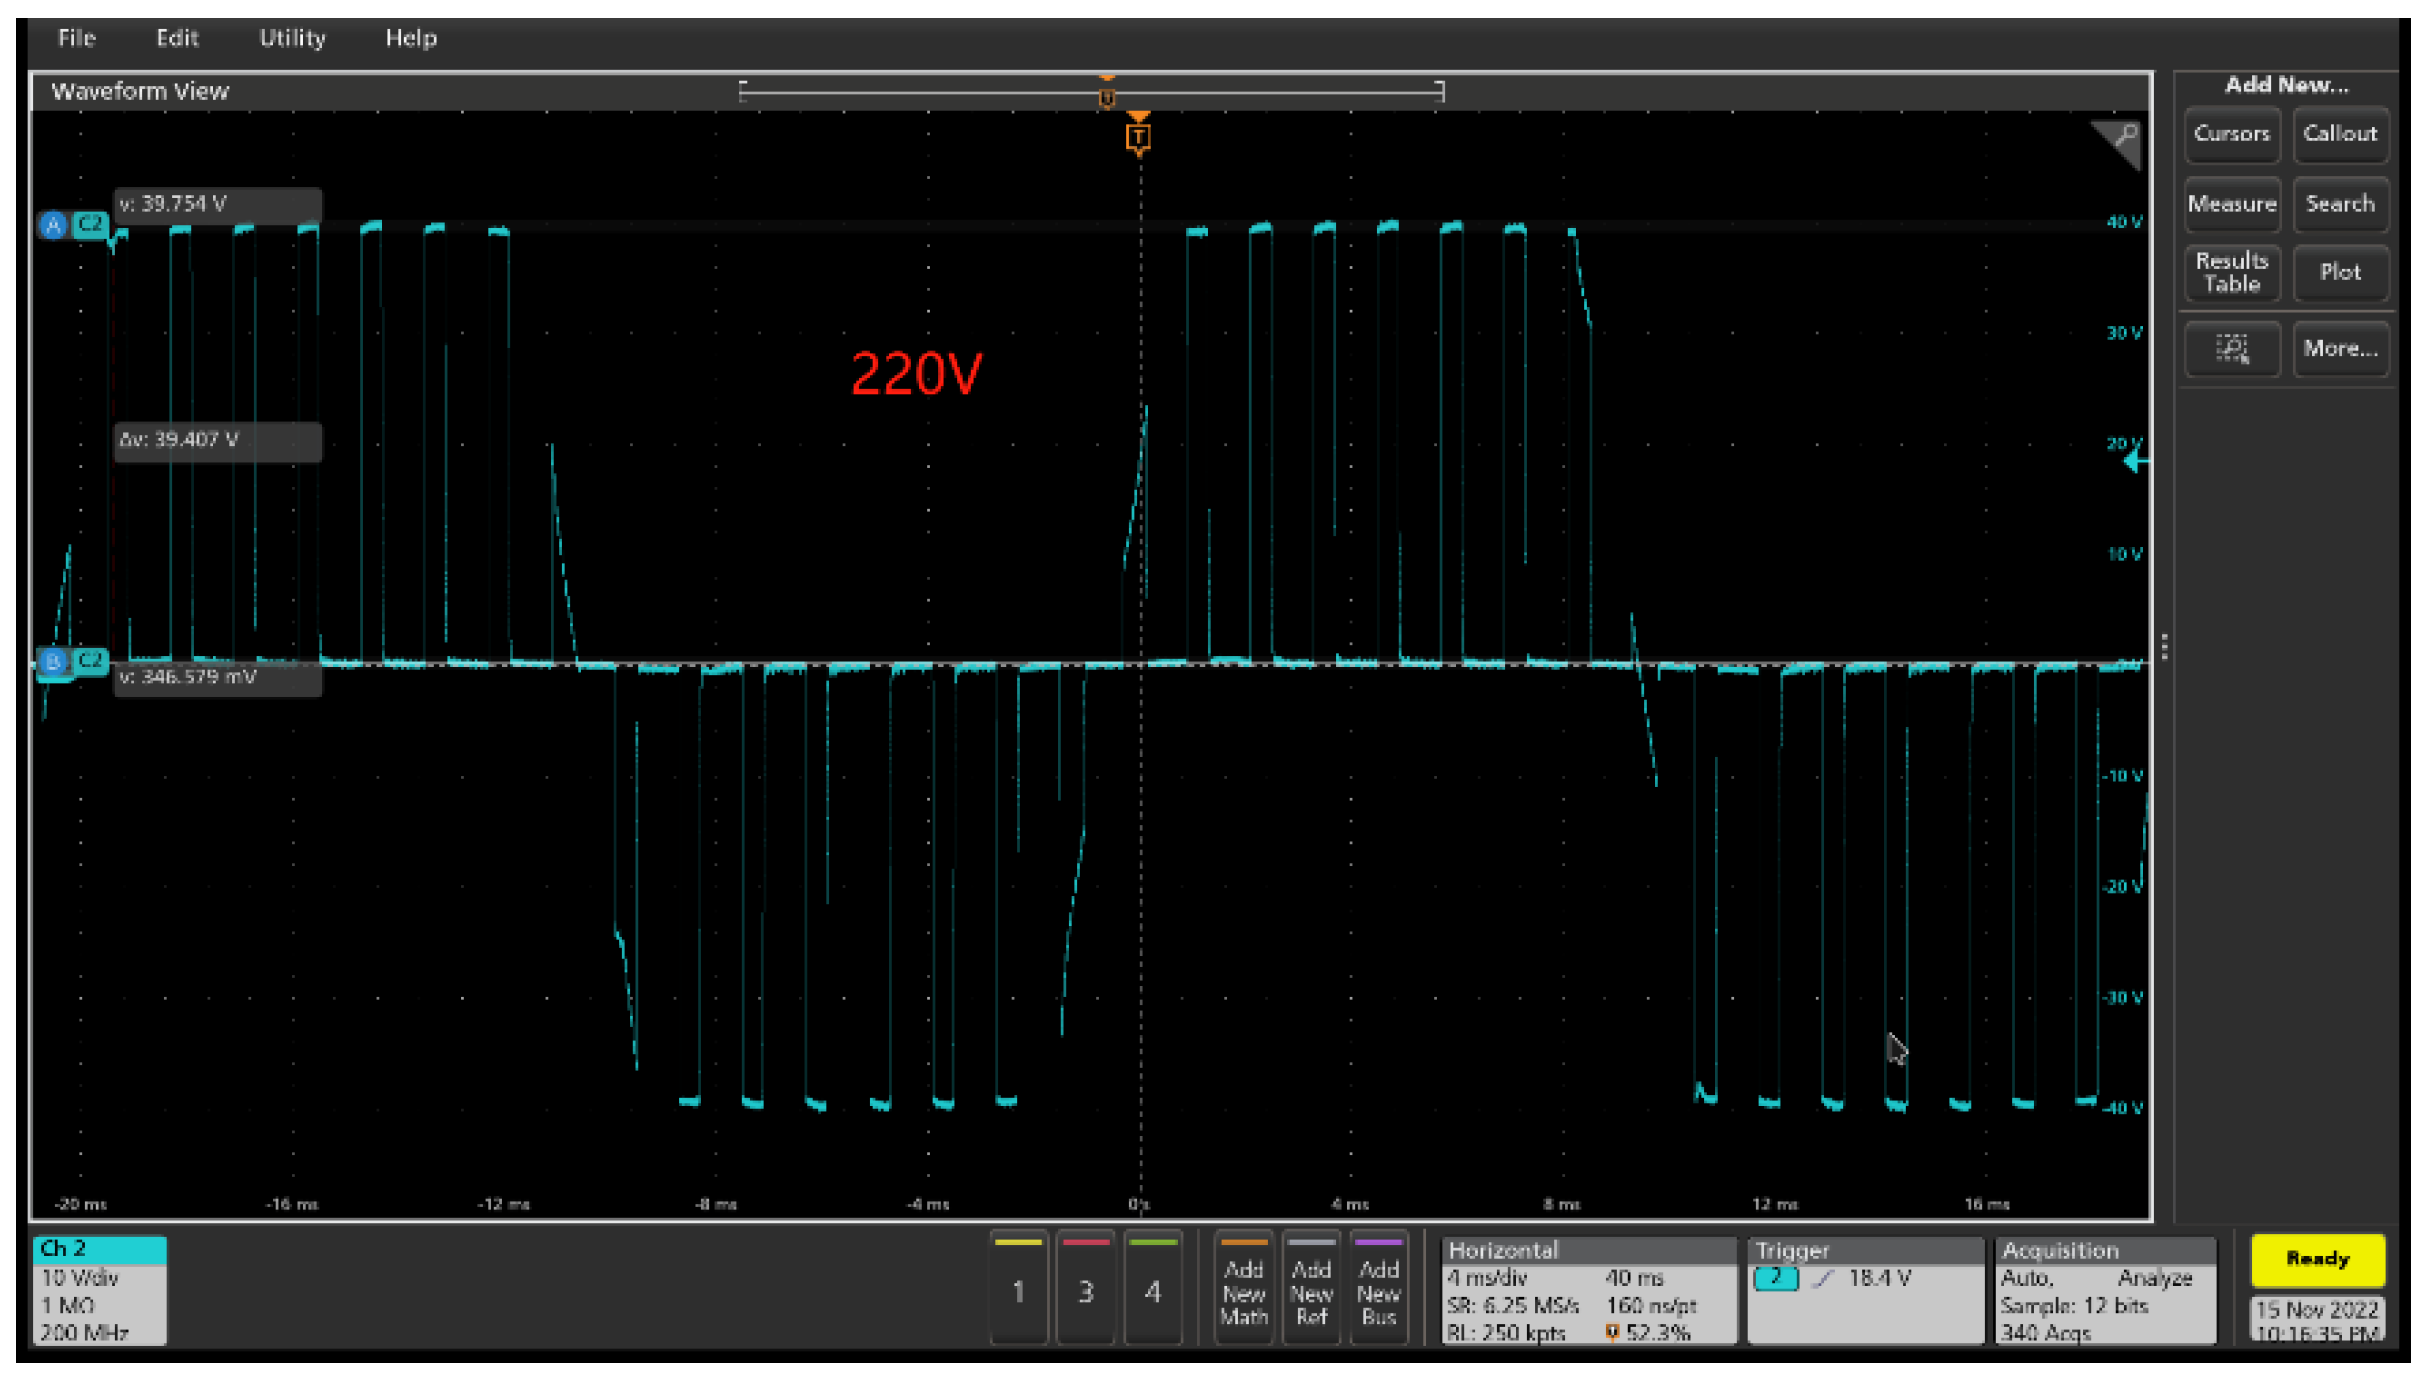
| 1 | Sending device current signal characteristics detection | 220 V_50.5 Hz Topology identification detection | 833.33 Hz | AAE9 | pass |
| 625 Hz | AAEA | pass | |||
| 666.66 Hz | AAE5 | pass | |||
| 1333.33 Hz | AAE3 | pass | |||
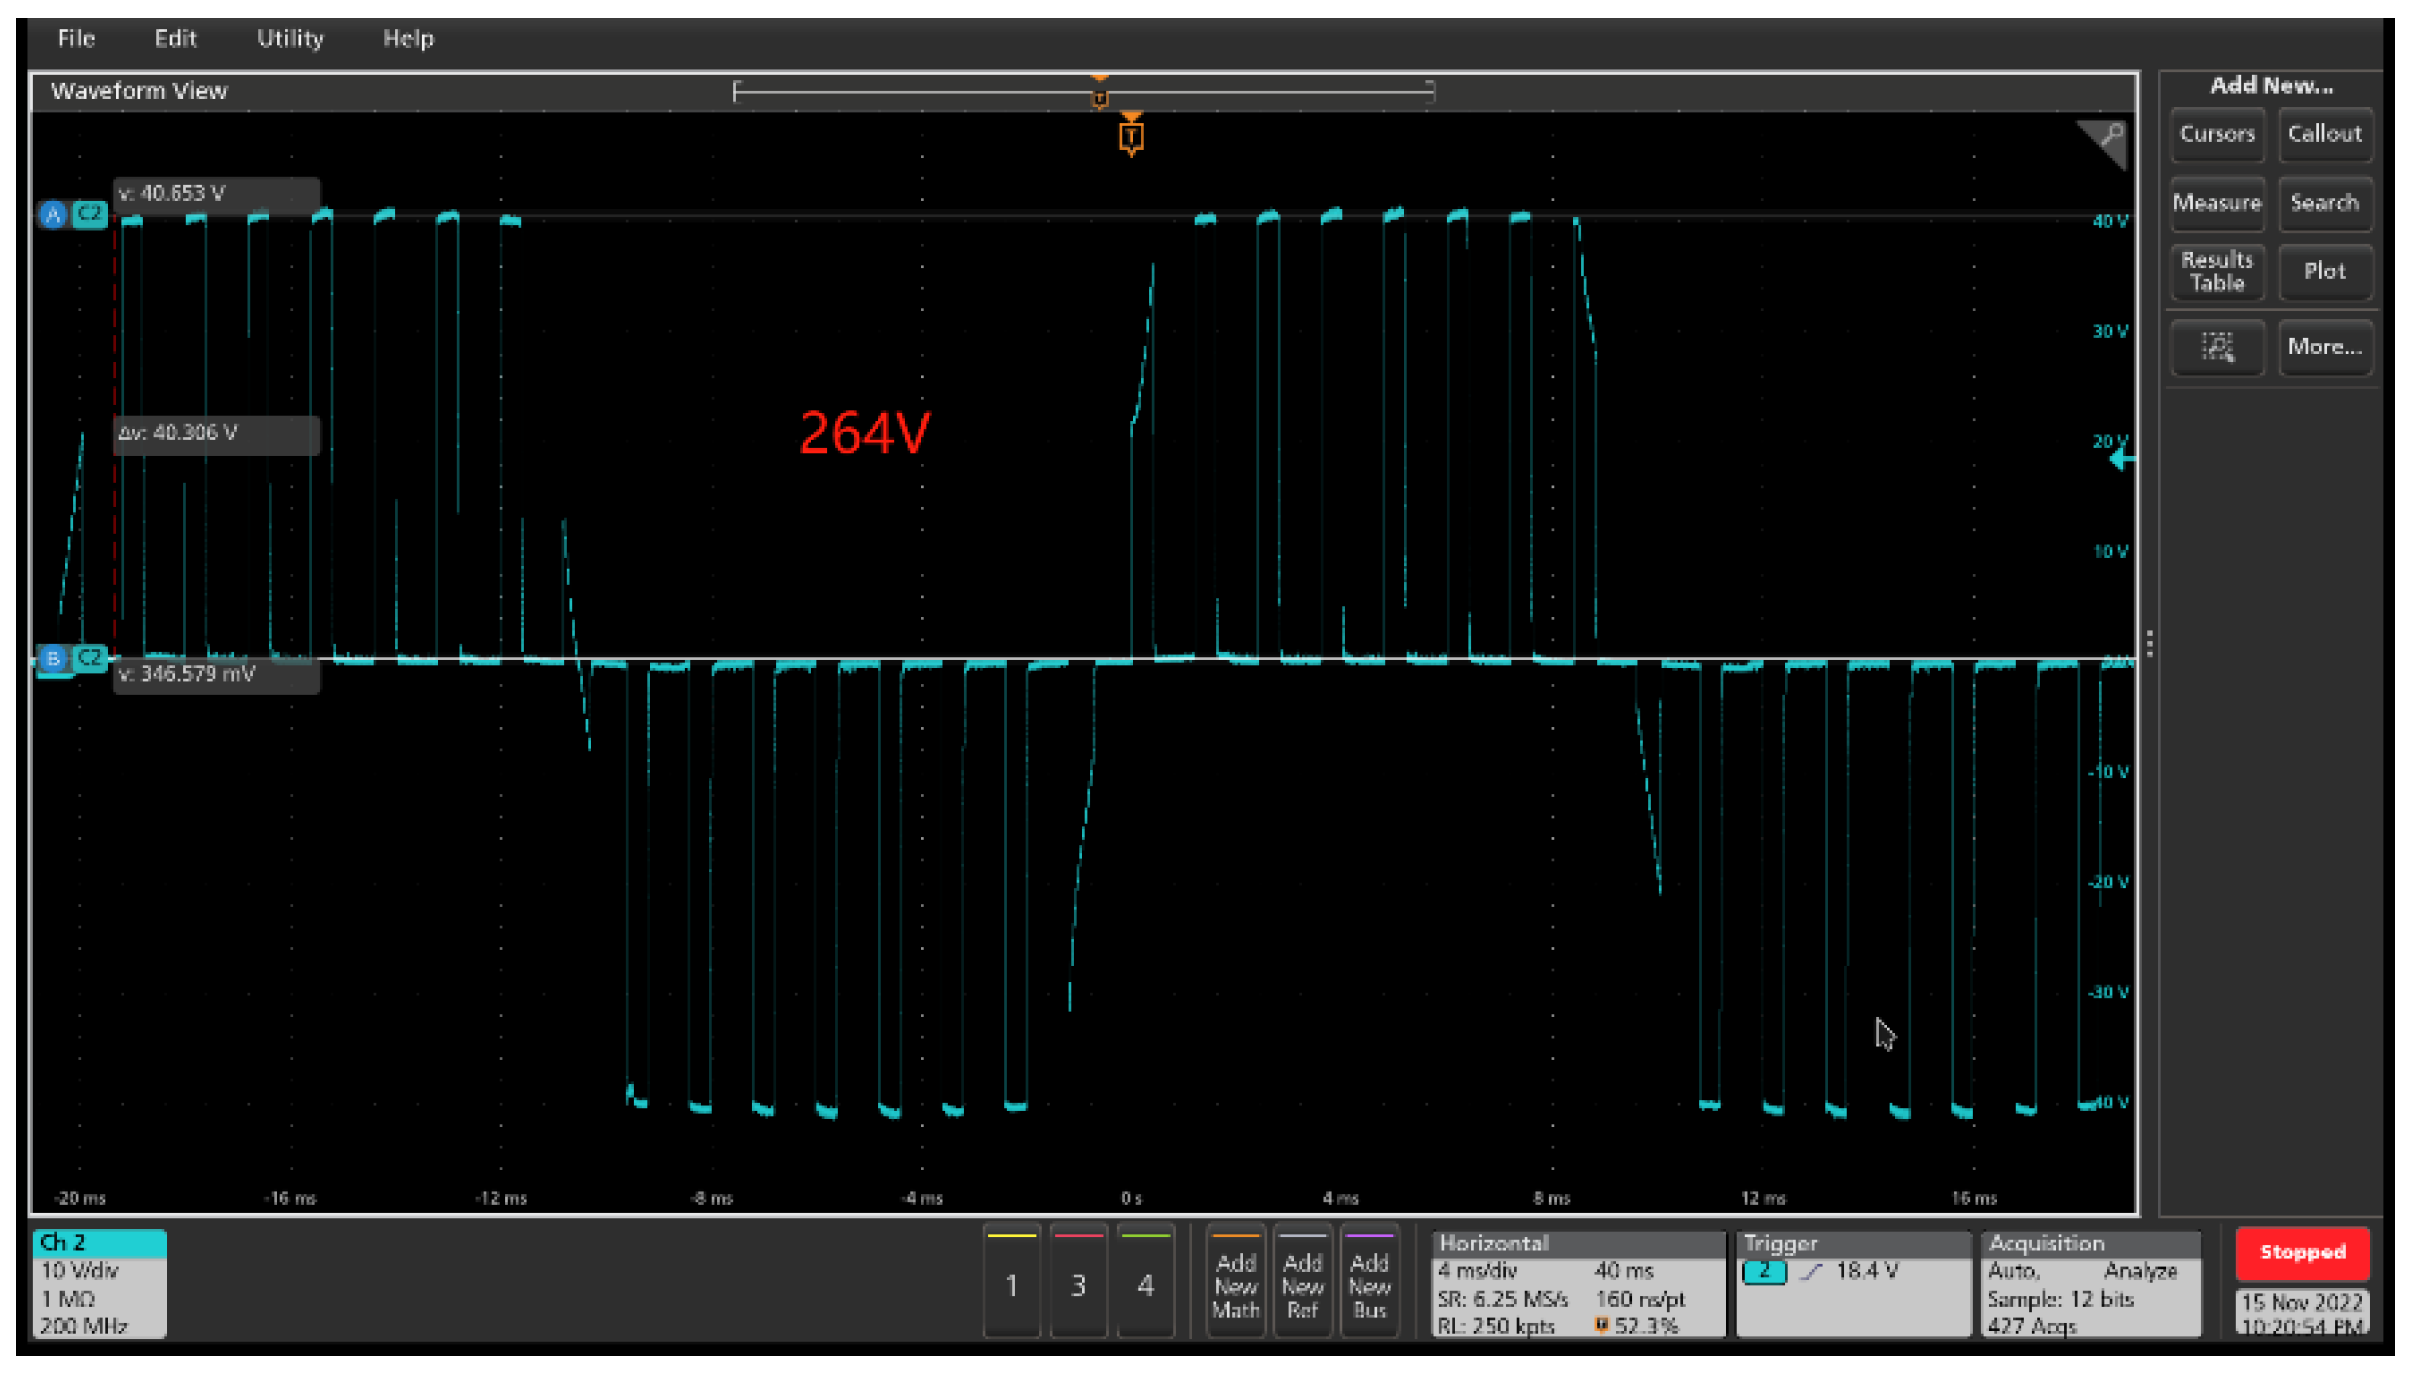
| 264 V _ 50 Hz Topology identification detection | 833.33 Hz | AAE9 | pass | ||
| 625 Hz | AAEA | pass | |||
| 666.66 Hz | AAE5 | pass | |||
| 1333.33 Hz | AAE3 | pass | |||
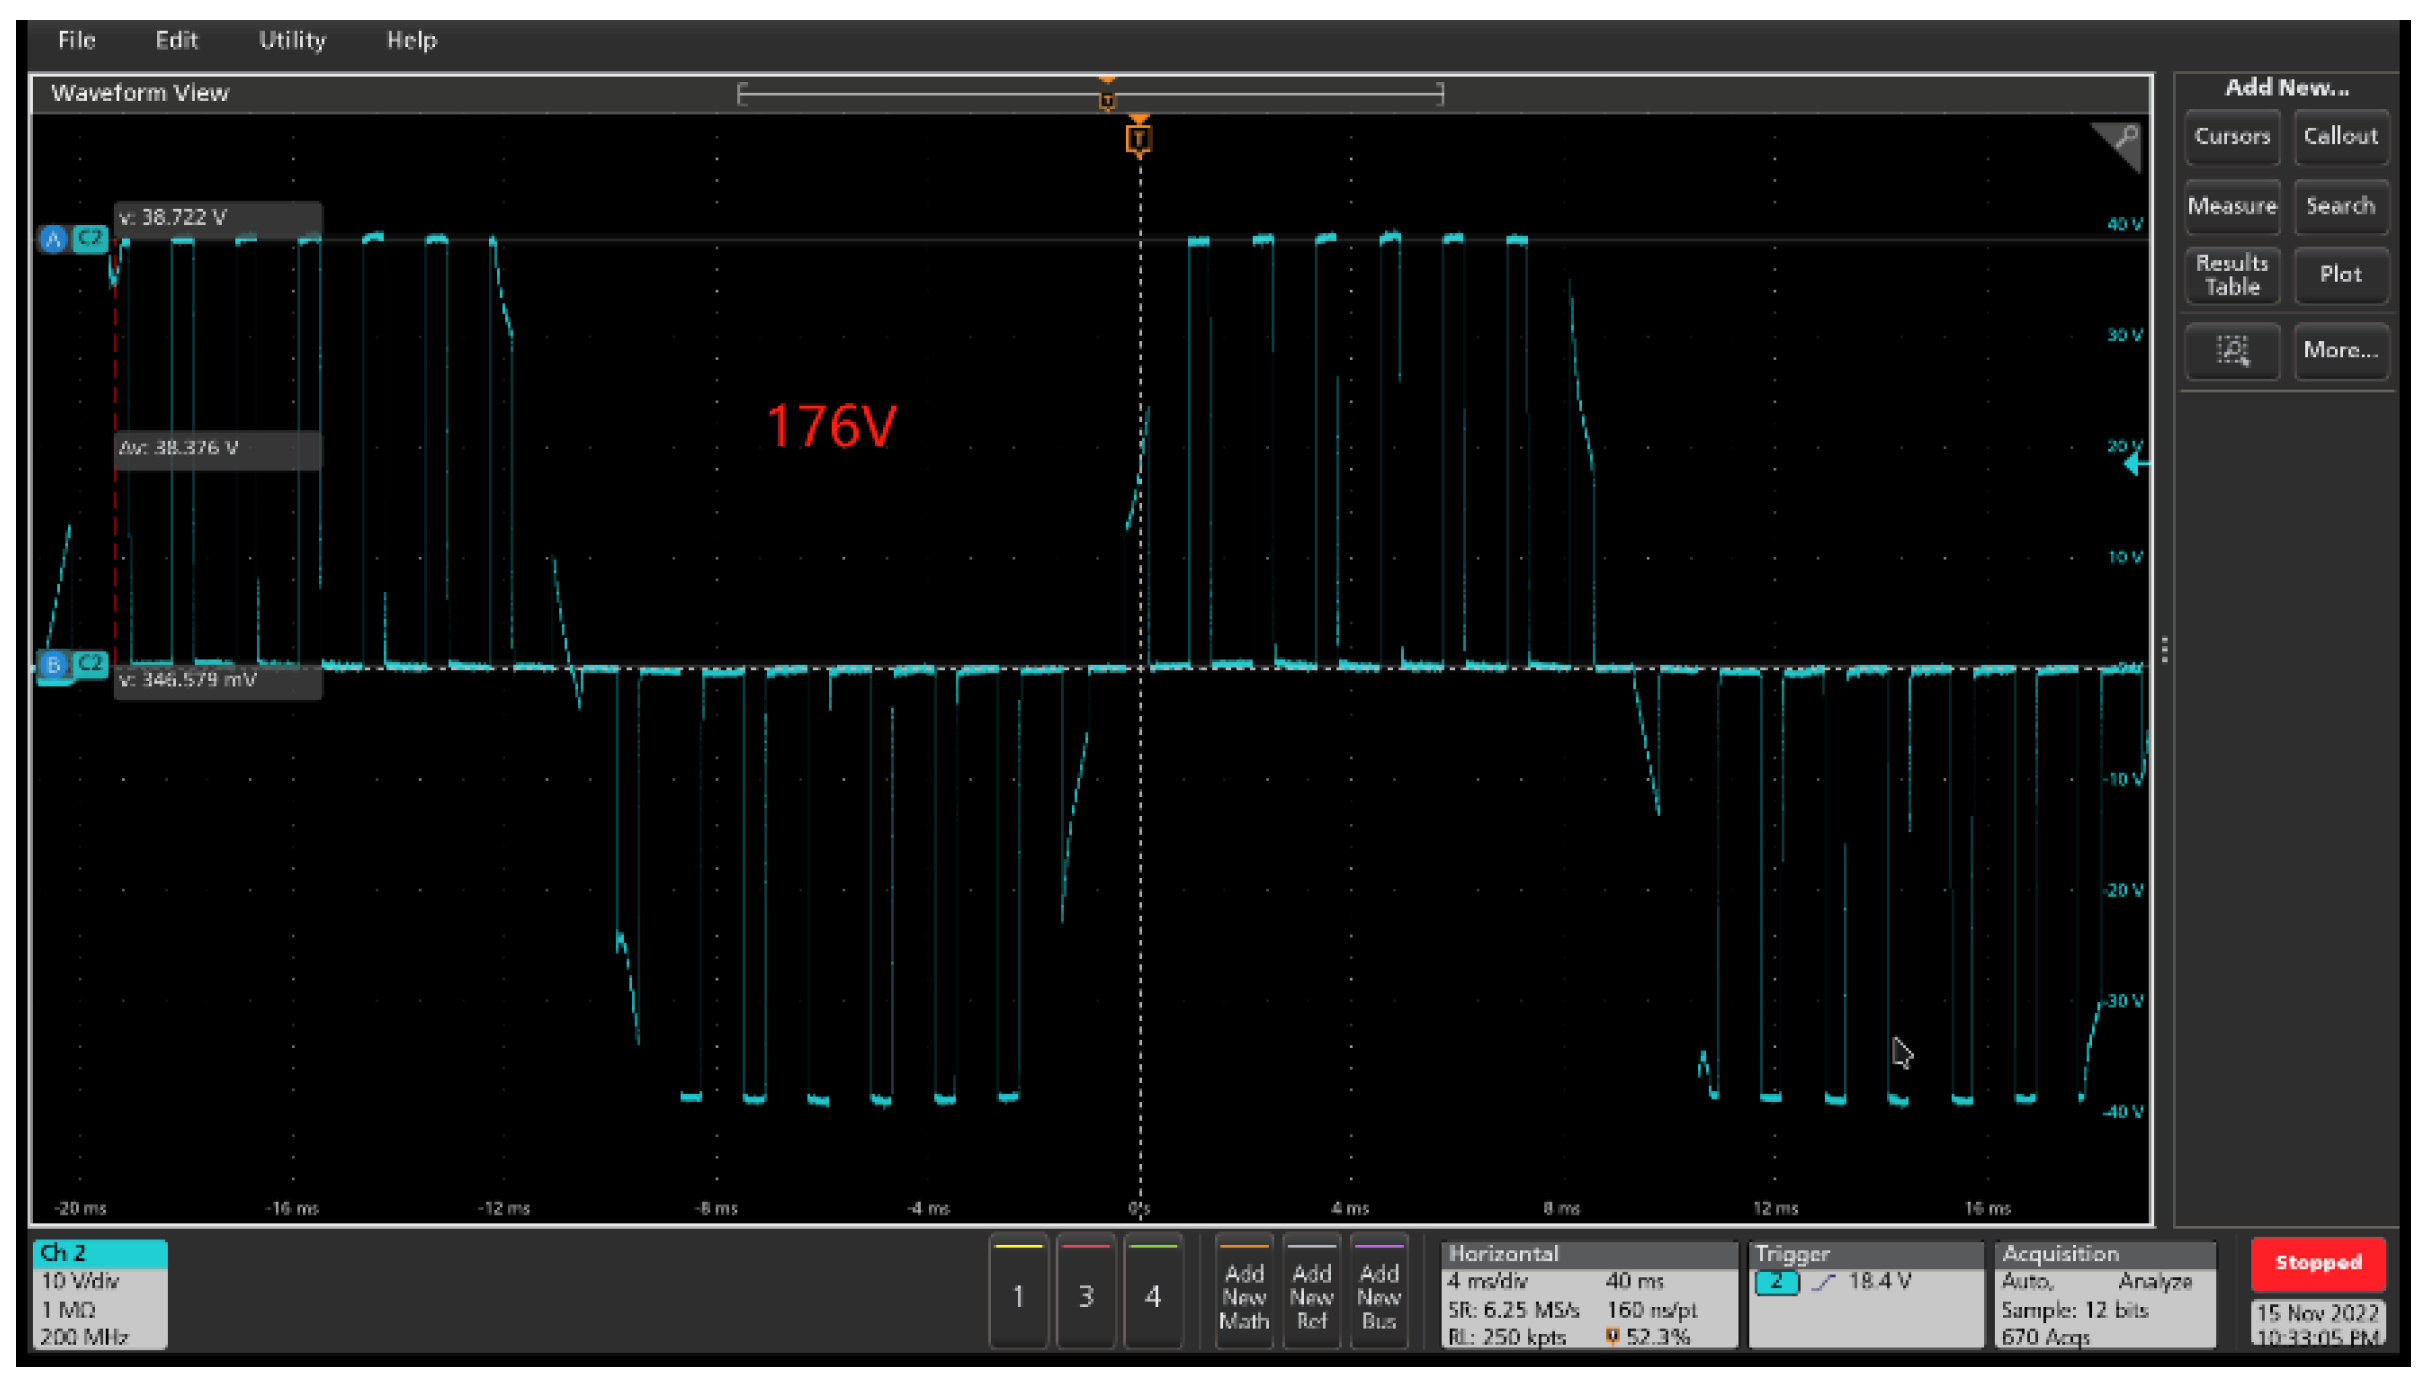
| 176 V _ 50 Hz Topology identification detection | 833.33 Hz | AAE9 | pass | ||
| 625 Hz | AAEA | pass | |||
| 666.66 Hz | AAE5 | pass | |||
| 1333.33 Hz | AAE3 | pass | |||
| 220 V _ 50.5 Hz Topology identification detection | 833.33 Hz | AAE9 | pass | ||
| 625 Hz | AAEA | pass | |||
| 666.66 Hz | AAE5 | pass | |||
| 1333.33 Hz | AAE3 | pass | |||
| 220 V _ 49.5 Hz Topology identification detection | 833.33 Hz | AAE9 | pass | ||
| 625 Hz | AAEA | pass | |||
| 666.66 Hz | AAE5 | pass | |||
| 1333.33 Hz | AAE3 | pass | |||
| 2 | Identification device identification function detection | 220 V _ 50 Hz | 833.33 Hz, AAE5 (Noiseless) | AAE5 | pass |
| 220 V _ 50.5 Hz | 833.33 Hz, AAE9 (Noise1) | AAE9 | pass | ||
| 176 V _ 19.5 Hz | 625 Hz, AAEA (Noiseless) | AAEA | pass | ||
| 3 | Identification equipment anti-interference capability testing | 220 V _ 50 Hz | Noise2 | AAE9 | pass |
| 220 V _ 50 Hz | Noise3 | AAE9 | pass | ||
| 220 V _ 50 Hz | Noise4 | AAE9 | pass | ||
| 4 | Sending device reliability | 220 V _ 50 Hz | 833.33 Hz Continuous test 20 times under | AAE9 | pass |
| 264 V _ 50 Hz | 833.33 Hz Continuous test 20 times under | AAE9 | pass | ||
| 176 V _ 50 Hz | 833.33 Hz Continuous test 20 times under | AAE9 | pass | ||
| 220 V _ 50.5 Hz | 833.33 Hz Continuous test 20 times under | AAE9 | pass | ||
| 220 V _ 49.5 Hz | 833.33 Hz Continuous test 20 times under | AAE9 | pass |
Publisher’s Note: MDPI stays neutral with regard to jurisdictional claims in published maps and institutional affiliations. |
© 2022 by the authors. Licensee MDPI, Basel, Switzerland. This article is an open access article distributed under the terms and conditions of the Creative Commons Attribution (CC BY) license (https://creativecommons.org/licenses/by/4.0/).
Share and Cite
Xiong, D.; Du, J. Research on Topology Recognition Technology Based on Intelligent Measurement Switches. Electronics 2022, 11, 3903. https://doi.org/10.3390/electronics11233903
Xiong D, Du J. Research on Topology Recognition Technology Based on Intelligent Measurement Switches. Electronics. 2022; 11(23):3903. https://doi.org/10.3390/electronics11233903
Chicago/Turabian StyleXiong, Dezhi, and Jingjuan Du. 2022. "Research on Topology Recognition Technology Based on Intelligent Measurement Switches" Electronics 11, no. 23: 3903. https://doi.org/10.3390/electronics11233903
APA StyleXiong, D., & Du, J. (2022). Research on Topology Recognition Technology Based on Intelligent Measurement Switches. Electronics, 11(23), 3903. https://doi.org/10.3390/electronics11233903