


Recognition of Emotions in Speech Using Convolutional Neural Networks on Different Datasets
 ,
,  , , and
Abstract
1. Introduction
2. Related Works
3. Selected Approach
4. Datasets
4.1. CREMA-D
4.2. RAVDESS
4.3. SAVEE
4.4. TESS
4.5. IEMOCAP
4.6. Comments on Datasets
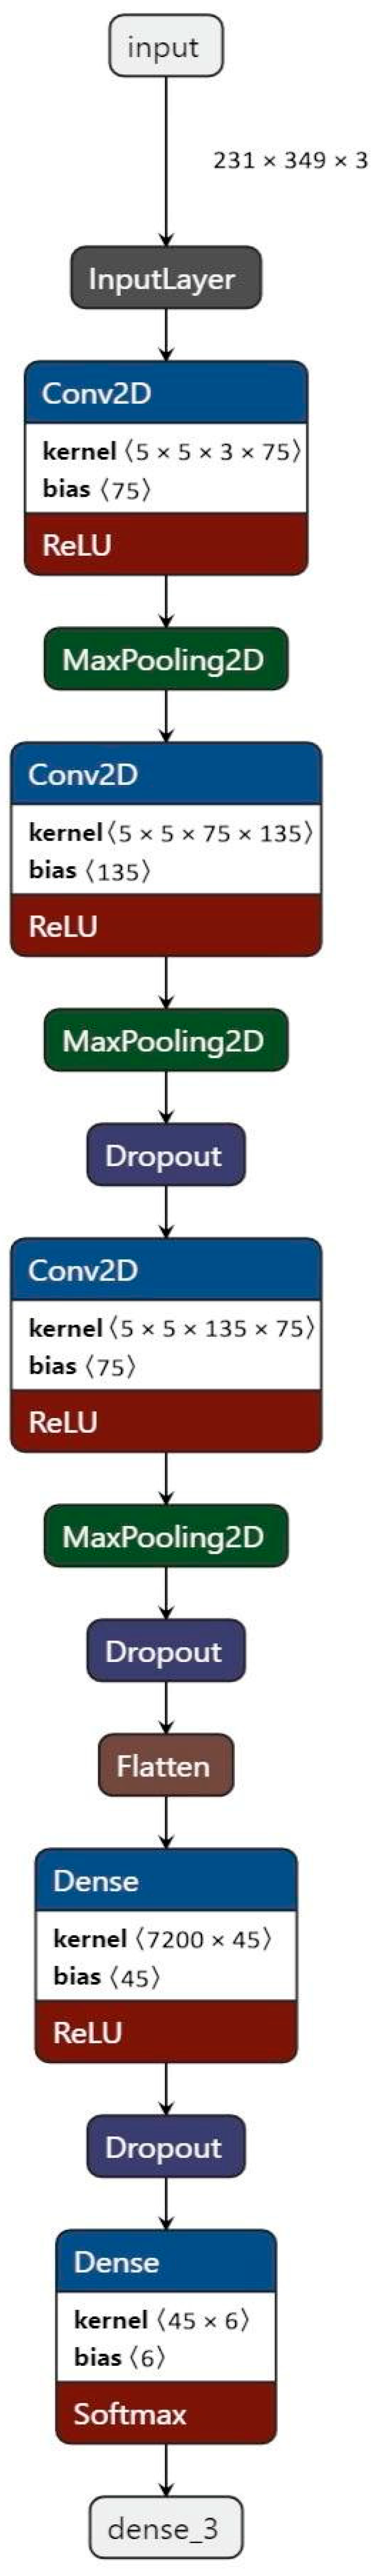
5. Architecture
6. Performance of Different Feature Extraction Methods
7. The Importance of Data Division into Training and Test Sets
8. Human-Based Speech Emotion Classification on CREMA-D
9. Conclusions
Author Contributions
Funding
Data Availability Statement
Conflicts of Interest
References
- Milner, R.; Jalal, M.A.; Ng, R.W.M.; Hain, T. A Cross-Corpus Study on Speech Emotion Recognition. In Proceedings of the 2019 IEEE Automatic Speech Recognition and Understanding Workshop (ASRU), Sentosa, Singapore, 14–18 December 2019. [Google Scholar] [CrossRef]
- el Ayadi, M.; Kamel, M.S.; Karray, F. Survey on speech emotion recognition: Features, classification schemes, and databases. Pattern Recognit. 2011, 44, 572–587. [Google Scholar] [CrossRef]
- TTsouvalas, V.; Ozcelebi, T.; Meratnia, N. Privacy-preserving Speech Emotion Recognition through Semi-Supervised Federated Learning. In Proceedings of the 2022 IEEE International Conference on Pervasive Computing and Communications Workshops and other Affiliated Events (PerCom Workshops), Pisa, Italy, 21–25 March 2022. [Google Scholar]
- Deschamps-Berger, T.; Lamel, L.; Devillers, L. End-to-End Speech Emotion Recognition: Challenges of Real-Life Emergency Call Centers Data Recordings. In Proceedings of the 2021 9th International Conference on Affective Computing and Intelligent Interaction (ACII), Nara, Japan, 28 September–1 October 2021. [Google Scholar] [CrossRef]
- Ristea, N.-C.; Ionescu, R.T. Self-Paced Ensemble Learning for Speech and Audio Classification. arXiv 2021, arXiv:2103.11988. [Google Scholar]
- Etienne, C.; Fidanza, G.; Petrovskii, A.; Devillers, L.; Schmauch, B. CNN+LSTM Architecture for Speech Emotion Recognition with Data Augmentation. arXiv 2018, arXiv:1802.05630. [Google Scholar] [CrossRef]
- Badshah, A.M.; Ahmad, J.; Rahim, N.; Baik, S.W. Speech Emotion Recognition from Spectrograms with Deep Convolutional Neural Network. In Proceedings of the 2017 International Conference on Platform Technology and Service (PlatCon), Busan, Republic of Korea, 13–15 February 2017. [Google Scholar] [CrossRef]
- Padi, S.; Sadjadi, S.O.; Sriram, R.D.; Manocha, D. Improved Speech Emotion Recognition using Transfer Learning and Spectrogram Augmentation. In Proceedings of the 2021 International Conference on Multimodal Interaction, Montreal, QC, Canada, 18–22 October 2021. [Google Scholar] [CrossRef]
- Lee, K.H.; Kim, D.H. Design of a Convolutional Neural Network for Speech Emotion Recognition. In Proceedings of the 2020 International Conference on Information and Communication Technology Convergence (ICTC), Jeju, Republic of Korea, 21–23 October 2020; pp. 1332–1335. [Google Scholar] [CrossRef]
- Wani, T.M.; Gunawan, T.S.; Qadri, S.A.A.; Mansor, H.; Kartiwi, M.; Ismail, N. Speech Emotion Recognition using Convolution Neural Networks and Deep Stride Convolutional Neural Networks. In Proceedings of the 2020 6th International Conference on Wireless and Telematics (ICWT), Yogyakarta, Indonesia, 3–4 September 2020; pp. 1–6. [Google Scholar] [CrossRef]
- Oord, A.; Dieleman, S.; Zen, H.; Simonyan, K.; Vinyals, O.; Graves, A.; Kalchbrenner, N.; Senior, A.; Kavukcuoglu, K. WaveNet: A Generative Model for Raw Audio. arXiv, 2016; arXiv:1609.03499. [Google Scholar]
- Pandey, S.K.; Shekhawat, H.S.; Prasanna, S.R.M. Emotion Recognition from Raw Speech using Wavenet. In Proceedings of the TENCON 2019—2019 IEEE Region 10 Conference (TENCON), Kochi, India, 17–20 October 2019; pp. 1292–1297. [Google Scholar]
- Wang, J.; Xue, M.; Culhane, R.; Diao, E.; Ding, J.; Tarokh, V. Speech Emotion Recognition with Dual-Sequence LSTM Architecture. In Proceedings of the ICASSP 2020—2020 IEEE International Conference on Acoustics, Speech and Signal Processing (ICASSP), Barcelona, Spain, 4–8 May 2020; pp. 6474–6478. [Google Scholar] [CrossRef]
- Zhang, W.; Jia, Y. A Study on Speech Emotion Recognition Model Based on Mel-Spectrogram and CapsNet. In Proceedings of the 2021 3rd International Academic Exchange Conference on Science and Technology Innovation (IAECST), Guangzhou, China, 10–12 December 2021; pp. 231–235. [Google Scholar] [CrossRef]
- Huang, C.; Narayanan, S.S. Deep convolutional recurrent neural network with attention mechanism for robust speech emotion recognition. In Proceedings of the 2017 IEEE International Conference on Multimedia and Expo (ICME), Hong Kong, China, 10–14 July 2017; pp. 583–588. [Google Scholar]
- Trigeorgis, G.; Ringeval, F.; Brueckner, R.; Marchi, E.; Nicolaou, M.A.; Schuller, B.; Zafeiriou, S. Adieu features? End-to-end speech emotion recognition using a deep convolutional recurrent network. In Proceedings of the 2016 IEEE International Conference on Acoustics, Speech and Signal Processing (ICASSP), Shanghai, China, 20–25 March 2016; pp. 5200–5204. [Google Scholar]
- Khalil, R.A.; Jones, E.; Babar, M.I.; Jan, T.; Zafar, M.H.; Alhussain, T. Speech Emotion Recognition Using Deep Learning Techniques: A Review. IEEE Access 2019, 7, 117327–117345. [Google Scholar] [CrossRef]
- Tamulevičius, G.; Korvel, G.; Yayak, A.B.; Treigys, P.; Bernatavičienė, J.; Kostek, B. A Study of Cross-Linguistic Speech Emotion Recognition Based on 2D Feature Spaces. Electronics 2020, 9, 1725. [Google Scholar] [CrossRef]
- Tran, M.; Soleymani, M. A Pre-Trained Audio-Visual Transformer for Emotion Recognition. In Proceedings of the ICASSP 2022—2022 IEEE International Conference on Acoustics, Speech and Signal Processing (ICASSP), Singapore, 22–27 May 2022; pp. 4698–4702. [Google Scholar] [CrossRef]
- Shor, J.; Jansen, A.; Maor, R.; Lang, O.; Tuval, O.; Quitry, F.d.; Tagliasacchi, M.; Shavitt, I.; Emanuel, D.; Haviv, Y. Towards Learning a Universal Non-Semantic Representation of Speech. In Proceedings of the Interspeech 2020, Shanghai, China, 25–29 October 2020. [Google Scholar]
- Zheng, W.; Yu, J.; Zou, Y. An experimental study of speech emotion recognition based on deep convolutional neural networks. In Proceedings of the 2015 International Conference on IEEE Affective Computing and Intelligent Interaction (ACII), Xi’an, China, 21–24 September 2015; pp. 827–831. [Google Scholar]
- Kim, Y. Convolutional neural networks for sentence classification. arXiv 2014, arXiv:1408.5882, preprint. [Google Scholar]
- Kalchbrenner, N.; Grefenstette, E.; Blunsom, P. A convolutional neural network for modelling sentences. arXiv 2014, arXiv:1404.2188. [Google Scholar]
- Meng, H.; Yan, T.; Yuan, F.; Wei, H. Speech Emotion Recognition From 3D Log-Mel Spectrograms With Deep Learning Network. IEEE Access 2019, 7, 125868–125881. [Google Scholar] [CrossRef]
- Lieskovská, E.; Jakubec, M.; Jarina, R.; Chmulík, M. A Review on Speech Emotion Recognition Using Deep Learning and Attention Mechanism. Electronics 2021, 10, 1163. [Google Scholar] [CrossRef]
- Zhao, J.; Mao, X.; Chen, L. Speech emotion recognition using deep 1D & 2D CNN LSTM networks. Biomed. Signal Process. Control 2019, 47, 312–323. [Google Scholar]
- Stolar, M.N.; Lech, M.; Bolia, R.S.; Skinner, M. Real time speech emotion recognition using RGB image classification and transfer learning. In Proceedings of the 2017 11th International Conference on Signal Processing and Communication Systems (ICSPCS), Surfers Paradise, Australia, 13–15 December 2017; pp. 1–8. [Google Scholar]
- Cao, H.; Cooper, D.G.; Keutmann, M.K.; Gur, R.C.; Nenkova, A.; Verma, R. CREMA-D: Crowd-Sourced Emotional Multimodal Actors Dataset. IEEE Trans. Affect. Comput. 2014, 5, 377–390. [Google Scholar] [CrossRef] [PubMed]
- Livingstone, S.R.; Russo, F.A. The Ryerson Audio-Visual Database of Emotional Speech and Song (RAVDESS): A dynamic, multimodal set of facial and vocal expressions in North American English. PLoS ONE 2018, 13, e0196391. [Google Scholar] [CrossRef] [PubMed]
- Jackson, P.; Haq, S.U. Surrey Audio-Visual Expressed Emotion (SAVEE) Database; University Surrey: Guildford, UK, 2014. [Google Scholar]
- Pichora-Fuller, M.K.; Dupuis, K. Toronto emotional speech set (TESS). Sch. Portal Dataverse 2020. [Google Scholar] [CrossRef]
- Busso, C.; Bulut, M.; Lee, C.C.; Kazemzadeh, A.; Mower, E.; Kim, S.; Chang, J.N.; Lee, S.; Narayanan, S.S. IEMOCAP: Interactive emotional dyadic motion capture database. J. Lang. Resour. Eval. 2008, 42, 335–359. [Google Scholar] [CrossRef]
- Neumann, M.; Vu, N.T. Improving Speech Emotion Recognition with Unsupervised Representation Learning on Unlabeled Speech. In Proceedings of the ICASSP 2019—2019 IEEE International Conference on Acoustics, Speech and Signal Processing (ICASSP), Brighton, UK, 12–17 May 2019; pp. 7390–7394. [Google Scholar] [CrossRef]
- Jalal, M.A.; Milner, R.; Hain, T. Empirical Interpretation of Speech Emotion Perception with Attention Based Model for Speech Emotion Recognition. In Proceedings of the Interspeech 2020, Shanghai, China, 25–29 October 2020; pp. 4113–4117. [Google Scholar]
- ‘Using CNN for Speech Emotion Recognition—What Is Wrong with It?’ Sopra Steria. Available online: https://www.soprasteria.se/blogg/using-cnn-for-speech-emotion-recognition (accessed on 28 September 2022).
- Sehgal, S.; Sharma, H.; Anand, A. Smart and Context-Aware System employing Emotions Recognition. In Proceedings of the 2021 2nd International Conference for Emerging Technology (INCET), Belgaum, India, 26–28 May 2021. [Google Scholar] [CrossRef]
- Sahoo, S.; Kumar, P.; Raman, B.; Roy, P.P. A Segment Level Approach to Speech Emotion Recognition Using Transfer Learning. In Proceedings of the Pattern Recognition: 5th Asian Conference, ACPR 2019, Auckland, New Zealand, 26–29 November 2019; Revised Selected Papers, Part II, Auckland, New Zealand. pp. 435–448. [Google Scholar] [CrossRef]
- Mocanu, B.; Tapu, R. Emotion Recognition from Raw Speech Signals Using 2D CNN with Deep Metric Learning. In Proceedings of the 2022 IEEE International Conference on Consumer Electronics (ICCE), Pingtung, Taiwan, 17–19 July 2022; pp. 1–5. [Google Scholar]
- Nasrun, M.; Setianingsih, C. Human Emotion Detection with Speech Recognition Using Mel-frequency Cepstral Coefficient and Support Vector Machine. In Proceedings of the 2021 International Conference on Artificial Intelligence and Mechatronics Systems (AIMS), Delft, The Netherlands, 12–16 July 2021; pp. 1–6. [Google Scholar]
- DMuttaqin; Suyanto, S. Speech Emotion Detection Using Mel-Frequency Cepstral Coefficient and Hidden Markov Model. In Proceedings of the 2020 3rd International Seminar on Research of Information Technology and Intelligent Systems (ISRITI), Yogyakarta, Indonesia, 10 December 2020; pp. 463–466. [Google Scholar]
- Rajasekhar, A.; Hota, M.K. A Study of Speech, Speaker and Emotion Recognition Using Mel Frequency Cepstrum Coefficients and Support Vector Machines. In Proceedings of the 2018 International Conference on Communication and Signal Processing (ICCSP), Tamilnadu, India, 3–5 April 2018; pp. 114–118. [Google Scholar]
- He, K.; Zhang, X.; Ren, S.; Sun, J. Deep Residual Learning for Image Recognition. arXiv 2015, arXiv:1512.03385. [Google Scholar]
- GitHub repository. Available online: https://github.com/Amikirami/Speech-Emotion-Recognition (accessed on 1 October 2022).


| Dataset | Anger | Disgust | Fear | Happy | Neutral | Sad |
|---|---|---|---|---|---|---|
| CREMA-D | 1271 | 1271 | 1271 | 1271 | 1087 | 1271 |
| RAVDESS | 192 | 192 | 192 | 192 | 48 | 192 |
| SAVEE | 60 | 60 | 60 | 60 | 120 | 60 |
| TESS | 400 | 400 | 400 | 400 | 400 | 400 |
| IEMOCAP | 1103 | 2 | 40 | 1636 1 | 1708 | 1084 |
| Architecture | Datasets Used | Spectrogram | Mel-Spectrogram |
|---|---|---|---|
| Custom CNN architecture | CREMA-D (6 emotions) | 0.4675 | 0.5366 |
| SAVEE, RAVDESS (6 emotions) | 0.3256 | 0.3000 | |
| IEMOCAP (4 emotions) | 0.1439 | 0.5326 | |
| CREMA-D, RAVDESS, SAVEE, TESS (4 emotions) | 0.5245 | 0.5589 | |
| CREMA-D, RAVDESS, SAVEE, TESS (6 emotions) | 0.4331 | 0.5742 | |
| CREMA-D, IEMOCAP, RAVDESS, SAVEE, TESS (4 emotions) | 0.5032 | 0.5558 | |
| ResNet18 | CREMA-D, RAVDESS, SAVEE, TESS (6 emotions) | 0.4970 | 0.5537 |
| Architecture | Datasets Used | Proper Split | Random Split |
|---|---|---|---|
| Custom CNN architecture | TESS | 0.4416 | 0.9979 |
| IEMOCAP | 0.5326 | 0.6913 | |
| ALL DATASETS | 0.5558 | 0.6596 | |
| ResNet18 | CREMA-D, RAVDESS, SAVEE, TESS | 0.5537 | 0.6429 |
| Confusion Matrix of Emotion Classification | ||||||
|---|---|---|---|---|---|---|
| Anger | Disgust | Fear | Happy | Neutral | Sad | |
| Anger | 207 | 62 | 20 | 18 | 10 | 6 |
| Disgust | 18 | 71 | 11 | 13 | 22 | 26 |
| Fear | 9 | 15 | 129 | 38 | 7 | 39 |
| Happy | 7 | 22 | 9 | 109 | 5 | 2 |
| Neutral | 26 | 73 | 53 | 81 | 194 | 117 |
| Sad | 3 | 27 | 48 | 11 | 32 | 80 |
Publisher’s Note: MDPI stays neutral with regard to jurisdictional claims in published maps and institutional affiliations. |
© 2022 by the authors. Licensee MDPI, Basel, Switzerland. This article is an open access article distributed under the terms and conditions of the Creative Commons Attribution (CC BY) license (https://creativecommons.org/licenses/by/4.0/).
Share and Cite
Zielonka, M.; Piastowski, A.; Czyżewski, A.; Nadachowski, P.; Operlejn, M.; Kaczor, K. Recognition of Emotions in Speech Using Convolutional Neural Networks on Different Datasets. Electronics 2022, 11, 3831. https://doi.org/10.3390/electronics11223831
Zielonka M, Piastowski A, Czyżewski A, Nadachowski P, Operlejn M, Kaczor K. Recognition of Emotions in Speech Using Convolutional Neural Networks on Different Datasets. Electronics. 2022; 11(22):3831. https://doi.org/10.3390/electronics11223831
Chicago/Turabian StyleZielonka, Marta, Artur Piastowski, Andrzej Czyżewski, Paweł Nadachowski, Maksymilian Operlejn, and Kamil Kaczor. 2022. "Recognition of Emotions in Speech Using Convolutional Neural Networks on Different Datasets" Electronics 11, no. 22: 3831. https://doi.org/10.3390/electronics11223831
APA StyleZielonka, M., Piastowski, A., Czyżewski, A., Nadachowski, P., Operlejn, M., & Kaczor, K. (2022). Recognition of Emotions in Speech Using Convolutional Neural Networks on Different Datasets. Electronics, 11(22), 3831. https://doi.org/10.3390/electronics11223831