Article

Improved Metallic Enclosure Electromagnetic Imaging Using Ferrite Loaded Antennas

1
Department of Electrical and Computer Engineering, University of Manitoba, Winnipeg, MB R3T 2N2, Canada
2
AGCO, Winnipeg, MB R3T 6A8, Canada
3
Department of Biosystems Engineering, University of Manitoba, Winnipeg, MB R3T 2N2, Canada
*
Author to whom correspondence should be addressed.
Electronics 2022, 11(22), 3804; https://doi.org/10.3390/electronics11223804
Submission received: 12 October 2022 / Revised: 10 November 2022 / Accepted: 14 November 2022 / Published: 18 November 2022
(This article belongs to the Special Issue Electromagnetic Applications in Industry and Medicine)

Abstract

:
Three-dimensional electromagnetic imaging can be used to monitor grain within metallic grain bins. Data acquisition requires multiple antennas surrounding the imaging space, which are used to transmit and receive the electromagnetic energy inside the bin. Due to their presence inside a metallic enclosure and due to very large mechanical forces these antennas are required to be low profile. In addition, since they are part of the imaging domain, they should be simple to model in the imaging software (i.e., using a point source). Existing half-loop magnetic field antennas meet these design criteria, but can be improved, particularly with better radiation efficiency. Herein, we present an enhanced antenna design: a ferrite-loaded shielded half-loop antenna designed to measure only the tangential component of the magnetic field against the metal enclosure wall, while rejecting the normal component of the electric field. Experimental results in two bins show that the enhanced design improves the signal level over existing probes by 6–18 dB inside a small-scale enclosure and around 20 dB inside a larger 28 m 3 (800 bushel) bin. Full 3D imaging results of a high-moisture target within a low-moisture grain background inside the test enclosure show that the enhanced antennas improve the quality of the reconstructed results in the smaller bin, particularly where the antenna performance improvements are prominent.

1. Introduction

Electromagnetic Imaging (EMI) uses electromagnetic waves to qualitatively and/or quantitatively reconstruct the properties of a target or region of interest (ROI). Fields are transmitted into the region and then measured at multiple locations around the ROI with a series of antennas. These measurements are then used as input to an inversion algorithm to reconstruct the electrical properties (i.e., the complex permittivity) of the ROI [1]. EMI has been used in different applications including medicine [2,3,4], geosciences [5], food science [6], stroke imaging [7,8,9,10], breast cancer detection [11,12,13,14,15,16,17,18] and grain bins [19,20,21,22]. Within grain monitoring, the complex permittivity of grain has long been used to estimate the moisture content of the grain [23], and the moisture content of the stored grain is critical to its safe storage.
Antennas are a critical component of EMI systems. They both radiate the EM energy into the grain bin and receive the scattered fields from the ROI that ultimately provide the information about the ROI. Within grain bin EMI, design considerations of these antennas include that (1) they must have a field pattern that can be readily modeled in the inversion algorithm, (2) they must be sensitive enough to detect the fields close to the bin wall, (3) must pick up a well-modeled field polarization (EMI algorithms, e.g., [11,24,25] assume input data of an electric/magnetic field at a point with a known polarization, and antennas that are sensitive to combinations of different fields cannot readily be calibrated in experimental systems) and (4) they must be able to physically survive the rigors of moving grain in a bin. Previous work on designing antennas to satisfy these constraints inside of metallic enclosures has resulted in a half-loop design [20] capable of measuring the H-field perpendicular to the loop’s main area, while these antennas work well in grain bins, they suffer from the fact that sub-wavelength loop antennas have a very poor radiation efficiency (i.e., they are very inefficient at converting input power into radiated waves) and most of the signal’s incident upon them are reflected. It is thus desirable to have an antenna with better radiation efficiency that still satisfies the above design constraints. Grain bins can have diameters greater than 40 m, and each antenna must be connected to a Vector Network Analyzer (VNA) via a coaxial cable. In such systems, the raw S-parameter signal levels are often in the range of −80 to −100 dB (due to the lossy nature of the grain, the inefficiency of the antennas, and the losses in the long cables). Thus, a more efficient antenna will increase the signal-to-noise ratio in these large bins (as the noise floor of the VNA is often close to −110 dB).
The contribution of this work is to design an improved antenna for imaging in grain bins that satisfies the imaging-system design constraints but can offer an improved signal-to-noise level- thus resulting in better final images of spoiled grain. Designing such an antenna in a metallic chamber a few wavelengths across means that many far-field antenna design concepts do not apply to this problem. That is: one cannot take an antenna that works well in the far field in free space and use it in a grain bin (and expect it to work with existing inversion algorithms). Thus, our main contribution is to offer an efficient antenna that works well in metallic bins given the constraints of operating in a grain bin.
Our improved antenna is achieved through designing well-matched antennas that are easy to model using simple point sources and are sensitive to a single polarization of the electromagnetic field at the location of the antenna. In addition, we wish to maintain the low-profile nature of the existing antennas. As a solution to these problems, we present a miniaturized resonant antenna that is used for EMI. This is achieved through the strategic placement of ferrite media around the antenna structure. Like other scaled bin test environments [26], we use a small test bin to experimentally validate our design.
The work herein is an expansion on previously presented preliminary results [27], where we presented initial 2-antenna results that showed the increase in signal strength. In this work, we show that the full 24 antenna array works with the full 3D imaging procedure in a scaled grain bin (which is not a given strictly from an increase in signal strength). We also present preliminary results with another set of antennas in a much larger (industrial scale) grain bin, thus showing that our proposed antenna can be increased in size to work in these larger bins.

1.1. EMI as a Grain Permittivity Measurement Instrument

The use of electromagnetic instrumentation and measurement of grain parameters, particularly measurement of permittivity, has a long history (see, e.g., [28,29,30,31,32,33,34,35]). The moisture content of grain has long been measured with electromagnetic devices that measure the permittivity of small samples of the grain [23]. The EMI system we use in this paper [19,20,21,22] can be considered an extension of such permittivity measurement instruments that operate in two modes, both of which have some improvements on previously existing grain permittivity measurement instrumentation. The first mode [36] treats the entire grain bin as a single permittivity measurement instrument and outputs the average permittivity of the bin contents, and the second mode is a system for providing a 3D map of the permittivity of each small region in the grain (in our case, each small volume is represented by a tetrahedral). In this sense, by providing an improved EMI antenna, we are developing an improved instrument for measuring the permittivity of grain in a wide variety of grain storage bins, essentially transforming any metallic grain bin into a bulk and 3D permittivity measurement instrument.

1.2. Paper Organization

The paper is organized as follows: the imaging algorithm is briefly described in Section 2. In addition, cost functions for optimization algorithms are presented. Section 3 covers antenna design, simulation, fabrication, and measurement results. The important step of data collection is presented in Section 4. Section 5 represents the inversion process steps. In Section 6, parametric inversion results have been presented. In Section 7, we present images produced by the designed antennas. In Section 8, we have presented our designed large FLA and implemented it inside a large grain bin for EMI. Finally Section 9 concludes.

2. Problem Definition and Imaging Algorithm

A basic schematic of the EMI problem is presented in Figure 1. In this figure, the yellow region represents the background media with relative permittivity ϵ b ( r ) (note that this background permittivity can be heterogeneous). In addition, inside the enclosure, there is a region of unknown permittivity ϵ r ( r ) . In our application, we are concerned with changes in permittivity in the media. Equation (1) represents complex permittivity in media, where ϵ 0 is the permittivty of free space, ϵ r ( r ) is the complex relative permittivity with ϵ r ( r ) and ϵ r ( r ) ) as it relative real and imaginary part of relative permittivity, respectively.
ϵ = ϵ 0 ϵ r ( r ) = ϵ 0 ( ϵ r ( r ) + j ϵ r ( r ) )
The antennas under consideration in this paper are sensitive to the magnetic field, H . We break up the total field into incident and scattered fields associated with antenna j as H j t o t = H j i n c + H j s c t . The incident fields are associated with the set of background media ϵ b ( r ) , and we are free to define the background media to best solve the inverse problem. The scattered fields are associated with the contrast between the true media and our selected background; this contrast is defined as:
χ ( r ) = ϵ r ( r ) ϵ b ( r ) ϵ b ( r ) .
For example, in the case of the grain bin used in this work, we choose to define the background media ϵ b ( r ) to be a mixture of air and a relatively homogeneous mass of grain with some height and cone angle. The contrast (and thus scattered fields) is thus associated with deviations from the homogeneous grain (e.g., higher moisture regions cause the scattered fields). In general, non-linear inverse problems are more successful when the contrast is as small as possible, so choosing, e.g., the background to be entirely free-space leads to much worse inversion results.
The core of the inversion solver in this paper uses the Finite Element Method (FEM) to simulate the electric field equation [24]:
× × E s c t ( r ) k b 2 ( r ) E s c t ( r ) = k b 2 ( r ) w ( r )
where k b 2 ( r ) = 2 π f μ 0 ϵ 0 ϵ b ( r ) is the ( inhomogeneous) background wave-number and w(r) is called contrast source and defined as follows:
w ( r ) = χ ( r ) E t o t ( r ) .
While the FEM code directly simulates only the E -field, the magnetic fields, H , are generated via a transform on the FEM mesh [20] (and all inversion happens with the magnetic fields).
In the FEM code, the source term at each antenna position is a magnetic dipole (i.e., a magnetic current)
M = δ ( r r j ) v ^
where v ^ is the unit-vector in the direction of the antenna orientation (i.e., perpendicular to the loop). Finally, to compute the magnetic fields at the antenna positions (which is required at the receiver positions) r j , the FEM code applies Faraday’s law to the FEM-electric field basis functions [20].

Inversion Algorithm

The process of solving for the total permittivity from the measured scattered fields is known as the inverse scattering problem. This process assumes knowledge of both the incident field in the background permittivity, as well as measurements of the total fields at the receiver points. We use the Contrast Source Inversion algorithm with the forward solver implemented in the Finite Element Method (FEM) algorithm, known as FEM-CSI [24]. This algorithm optimizes the following cost functional:
F C S I ( χ , w j ) = j = 1 n | | H j sct , meas M H , D 0 , j L [ w j ] | | D 2 j = 1 n | | E j sct , meas | | D 2 + j = 1 n | | χ E j inc w j + χ M D , j L [ w j ] | | D 0 2 j = 1 n | | χ E j inc | | D 0 2
where L represents the inverse of finite element discrete matrix which depends on the boundary condition of the enclosure, and M stands for interpolation matrix operator to convert fields values along edges of meshes to vector fields at locations of transceivers or points of a domain. Moreover, ⊙ represents the element-wise multiplication of matrices of the same size. The input data to the optimization Equation (6) are the scattered magnetic fields measured by the antennas (see below for antenna design for discussion as to why the antennas are magnetic field detectors). The CSI algorithm optimizes this functional through by applying the conjugate gradient minimization algorithm to the two unknowns, χ and w [24].

3. Antenna Design

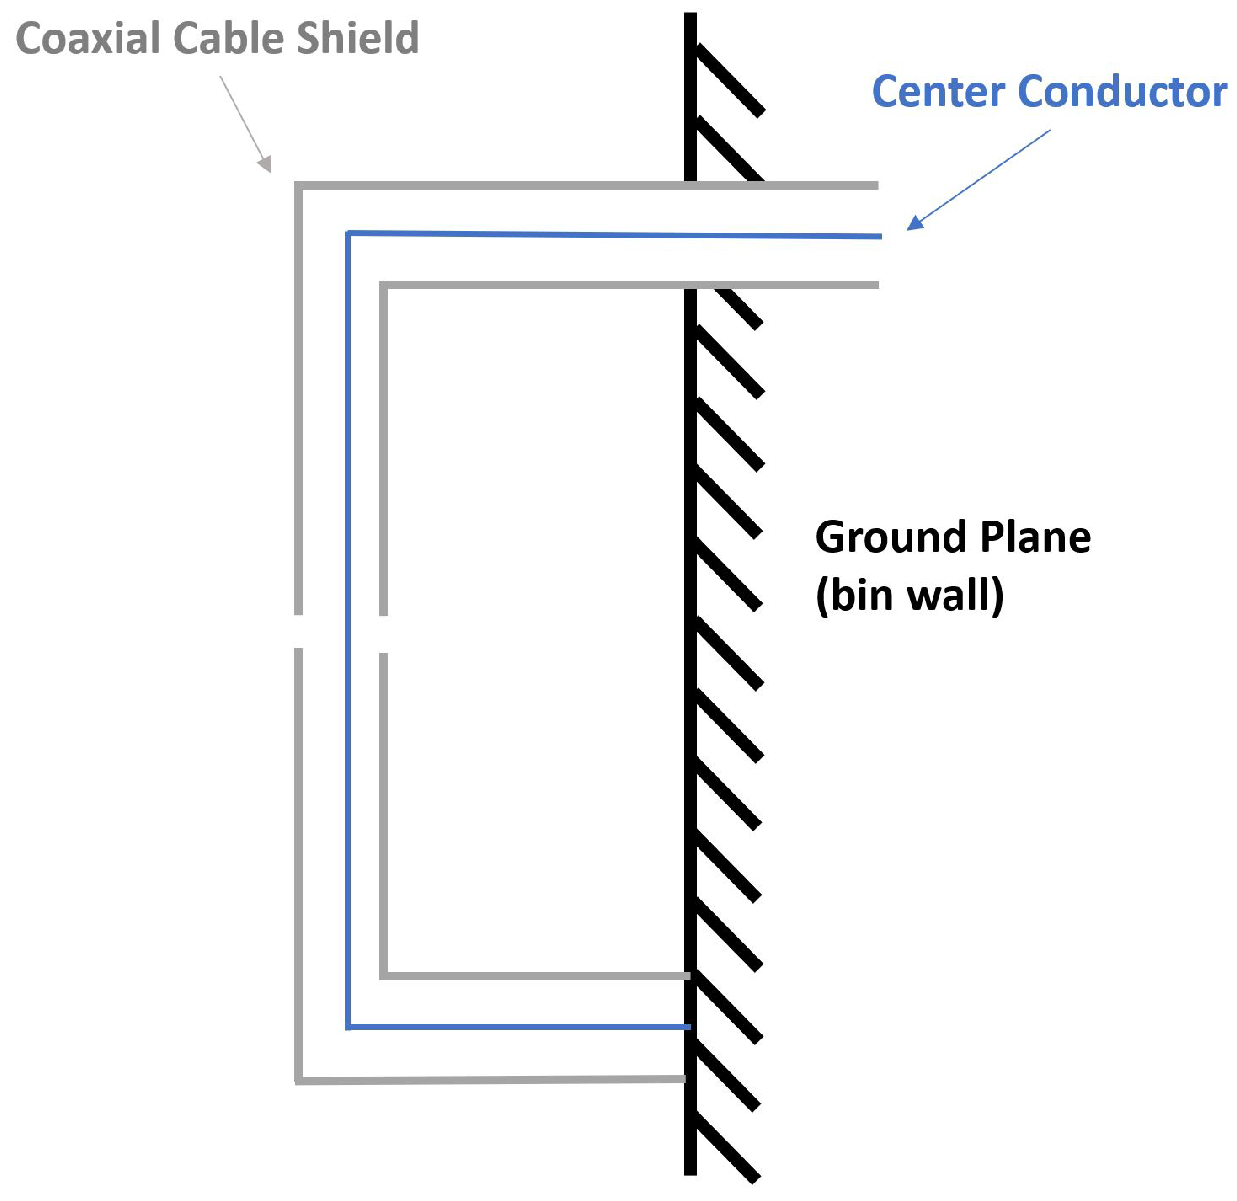
Against a metallic boundary, only tangential magnetic fields and normal electric fields exist. Due to the modeling complications and limitations of the inversion algorithms, we design an antenna that measures a single field component [19,20] in this case, the tangential magnetic fields. A half loop magnetic field probe, depicted in Figure 2, can be used to measure a single polarization of magnetic fields. This was previously achieved using a co-axial cable with a small cut on the outer conductor at the center of the half-loop (see Figure 2). The inner conductor serves as the loop that is sensitive to the magnetic field, while the outer conductor shields the arms of the loop parallel to the normal electric field [20]. The such antenna measures the magnetic field passing perpendicularly through its surface [20].
As described previously, this type of antenna suffers from poor radiation efficiency, resulting in a high magnitude of the reflection coefficient. To improve the antenna performance, we propose the use of ferrite material in the antenna design. We refer to the ferrite type antennas as Ferrite-Loaded Antennas (FLA), and the original antennas [20] as Non-Ferrite Loaded Antennas (NFLA).
In this work, we design the antennas around a small-scale grain bin, previously used in [20,21]. Due to the size of this small-scale grain bin, a frequency range of 200 MHz to 600 MHz is selected for design and imaging purposes. This range is selected such that the number of wavelengths across the bin radius is approximately 1–3 wavelengths, which is a result of a trade-off between computation time and resolution, while we focus on this scaled bin, the principals involved will also scale to larger antennas (required for larger bins).

3.1. Ferrite Media

The general categorization of magnetic media can be found in [37]. At microwave frequencies, ferrites are dispersive solid ceramics with low conductivity and relative permittivity between 10 and 15 [37,38].
Unlike non-magnetic media, both permeability ( μ ), as well as permittivity ( ϵ ), must be considered when using ferrites in antenna design. In general, because of their dispersion, for a wide-band antenna, the dispersion needs to be modeled. A 2nd order Debye model [38] is used for both permittivity and permeability ( μ = μ 0 μ r ( r ) = μ 0 ( μ r ( r ) + j μ r ( r ) ) ) where μ 0 is the permeability of free space, i.e.,
ϵ r = ϵ + n = 1 N ϵ s n ϵ 1 + j ω τ n e μ r = μ + n = 1 N ϵ s n ϵ 1 + j ω τ n h
The parameters for the second order Debye model for permittivity and permeability of the ferrite material in the antenna design are presented in Table 1.
Using the parameters in Table 1 results in permittivity and permeability over the desired maximum design frequency range are shown in Figure 3.

3.2. Ferrite Loaded Antenna Simulation

Through a design process that carefully considered cost, mechanical stability (ferrite is very brittle, and grain bins are harsh environments), and ferrite availability, we attempted multiple configurations of ferrite media in the half-loop antenna. These possible configurations were simulated, but we finally settled on the design shown in Figure 4 (where the ferrite material is shown in aqua color). As this antenna must be mounted in a bin containing grain, and the movement of grain can produce large forces (and rip antennas off the bin wall), we have mounted ferrite plates directly to the bin walls to prevent extra protrusions into the bin (the protrusions increase the forces on the antenna). With this design, the antenna remains electrically small [39], with a resonance occurring at approximately 260 MHz.
The proposed design was simulated with a 50 Ω excitation port using ANSYS Electromagnetic Suite 2021 (HFSS). The plot of the magnitude of the reflection coefficient of the antenna (i.e., S 11 ) from the simulation is shown in Figure 5. It is worth noting that the simulation model included a metallic backplane to simulate the enclosure’s wall, instead of the full resonant metallic enclosure (to reduce the computation cost of the simulations), and the antenna was surrounded by a homogeneous region of the air. For a Voltage Standing Wave Ratio (VSWR) with criteria VSWR < 2:1, the design has a bandwidth of 60 MHz, centered at 260 MHz. At this frequency band, the inclusion of the ferrite has created a well-matched antenna.

3.3. Measurement

The antenna was fabricated and installed inside the bin (Figure 5). Note that there is a white plastic cover on the coaxial cable that protects the cable from mechanical damage but does not affect the electromagnetic performance. After installing the antenna in the metallic enclosure, the magnitude of the reflection coefficient of the antenna was measured using a VNA as shown in Figure 5. For comparison purposes, the magnitude of the reflection coefficient for the NFLA is also graphed on the same plot.
The differences in S 11 are obvious between the fabricated FLA and NFLA antennas: most of the incoming energy is reflected from the NFLA for all the design frequencies (approx. (200–600) MHz). For the FLA, there are small differences between simulated and measured values. The differences can be attributed to the fact that the fabricated antenna was placed inside the open bin (where the simulation was in free space), the physical antenna has imperfections in its shape, as well as the fact that the simulation uses a Perfect Electric Conductor (PEC) while the actual antenna is made of copper. Given these differences, there is a good match between simulation and measurement.

4. Experimental Description

4.1. Experimental Comparison of NFLA and FLA Antennas

The main goal of the proposed FLA antennas is to increase the signal strength—in practice the S 21 —above those of the existing NFLA antennas. To show the higher S 21 signal levels with the proposed design, we measured S 21 N F L A for two NFLA (original) antennas with the test bin partially full. We next added the ferrite media to the proposed antennas (making them FLA) and re-took the measurement, resulting in S 21 F L A . The grain and rest of the measurement apparatus remained untouched between the measurements.
Figure 6 shows the | S 21 | comparisons of FLA with NFLA over the designed frequency ranges. This plot shows that the new antenna receives up to 19 dB more S 21 signal than the NFLAs with the strongest signal improvement occurring at the resonance frequency of the antenna.

4.2. Imaging Tests

While the higher-signal (and thus lower-noise) advantages of the FLA antennas are clear from Figure 6, there are other design parameters that must be satisfied by these antennas. Ultimately, they must be able to provide useful images inside of the resonant enclosure. For example, it is possible to design a well-matched antenna that does not meet other design criteria, such as producing an incident field well modeled by a magnetic dipole, as well as primarily receiving the H-field polarization perpendicular to the antenna loop. To show that these design parameters are met, we have performed a series of experiments in the small-scale grain bin with both FLA and the original NFLA antennas. These experiments are described below.

4.2.1. Small Scaled Grain Bin Measurement Setup

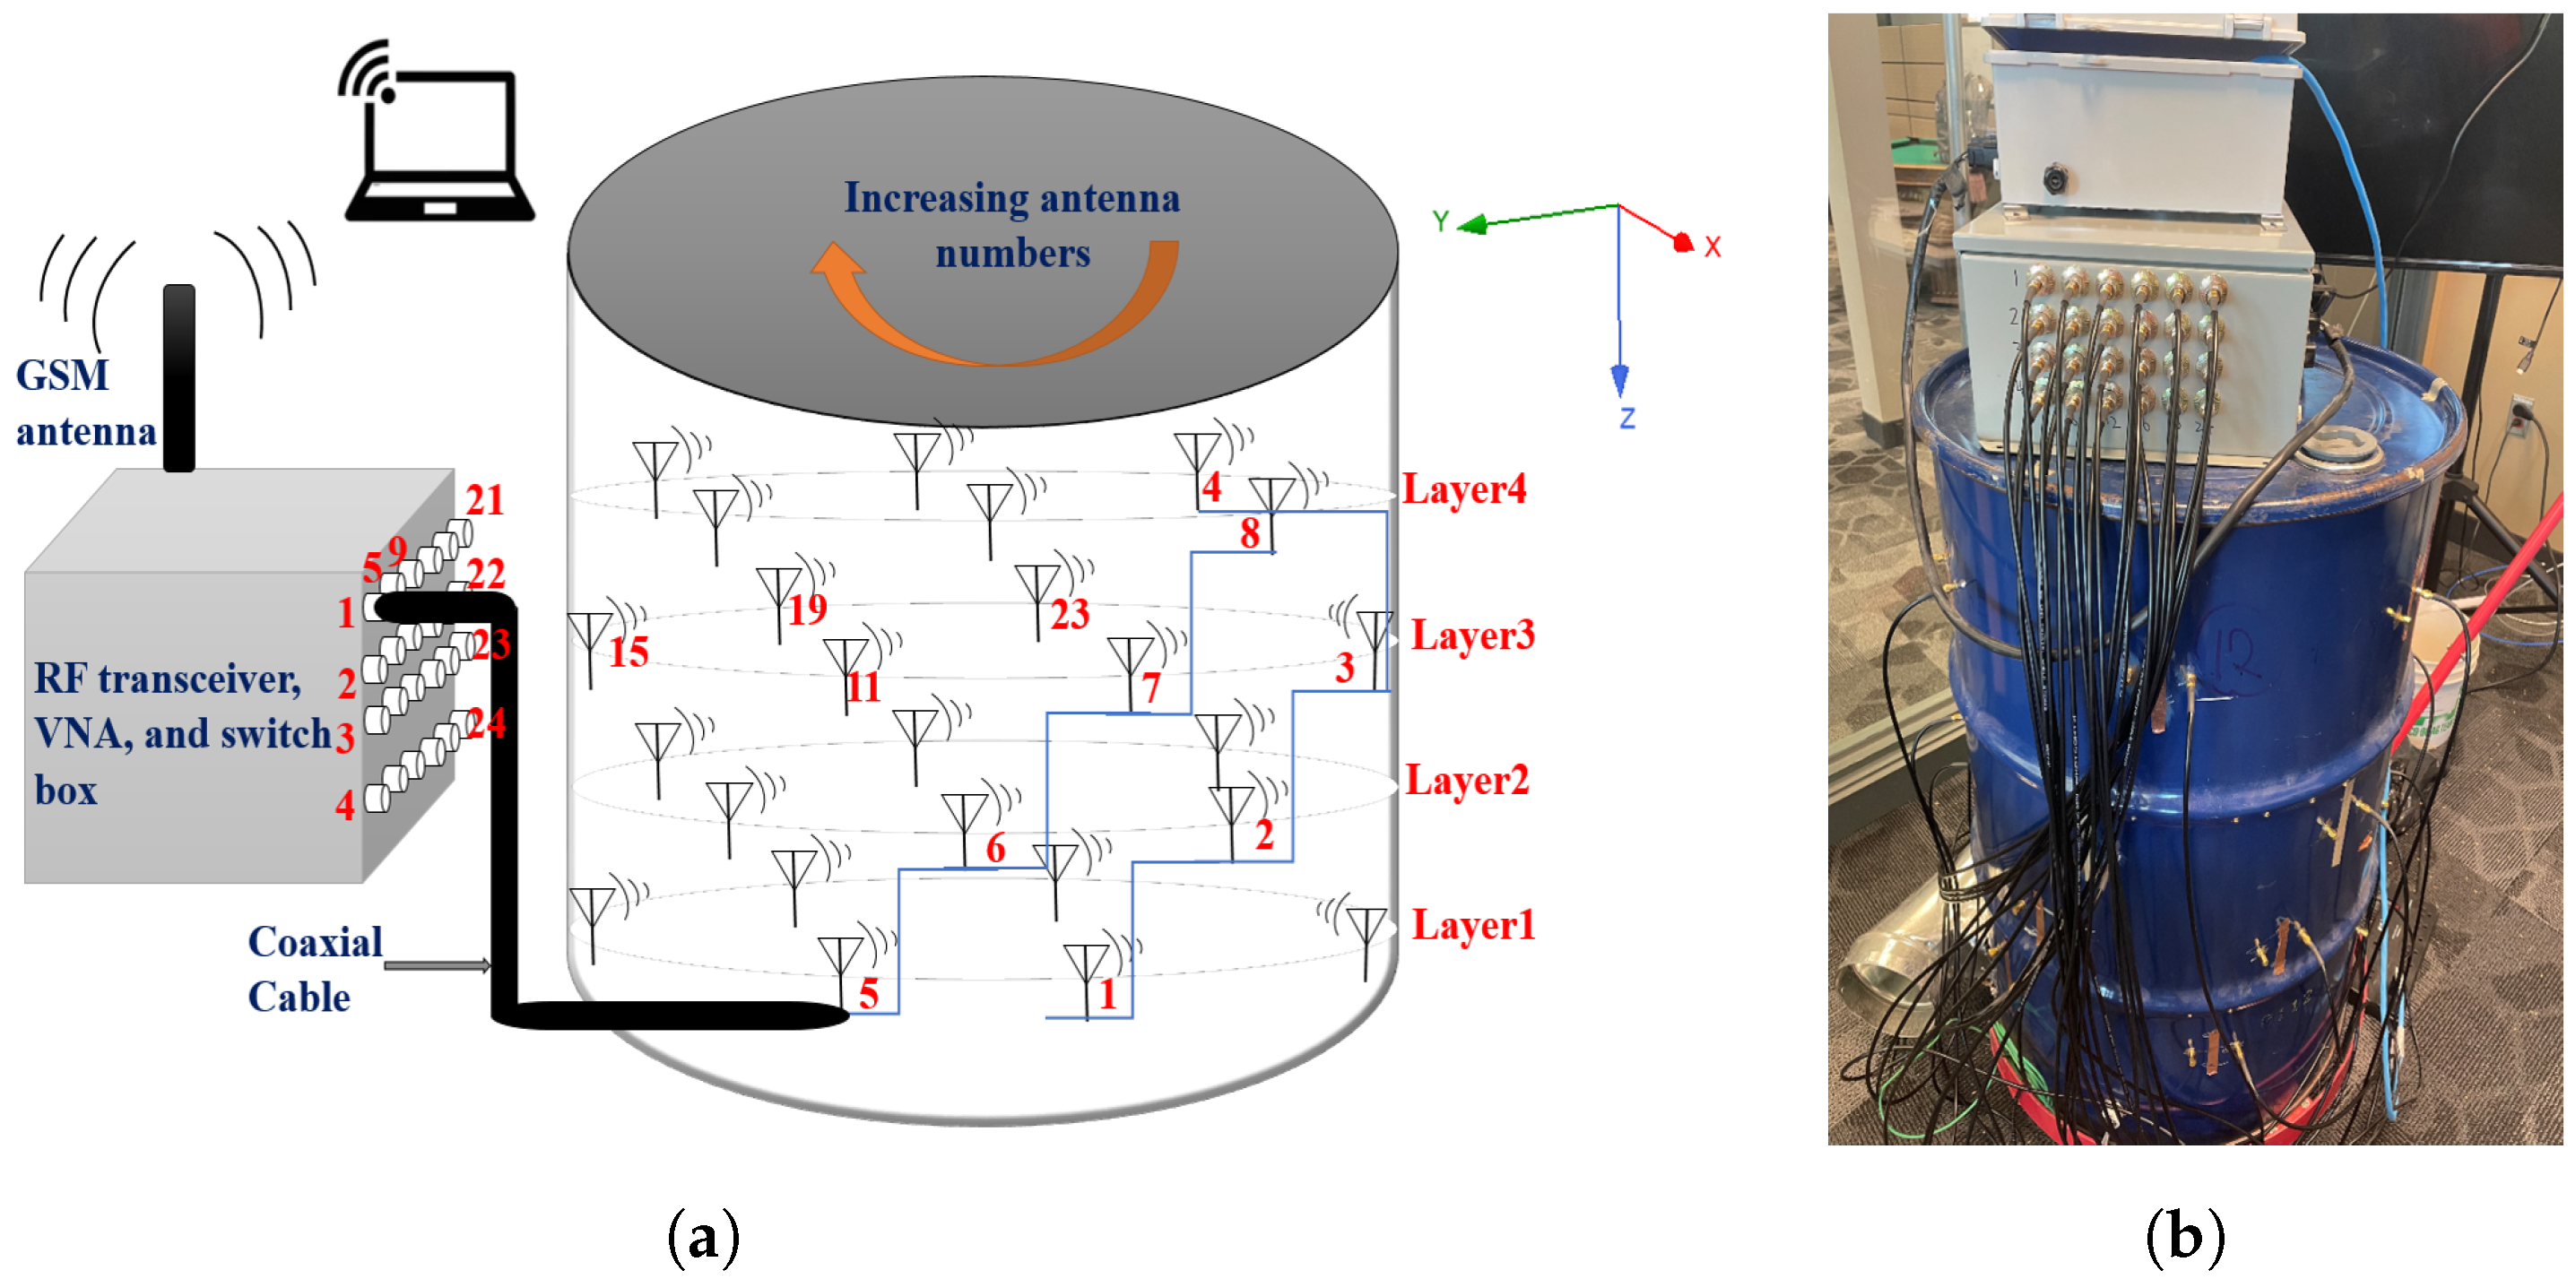
The scaled grain bin has been depicted in Figure 7. The bin has a depth of approximately 70 cm and a radius of 28.5 cm, with a total volume of approximately 190 L. Previous results with this scaled grain bin have been presented in [19,21]. We installed either 24 FLA or NFLA antennas, as shown in Figure 7. Each antenna was connected to the GrainViz imaging system that contains a Vector Network Analyzer (VNA), amplifiers, control computers, and a 24 × 2 port switch. Antennas were connected to the GrainViz system through 1.5 m long coaxial cables. Antennas are staggered (with a 15 shift per layer) in four layers. This arrangement of antennas was chosen to maximize the spread of antennas on the inner wall of the enclosure and ensure proper field sampling. The VNA was used to transmit and receive data through the antennas via the switching network, resulting in 24 × 23 (552) data points per frequency. The measured data was used as input to imaging algorithms.

4.2.2. Grain Description

We used two treatments of hard red spring wheat as our test grain. The bulk of the wheat was very dry (7.5% moisture content, wet basis). This grain was harvested in approximately 2018 and had been stored in a stable indoor environment, and thus was assumed to be homogeneous. From the available literature, the approximate relative permittivity of the hard red spring wheat at ≈260 MHz is ϵ r = 3 j 0.3 [40]. It is worth noting that this relative permittivity is approximate as the density of the grain can have significant effects on the permittivity (we did not directly measure the permittivity of the grain) (Temperature also affects the permittivity of grain, but [40] was at 25 C and our grain was approximately at room temperature (≈21 C), which has relatively small effects on permittivity).
We next created a wet-grain target by placing 1410 g of dry wheat mixed with 210 g of tap water inside two plastic bags. A photo of the wet-grain target in position is shown in Figure 8. This target was allowed to sit at standard refrigeration temperatures for at least one week to allow the water to be absorbed by the grain. Assuming all of the water was absorbed over this time, the wet-grain target had a moisture content of 19.5% and would have an approximate permittivity of ϵ r = 4.5 j 0.6 at ≈260 MHz [40]. At room temperatures, such high-moisture wheat could only be stored for a couple of days without spoilage [41], while still malleable (and thus not purely in the shape of a rectangular cuboid) the approximate dimensions of the wet-grain target were 7.5 cm × 11 cm × 21 cm.

4.2.3. Data Collection

We began the data collection process by filling the grain bin with the dry hard red spring wheat. To achieve a flat grain surface, the initial fill of grain was smoothed by hand. The grain leveling was done without the aid of leveling tools, so the accuracy of the flattened surface was unknown. We had enough grain to fill in slightly less than half full. This was followed by placing a plastic bucket with a diameter of 0.1 m and a height of 0.25 m inside the bin. The bucket is needed to accurately place the wet-grain target as it is very difficult to dig inside of the free-moving grain. The thin bucket is made of plastic and has a permittivity like the bulk grain, so it is ignored in the inversion process. Figure 8 shows the bucket before it is covered with wheat (but with the wet target), near antenna #15. We then re-filled the bucket with dry wheat back to the original level. Once the bucket was buried in dry grain, we then took an incident S-parameter measurement herein referred to as S i n c . This data set is then subsequently used to estimate the background permittivity, ϵ b , using a parametric imaging algorithm [36].
Next, we removed the dry grain inside of the bucket and placed the wet-grain target inside (see Figure 8). After re-filling, the bucket back to level with the dry grain (not pictured), We then took a total S-parameter measurement, which has been labeled S t o t . Finally, note that we repeated each of the steps above for both the proposed FLA and NFLA.

5. Inversion Process

Standard inversion work-flow for imaging inside of grain bins has been previously outlined in [20,22] and is as follows:
  • Obtain ϵ b ( r ) : Using raw S i n c (the measurements without the wet grain target), estimate the background permittivity, ϵ b ( r ) through phaseless parametric inversion [36]. This algorithm outputs the grain height and cone angle, as well as an average permittivity. The background estimation algorithm uses the magnitude data and a gradient-free optimization to find the best average permittivity, grain height, and cone-angle.
  • Generate Incident Fields: Using the inhomogeneous air/grain background permittivity, ϵ b ( r ) , as the input to a FEM forward solver, the incident magnetic field for the numerical model, called H b k g , is obtained.
  • Calibrate Scattered Fields: We generate calibrated scattered fields from the incident magnetic fields, and the total/incident S-parameter measurements via the equation:
    H t x , r x s c t = H t x , r x b k g S t x , r x i n c S t x , r x t o t S t x , r x i n c
    where t x , r x denote the transmitter and the receiver index.
  • Full Inversion: Finally, we pass the calibrated scattered fields from Equation (8), along with the background permittivity ϵ b ( r ) , to the FEM-CSI algorithm described in Section 2.
For this work, we choose to run the FEM-CSI independently at 10 frequencies in two ranges: 240, 244, 250, 260, 270, 280 and 540, 550, 560, 570 (all in MHz). Frequencies as the ≈250 MHz group was close to the FLA resonance, while the higher frequencies are chosen as this is where the NFLAs have been previously used successfully [20,21].

6. Parametric Inversion Results

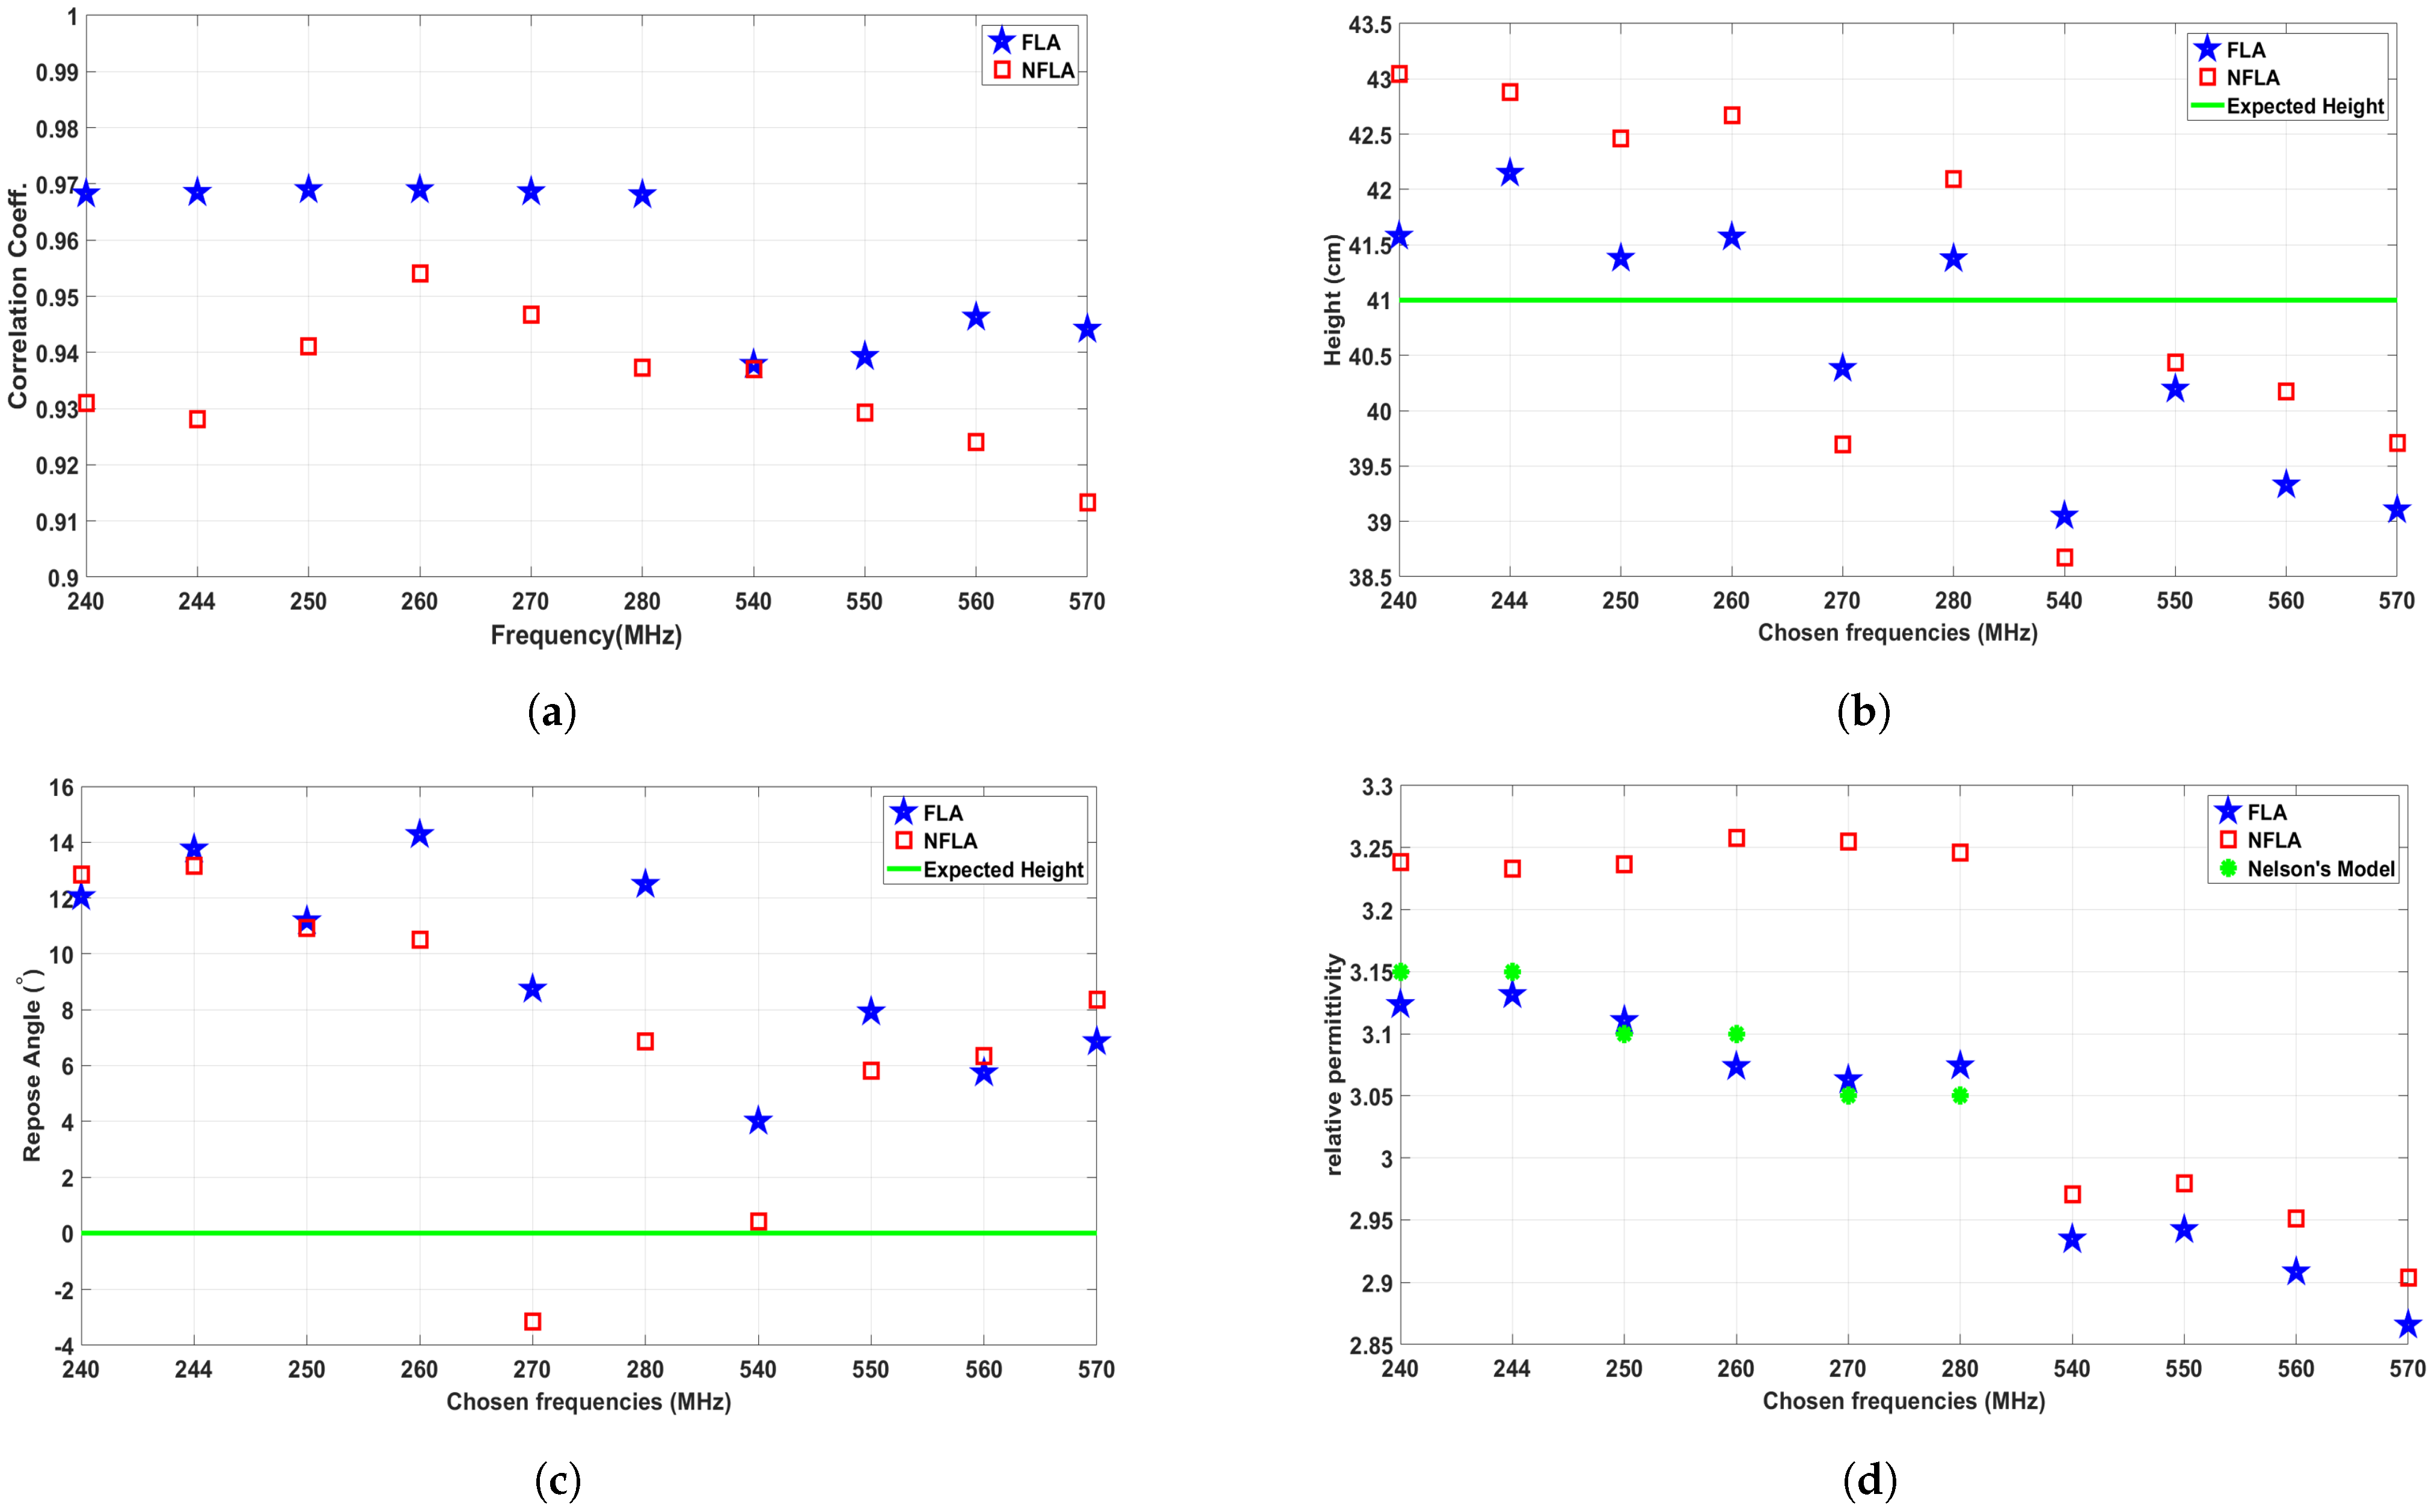
We first present phaseless parametric inversion for both the FLA and NFLA. The objective function for the parametric inversion function, Equation (6), is L 2 norm based on the magnitudes of the data. As a way of determining how successful the parametric inversion was at computing the correct result, we use the Pearson correlation coefficient between the magnitude of the raw data, | S i n c | and the fields generated from the computational model | H b k g | .

6.1. Correlation Coefficient

The correlation coefficient is insensitive to scaling differences between the fields and the measured S-parameters and can be used as an intuitive metric to compare how well the computational model fits the data: 100% correlation is a perfect match between the real world and the model. Any deviation from 100% means the computational model is not a perfect fit. A low correlation coefficient for a given antenna would mean that it is not a good fit for the computational model (e.g., if the antenna did not act like a magnetic dipole, the correlation coefficient would be low). For S i n c data sets taken with both FLAs and NFLAs, Figure 9a displays the correlation coefficients at each frequency between | S i n c | and | H b k g | . In every case, the correlation coefficient for FLAs is higher than for the NFLAs. The FLA correlations are also higher near the lower, resonant frequency band.

6.2. Height, Angle, and Background Permittivity Detection

The height, cone angle, and real permittivity estimated by the parametric inversion for both FLA and NFLA S i n c data sets are shown in Figure 9b–d. The heights are within 3 cm of the expected result, with errors both above and below the expected values. Note that 1 cm at 250 MHz is approximately ( 1 70 ) th of a wavelength in the grain, or ( 1 30 ) th of wavelength at 550 MHz (in grain). Thus, in terms of wavelength, these errors are small. Further, the discretization of the mesh is done with tetrahedral-side lengths being approximate ( 1 10 ) th of a wavelength at 550 MHz (about 3 cm). Thus, the observed errors in grain height are on the order of the discretization errors of the mesh.
Errors appear larger in the angle of repose of the grain, shown in Figure 9c. We have assumed the true repose angle is 0 , but the repeated positive repose angle for both data sets likely means that our manual flattening process was leaving a small peak of grain. These errors are larger than the discretization errors inherent in the super-position of the cone-angle onto our unstructured mesh (see Figure 10 for a visualization of how the cone angle is superimposed on the mesh). For example, considering the FLA data set, the average angle is 10 (rounded to the nearest degree). This represents a peak height of 5 cm in the center of the bin (or about 1.5 tetrahedral edge lengths). Thus, unlike the height error, the error in the angle of repose is slightly larger than the discretization error.
The values for the real permittivity at the chosen frequencies have been shown in Figure 9d. The real permittivity is ultimately used to detect the moisture of grain [23], and the imaginary permittivity is much more variable on grain variety/density, etc. [23]. Therefore, we present only the real permittivity results (although the imaginary part of the permittivity is reconstructed in the inversion algorithm), while many factors (most importantly density) can affect the permittivity of the wheat, the obtained values are comparable to the literature values. Using the permittivity values in [23] for wheat at 7.5% at 25 C, we have added Nelson’s model points to Figure 9d. It is worth noting that [23] does not have data above 300 MHz. Comparing R e ( ϵ b ) in plots of Figure 9d, the results from the FLAs follow the expected value in our lower frequency band, while at the upper-frequency band they are very similar. Overall, the FLAs are likely to provide a more accurate estimate of real permittivity than the NFLAs.

7. Full 3D Imaging Results

We followed the imaging procedure outlined in Section 6 and collected the total-field data S t o t with the wet-grain target buried in the grain mass for both FLA and NFLA. Then the data as per Equation (8), is calibrated and the FEM-CSI inversion algorithm is run.
For each data set, we present full 3D results for two different frequencies: 260 MHz and 570 MHz (Note that other frequencies in the two ranges provided similar results, and the results only at these two frequencies are presented in order to save space). As mentioned earlier, only real permittivity results are used to eventually measure the moisture content of the grain. All inversion results are presented on the same color scale, and this color scale is shown in Figure 10. This common color scale allows the direct comparison of imaging results between the FLAs and NFLAs. For the 3D threshold images, we use a threshold of R e ( ϵ r ) > 3.6 , which is 90% of the maximum color scale of 4.
We first present the 3D R e ( ϵ r ( r ) ) reconstructions of the grain with the wet target for the FLAs in Figure 10, along with some metrics in Table 2. Reconstructions of the same target with the NFLAs have been shown in Figure 11 and Table 3.
Switching between FLA and NFLA requires fully emptying the grain bin and removing the target, so the target is not in the same position between tests (Ideally, we would have placed the target in as close a position for both the FLA and NFLA tests, but experimental error led us to place the target in different positions each time. However, we do note that the target is at the same depth in each test and that its x/y position is rotated approximately 180 . Since the bin is symmetric to 180-degree rotations, we do not expect the differing target position to have a major effect on image quality).
For the FLA results in Figure 10, the target center was measured about ( x , y , z ) = ( 0 , 14 , 57 ) cm. Based on Figure 10, we can estimate the size and position of the target; these values have been presented in Table 2. In this table, dimensions of the target at each frequency are d x , d y , and d z where | e x | , | e y | , and | e z | are corresponding relative errors to true dimensions in each direction and have been represented in percentage format. Moreover, p x , p y , and p z are the coordinates for the center of the target. We note that all errors must be taken as approximate as the actual target was not a rectangular cuboid. To calculate the dimensions d i and center, p i , of the target we visually marked the red zones in each direction ( x , y , z ) . We then calculated the distance between each mark and averaged them over each plane. For instance, from Figure 10, we obtain 12 cm and 13 cm for length of target along x-direction from x y and x z side views at 260 MHz, respectively. We then present the obtained dimension as d x = 12.5 cm. Absolute percent errors, % e i in each dimension are based on the approximate target dimensions of 7.5 × 11 × 21 cm 3 . We again emphasize that at 250 MHz, 1 cm is about ( 1 70 ) th of a wavelength in grain.
From the NFLA results shown in Figure 11 and Table 3, it is clear that the NFLAs do not perform as well as the FLAs at the lower frequency (260 MHz) (i.e., The peak R e ( ϵ r ) is not as high, and the reconstructed target is much larger than the true target, particularly in the y-direction). At the higher frequencies, the NFLA images appear to have a more well-delineated target than the FLA images, especially in the z direction. That said, the NFLA-570 MHz results give an incorrectly low estimate of the z-height of the target.

Target Tracking

As a final experiment in the small bin, we performed a series of target tracking experiments with the FLAs where we placed the targets in four different positions. For each position, we performed the full imaging experiment process (i.e., incident field measurement, bury the target, total field measurement, run the parametric optimization on the incident field, calibrate, then run FEM-CSI). The goal of these experiments is to show that the target is properly located in the inversion images and to determine if the position of the target caused large differences in the inversion images (e.g., perhaps the target is reconstructed more accurately depending on its position). We moved the target to positions close to antennas 7, 15, 3, and 19. Figure 12 presents the threshold images for this experiment. Note that, to save space, we present two different positions of the target in the same image (but would like to be clear that each image represents two different experiments of imaging a single target).
The target tracking experiments support the claim that inversion results are representative of the true target position, and the reconstructed target size/position is not highly dependent on the target position.

8. A Preliminary Experiment in 28 m 3 (800 bu) Grain Bins

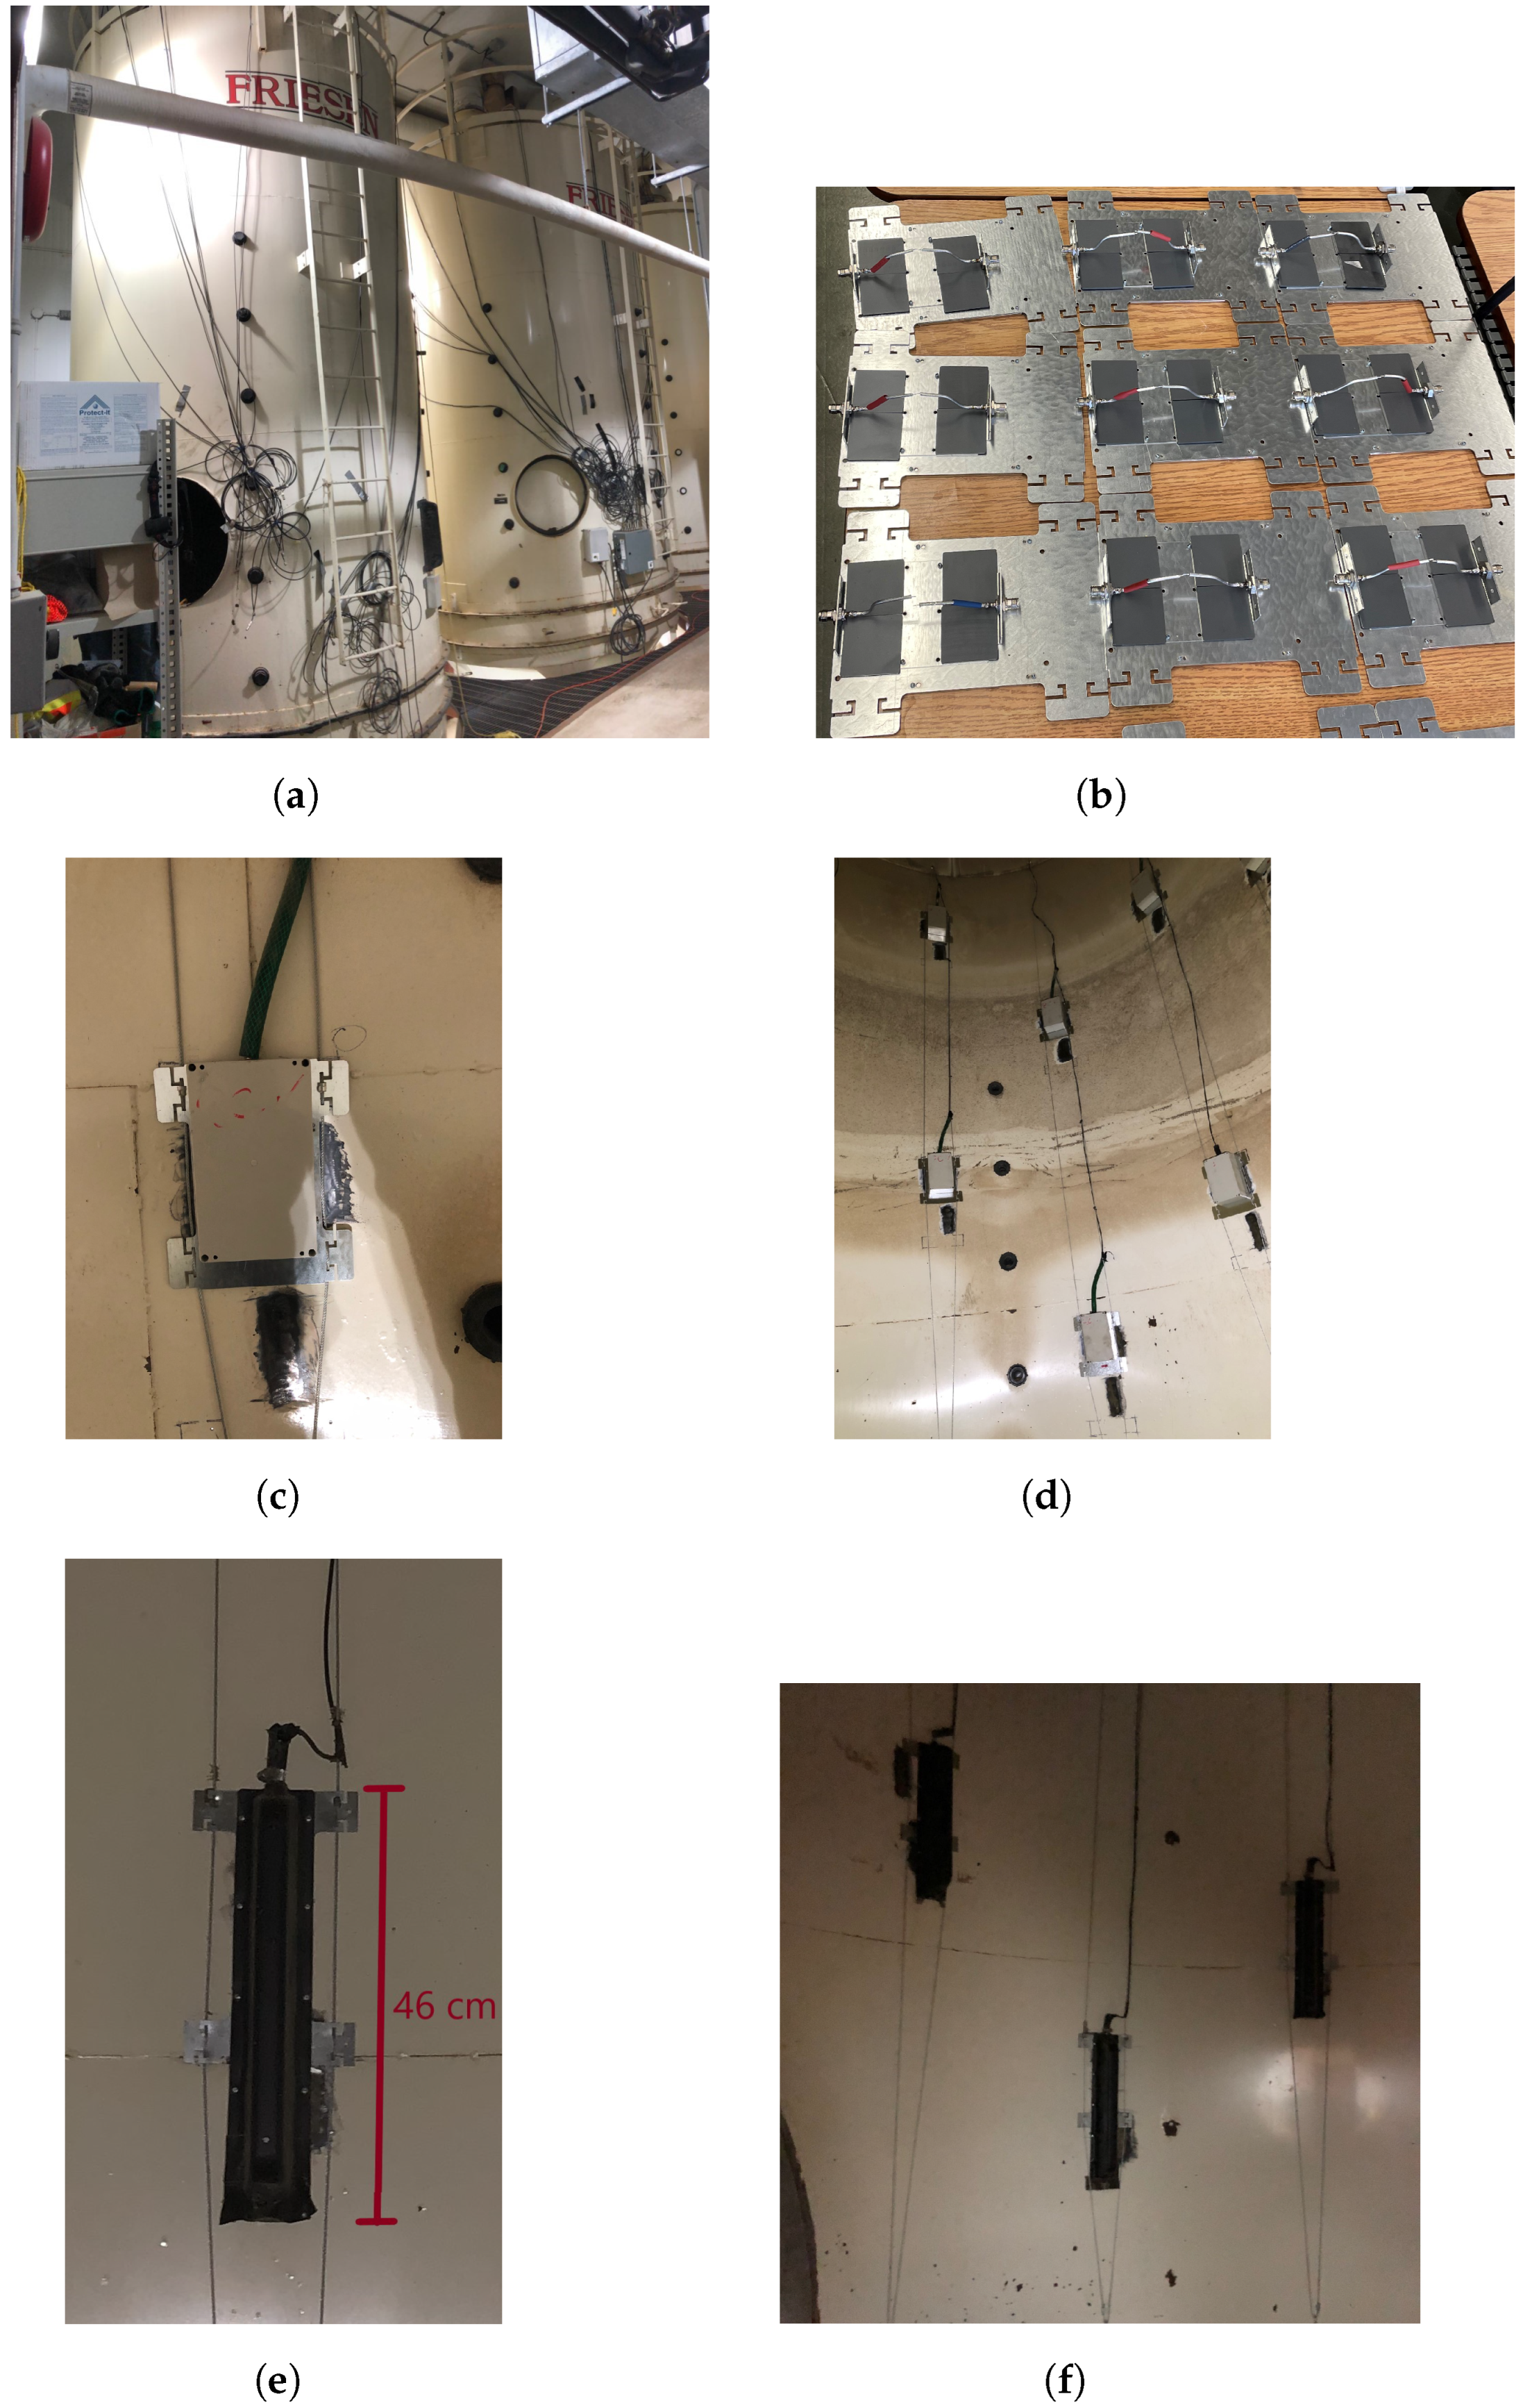
To verify that newly designed FLAs work inside larger grain bins (i.e., not a small-sized experiment), we present preliminary results from larger-sized FLAs in a 28 m 3 (800 bushel) bin filled with canola at the University of Manitoba’s Grain Storage Research facility. Unlike the scaled test, we are unable to directly compare FLA and NFLA antennas of the same size design (i.e., with and without the ferrite) as the physical size of the bins precludes changing the antenna structure in situ. However, we do have a comparison bin with FLA antennas of a much larger size as we have an installation of NFLAs in the bin next to the FLA bin. A photo of the two bins is shown in Figure 13a. The two bins have a flat bottom with a diameter of 2.73 m and a height of 4.58 m. We again used 24 antennas in each bin. In bins this size, we have typically used inversion frequencies of (120–180) MHz.
The design and construction of our larger FLA has been shown in Figure 13b and Figure 14a, and is made of semi-rigid coaxial cable R F 195 . Unlike the small FLA in previous sections, this design includes a metallic plate as its ground plane. This plate is used to attach the antenna to the bin’s wall using magnets (see Figure 13c). Two ferrite plates close to each port of the antenna are in the antenna structure. If we cover the entire metallic plate with ferrite material, the antenna’s S 11 will improve by less than 2 dB, therefore to reduce the net cost of the antenna and also consider mechanical issues in large bins, we decided to reduce the number of ferrite plates in the antenna structure. To protect the larger FLAs from the moving grain in the bin, the antenna was enclosed in a hard plastic box (Figure 13c) with dimensions 20 × 12 × 7.5 cm 3 .
Critically important to our results in comparing the two bins, the nominal area of the loop for the FLA antenna is 14 × 3 = 42 cm 2 , while the nominal area of the large NFLA is 47.1 × 11.2 = 527.5 cm 2 . Given that the signal in the loop antenna is properly improved by the area of the antenna, we would expect the larger NFLA to have 12.55 times (or approx 22 dB) more signal than the smaller antenna structure (without the use of the ferrite).
We measured the S 11 of the large FLA and the large NFLA and these results are shown in Figure 14b. These plots show that larger FLA resonance occurs at 120 MHz.

8.1. Large Bin Results

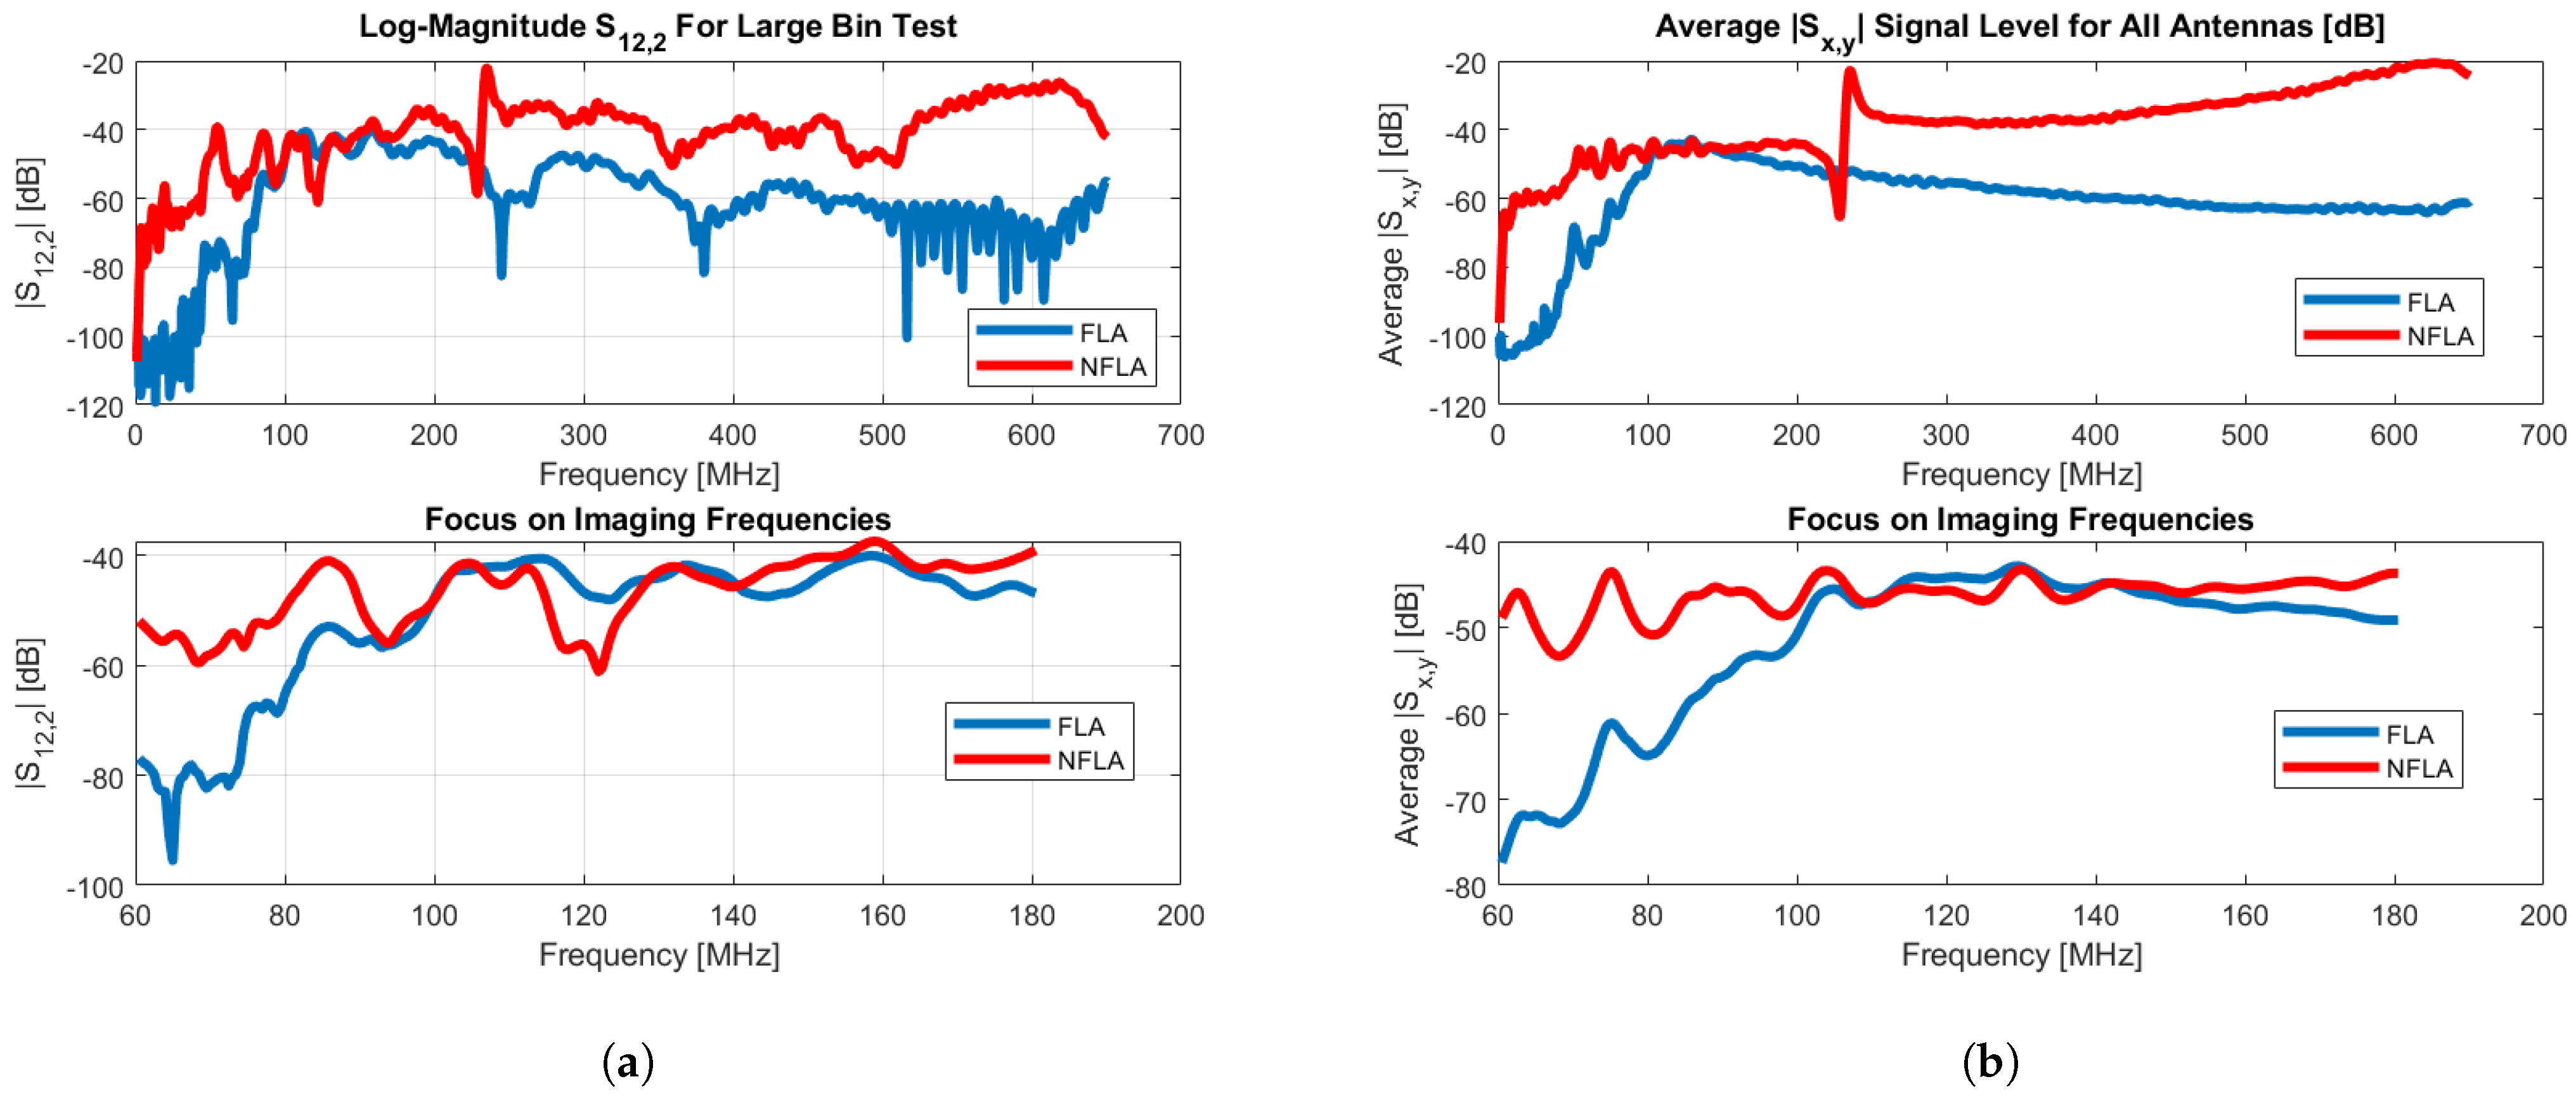
We first show a representative S 12 , 2 result for the FLAs and NFLAs by frequency in Figure 15a. This is followed up by the average of the S x , y signal level over all possible antenna pairs in Figure 15b.
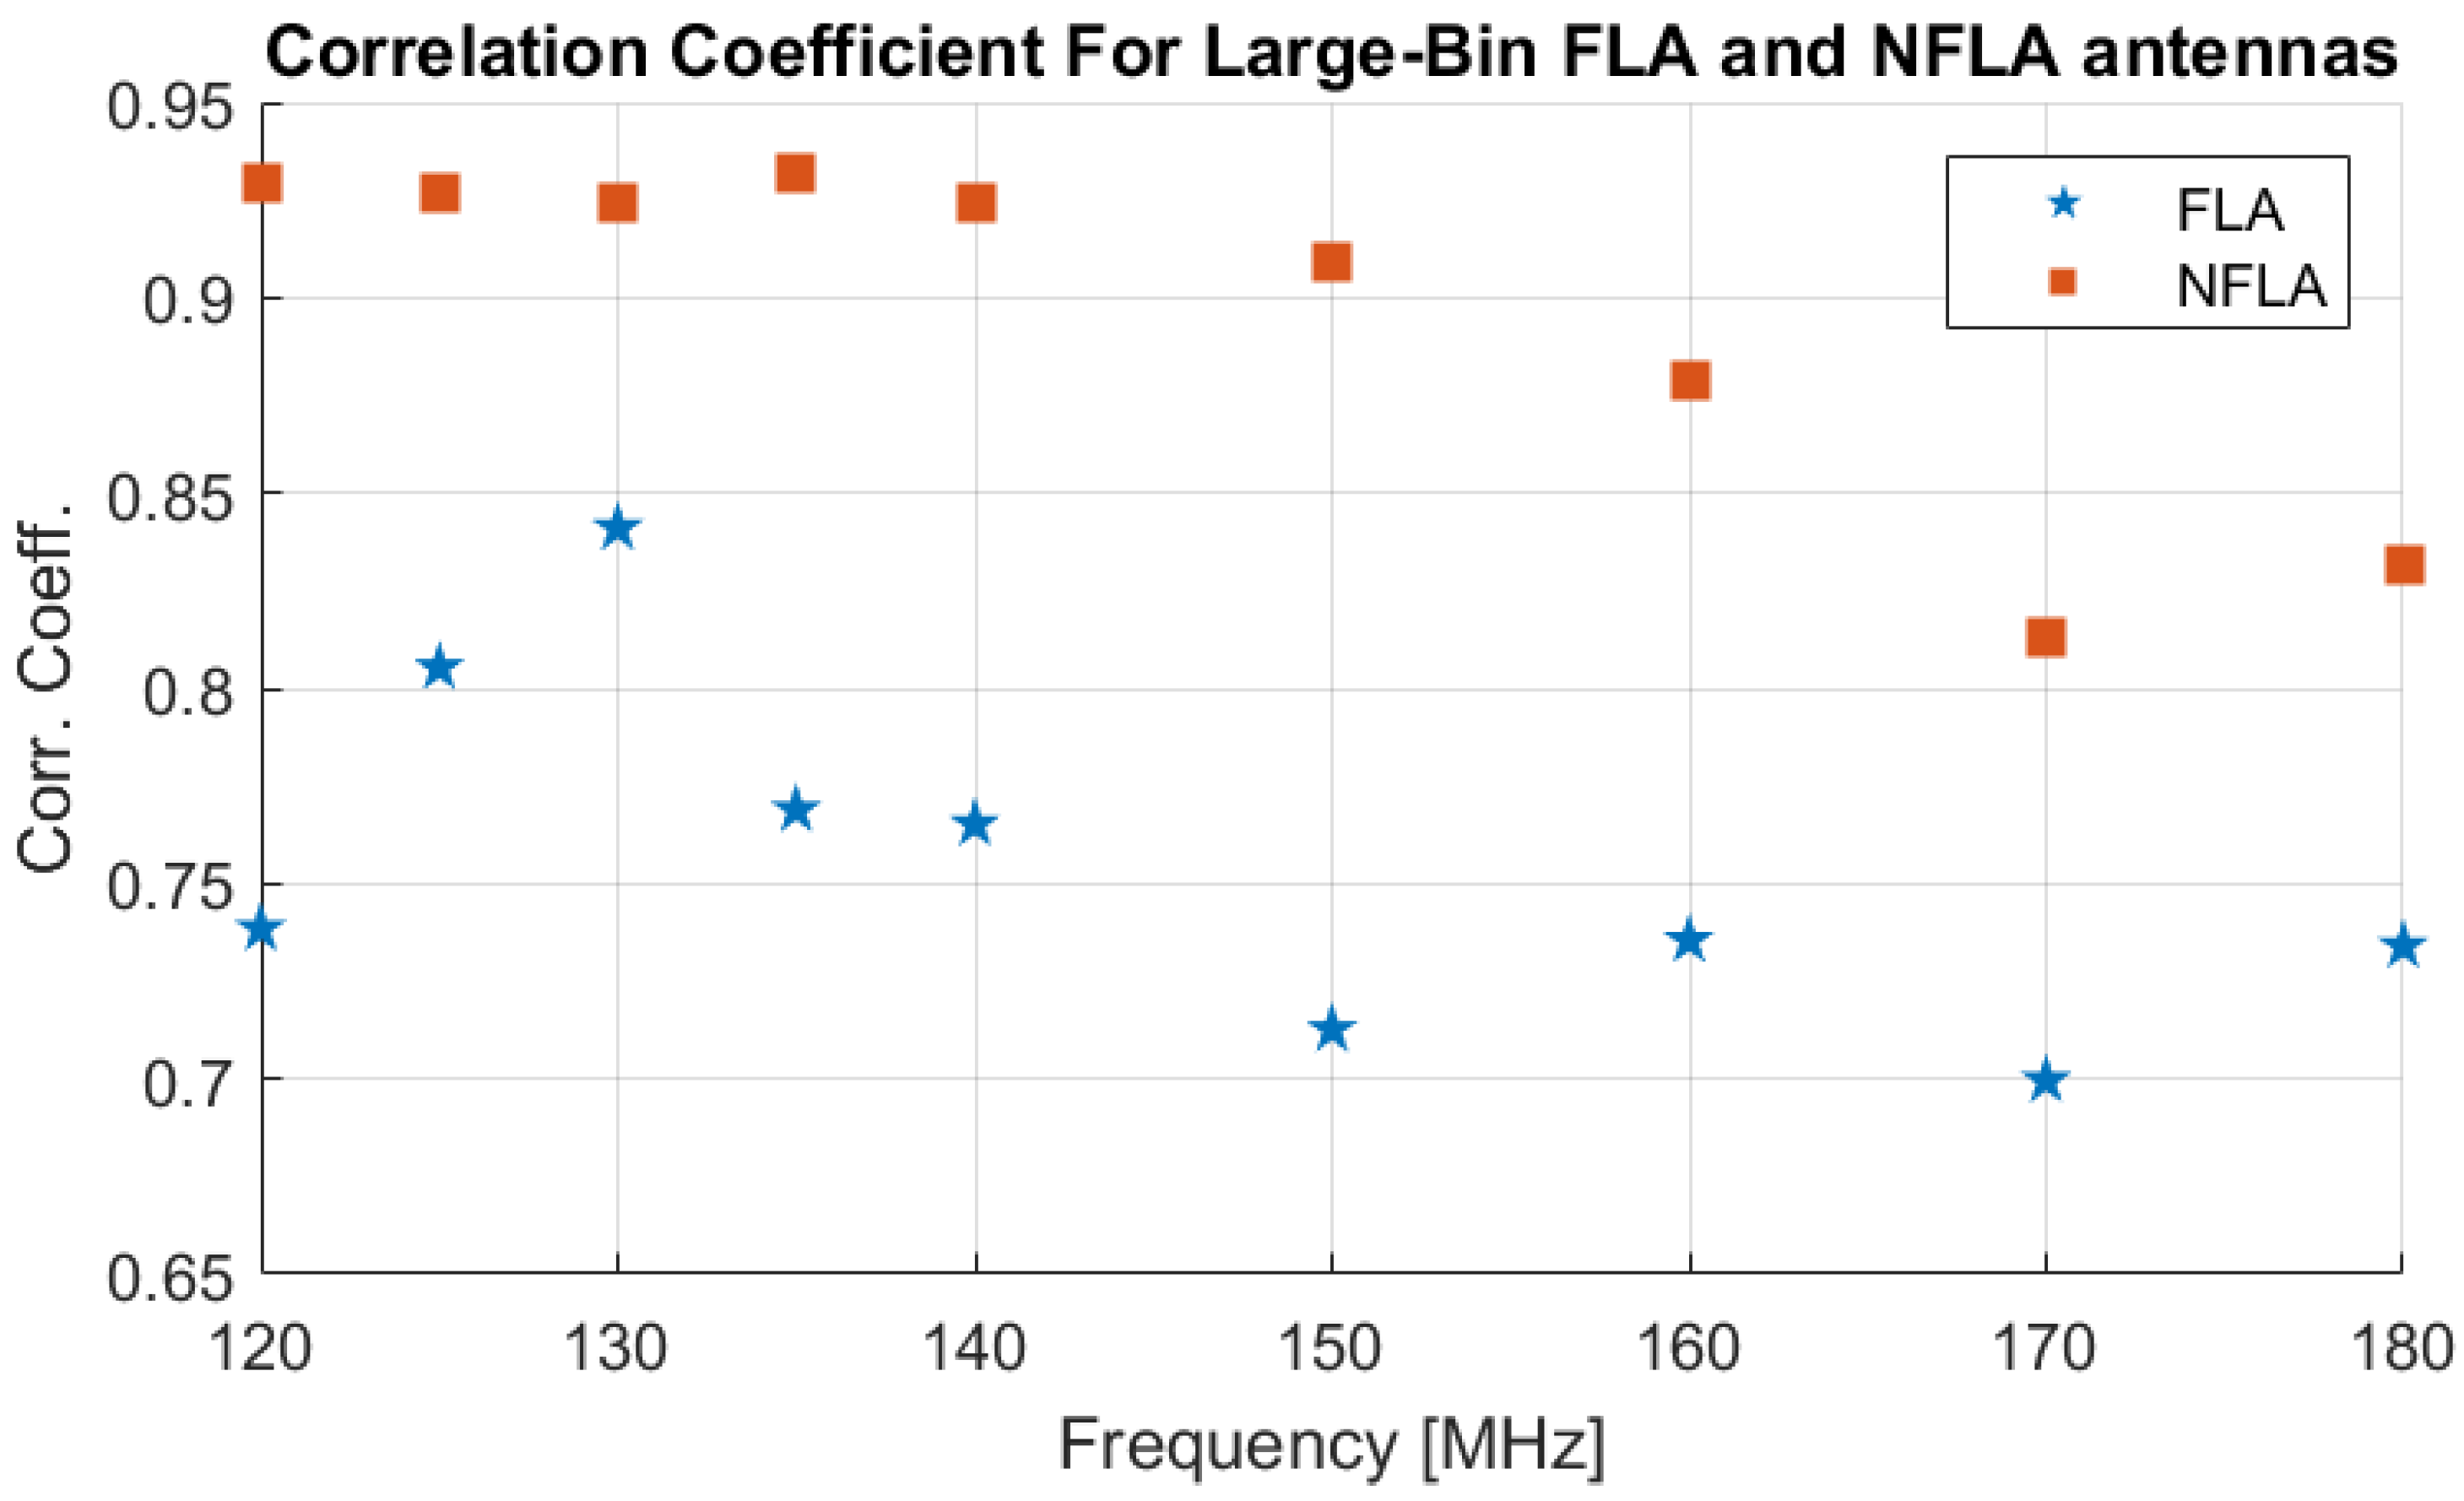
For both the FLA and NFLA large-bin results, we ran the parametric inversion solver to obtain the height/cone angle and average permittivity of the grain at frequencies of 120, 125, 130, 135, 140, 150, 160, and 170 MHz, while not shown in figure form, the estimated heights, cone angles, and average permittivities were very similar between the FLA and NFLA results. For example, FLA heights were in the range of 5.23–5.46 m, NFLA heights were 5.23–5.45 m, FLA real permittivity was between 2.35 and 2.47, and NFLA real perm. was 2.37–2.45, the FLA cone angle was between 1 and 25 , and the NFLA cone angle was between 4 and 25 . Overall, these were very similar to each other. Of more interest were the correlation coefficients: we again computed the correlation coefficients between the computed fields H and the raw data S. The correlation coefficients for the NFLA and FLA cases are shown in Figure 16.

8.2. Large Bin Results Discussion

In turn, each of the bins was filled with approximately 24.5 m 3 (700 bushels) of canola. When the bin was full, we took a full set of electromagnetic measurements. This canola had been stored at room temperature for months and was at a moisture content of 7%. Given the large difference in the size of the loops in the large bin FLA and NFLA antennas, we have shown that the introduction of the ferrite does again increase the raw signal strength using the ferrite. Given that we can expect 12.5 times as much signal from the NFLAs based on loop size, the fact that the average signal strength is within 3–4 dB across the imaging frequency range (see Figure 15b), we can conclude that ferrite antennas have a stronger signal (about 20 dB, similar to the smaller FLAs). Alternatively, one can view that with the ferrite we can reduce the area of the antennas by more than 10 times while maintaining roughly the same signal strength. This has implications for the manufacturing costs and physical robustness of the antennas.
The correlation coefficient results are more puzzling. Unlike the small-bin case, the FLA antennas show a reduced correlation coefficient for all tested frequencies. This means that the bin with the FLA antennas does not match the computational model in the optimization algorithm as well as the bin with the NFLA antennas. We do note that this loss of correlation coefficient does not seem to cause large differences in the result in terms of estimating the height/cone angle/permittivity of the stored grain.
We see several possibilities for the difference in correlation coefficients: (a) due to the enclosure, there is a permanent air gap around the FLA, even when the canola is present, (b) the two bins’ dimensions could be different and the FLA bin may have differences in its size/height or deformities in the bin that are not modeled, (c) the fact that the ferrite is not attached directly to the bin wall but is on the steel mounting plate may make a difference, (d) the larger FLAs do not model a magnetic dipole point source as well as the smaller (barrel) FLA antennas, and (e) the FLAs being installed vertically instead of horizontally is making a difference. The cause of the lower correlation coefficients could be a combination of any of these causes. Sorting out these reasons remains the subject of future work.

9. Discussion and Conclusions

We have designed an improved ferrite-loaded antenna for imaging applications inside metallic enclosures (i.e., grain storage bins). For two experiments of very different bins, the FLAs provide on the order 18–22 dB more S x y signal level than the NFLAs. Inside a smaller experiment, this signal improvement occurs while maintaining (or even improving on) the important characteristics of the NFLAs. Inside the larger bin, the match between the computational model and the antennas appears to be worse for the FLAs. In both large and small experiments, the FLA and NFLA antennas provide similar estimates of the grain height/permittivity and cone angle. Such FLAs remain a promising avenue for improving signal levels in much larger bins and reducing the antenna size in smaller bins where the signal level is already at an acceptable level.
For the small-bin test, we were able to take several measurements of high-moisture targets in the bin which showed that the FLA antennas provided improvements in the detection of such high-moisture targets. Future work will focus on re-designing this antenna concept for use in larger industrial bins and determining methods of improving the computational model of the antenna in the imaging algorithms.

Author Contributions

Conceptualization, C.T.M., M.A., J.P. and C.G.; methodology, C.T.M., S.T., M.A., J.P. and C.G.; software, C.T.M. and C.G.; validation, C.M, J.P. and C.G.; formal analysis, All; investigation, All; resources, C.G., M.A. and J.P.; data curation, C.T.M. and C.G.; writing—original draft preparation, C.T.M. and C.G.; writing—review and editing, All; visualization, C.T.M.; supervision, C.G., M.A. and J.P.; project administration, C.G., M.A. and J.P.; funding acquisition, C.G., M.A. and J.P. All authors have read and agreed to the published version of the manuscript.

Funding

This research received no external funding.

Acknowledgments

The authors would like to thank the Canada Research Chair program, MITACS, Canadian Foundation for Innovation (CFI), the Natural Sciences and Engineering Research Council of Canada, and AGCO Corporation (Winnipeg office).

Conflicts of Interest

The authors declare no conflict of interest.

References

  1. Harrington, R. Time-Harmonic Electromagnetic Fields; Harrington RF: New York, NY, USA; Chichester, UK, 2001. [Google Scholar]
  2. Tajik, D.; Foroutan, F.; Shumakov, D.S.; Pitcher, A.D.; Nikolova, N.K. Real-Time Microwave Imaging of a Compressed Breast Phantom with Planar Scanning. IEEE J. Electromagn. RF Microwaves Med. Biol. 2018, 2, 154–162. [Google Scholar] [CrossRef]
  3. Golnabi, A.H.; Meaney, P.M.; Geimer, S.; Zhou, T.; Paulsen, K.D. Microwave tomography for bone imaging. In Proceedings of the 2011 IEEE International Symposium on Biomedical Imaging: From Nano to Macro, Chicago, IL, USA, 30 March–2 April 2011; pp. 956–959. [Google Scholar] [CrossRef]
  4. Garrett, D.C.; Fear, E.C. Feasibility Study of Hydration Monitoring Using Microwaves—Part 1: A Model of Microwave Property Changes with Dehydration. IEEE J. Electromagn. RF Microwaves Med. Biol. 2019, 3, 292–299. [Google Scholar] [CrossRef]
  5. Li, F.; Chen, X.; Huang, K.M. Microwave imaging a buried object by the GA and using the S11 parameter. Prog. Electromagn. Res. 2008, 85, 289–302. [Google Scholar] [CrossRef] [Green Version]
  6. Tobon Vasquez, J.A.; Scapaticci, R.; Turvani, G.; Ricci, M.; Farina, L.; Litman, A.; Casu, M.R.; Crocco, L.; Vipiana, F. Noninvasive Inline Food Inspection via Microwave Imaging Technology: An Application Example in the Food Industry. IEEE Antennas Propag. Mag. 2020, 62, 18–32. [Google Scholar] [CrossRef]
  7. Mohammed, B.J.; Abbosh, A.M.; Mustafa, S.; Ireland, D. Microwave System for Head Imaging. IEEE Trans. Instrum. Meas. 2014, 63, 117–123. [Google Scholar] [CrossRef]
  8. Ireland, D.; Bialkowski, M. Microwave Head Imaging for Stroke Detection. Prog. Electromagn. Res. M 2011, 21, 163–175. [Google Scholar] [CrossRef] [Green Version]
  9. Li, B.; Liu, H.; Zhang, Z.; Gao, X. A Rapid Microwave Imaging Approach for the Diagnosis of Traumatic Brain Injury. Prog. Electromagn. Res. M 2021, 104, 71–80. [Google Scholar] [CrossRef]
  10. Tournier, P.H.; Hecht, F.; Nataf, F.; Bonazzoli, M.; Rapetti, F.; Dolean, V.; Semenov, S.; El Kanfoud, I.; Aliferis, I.; Migliaccio, C.; et al. Microwave tomography for brain stroke imaging. In Proceedings of the 2017 IEEE International Symposium on Antennas and Propagation & USNC/URSI National Radio Science Meeting, San Diego, CA, USA, 9–14 July 2017; pp. 29–30. [Google Scholar]
  11. Golnabi, A.H.; Meaney, P.M.; Geimer, S.D.; Paulsen, K.D. 3-D microwave tomography using the soft prior regularization technique: Evaluation in anatomically realistic MRI-derived numerical breast phantoms. IEEE Trans. Biomed. Eng. 2019, 66, 2566–2575. [Google Scholar] [CrossRef]
  12. Asefi, M.; Baran, A.; LoVetri, J. An experimental phantom study for air-based quasi-resonant microwave breast imaging. IEEE Trans. Microw. Theory Tech. 2019, 67, 3946–3954. [Google Scholar] [CrossRef]
  13. Nikolova, N.K. Microwave Imaging for Breast Cancer. IEEE Microw. Mag. 2011, 12, 78–94. [Google Scholar] [CrossRef]
  14. Fear, E.; Meaney, P.; Stuchly, M. Microwaves for breast cancer detection? IEEE Potentials 2003, 22, 12–18. [Google Scholar] [CrossRef]
  15. Bindu, G.; Anil, L.; Vinu, T.; Aanandan, C.K.; Mathew, K.T. Active Microwave Imaging for Breast Cancer Detection. Prog. Electromagn. Res. 2005, 58, 149–169. [Google Scholar] [CrossRef] [Green Version]
  16. Lai, J.C.Y.; Soh, C.B.; Gunawan, E.; Low, K.S. UWB Microwave Imaging for Breast Cancer Detection—Experiments with Heterogeneous Breast Phantoms. Prog. Electromagn. Res. 2011, 16, 19–29. [Google Scholar] [CrossRef] [Green Version]
  17. Chong, J.; Lai, Y.; Soh, C.B.; Gunawan, E.; Low, K.S. Homogeneous and Heterogeneous Breast Phantoms for Ultra-Wideband Microwave Imaging Applications. Prog. Electromagn. Res. 2010, 100, 397–4159. [Google Scholar]
  18. Edwards, K.; LoVetri, J.; Gilmore, C.; Jeffrey, I. Machine-Learning-Enabled Recovery of Prior Information from Experimental Breast Microwave Imaging Data; American Society of Agricultural and Biological Engineers: St. Joseph, MI, USA, 2022; Volume 175, pp. 1–11. [Google Scholar]
  19. Asefi, M.; Zakaria, A.; LoVetri, J. Microwave imaging using normal electric-field components inside metallic resonant chambers. IEEE Trans. Microw. Theory Tech. 2016, 65, 923–933. [Google Scholar] [CrossRef]
  20. Asefi, M.; Faucher, G.; LoVetri, J. Surface-current measurements as data for electromagnetic imaging within metallic enclosures. IEEE Trans. Microw. Theory Tech. 2016, 64, 4039–4047. [Google Scholar] [CrossRef]
  21. Gilmore, C.; Asefi, M.; Nemez, K.; Paliwal, J.; LoVetri, J. Three dimensional radio-frequency electromagnetic imaging of an in-bin grain conditioning process. Comput. Electron. Agric. 2019, 167, 105059. [Google Scholar] [CrossRef]
  22. Gilmore, C.; Asefi, M.; Paliwal, J.; LoVetri, J. Industrial scale electromagnetic grain bin monitoring. Comput. Electron. Agric. 2017, 136, 210–220. [Google Scholar] [CrossRef]
  23. Nelson, S.O.; Trabelsi, S. Historical development of grain moisture measurement and other food quality sensing through electrical properties. IEEE Instrum. Meas. Mag. 2016, 19, 16–23. [Google Scholar] [CrossRef]
  24. Zakaria, A.; Jeffrey, I.; LoVetri, J. Full-vectorial parallel finite-element contrast source inversion method. Prog. Electromagn. Res. 2013, 142, 463–483. [Google Scholar] [CrossRef]
  25. Van Den Berg, P.M.; Kleinman, R.E. A contrast source inversion method. Inverse Probl. 1997, 13, 1607. [Google Scholar] [CrossRef]
  26. Lewis, M.A.; Trabelsi, S.; Nelson, S.O. Development of an eighth-scale grain drying system with real-time microwave monitoring of moisture content. Appl. Eng. Agric. 2019, 35, 767–774. [Google Scholar] [CrossRef]
  27. Mohadi, C.T.; Asefi, M.; Gilmore, C. Ferrite Loaded Shielded Half Loop Antenna for Electromagnetic Imaging inside Metallic Chambers. In Proceedings of the 2021 IEEE 19th International Symposium on Antenna Technology and Applied Electromagnetics (ANTEM), Winnipeg, MB, Canada, 8–11 August 2021; pp. 1–2. [Google Scholar]
  28. Trabelsi, S.; Nelson, S.O. Microwave moisture meter for granular and particulate materials. In Proceedings of the 2010 IEEE Instrumentation Measurement Technology Conference Proceedings, Austin, TX, USA, 3–6 May 2010; pp. 1304–1308. [Google Scholar] [CrossRef]
  29. Nelson, S.; Kraszewski, A.; Trabelsi, S.; Lawrence, K. Using cereal grain permittivity for sensing moisture content. IEEE Trans. Instrum. Meas. 2000, 49, 470–475. [Google Scholar] [CrossRef] [Green Version]
  30. King, R.; King, K. Microwave moisture measurement of grains. In Proceedings of the IEEE Instrumentation and Measurement Technology Conference, Atlanta, GA, USA, 14–16 May 1991; pp. 506–512. [Google Scholar] [CrossRef]
  31. Trabelsi, S.; Nelson, S.O. Free-space measurement of dielectric properties of cereal grain and oilseed at microwave frequencies. Meas. Sci. Technol. 2003, 14, 589–600. [Google Scholar] [CrossRef]
  32. King, R.J.; King, K.; Woo, K. Microwave moisture measurement of grains. IEEE Trans. Instrum. Meas. 1992, 41, 111–115. [Google Scholar] [CrossRef]
  33. Nelson, S.O. Measurement and applications of dielectric properties of agricultural products. IEEE Trans. Instrum. Meas. 1992, 41, 116–122. [Google Scholar] [CrossRef]
  34. Kandala, C.V.; Butts, C.L.; Nelson, S.O. Capacitance sensor for nondestructive measurement of moisture content in nuts and grain. IEEE Trans. Instrum. Meas. 2007, 56, 1809–1813. [Google Scholar] [CrossRef]
  35. Nelson, S.O.; Trabelsi, S. A Century of Grain and Seed Moisture Sensing through Electrical Properties; American Society of Agricultural and Biological Engineers: St. Joseph, MI, USA, 2011; p. 1. [Google Scholar]
  36. Gilmore, C.; Jeffrey, I.; Asefi, M.; Geddert, N.T.; Brown, K.G.; Lovetri, J. Phaseless parametric inversion for system calibration and obtaining prior information. IEEE Access 2019, 7, 128735–128745. [Google Scholar] [CrossRef]
  37. Vittoria, C. Magnetics, Dielectrics, and Wave Propagation with MATLAB® Codes; CRC Press: Boca Raton, FL, USA, 2011. [Google Scholar]
  38. Xu, J.; Koledintseva, M.Y.; Zhang, Y.; He, Y.; Matlin, B.; DuBroff, R.E.; Drewniak, J.L.; Zhang, J. Complex permittivity and permeability measurements and finite-difference time-domain simulation of ferrite materials. IEEE Trans. Electromagn. Compat. 2010, 52, 878–887. [Google Scholar] [CrossRef]
  39. Patel, R.H.; Desai, A.; Upadhyaya, T. A discussion on electrically small antenna property. Microw. Opt. Technol. Lett. 2015, 57, 2386–2388. [Google Scholar] [CrossRef]
  40. Lawrence, K.; Nelson, S.; Bartley, P., Jr. Measuring dielectric properties of hard redwinter wheat from 1 to 350 MHZ with a flow-through coaxial sample holder. Trans. ASAE 1998, 41, 143. [Google Scholar] [CrossRef]
  41. Karunakaran, C.; Muir, W.; Jayas, D.; White, N.; Abramson, D. Safe storage time of high moisture wheat. J. Stored Prod. Res. 2001, 37, 303–312. [Google Scholar] [CrossRef]
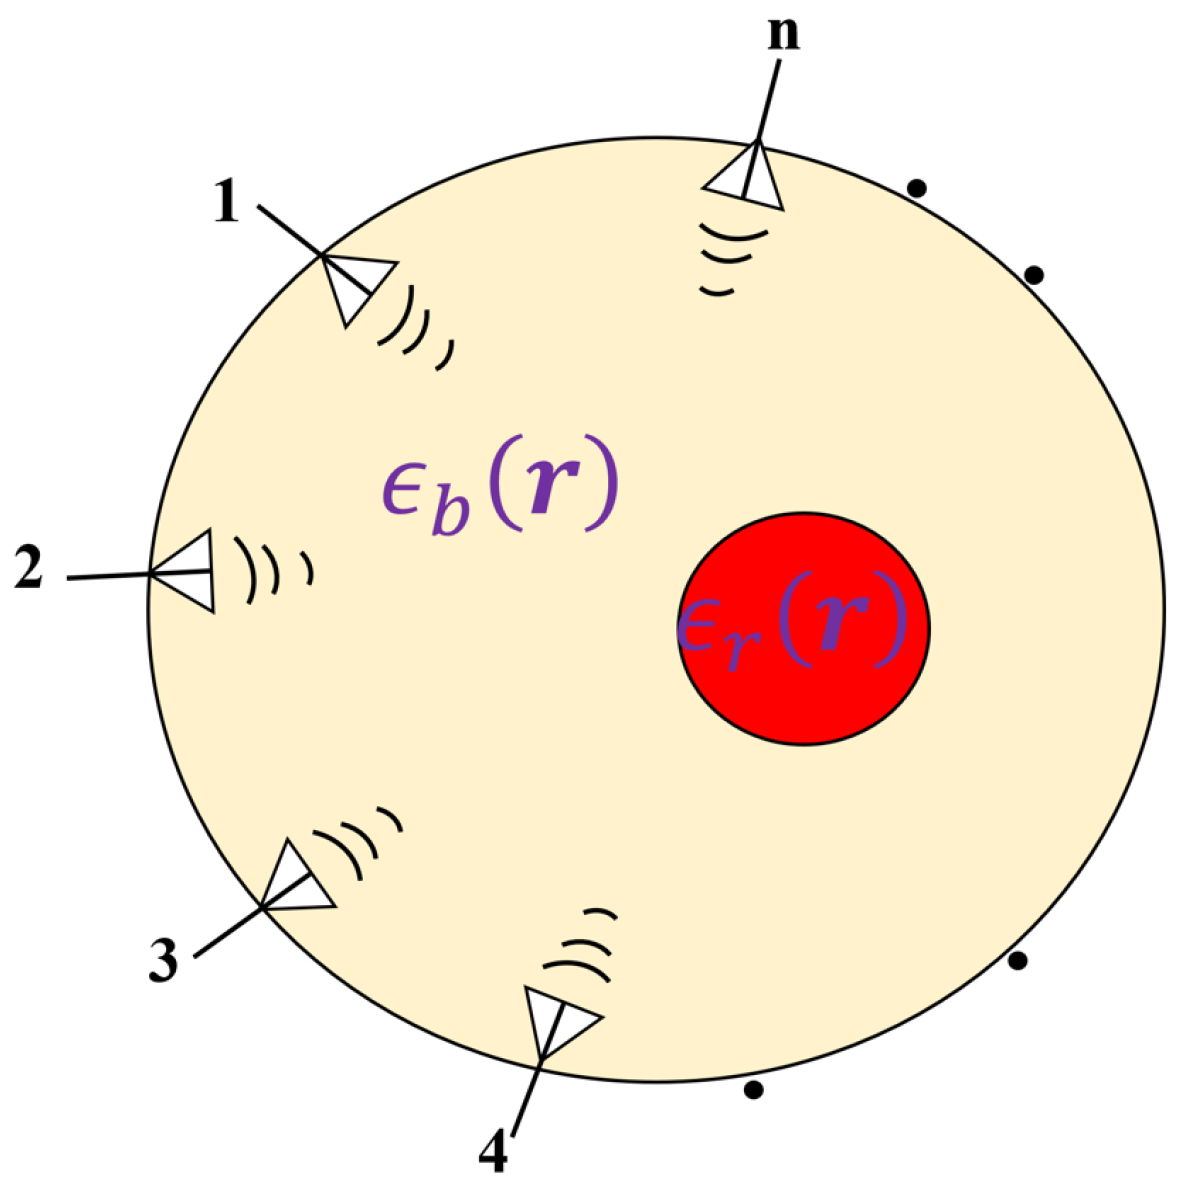
Figure 1. General schematic of imaging system where Tx/Rx antennas have been installed on the boundaries of imaging region.
Electronics 11 03804 g001
Figure 2. Schematic Of Existing Half-Loop Antenna. The antenna is mounted to the bin wall and consists of a coaxial cable loop with a cut in the outer shield of the cable at the center of the loop.
Electronics 11 03804 g002
Figure 3. Debye model of the ferrite: (a) relative permeability and (b) relative permittivity.
Electronics 11 03804 g003
Figure 4. FLA structure, where aqua color (region of l × w × t ) is Ferrite Plate (FP) and other parts are shielded coaxial cable RG405. (a) perspective view, (b) top view, (c) side view, (d) front view, and (e) bottom view. Dimensions in mm are, l = 100 , w = 56 , h = 22 , t = 1.1 , and g = 0.5 .
Electronics 11 03804 g004
Figure 5. Simulated and measured the magnitude of the reflection coefficient of FLA and measured the reflection coefficient of NFLA. The photo of the installed FLA inside the metallic bin has been shown in the bottom right side of the plot, too.
Electronics 11 03804 g005
Figure 6. Comparison of FLA and NFLA performance in the scaled grain bin, measured: (a) | S 21 | of FLA and NFLA, and (b) Increase in | S 21 | for the FLA over the NFLA.
Electronics 11 03804 g006
Figure 7. (a) block diagram and (b) real laboratory system used in microwave bin imaging.
Electronics 11 03804 g007
Figure 8. Target close to FLA 15 while it is in the bucket before covering with wheat.
Electronics 11 03804 g008
Figure 9. (a) Correlation coefficients between | S i n c | and | H b k g | for FLA and NFLA. Data sets have been taken with no target in the bin. A correlation coefficient of 1 would indicate an ideal computational model of the bin, (b) comparing height estimation at different frequencies for FLA and NFLA, (c) Comparing position angle estimation at different frequencies for FLA and NFLA, and (d) Comparing relative permittivity ( ϵ r ) estimation at different frequencies for FLA and NFLA. Note that the x-axis (frequency) division is not uniform.
Electronics 11 03804 g009
Figure 10. Full 3D R e ( ϵ r ) image when using FLAs. The top row is the reconstruction of 260 MHz data, the bottom one is 570 MHz. (a,e) show the x - y plane, (b,f) show the x - z plane and (c,g) show the y - z plane. Images (d,h) show 3D threshold images with all cells R e ( ϵ r ) > 3.6 solid. The color scale shown at the bottom is common to all images in this paper.
Electronics 11 03804 g010
Figure 11. Full 3D R e ( ϵ r ) image when using NFLAs. The top row is the reconstruction of 260 MHz data, the bottom one is 570 MHz. (a,e) show the x - y plane, (b,f) show the x - z plane and (c,g) show the y - z plane. Images (d,h) show 3D threshold images with all cells R e ( ϵ r ) > 3.6 solid.
Electronics 11 03804 g011
Figure 12. Target tracking at 260 MHz with FLAs, where A# represents the target’s location close to those antennas in the 3rd layer. In each image, we have superimposed two target positions to save space (i.e., each target position represents a separate experiment with a single wet-grain region present). (a,c) shows a perspective view of the target and (b,d) shows the top view of the target’s position according to its distance to the closest antenna in the 3rd layer. Threshold criteria have been chosen 90 % of maximum scaled relative permittivity, i.e., 3.6.
Electronics 11 03804 g012
Figure 13. Large bin experiment. (a) Two, 28 m 3 (800 bushel) bins, (b) Nine FLAs under construction, (c) close up of an FLA inside its enclosure in the left bin, (d) installed FLAs in the left bin, (e) close up of NFLA in the right bin, (f) installed NFLAs in the right bin. The area of the FLA loop antenna is 42 cm 2 , while the area of the black NFLA loop antenna is ≈527 cm 2 .
Electronics 11 03804 g013
Figure 14. (a) Dimensions of the large FLA in mm are: w g = 56 ; l g = 160 ; h g = 10 ; w f = 56 ; l f = 100 ; l l = 140 ; w l = 30 ; g = 1 . Note that aqua colors, two regions with dimensions l f × w f ( = w g ) , are Ferrite Plates (FP1 and FP2). They both have a thickness of 2.2 mm which has not been shown in the figure. (b) Measured magnitude of the reflection of large FLA and large NFLA.
Electronics 11 03804 g014
Figure 15. Results from a 28 m 3 (800 bu) bin filled with approximately 24.5 m 3 (700 bu) of canola. (a) Representative S-parameter ( S 12 , 2 ) for large-bin FLA and NFLA antennas (b) average of S x , y signal strength overall all possible antenna pairs. Note that the NFLA antennas have 12.55 times the loop area as the FLA antennas, thus absent any ferrite we would expect 22 dB more signal from the NFLAs over the FLAs.
Electronics 11 03804 g015
Figure 16. Comparison of FLA and NFLA correlation coefficients in the two 800 bu bins.
Electronics 11 03804 g016
Table 1. Debye’s second order ferrite model’s parameters.
ParameterValueParameterValue
ϵ 15.271 μ 1
ϵ s 1 24.835 μ s 1 271.227
ϵ s 2 16.75 μ s 2 104.46
ϵ s 3 - μ s 3 22.282
τ 1 e (s) 1.042 × 10 7 τ 1 h (s) 1.142 × 10 8
τ 2 e (s) 3.168 × 10 9 τ 2 h (s) 2.364 × 10 9
τ 3 e (s)- τ 3 h (s) 2.532 × 10 8
σ e (s/m) 2.206 × 10 4 σ h (s/m)0
Table 2. FLA Results Target Metrics. Target’s size (d), absolute size errors | e | , and position (p), obtained by imaging with FLAs while target is close to antenna 11.
-260 MHz570 MHz
d x  cm12.511
% | e x | 6747
d y  cm1012.5
% | e y | 914
d z  cm2027.5
% | e y | 431
p x  cm−10
p y  cm−14−14
p z  cm−58−57
Table 3. NFLA Imaging Results Target Metrics. Target’s size and position, obtained by imaging with NFLAs, while the target is close to antenna 3. The absolute value of percentage error in dimension detection has been represented as well.
-260 MHz570 MHz
d x  cm2711
% | e x | 26047
d y  cm1612
% | e y | 459
d z  cm3516
% | e y | 6724
p x  cm00
p y  cm−18−13
p z  cm−60−56
Publisher’s Note: MDPI stays neutral with regard to jurisdictional claims in published maps and institutional affiliations.