Abstract
Determining the most relevant features is a critical pre-processing step in various fields to enhance prediction. To address this issue, a set of feature selection (FS) techniques have been proposed; however, they still have certain limitations. For example, they may focus on nearby points, which lowers classification accuracy because the chosen features may include noisy features. To take advantage of the benefits of the quantum-based optimization technique and the 2D chaotic Hénon map, we provide a modified version of the honey badger algorithm (HBA) called QCHBA. The ability of such strategies to strike a balance between exploitation and exploration while identifying the workable subset of pertinent features is the basis for employing them to enhance HBA. The effectiveness of QCHBA was evaluated in a series of experiments conducted using eighteen datasets involving comparison with recognized FS techniques. The results indicate high efficiency of the QCHBA among the datasets using various performance criteria.
1. Introduction
The enormous increase in the volume of data has resulted in a range of difficulties and issues, including noisy, high-dimensional, and irrelevant data [1]. This results in significant processing costs and adversely affects the effectiveness and accuracy of machine learning systems. Approaches for feature selection (FS) have been used to lower computational costs and increase classification accuracy [2]. Feature selection is the process of limiting the number of collected features into a relevant subset that can be utilized to combat the problem of dimensionality. By choosing a sample of pertinent features, FS techniques are frequently employed to capture data qualities [3]. Additionally, they can eliminate irrelevant and distracting data [3]. FS techniques are frequently used in a variety of disciplines, including COVID-19 CT scan classification [4], text categorization, human activity detection [5,6], MR image segmentation [7,8], data analytics [9,10], parameter estimation of biochemical systems [10], investigation of neuromuscular diseases [11], and other applications [12,13,14].
There are three types of FS methods: wrapper, filter, and embedded [15]. Filter-based methods rely on dataset characteristics without depending on learning technique, while wrapper-based methods evaluate the chosen features using the learning process. Embedded algorithms identify the elements that most effectively improve model accuracy. As a result, procedures based on filters are quicker and more effective than methods based on wrappers. A strategy that can limit the amount of features that must be chosen, while maximising classifier accuracy, is the optimal FS method [15].
Numerous MH algorithms have been successfully applied to address FS issues. These include, the particle swarm optimization (PSO) algorithm [16], the differential evolution (DE) algorithm [17], the genetic algorithm (GA) [18], the grasshopper optimization algorithm (GOA) [19], the gravitational search algorithm (GSA) [20], the slime mould algorithm (SMA) [3], the Harris hawk optimization (HHO) algorithm [21], the marine predator algorithm (MPA) [22] and others [7,8,9,10,23]. An FS strategy has been proposed that is based on the electric fish optimization (EFO) [24]. It was tested on a variety of challenging real-world datasets and performed very well, with the exception of high dimensional issues where it exhibited delayed convergence and a tendency to become stuck in local minima.
The NFL theorem states that no single algorithm can resolve every issue. As a result, a hybridization approach is frequently used to handle a variety of complicated issues, including FS. We utilize an optimizer known as the honey badger algorithm (HBA) [25] which takes its inspiration from the intelligent foraging behavior of honey badger. The authors of [26] developed the honey badger algorithm (HBA), which is an effective optimization technique for determining the ideal size and location of capacitors and other types of DG to reduce the overall active power. Since there are numerous variable quantities with various non-linear characteristics included in the proton exchange membrane fuel cell (PEMFC) design, which must be properly specified to ensure effective modelling, an alternative method to determine the PEMFC parameters was proposed in [27]. This method relies on use of the honey badger algorithm (HBA) as a novel identification approach to determine the PEMFC parameters. A new approach was suggested in [28] to address certain issues and drawbacks of the HBA which are manifest in trapping in local optima, low convergence, and imbalance between exploration and exploitation stages. The approach, known as mHBA is based on use of the dimensional learning hunting (DLH) method, an effective local search technique, which is incorporated into the HBA. In addition, HBA has proved its efficiency in quantum applications as reported in [29]. The authors proposed an IoT-based optimization scheme for task scheduling for minimizing energy in cloud computing using the HBA. The major objective of the present study was to identify the most significant cloud scheduling key. A committee of decision-makers first chose the standards for evaluation. The optimal solution was then determined after assigning weights to each criterion using an optimization technique. Last, but not least, the evaluation metrics included in the CloudSim toolbox, including makespan, energy consumption, and resource utilisation were applied. The results indicated that it might be challenging to match user demands with available cloud resources to improve performance and minimise energy use. This paper offers a work scheduling method that uses the honey badger algorithm (HBA) in a heterogeneous visualized cloud to save energy.
While application of the HBA has demonstrated a number of benefits, it still suffers from limitations that we were motivated to address. This has involved use of the quantum-based optimization (QBO) technique and the 2D chaotic Hénon map. These methods were used to enhance convergence towards a feasible solution, and to improve balancing of exploitation and exploration. To evaluate the performance of the proposed method, a set of eighteen datasets was used. The results were compared with other well-known FS methods. In general, the proposed technique, named QCHBA, starts by setting the value of a set of solutions using the QBO strategy then evaluates the performance of each using the error classification and the ratio of selected features as the fitness value. Then the best solution having the best fitness value is determined. The operators of the HBA and 2D Hénon maps are integrated to enhance the current set of solutions that represent the relevant features. This process is repeated until the terminal conditions occur. The testing sample is then used to assess the performance of the returned best solution using different performance measures. To the best of our knowledge, no integration of the QBO, the 2D Hénon map, and the operators of MH techniques has been proposed to date. This motivated us to apply this integration as an FS method.
The main contributions of this study can be summarized as follows:
- A modified version of the honey badger algorithm is proposed and applied as a feature selection technique.
- Quantum-based optimization and the 2D Hénon chaotic map are used to improve the HBA during the process of selecting relevant features.
- The efficiency of the developed method is evaluated using state-of-the-art FS methods applied to eighteen datasets.
2. Background
2.1. Honey Badger Algorithm (HBA)
The characteristics of the honey badger algorithm (HBA) are described in detail in this section [25]. The design of the HBA was influenced by the foraging behaviour of honey badgers. The honey badger uses its sense of smell as one method of locating its meal, and also uses digging as a second method. The honey badger relies on honey-guide birds to locate and then enter the hives. The “digging phase” was the name used for the first tactic, and the “honey phase” was the name given by the algorithm’s designers to the second tactic. The honey badger’s olfactory sensitivity controls how it moves; when the fragrance is potent, the insect will move quickly, and vice versa [25].
The HBA’s main stages and corresponding equations are as follows:
- Initialization process: During this stage, the problem space’s upper () and lower () boundaries are used to determine the first potential solution. As a result, the first solutions are stochastic sets that may be created using the following method according to Equation (1) [25].where D refers to the dimension of the solution, H represents the total of the potential solutions, and N is the number of solution providers (honey badgers).
- Updating positions: Coordinates of the candidates are updated at this point. For instance, this can involve applying a technique that uses either the digging or honey stages.
- -
- Digging phase: In this phase, the movements of the potential search subjects are influenced by the potency of the predator’s odor and the separation of the honey badger (agent) from the prey (P). The honey badger excavates in a polarized circle. The following is the stated formula for its motion:where measures an insect’s ability to collect food. Hashim et al. [25] reported that the maximum value of that might exist is 6. The intensity is , and the and are random variables with a range of 0 to 1 that were selected from a uniform distribution. The , which serves as a search direction indication, is produced as follows:
- -
- Honey phase: When looking for beehives, honey badgers utilize the honey phase to alter their position relative to the honey lead bird. The following equation was used by Hashim et al. [25] to determine the honey phase:
where P is the best solution obtained so far and is a random number having values between 0 and 1. - Modeling intensity : Since the honey badger perception of insect scent governs its behavior, Hashim et al. [25] created the following formulation for each contender’s scent intensity of the prey.where P is the prey’s location and is a stochastic number in the range [0, 1].
- Modeling the density parameter (): According to Hashim et al. [25], the value serves as a regulator for transmission among the local and global search stages. Hashim et al. [25] hypothesized that is depicted throughout the iterations, as shown below:where IT and IT refer to the current and the total number of iterations, respectively. C is a constant that was recommended to be 2.
- Escaping from local solutions: the algorithm developers [25] employed a warning (Fg) to point out the search direction to avoid getting stuck on local solutions.
The primary structure of the HBA is described in the Algorithm 1 based on the preceding description.
| Algorithm 1 Steps of HBA | |
| 1: | Inputs: Agents size N, number of iterations . |
| 2: | Outputs: The optimal solutions. |
| 3: | Step 1: Calculate the first set of N solutions U with dimension d (i.e., number of unknown variables). |
| 4: | Compute the fitness function of Equation (13) and the corresponding swarm matrix as the best solutions (P). |
| 5: | while (Iter ≤ Iter ) do |
| 6: | Upgrade the value of the decreasing factor through Equation (19). |
| 7: | for (i = 1 to N) do |
| 8: | Compute the intensity through Equation (5). |
| 9: | if then |
| 10: | Upgrade the location of through Equation (15). |
| 11: | else |
| 12: | Upgrade the location of through Equation (4). |
| 13: | Evaluate the new solutions and compute the and assign . |
| 14: | if ≤ then |
| 15: | Set = and = . |
| 16: | if ≤ then |
| 17: | Set = and = . |
2.2. Two-Dimensional Hénon Map
The 2D Hénon map is one of the most popular discrete-time dynamical systems that replicates chaotic behavior [30]. The Hénon map, also known as the Hénon-Pomeau attractor/map, is a discrete-time dynamical system. It is one of the most well-researched examples of chaotic behavior in dynamical systems. The Hénon map converts a point (xn, yn) in the plane to a new point. The map was first presented by Michel Hénon as a condensed form of the Poincaré section of the Lorenz model. The Hénon strange attractor is a group of points, under the classical map, from which an initial plane point would either approach or diverge to infinity. A fractal known as the Hénon attractor has a Cantor set in one direction and is smooth in the other. The mathematical formula of the Hénon map is written as in Equation (7) and its distribution is represented in Figure 1:
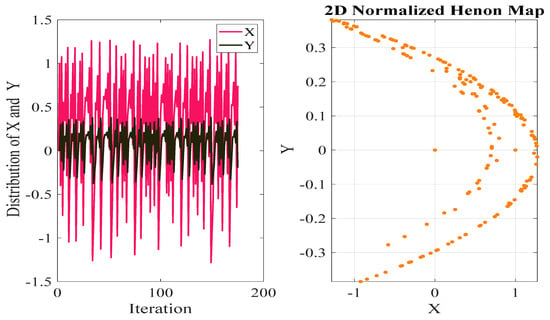
Figure 1.
Hénon attractor, and x, y distributions.
3. Quantum Chaotic Honey Badger Algorithm (QCHBA)
In this approach, the HBA is combined with the two-dimensional Hénon map to improve the fundamental performance of the algorithm. Moreover, the quantum-based optimization technique is used to improve the ability to search to balance exploration and exploitation. In general, the proposed QCHAB approach starts by using the training set that represents 70% of the given dataset to determine the relevant features. Then the solution is generated using the quantum-based optimization technique. This is followed by computing the performance of each solution and determining the optimal solution. The next step is to update the solution according to the strengths of the 2D chaotic maps and the QBO. This updating procedure is repeated until terminal criteria are met and then the best solution is the output of this stage. The next stage involves reducing the features in the testing set to represent 30% of the dataset. Then, the performance of the selected features is evaluated using different performance metrics.
3.1. Initial Solutions
The main purpose of this stage is to generate the set of N solutions (i.e., population) using the QBO technique. These solutions consists of D Q-bits (D refers to the number of features) and this can be given as:
In Equation (8), denotes the superpositions of probabilities of the features that are selected that correspond to ones and features not selected that correspond to zeros.
3.2. Updating Solution
In this stage, the QCHAB starts by obtaining the binary form of solution using the following formula.
In Equation (9), refers to a random value.
Thereafter, the fitness value for each is computed using the following equation.
In Equation (10), is the number of features that correspond to ones. refers to the the error classification obtained from applying the KNN classifier, whereas refers to the parameter that is used to balance the objectives (i.e., the error classification and feature selection).
The next step to compute the fitness value for each then determines the best solution . Then, the modified version of HBA based on the 2D Hénon map is used to update the current solutions. The following is a summary of the proposed modification and controlled equations, in which there are two modifications.
- First modification: The two-dimensional Hénon map is applied to adjust the parameters of C and of Equation (11), respectively, to improve the functionality of the fundamental HBA optimizer. The updated values of C and follow the equation shown below:where and are vectors of the Hénon map and t is the current iteration. The Hénon map vectors are normalized using the numbers 4 and 7 to place them inside the HBA developer’s suggested range. The developers chose to use and C values of 6 and 2, as mentioned in the previous section on the fundamental HBA.The variables and C undergo changes during the course of the iterations with values ranging from 0 to 7 and 0 to 4, respectively.The CHBA uses the values 4 and 7 to provide broad diversity. When implemented, the Hénon map’s initialization is 0 (x(1) = 0; y(1) = 0). Figure 1 shows how the map’s attractor works.
Then the digging phase and the density variable are modeled as
The process of updating the solutions is conducted until the stop conditions are met. Then the best solution is used as the output of this stage.
3.3. Evaluate Quality of
Within this phase, the best solution is used to remove irrelevant features from the testing set. Then, this reduced testing set is used as input to the learned KNN classifier to predict the target of the testing set. The performance of the predicted target is then computed using a set of performance criteria. The QCHBA algorithm steps are listed in Algorithm 2.
| Algorithm 2 Pseudo code of QCHBA | |
| 1: | Inputs: Agents size N, number of iterations , the dataset. |
| 2: | Outputs: The optimal solutions. |
| 3: | Step 1: Calculate the first set of N solutions U with dimension d (i.e., number of unknown variables using QBO as in Equation (9)). |
| 4: | Compute the fitness function as in Equation (10) and the corresponding swarm matrix as the best solutions (P). |
| 5: | Calculate C, and based on Hénon map, using Equation (11) with dimensions of 1* Iter. |
| 6: | while (Iter ) do |
| 7: | Upgrade the value of the decreasing factor through Equation (13). |
| 8: | for (i = 1 to N) do |
| 9: | Compute the intensity through Equation (5). |
| 10: | if then |
| 11: | Upgrade the location of through Equation (12). |
| 12: | else |
| 13: | Upgrade the location of through Equation (4). |
| 14: | Evaluate the new solutions and compute the and assign . |
| 15: | if ≤ then |
| 16: | Set = and = . |
| 17: | if ≤ then |
| 18: | Set = and = . |
| 19: | Evaluate the performance of the best solution using the testing set. |
4. Experimental Results
4.1. Data Description
The evaluation of the performance of QCHBA was performed using eighteen UCI datasets [31]. The characteristics of these datasets are detailed in Table 1. From these characteristics, it can be observed that there are different classes, features, and samples, and that they derive from different domains.

Table 1.
Dataset descriptions.
4.2. Performance Measures
Six performance metrics are presented in this section that were used to assess how well the proposed methods performed. These metrics included the averages of the accuracy, standard deviation (Std), fitness value, minimum fitness value (Min), and maximum fitness value (Max). All algorithms were used 25 times to obtain the performance metric averages.
- Accuracy (Acc): The corrected classified data ratio was calculated using this metric. It was determined using Equation (14).where FN, TN, FP and TP denote false negative, true negative, false positive, and true positive, respectively.
- Fitness value: This metric assesses the effectiveness of the techniques using the fitness function as in Equation (10).
- Maximum of the fitness value: This metric captures the highest result that the fitness function for each method can achieve.
- Minimum of the fitness value: This metric captures the lowest result that the fitness function for each method can achieve.
- Selected features: This metric keeps track of how many chosen features each algorithm is able to produce.
- Standard deviation: This metric assesses an algorithm’s consistency throughout numerous executions. The calculation is as in Equation (17).The parameter refers to the number of runs and refers to the given fitness value. Its average is given by . Whereas, refers to the best at run i.
The results of the QCHBA were compared with the electric fish optimization (EFO) [24], the sinusoidal parameter adaptation incorporated with L-SHADE (LSEpSin) [32], the grey-wolf optimization algorithm (GWO) [33], the reptile search algorithm (RSA) [34], the L-SHADE with semi-parameter adaptation (LSHADECS) [35], and the self-adaptive differential evolution (SaDE) [36].
4.3. Results and Discussion
The results obtained for the proposed QCHBA and the other FS methods are introduced in this section. The comparison was performed with the traditional HBA, the chaotic HAB, GWO, EFO, RSA, LSHADE, LSHADECS, and SaDE. In the initial investigations, the parameter settings of these FS algorithms were set as for the original implementation. The common parameters were set as and . To ensure a fair comparison, each method was run 25 times. The dataset was split into a training set representing 80% of the total and a testing set representing 20% of the total.
The results for the QCHBA and the other methods based on the average fitness values are given in Table 2. It can be seen from these results that the QCHBA had the smallest value at seven datasets, which represented nearly 39% of the the tested data. Both the CHBA and the HBA showed best performance of nearly 22% of the datasets. Figure 2 shows the average of each algorithm among the tested datasets based on the average fitness value. From this figure, it can be seen that the QCHBA had the smallest average overall compared to the other algorithms. This was followed by the traditional HBA and CHBA which had the second and third best fitness value averages, respectively. LSHADECS was the worst algorithm based on the average fitness value obtained in this study.

Table 2.
Results of QCHBA based on average of fitness values.
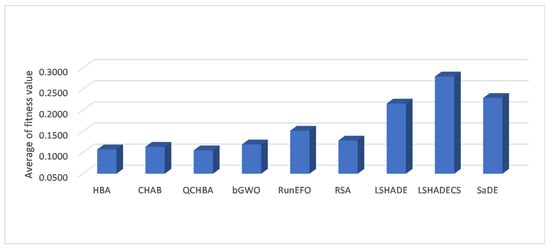
Figure 2.
Competitive results of QCHBA and other methods in terms of average fitness values.
The stability of the competitive methods is given in Table 3. From the values for the standard deviation (STD) of the fitness values for each method, it can be seen that the LSHADE was the most stable method overall. The STD results for the QCHBA indicated that its stability was better than the remaining methods with the second best performance. The EFO, SaDE, HBA, RSA, and LSHADECS methods occupied the subsequent ranks, respectively, based on their STD values. The same conclusions may be drawn from Figure 3.

Table 3.
Stability of competitive algorithms based on fitness values.
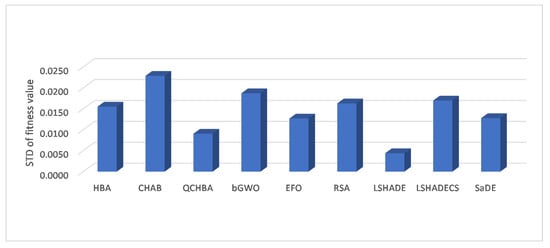
Figure 3.
Average of stability results of QCHBA and other algorithms overall for the tested datasets.
Based on the results for the best fitness values given in Table 4 and Figure 4, the following observations can be made: First, the QCHBA method had the lowest results at nearly 61% from the eighteen datasets. This was followed by the HBA and CHBA methods which had best values of nearly 27% and 22%, respectively. The GWO and RSA methods achieved better performance in terms of best fitness values at 16% and 11%, respectively. This indicates that the operators of the HBA had the ability to reach smaller fitness values than the other algorithms. However, adding quantum and chaotic maps to these operators increased the probability of being optimal cases.

Table 4.
Best fitness values generated using competitive methods.
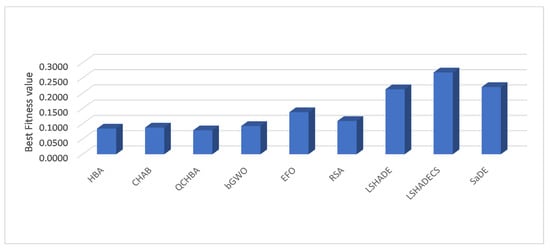
Figure 4.
The efficiency of QCHBA and other methods according to the best fitness value measure.
From the worst fitness value results for each method that are presented in Table 5 and Figure 5, the following observations can be made: The HBA and RSA showed better fitness values in the worst instances of each compared to the other methods. However, the proposed QCHBA approach maintained its superiority over the other methods with better fitness values for eight datasets, which represented nearly 45% of the total number of datasets tested. The convergence curves of the algorithms are shown in Figure 6. These curves indicate the high efficiency of the proposed method, which converged faster towards the optimal subset of features than the other methods.

Table 5.
Worst fitness values generated using competitive methods.
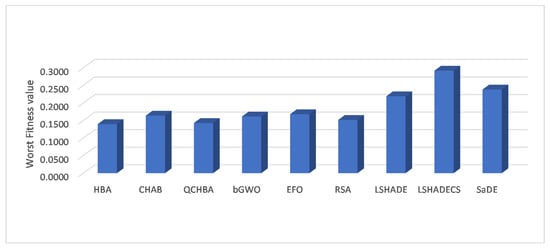
Figure 5.
Performance of QCHBA and other methods in terms of worst fitness values.
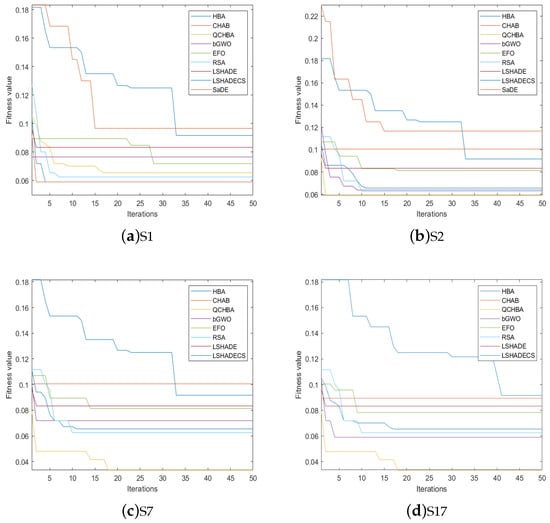
Figure 6.
Convergence curves of the competitive algorithms for S1, S2, S7, and S17.
The efficiency of the performance of the QCHBA based on the accuracy measure is shown in Table 6. For example, it obtained the highest accuracy level at 10 datasets, which represents nearly 56% of the total. Each of the HBA, CHBA, GWO, EFO, and RSA methods had best accuracy for only two datasets, including the dataset S18 (which was common to all of them). The average accuracy of the tested datasets is given in Figure 7. It can be seen that the accuracy of the QCHBA was better than the close second algorithm, CHAB, with a difference of nearly 1.45%.

Table 6.
Average of accuracy obtained using QCHNA and other methods.
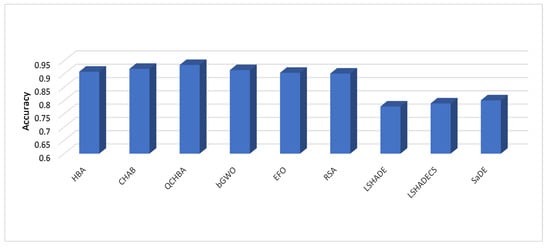
Figure 7.
Performance of ACHBA and others based on the average accuracy.
Table 7 and Figure 8 show the average of selected features from each dataset using the FS method. From these results, it can be seen that the QCHBA had the ability to select the smallest number of features, at nearly 50% of the total. RSA was the second best algorithm according to the number of selected features, with the smallest number of features at three datasets. This was followed by the GWO and CHBA methods with the smallest number of features for two datasets.

Table 7.
Number of selected features.
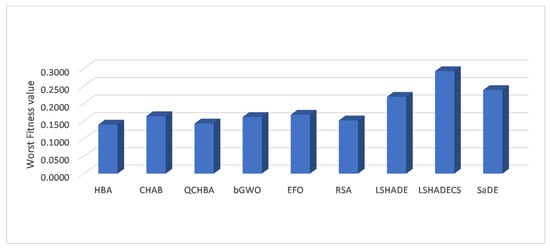
Figure 8.
Efficiency of QCHBA and other methods based on the average number of selected features.
From the previous results and discussion, it is evident that integration of the quantum-based optimization (QBO) and the 2D chaotic Hénon map with the honey badger algorithm led to an enhanced ability to discover the subset of relevant features. The QBO and 2D Hénon maps have the ability to balance switching between exploration and exploitation during the search process for the relevant features. Despite these advantages, the proposed QCHBA still suffers from certain limitations that can effect its performance. For example, the stability of QCHBA still requires improvement, and this is critical. In addition, the time complexity of the QCHBA needs to be decreased.
5. Conclusions
This paper proposes a modified version of the honey badger algorithm (HBA) using a quantum optimization technique and a 2D chaotic Hénon map. The 2D Hénon map was applied to adjust the parameters of C and , as well as to update the digging phase and the density variable. The quantum-based optimization was applied to improve convergence towards the optimal solution. To assess the performance of the proposed approach, a set of experimental investigations was conducted. This was achieved though the use of eighteen datasets with the results compared with other well-known FS-based methods, including, for example, RSA, EFO, GWO, LASHADE, LSHADECS, SaDE, and the traditional HBA. The comparative results indicated strong performance of the proposed method. Moreover, the influence of the QBO and chaotic maps for enhancing the performance of the proposed method was apparent.
In the future, the proposed QCHBA can be applied to solve different optimization problems. For example, it can be used to improve the performance of medical classification, the quality of service in cloud computing environments, investigation of plant diseases and other applications. In addition, it can be applied to handle multi-objective optimization problems.
Author Contributions
Conceptualization, D.Y., R.A.I., O.F.H. and M.A.E.; methodology, D.Y., R.A.I. and M.A.E.; software, D.Y., R.A.I., O.F.H. and M.A.E.; validation, D.Y., R.A.I. and M.A.E.; formal analysis, S.A., D.Y., R.A.I. and M.A.E.; investigation, S.A., D.Y., R.A.I. and M.A.E.; writing—original draft preparation, D.Y., R.A.I. and M.A.E.; writing—review and editing, S.A., D.Y., R.A.I., O.F.H. and M.A.E.; visualization, S.A., D.Y., R.A.I. and M.A.E.; supervision, M.A.E., R.A.I. and O.F.H.; project administration, S.A., D.Y., R.A.I. and M.A.E.; funding acquisition, S.A. All authors have read and agreed to the published version of the manuscript.
Funding
Princess Nourah bint Abdulrahman University Researchers Supporting Project number (PNURSP2022R197), Princess Nourah bint Abdulrahman University, Riyadh, Saudi Arabia.
Data Availability Statement
The data available upon request from corresponding author.
Conflicts of Interest
The authors declare that there are no conflicts of interest regarding the publication of this paper.
References
- Tubishat, M.; Idris, N.; Shuib, L.; Abushariah, M.A.; Mirjalili, S. Improved Salp Swarm Algorithm based on opposition based learning and novel local search algorithm for feature selection. Expert Syst. Appl. 2020, 145, 113–122. [Google Scholar] [CrossRef]
- Hancer, E.; Xue, B.; Karaboga, D.; Zhang, M. A binary ABC algorithm based on advanced similarity scheme for feature selection. Appl. Soft Comput. 2015, 36, 334–348. [Google Scholar] [CrossRef]
- Ewees, A.A.; Abualigah, L.; Yousri, D.; Algamal, Z.Y.; Al-qaness, M.A.; Ibrahim, R.A.; Abd Elaziz, M. Improved Slime Mould Algorithm based on Firefly Algorithm for feature selection: A case study on QSAR model. Eng. Comput. 2021, 38, 2407–2421. [Google Scholar] [CrossRef]
- Yousri, D.; Abd Elaziz, M.; Abualigah, L.; Oliva, D.; Al-Qaness, M.A.; Ewees, A.A. COVID-19 X-ray images classification based on enhanced fractional-order cuckoo search optimizer using heavy-tailed distributions. Appl. Soft Comput. 2021, 101, 107052. [Google Scholar] [CrossRef] [PubMed]
- Al-qaness, M.A. Device-free human micro-activity recognition method using WiFi signals. Geo-Spat. Inf. Sci. 2019, 22, 128–137. [Google Scholar] [CrossRef]
- Dahou, A.; Elaziz, M.A.; Zhou, J.; Xiong, S. Arabic sentiment classification using convolutional neural network and differential evolution algorithm. Comput. Intell. Neurosci. 2019, 2019, 2537689. [Google Scholar] [CrossRef]
- Rundo, L.; Tangherloni, A.; Cazzaniga, P.; Nobile, M.S.; Russo, G.; Gilardi, M.C.; Vitabile, S.; Mauri, G.; Besozzi, D.; Militello, C. A novel framework for MR image segmentation and quantification by using MedGA. Comput. Methods Programs Biomed. 2019, 176, 159–172. [Google Scholar] [CrossRef]
- Ortiz, A.; Górriz, J.; Ramírez, J.; Salas-Gonzalez, D.; Llamas-Elvira, J.M. Two fully-unsupervised methods for MR brain image segmentation using SOM-based strategies. Appl. Soft Comput. 2013, 13, 2668–2682. [Google Scholar] [CrossRef]
- Cheng, S.; Ma, L.; Lu, H.; Lei, X.; Shi, Y. Evolutionary computation for solving search-based data analytics problems. Artif. Intell. Rev. 2021, 54, 1321–1348. [Google Scholar] [CrossRef]
- Nobile, M.S.; Tangherloni, A.; Rundo, L.; Spolaor, S.; Besozzi, D.; Mauri, G.; Cazzaniga, P. Computational intelligence for parameter estimation of biochemical systems. In Proceedings of the 2018 IEEE Congress on Evolutionary Computation (CEC), Rio de Janeiro, Brazil, 8–13 July 2018; pp. 1–8. [Google Scholar]
- Ibrahim, R.A.; Abualigah, L.; Ewees, A.A.; Al-Qaness, M.A.; Yousri, D.; Alshathri, S.; Abd Elaziz, M. An electric fish-based arithmetic optimization algorithm for feature selection. Entropy 2021, 23, 1189. [Google Scholar] [CrossRef]
- Ibrahim, R.; Ewees, A.; Oliva, D.; Abd Elaziz, M.; Lu, S. Improved salp swarm algorithm based on particle swarm optimization for feature selection. J. Ambient. Intell. Hum. Comput. 2019, 10, 3155–3169. [Google Scholar] [CrossRef]
- Aziz, M.A.E.; Hassanien, A.E. Modified cuckoo search algorithm with rough sets for feature selection. Neural Comput. Appl. 2018, 29, 925–934. [Google Scholar] [CrossRef]
- Abd Elaziz, M.; Moemen, Y.S.; Hassanien, A.E.; Xiong, S. Toxicity risks evaluation of unknown FDA biotransformed drugs based on a multi-objective feature selection approach. Appl. Soft Comput. 2020, 97, 105509. [Google Scholar] [CrossRef]
- Ibrahim, R.A.; Abd Elaziz, M.; Ewees, A.A.; El-Abd, M.; Lu, S. New feature selection paradigm based on hyper-heuristic technique. Appl. Math. Model. 2021, 98, 14–37. [Google Scholar] [CrossRef]
- Xue, B.; Zhang, M.; Browne, W.N. Particle swarm optimization for feature selection in classification: A multi-objective approach. IEEE Trans. Cybern. 2012, 43, 1656–1671. [Google Scholar] [CrossRef] [PubMed]
- Hancer, E. Differential evolution for feature selection: A fuzzy wrapper–filter approach. Soft Comput. 2019, 23, 5233–5248. [Google Scholar] [CrossRef]
- Tsai, C.F.; Eberle, W.; Chu, C.Y. Genetic algorithms in feature and instance selection. Knowl.-Based Syst. 2013, 39, 240–247. [Google Scholar] [CrossRef]
- Sayed, G.I.; Hassanien, A.E.; Azar, A.T. Feature selection via a novel chaotic crow search algorithm. Neural Comput. Appl. 2019, 31, 171–188. [Google Scholar] [CrossRef]
- Oh, I.S.; Lee, J.S.; Moon, B.R. Hybrid genetic algorithms for feature selection. IEEE Trans. Pattern Anal. Mach. Intell. 2004, 26, 1424–1437. [Google Scholar]
- Abdel-Basset, M.; Ding, W.; El-Shahat, D. A hybrid Harris Hawks optimization algorithm with simulated annealing for feature selection. Artif. Intell. Rev. 2021, 54, 593–637. [Google Scholar] [CrossRef]
- Sahlol, A.T.; Yousri, D.; Ewees, A.A.; Al-Qaness, M.A.; Damasevicius, R.; Elaziz, M.A. COVID-19 image classification using deep features and fractional-order marine predators algorithm. Sci. Rep. 2020, 10, 15364. [Google Scholar] [CrossRef] [PubMed]
- Abualigah, L.; Yousri, D.; Abd Elaziz, M.; Ewees, A.A.; Al-Qaness, M.A.; Gandomi, A.H. Aquila optimizer: A novel meta-heuristic optimization algorithm. Comput. Ind. Eng. 2021, 157, 107250. [Google Scholar] [CrossRef]
- Yilmaz, S.; Sen, S. Electric fish optimization: A new heuristic algorithm inspired by electrolocation. Neural Comput. Appl. 2020, 32, 11543–11578. [Google Scholar] [CrossRef]
- Hashim, F.A.; Houssein, E.H.; Hussain, K.; Mabrouk, M.S.; Al-Atabany, W. Honey Badger Algorithm: New metaheuristic algorithm for solving optimization problems. Math. Comput. Simul. 2022, 192, 84–110. [Google Scholar] [CrossRef]
- Elseify, M.A.; Kamel, S.; Abdel-Mawgoud, H.; Elattar, E.E. A Novel Approach Based on Honey Badger Algorithm for Optimal Allocation of Multiple DG and Capacitor in Radial Distribution Networks Considering Power Loss Sensitivity. Mathematics 2022, 10, 2081. [Google Scholar] [CrossRef]
- Almodfer, R.; Abd Elaziz, M.; Alshathri, S.; Abualigah, L.; Mudhsh, M.; Shahzad, K.; Issa, M. Improving Parameters Estimation of Fuel Cell Using Honey Badger Optimization Algorithm. Front. Energy Res. 2022, 10, 875332. [Google Scholar] [CrossRef]
- Nassef, A.M.; Houssein, E.H.; Helmy, B.E.D.; Rezk, H. Modified honey badger algorithm based global MPPT for triple-junction solar photovoltaic system under partial shading condition and global optimization. Energy 2022, 254, 124363. [Google Scholar] [CrossRef]
- Kumar, D.S.R.; Kumar, K.P.; Raju, K.G.; Gowsalya, S.; Balraj, L.; Srivastava, A.K. An IoT-based Optimization scheme on task scheduling for minimizing energy in Cloud Computing. In Proceedings of the 2022 8th International Conference on Advanced Computing and Communication Systems (ICACCS), Coimbatore, India, 5–26 March 2022; Volume 1, pp. 1–6. [Google Scholar]
- Hénon, M. A two-dimensional mapping with a strange attractor. In The Theory of Chaotic Attractors; Springer: New York, NY, USA, 1976; pp. 94–102. [Google Scholar]
- Asuncion, A.; Newman, D. UCI Machine Learning Repository. 2010. Available online: https://archive.ics.uci.edu/ml/datasets/SML2010 (accessed on 14 September 2022).
- Awad, N.H.; Ali, M.Z.; Suganthan, P.N.; Reynolds, R.G. An ensemble sinusoidal parameter adaptation incorporated with L-SHADE for solving CEC2014 benchmark problems. In Proceedings of the 2016 IEEE Congress on Evolutionary Computation (CEC), Vancouver, BC, Canada, 24–29 July 2016; pp. 2958–2965. [Google Scholar]
- Ibrahim, R.A.; Abd Elaziz, M.; Lu, S. Chaotic opposition-based grey-wolf optimization algorithm based on differential evolution and disruption operator for global optimization. Expert Syst. Appl. 2018, 108, 1–27. [Google Scholar] [CrossRef]
- Abualigah, L.; Abd Elaziz, M.; Sumari, P.; Geem, Z.W.; Gandomi, A.H. Reptile Search Algorithm (RSA): A nature-inspired meta-heuristic optimizer. Expert Syst. Appl. 2022, 191, 116158. [Google Scholar] [CrossRef]
- Mohamed, A.W.; Hadi, A.A.; Fattouh, A.M.; Jambi, K.M. LSHADE with semi-parameter adaptation hybrid with CMA-ES for solving CEC 2017 benchmark problems. In Proceedings of the 2017 IEEE Congress on Evolutionary Computation (CEC), San Sebastián, Spain, 5–8 June 2017; pp. 145–152. [Google Scholar]
- Qin, A.K.; Suganthan, P.N. Self-adaptive differential evolution algorithm for numerical optimization. In Proceedings of the 2005 IEEE Congress on Evolutionary Computation, Scotland, UK, 2–5 September 2005; Volume 2, pp. 1785–1791. [Google Scholar]
Publisher’s Note: MDPI stays neutral with regard to jurisdictional claims in published maps and institutional affiliations. |
© 2022 by the authors. Licensee MDPI, Basel, Switzerland. This article is an open access article distributed under the terms and conditions of the Creative Commons Attribution (CC BY) license (https://creativecommons.org/licenses/by/4.0/).