Article

Semantic Conceptual Framework for Environmental Monitoring and Surveillance—A Case Study on Forest Fire Video Monitoring and Surveillance

Faculty of Electrical Engineering, Mechanical Engineering and Naval Architecture, University of Split, R. Boškovića 32, 21000 Split, Croatia
*
Author to whom correspondence should be addressed.
Electronics 2022, 11(2), 275; https://doi.org/10.3390/electronics11020275
Submission received: 20 December 2021 / Revised: 5 January 2022 / Accepted: 13 January 2022 / Published: 16 January 2022

Abstract

:
This paper presents a semantic conceptual framework and definition of environmental monitoring and surveillance and demonstrates an ontology implementation of the framework. This framework is defined in a mathematical formulation and is built upon and focused on the notation of observation systems. This formulation is utilized in the analysis of the observation system. Three taxonomies are presented, namely, the taxonomy of (1) the sampling method, (2) the value format and (3) the functionality. The definition of concepts and their relationships in the conceptual framework clarifies the task of querying for information related to the state of the environment or conditions related to specific events. This framework aims to make the observation system more queryable and therefore more interactive for users or other systems. Using the proposed semantic conceptual framework, we derive definitions of the distinguished tasks of monitoring and surveillance. Monitoring is focused on the continuous assessment of an environment state and surveillance is focused on the collection of all data relevant for specific events. The proposed mathematical formulation is implemented in the format of the computer readable ontology. The presented ontology provides a general framework for the semantic retrieval of relevant environmental information. For the implementation of the proposed framework, we present a description of the Intelligent Forest Fire Video Monitoring and Surveillance system in Croatia. We present the implementation of the tasks of monitoring and surveillance in the application domain of forest fire management.

1. Introduction

Monitoring and surveillance gives us the ability to assess various situations in distant locations. With the development of information and communication technologies (ICT), remote and wide areas can be monitored from a distance using technical solutions and are no longer ignored or difficult to access.
Environment management includes many activities aimed towards the assessment of environment conditions, the prevention of environmental hazards, environmental protection and keeping the environment in a state of balance. Environmental managers have a responsibility to organize such activities in a timely and optimal fashion.
To create a good environment management plan, one must:
  • access the state of the environment at the moment of planning;
  • access the desired goals or desired state; and
  • create an optimal plan (or steps) for reaching the desired state from the current state.
Environmental management planning starts with the assessment of the current state, and this assessment must be performed on reliable information and data. Gathering information about the state of the environment is a task of environmental monitoring and can be performed manually or with the help of sensors. Selection of the appropriate method and the appropriate sensors depends on the application, the desired scale and resolution and other available information. However, planning of the observation system is often performed in an ad-hoc manner. Having conceptual knowledge about an observation system’s capabilities and limitations and its direct relationship to the environmental conditions would make environmental management planning more comprehensible. This fact is the motivation for the work presented in this paper—to offer a formal and a conceptual description that will aid in the general usage of observation system data for various tasks in many domains. The conceptual framework presented here offers the aggregation of knowledge regarding environmental monitoring and surveillance system design and utilization in a compact manner. Embedding such knowledge into an ontology can provide environmental managers with a useful tool. Using this tool, users will be able to design and scale observational systems that can monitor the environment based on their needs. In this paper, we present this tool in the form of a conceptual framework consisting of a formal notation and taxonomies describing the main features of parts of the system, and an ontology implementation that is capable of query processing.
The formalization of knowledge can facilitate better planning of the observation system through automatic reasoning over formally described knowledge. Our conceptual framework and implementation may be applied to, but are not limited to:
  • Planning sensing and communication technology—by constructingthe values of the system attributes (e.g., scale, precision, area of coverage and feature of interest) that are in accordance with the application domain, and selecting only the technologies that can offer the needed features.
  • Designing the communication architecture of the monitoring software—by analyzing communication patterns one can group paths of communication, eliminate redundant communication and design more efficient data communication architectures.
  • Designing monitoring and surveillance system functional requirements—choosing the functionalities from the taxonomy items of the framework can lead to unambiguous descriptions of the functional requirements.
  • Designing testing procedures—the validation of functional and nonfunctional requirements can be extracted from the formal description (i.e., the coveredarea and precision), which can lead to formal procedures of validation.
  • Implementation of the procedures of spatio-temporal surveillance data retrieval—the spatial and temporal constraints of the observation data are natively introduced in the framework and can be easily queried.
  • Designing interoperability protocols with software that can use data from the observation system—modeling, forecasting or classification software that use real-time data retrieved from the observation system. This can utilize the data together with all the metadata known to the system.
Apart from the abovementioned general applications, we hope that new, unexpected applications will emerge when the framework is applied to specific domains of monitoring systems.

Related Work

Environmental monitoring is used in environmental management to assess the state of the environment and is based on the quantitative description of the measurable environment parameters. The retrieval of these parameters should be performed by following a strict sampling procedure [1] that prescribes the measured parameters and the timing of sampling, as well as a location of the sampling. Manual sampling is being replaced with modern sensing technologies such as wireless sensor networks [2], video surveillance [3] and remote-sensing platforms [4].
The authors of [5] emphasize that there is a clear absence of a concise strategy or methodology for designing monitoring networks, or for the placement of sampling stations. Therefore, the authors of that paper propose a methodology that utilizes a geographic information system (GIS), a hydrologic simulation model and fuzzy logic for the monitoring of water quality.
In [6] a new qualitative method for building conceptual frameworks for phenomena that are linked to the multidisciplinary bodies of knowledge is presented. A conceptual framework is defined as a network or a “plane” of linked concepts.
In [7], the authors propose a way to enhance the monitoring of a database with semantic information in order for it to be useful to a larger group of researchers. Usually, the monitoring data can only be interpreted by those who store them, and the authors developed a way to broaden its usefulness by use of various ontologies.
In [8], the authors propose a dedicated data representation model that semantically enhances the data represented in the data model used for the purpose of the MOSAIC project (multimodal analytics for the protection of critical assets) with the aim of making it accessible via a single point of access or by using a single mechanism or language. In their paper they provide the details of their MOSAIC hierarchical ontology model.
In [9], the authors propose an analytical framework for valuable and holistic concepts designed to guide productive and sustained relationships with the environment. Concepts of context, actors, motivations, capacity, actions, and outcomes are analyzed.
The Drivers, Pressures, State, Impact and Response model of intervention (DPSIR) framework is the causal framework for describing the interactions between society and the environment adopted by the European Environment Agency [10,11]. The concepts of the framework are: driving forces, pressures, states, impacts and responses. The framework represents an extension of the Pressure, State, Response (PSR) model developed by the OECD (Organization for Economic Co-operation and Development).
SOSA (Sensors, Observations, Samples, and Actuators) [12] presents an ontology for sensor observations actuators that can cope with various sampling times [13] and reviews the usage of semantic technologies (e.g., semantic representations of sensory data). Remote sensing has many application opportunities, but due to the large number of sensors and platforms, one is presented with the difficult task of deciding which platform to use for which application. In [4], the authors present a taxonomy of remote-sensing platforms in such a way that a reader could gain knowledge about which platforms and sensors are appropriate for a particular application domain. IoT (Internet of Things) technologies provide ubiquitous information that can be used and reused in many domains. In [14], the authors present a methodology for IoT-based healthcare application design. In [15] the authors propose a functionality based on video surveillance and learning with the semantic scene model.
The research that is presented in this paper represents an attempt to organize core concepts related to environmental monitoring and surveillance into a comprehensible format that is both human-friendly, computer-readable and capable of the semantic description of environmental state assessments. The motivation for this work is to define a framework that will make observation systems queryable and interactive with both human users and programs. The semantic aspect of the monitoring and surveillance data is added to improve the comprehensiveness of the data. Using this framework, we demonstrate the functionalities required by a Forest Fire Monitoring and Surveillance System.

2. Conceptual Framework of an Environment Observation System

In this section we will describe the main components of the conceptual framework and their relationships. The top-level term is the notion of environment. Environment is the term describing the surroundings and conditions of operation. We can define environment E as a pair of two entities—geographical area and factors of the environment. This can be written as:
E = ( A , F )
With this equation we define the environment as a pair of entities, where the first entity represents the geographical area of the environment and the second entity represents a set of all of the factors that define the condition of the environment.
In the scope of our research, the environment’s geographical coverage and extent are limited within space. Depending on the domain of application, the area can be as large as the globe, or more locally oriented, such as a lake or a forest. Depending on the domain of application, the area of interest of the particular environment can be observed on a larger or on a smaller scale. We can describe the area of the environment in two complementary ways: (1) by defining the geographical limits of the area and scale on which the environment is observed, or (2) as a raster of cells, where each cell covers an area that is as big or as small as we need it to be. In reality, the environment has an infinite resolution and can be noted on an infinitesimally small scale, but we are observing features that are the properties of a subset of the environment’s area and we can observe the area on a certain finite resolution. Thus, we can also describe the area as a set of subsets of the environment’s area. If the subsets are equally distributed over the geography, the set of subsets could also be considered as a raster of the environment’s area.
A = ( G e o g r a p h y , s c a l e ) = { a 1 , a 2 , . . . , a n }
In the above equation, geography is a description of the area’s limits (i.e. a polygon), and the scale is the size of the observed cell. a i represents a cell in the equally distributed cells across the area.
The condition of the environment is defined by various factors. Factors are aspects of the environment that may be of interest. Factors, such as temperature, relative humidity or reflectance of the surface, are often monitored. A set of all of the factors belonging to the environment is denoted as F:
F = { f 1 , f 2 , f 3 , . . . , f n }
where each f i is one factor of the environment. The set of factors F does not express the condition of the environment, but merely denotes the dimensions in which an environment can be observed. A selection of the factors of interest depends on the domain of application.
Next, we define a notion of the environment’s condition space. Condition space is a space of feature values over the environment’s area. We can denote the condition space as:
C s p a c e = ( A × F )
A condition of the environment at the observed time can be described with the values of all the factors the environment’s area holds at the time of observation. Time of observation is the element of the timeline. Timeline T is a series of observation times:
T = [ t 1 , t 2 , t 3 , . . . t l ]
Now we can denote the evolution of the environment’s conditions as a series of conditions the environment finds itself in at each of the time elements of the timeline T. A series of conditions can be formally denoted as:
C = [ c t 1 , c t 2 , . . . c t l ] , c t i C s p a c e , t T
In the above equation c t i is the condition of the environment, described by features over area, in the i-th moment of the timeline. l is the length of time for which we are observing the environment. The condition of the environment is an element of the conditions space, and it is described with the combination of values of the factors on the area of the environment. Condition is a set of values of factors describing the property of the area subset, in a specific moment of time, describing the state of the factor in the subset of the environment’s area.
c t = { ( f 1 t , a 1 ) , ( f 2 t , a 2 ) , . . . ( f n t , a n ) } , c t C s p a c e , f i F , a i A
Each factor is associated with a subset of area a i , whereas the scale of a i depends on the variability of the feature. For observing various features, we have developed sensors. A sensor is designed to measure a certain factor of the environment and transform it into a digital form. We can define a sensor as a device that maps a certain aspect of the condition of the environment into the value v that represents a quantitative description of a feature in the current condition.
S ( a i , f i , n ) : c t > v
where f i denotes the factor of the environment that the sensor is responsible for measuring, and a i denotes the geographical area to which the sensor is dedicated. a i is a subset of A. c t denotes the condition of the environment in a moment t from the timeline. Each sensor has its limitations and uncertainty, so we add a factor n that denotes the noise that the sensor adds to the value of the factor in the area of interest. v is the value the sensor produces and it can have a value type—a scalar value or complex value such as a matrix of reflectance in the RGB (Red Green Blue) spectrum for a video sensor.
To have a broader picture of the environment’s condition we use an observation system. An observation system is a system consisting of multiple sensors focused on the environment’s area and measuring features of the area from different aspects. We denote the observation system (OS) as:
O S = { s 1 , . . .   s m }
where s i represents one sensor described as in Equation (8) and m is the number of sensors the observation system depends on. Each sensor from the OS holds information about the area to which the sensor is dedicated, features that the sensor measures, and the noise or uncertainty that the sensor brings into the system. The observation system maps the current condition of the environment into a digital representation of the state of the environment. We can write:
O S : C t > V
where V is a set of values, and each value has an associated coverage area as a subset of A.
Now we can denote the digital representation of the environment’s condition in time t as V and taken by OS.
V t = { v 1 , v 2 , . . . ,   v m }
where v i is a value taken from the i-th sensing device s i in the environment’s subset a i and has a format depending on the sensor type. Finally, when we are observing the evolution of the environment with the observation system, what we have available for our observation system is not the state evolution, but the footprints of the state made by the sensors in the times of the timeline T defined in Equation (5).
V = { V t 1 , V t 2 , . . . ,   V t l }

3. Observation System Taxonomies

Natural environmental monitoring and surveillance is used to obtain an understanding of the conditions and operations in the environment’s area from distant locations, based on observations. As described in a previous section, an observation system relies on sensors located over the environment, measuring factors of conditions. Sensors are technical devices with sensing and communication power. Sensing and communication are tasks that consume power. When observing the natural environment it is often the case that we cannot rely on the availability of power and communications infrastructure. Observation sensors have improved over the years. Now we have various kinds of technical solutions that do not demand power and communications infrastructure, but create opportunities for communication and power themselves. We propose a taxonomy of sensing devices in the following sections. The taxonomies are organized into three aspects and are described formally based on the notation given in the previous section. We propose:
  • a sampling method taxonomy;
  • a value format taxonomyl and
  • a functionality query taxonomy.

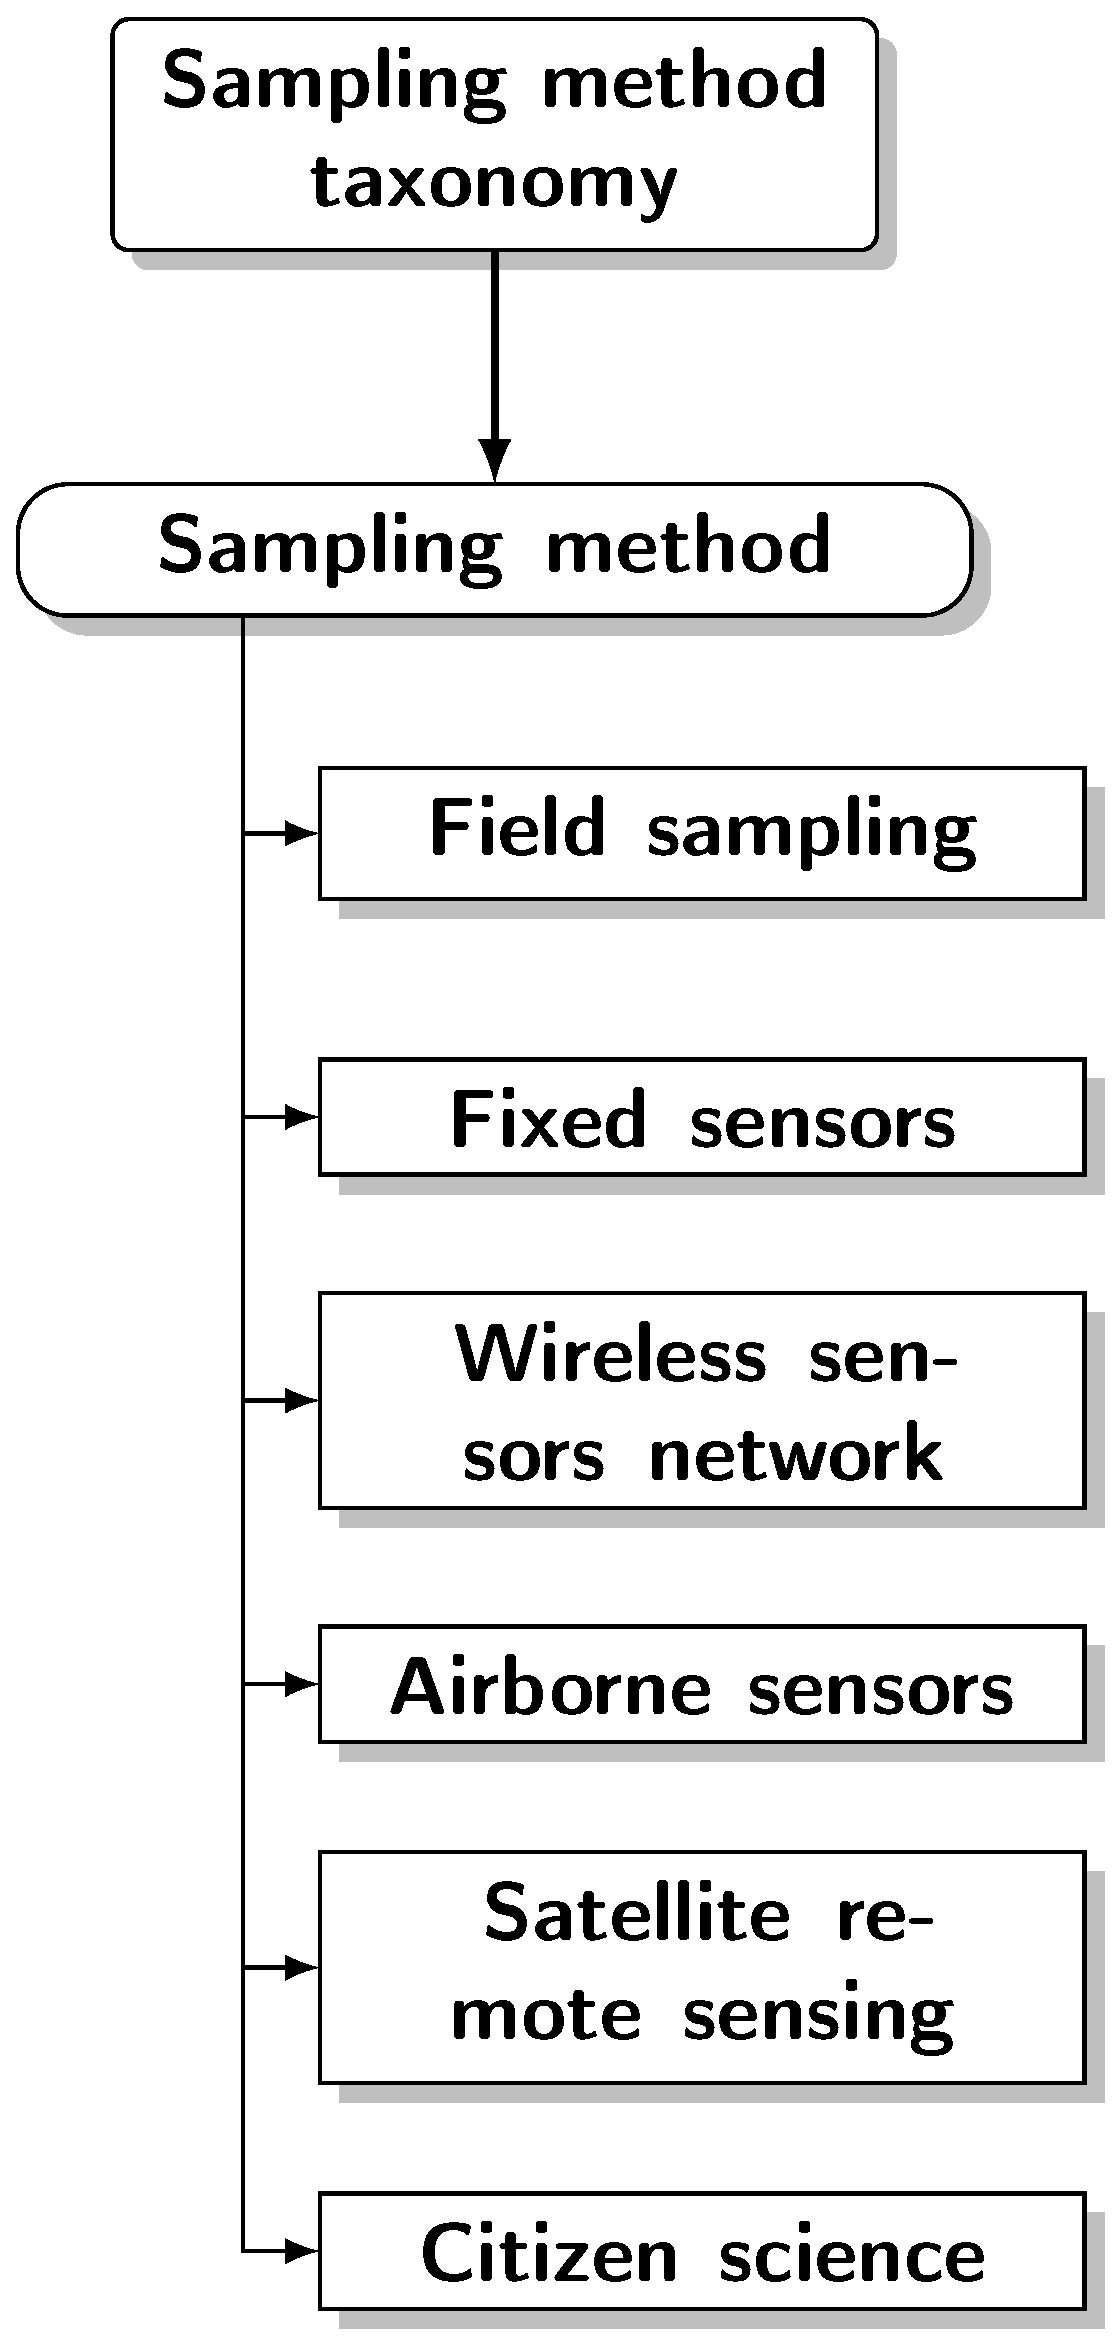
3.1. Sampling Method Taxonomy

Collecting observational data for environmental monitoring can be achieved using one of the following methods:
  • Field and manual data collection—this is a traditional method which is not automated but is still sometimes used;
  • Fixed sensors—these sensors have a fixed location, can rely on the infrastructure where one is available, and can be dependent on a more reliable source of power and network;
  • Wireless sensors powered by batteries or solar or wind energy harvesting are capable of measuring certain aspects of the environment;
  • Airborne sensors mounted on aerial vehicles;
  • Satellite-based remote sensing; and
  • Citizen science, community sensing, crowdsourcing and social networks.
The distinction between these sampling methods leads us towards defining the sampling method taxonomy shown in Figure 1. Each sampling method produces a value that quantitatively represents a feature of the environment f i in the subset of area a i and in the specific time t i . The quantitative data that are retrieved by sampling are noted with d and, in order to be used efficiently, these must have associated metadata describing the relevant features. In the following discussion we will describe the values and descriptive metadata necessary for each sampling method by distinguishing which metadata are constant and known for a sampling method, and which metadata must be sensed together with value data d.

3.1.1. Field Manual Data Collection

Field manual data collection is a traditional method for the observation of environmental factors used for the sampling of factors that we cannot measure remotely. This method is reliable when performed by trained, educated personnel [1]. Field rangers must follow strict procedures for manual data collection. These procedures are described in the data collection manuals defined by the national competent authorities for every type of field data, (e.g., for water [16] and forest fires [17]). The authorities responsible for manual sampling often unite in regional, national or international networks, such as EUROWATERNET for water monitoring [18] or LUCAS for soil monitoring [19]. Joint maintenance of sampling datasets enables researchers to utilize the data for the broader assessment of monitoring parameters [20,21].
Digital storage of this collected data is performed by logging the data, together with all the metadata. However, manual logging of the data can be subject to random errors when the operator responsible for logging data is not focused. Technical solutions such as GIS cloud storage are offered for the logging of data.
The values collected using manual data are associated with the point of collection. This kind of observation is usually performed by scheduling patrolling missions for data collection, but the schedule is rarely strict. Additionally, data are stored with a delay, so one cannot perform any real-time event recognition with this approach. Manual data collection is appropriate for the observation of features that cannot be sensed remotely and that change slowly in space and time.
A value collected by field sampling consists of:
v ( f ) = ( a i , t i , d )
where d denotes the value of the feature f in a location with geographical point a i in the time t i .

3.1.2. Fixed Sensors

As opposed to manual sampling, sensors and methods have been developed for the automatic observation of the environment, using various technical solutions. Sensors can be deployed at a location in the environmental area and can be tasked with measuring a feature of the area. Fixed sensors are sensors with fixed locations of deployment that are capable of the continuous measurement of a feature. Fixed video sensors have many advantages in forest fire monitoring and surveillance [22]. Existing video surveillance sensors can be reused in novel applications, such as using time-exposure images for wave height estimation, as described in [23]. Acoustic monitoring data from fixed audio recording sensors can be used to monitor animal species in African forests [24]. However, a critical aspect of fixed sensor monitoring network design is the selection of fixed sensor locations [25,26].
Typically, this kind of sampling is not performed continuously, but in discrete moments of time with some frequency. We assign a sampling frequency measure to sensors with a fixed location as a property of the observation system.
v ( a , f , Δ t ) = ( d )

3.1.3. Wireless Sensor Network

Advances in sensor manufacturing technology, low power consumption and wireless communication have enabled technologies for wireless sensor networks [2,27].
Disaster monitoring for a huge forest environment is feasible with a network of sensors [28]. Technological developments in sensor manufacturing have made this kind of sensor low-cost and reliable for precise agriculture soil monitoring [29]. Robustness and long life is enhanced with the use of energy harvesting sensors [30], making it possible even to develop underwater sensors for water-quality monitoring [31].
Small energy-harvesting or battery-powered sensors are deployed in the environment and measure a certain aspect or feature of the environment. These kinds of sensors are not fixed, but can discover the location themselves. Thus, when measuring the feature with a certain frequency, values obtained using these sensors must come with metadata describing the area that the sensor is measuring.
v ( f , Δ t ) = ( a i , d )

3.1.4. Airborne Sensors

Only noninvasive sensors capable of distant shooting can be mounted to UAVs. Video cameras are typically used for this purpose. However, in addition to visible-spectrum cameras capable of video recording, one can use infrared [32], multispectral [33] or hyperspectral [34] sensors for various purposes. Novel algorithms are being developed for the airborne monitoring of water pollution [32], forest and agriculture [33,34] and also air pollution [35].
Airborne sensors measure the features the sensor is dedicated to, but the area in which they perform this measuring is not constant. The area that this kind of sampling measures depends on the trajectory of the vehicle that bears the sensors. Images taken with airborne sensors often have a high spatial and spectral resolution, but limited coverage and discontinuous monitoring due to flight restrictions. [36,37]. Sensor data can be described by their features and trajectories. These data must be accompanied by metadata, such as the area of the environment associated with the data or the trajectory information of the UAV.
v ( f , t r a j e c t o r y : a i = f ( t ) ) = ( a i = f ( t ) , t , d )

3.1.5. Satellite Remote Sensing

Satellite remote sensing is a kind of noninvasive observation that is, in certain ways, similar to airborne sensor sampling. Unlike airborne sensor sampling, satellite remote sensing can provide global coverage and continuous monitoring with various spatial and temporal resolutions, which are specific for every satellite mission carrying different sensors [38].
Satellite remote sensing has a fixed trajectory that is a part of the description of the satellite mission. The frequency of sampling is low (one to several days) and an area that is covered is large and can be observed on a global scale. However, the spatial resolution is quite coarse.
v ( f , a ) = ( Δ t = f ( a ) , d )

3.1.6. Citizen Science

In recent times, the use of social media and volunteer information can be broadened to many domains of application aside from merely social interactions. Social media posts often contain opinions and important information about events and the state of the environment that go beyond the content of the post.
Citizen science data will have a role in future Earth observations [39]. Volunteer data, which are user-generated data, can be a valuable source of information. This information can be used in fire prevention [40], the assessment of fire effects [41] and water quality monitoring [42]. Citizen science data are typically combined with other, more reliable sources of data (e.g., lake level data from measurements collected through citizen science with satellite data [43]), or crowdsourced data for event detection in urban environments with fixed sensors, as discussed in [44]. This kind of data is unstructured and requires manual or automatic processing, which means it cannot be used in its raw format. Metadata about location, features, value and reliability must be extracted from these unstructured data in order for them to be useful.
We can express the sampling of data by means of citizen science in the form:
v = ( f , a , t , d , n )
denoting that, together with the value sampled d, we must store the following metadata: f—a feature that the value describes, a—an area holding the feature, t—the time of sampling, and n—noise describing the level of uncertainty of the sensing.

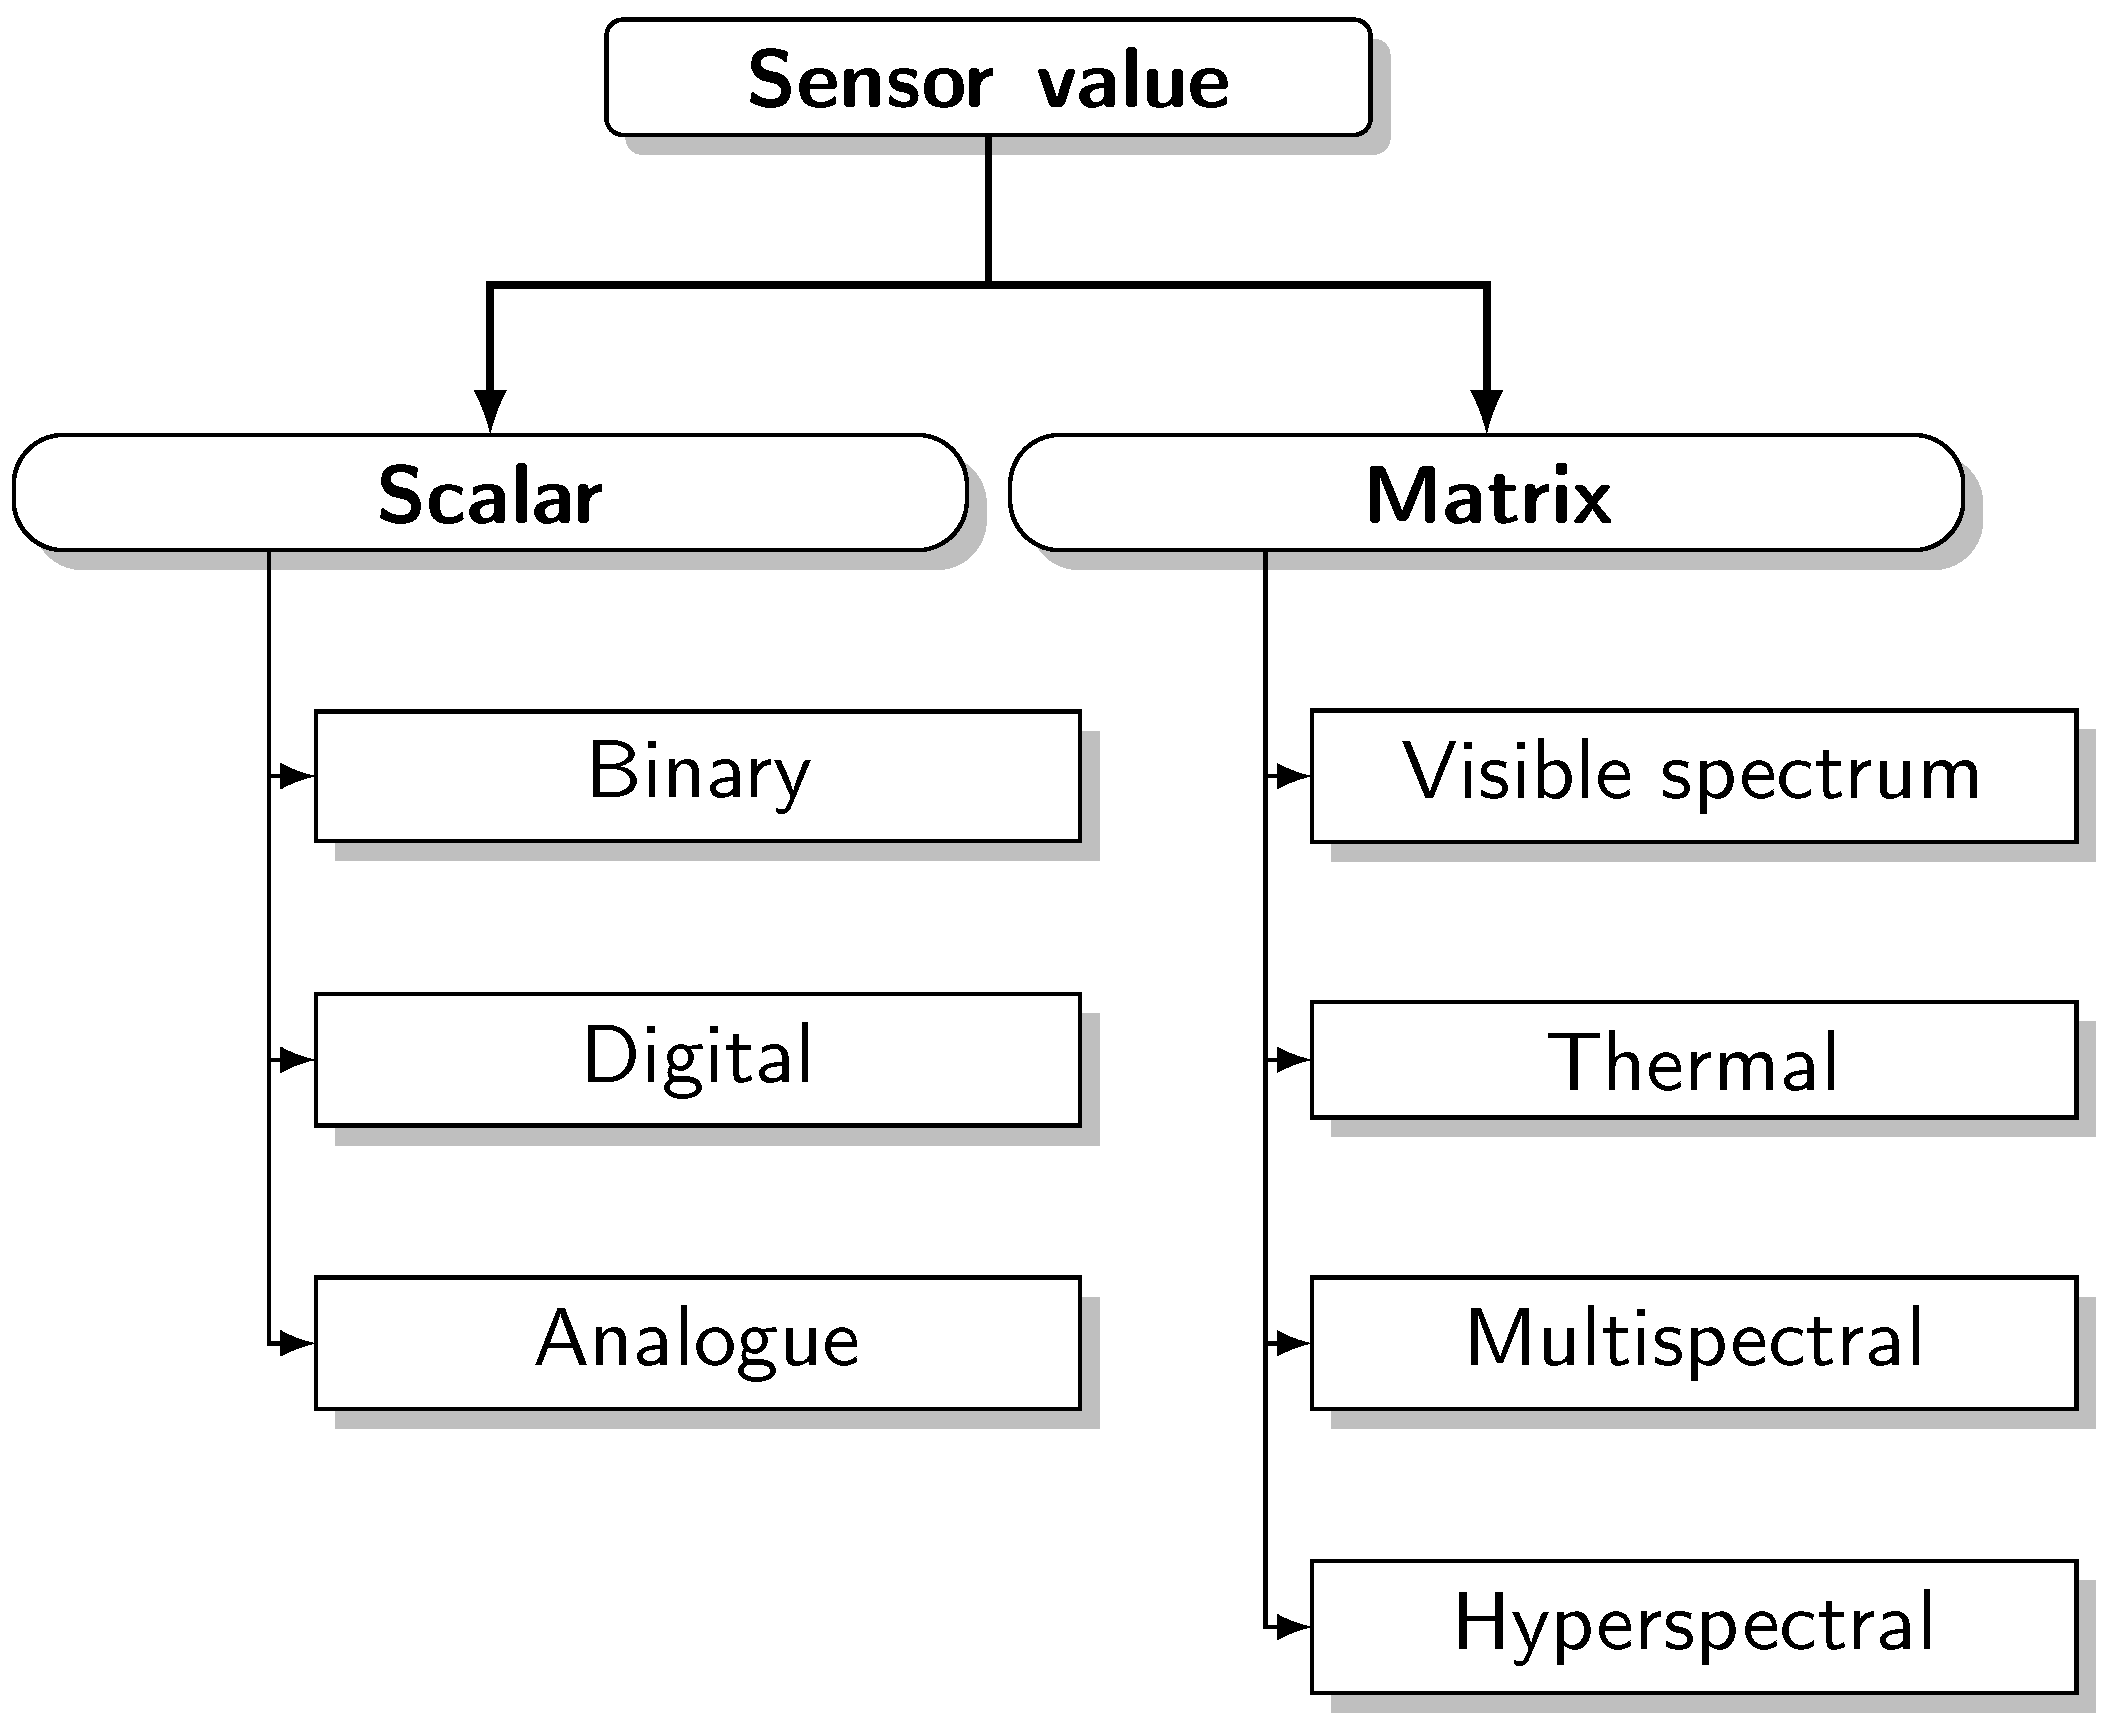
3.2. Sensor Value Taxonomy

Sensors are technical devices capable of transforming the condition of the environment into digital values that represent the quantitative state of certain features of the environment. From the point of view of the sensor value format, we can distinguish:
  • scalar sensors;
  • visible spectrum cameras;
  • thermal or thermographic cameras;
  • bispectral cameras;
  • hyperspectral cameras; and
  • multispectral cameras.
Therefore, the value taxonomy of sensors presented in Figure 2 can be defined. The figure shows the distinction between two major types of values—scalar and matrix values, and each of their subtypes. In the following sections we will discuss each element of the taxonomy and formally describe their attributes.

3.2.1. Scalar Sensors

Scalar sensors measure a feature of the environment that can be expressed as a single value and is usually associated with a point of the area at which the environmental observation takes place. Typical scalar sensors are meteorological sensors. We can write:
f { T e m p e r a t u r e , H u m i d i t y , P r e s s u r e , W i n d S p e e d , W i n d D i r e c t i o n , A i r f l o w , L i g h t , S o u n d , D o o r P o s i t i o n , S m o k e , W a t e r L e a k s , P o w e r F a i l u r e , V o l t a g e , A m p e r a g e . . . }
but other sensors, such as chemical sensors (measuring nitrates and phosphates in the soil, etc.) are also scalar sensors.
In the spirit of our proposed formal notation, we can define scalar sensor as:
S ( a , f , n ) : C t > v ; v R ; a P o i n t ( R × R ) A , t T

3.2.2. Cameras

Although a scalar sensor measures a single value at the point of measurement, a camera sensor measures multiple values at the broader scene limited to the camera’s field of view. A camera captures a matrix of values, with each value corresponding to a point in space and wavelength band. Visible-spectrum cameras measure three bands of wavelengths—red, green and blue. The feature f that is captured by this kind of sensor is a surface reflectance of sunlight in the visible spectrum of red, green and blue.
S ( a , f , n ) : C t > v ; v ( R × R ) 3 ; a P o l y g o n ( R × R ) n A , t T

3.2.3. PTZ Cameras

PTZ (Pan-Tilt-Zoom) cameras measure reflectance features of the surrounding area. The camera is mounted at a fixed location and is used to monitor the surrounding area. The total monitored area is limited, but in one observation a camera can detect the reflectance of only a portion of the monitored area. We can describe the surrounding area with a union of n subareas a i . The camera maps the condition of the environment in a moment t into a matrix of reflectances of the portion of the area a i . We can describe the functionality of the PTZ camera by means of the following formal notation:
S ( a , f , n ) : C t > v ; v ( R × R ) 3 ; a P o l y g o n ( R × R ) n A ; a = { a i : i = 1 n a i = a } ; a i = f ( t ) , t T ; v = m a t r i x ( f , a i , t )

3.2.4. Airborne Cameras

Airborne cameras differ from PTZ cameras in the fact that the entire monitored area is not fixed but rather depends on the trajectory of the UAV carrying the camera.
S ( a , f , n ) : C t > v ; a = { a p a r t i a l : a p a r t i a l A } , t = { t i = t i 1 + Δ t } ) , a p a r t i a l = f ( t ) ; v = m a t r i x ( f , a p a r t i a l , t )

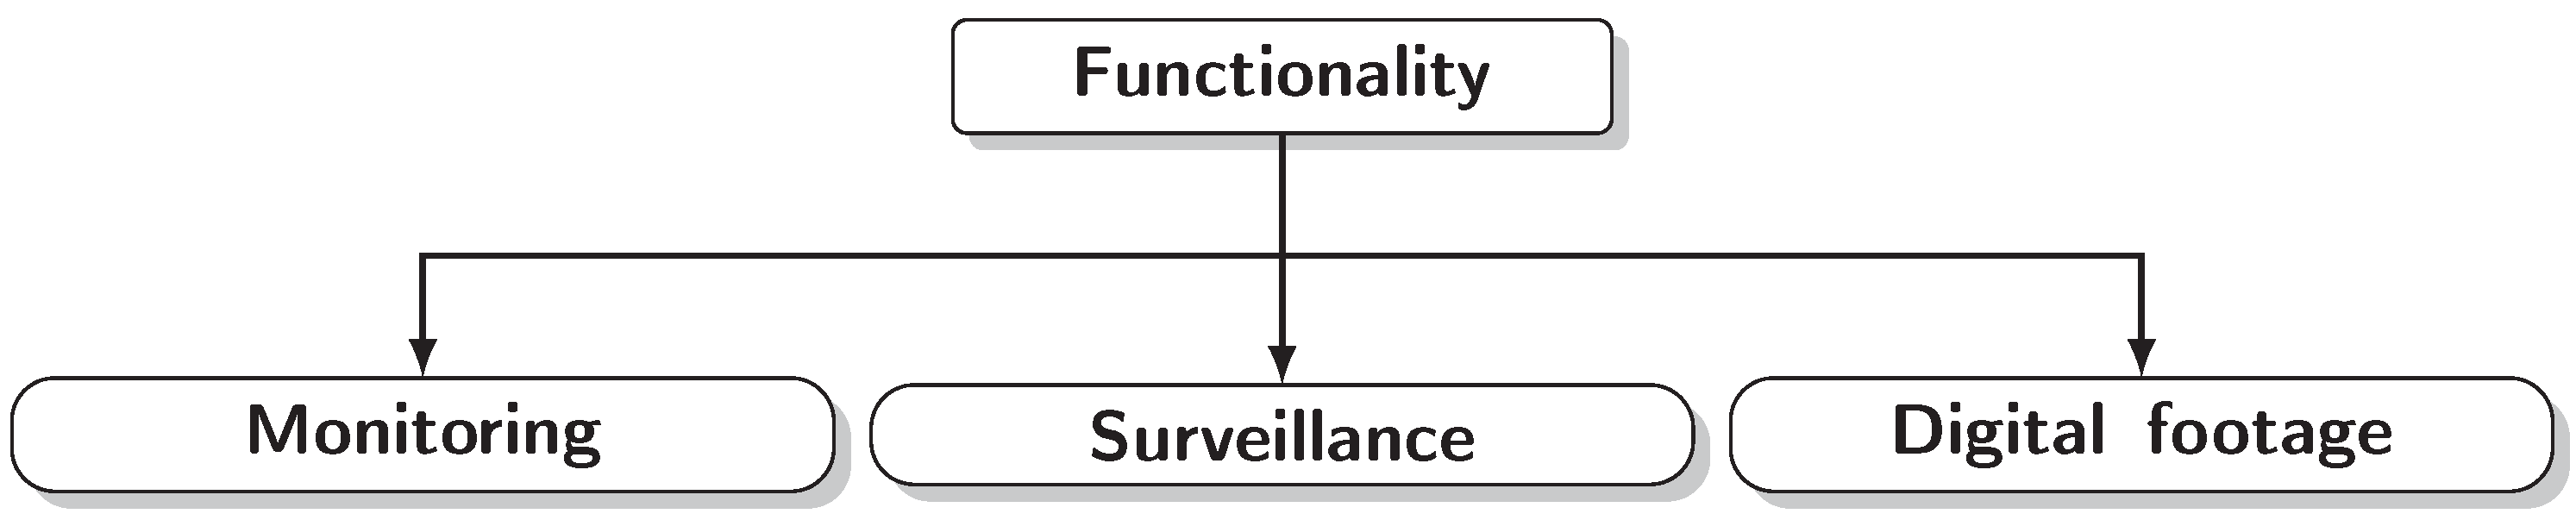
3.3. Functionality Taxonomy

Within the proposed conceptual framework we identify three main types of functionalities that can emerge from the data collected within the observation systems. Three main types of functionalities are:
  • Monitoring;
  • Surveillance; and
  • Digital footage and reconstruction.
The functionality taxonomy is depicted in Figure 3, comprising three main types of functionalities found in observation systems.

3.3.1. Environmental Monitoring

Environmental monitoring functionality refers to the functionality of the continuous collection and analysis of data related to environmental conditions. Monitoring is focused on an area of the environment covering the entire geometry in a certain scale. The collection of values from the sensors is performed in a cyclic manner, depending on the sensor type and the sampling method.
Monitoring using an observation system is a task where:
O S : C > V C ( a , f ) t i = t i 1 + Δ t

3.3.2. Event Surveillance

Event surveillance refers to the use of observation system sensors to track an event that is happening in the environment. In other words, the observation system (OS) is determined to collect only those values that are related to the specific event. The event takes place in the subspace area of the environment at a given time. The event can also evolve over time and subsequently change the area of coverage.
The area the sensors are focused on is selected to match the area where the event occurs. The selection of a subset of values measured by the sensors could be performed by invoking a query that selects the sensor capable of reaching the area of interest, focusing the sensors that have a variable area (PTZ sensors) and retrieving the data. As an event that is the subject of surveillance evolves within an environment and changes in terms of its area, the query is adjusted either based on the prediction or the detection so that the data frame of all relevant observations can be retrieved.
We can define the surveillance of an event E as a retrieval of all values v of the system, where the metadata match the event’s area, time and feature relevance:
O S : C [ E ] > V E = ( a e , t e , f e ) a e A t e T f e F
where E is an event happening in the area a e at time t e and which can be observed in features f e .

3.3.3. Digital Footage and Reconstruction

All monitoring and surveillance data must be archived and available for future event reconstruction or retrieval processes. This functionality refers to archive data retrieval. Archive data are available for a certain period of time. This time is usually referred to as an archiving period, and its duration should be clearly stated in all monitoring and surveillance systems because it can differ between various systems. It is advisable to make surveillance data available for longer archiving periods (since these data describe known and detected events), but monitoring data should also be available to reconstruct undetected events.
The archive retrieval process can be described as:
O S : C [ Q ] > V Q = ( a q | t q | f q ) a q A t q T f q F
where Q is a query that consists of a specific area, time or feature (or all).

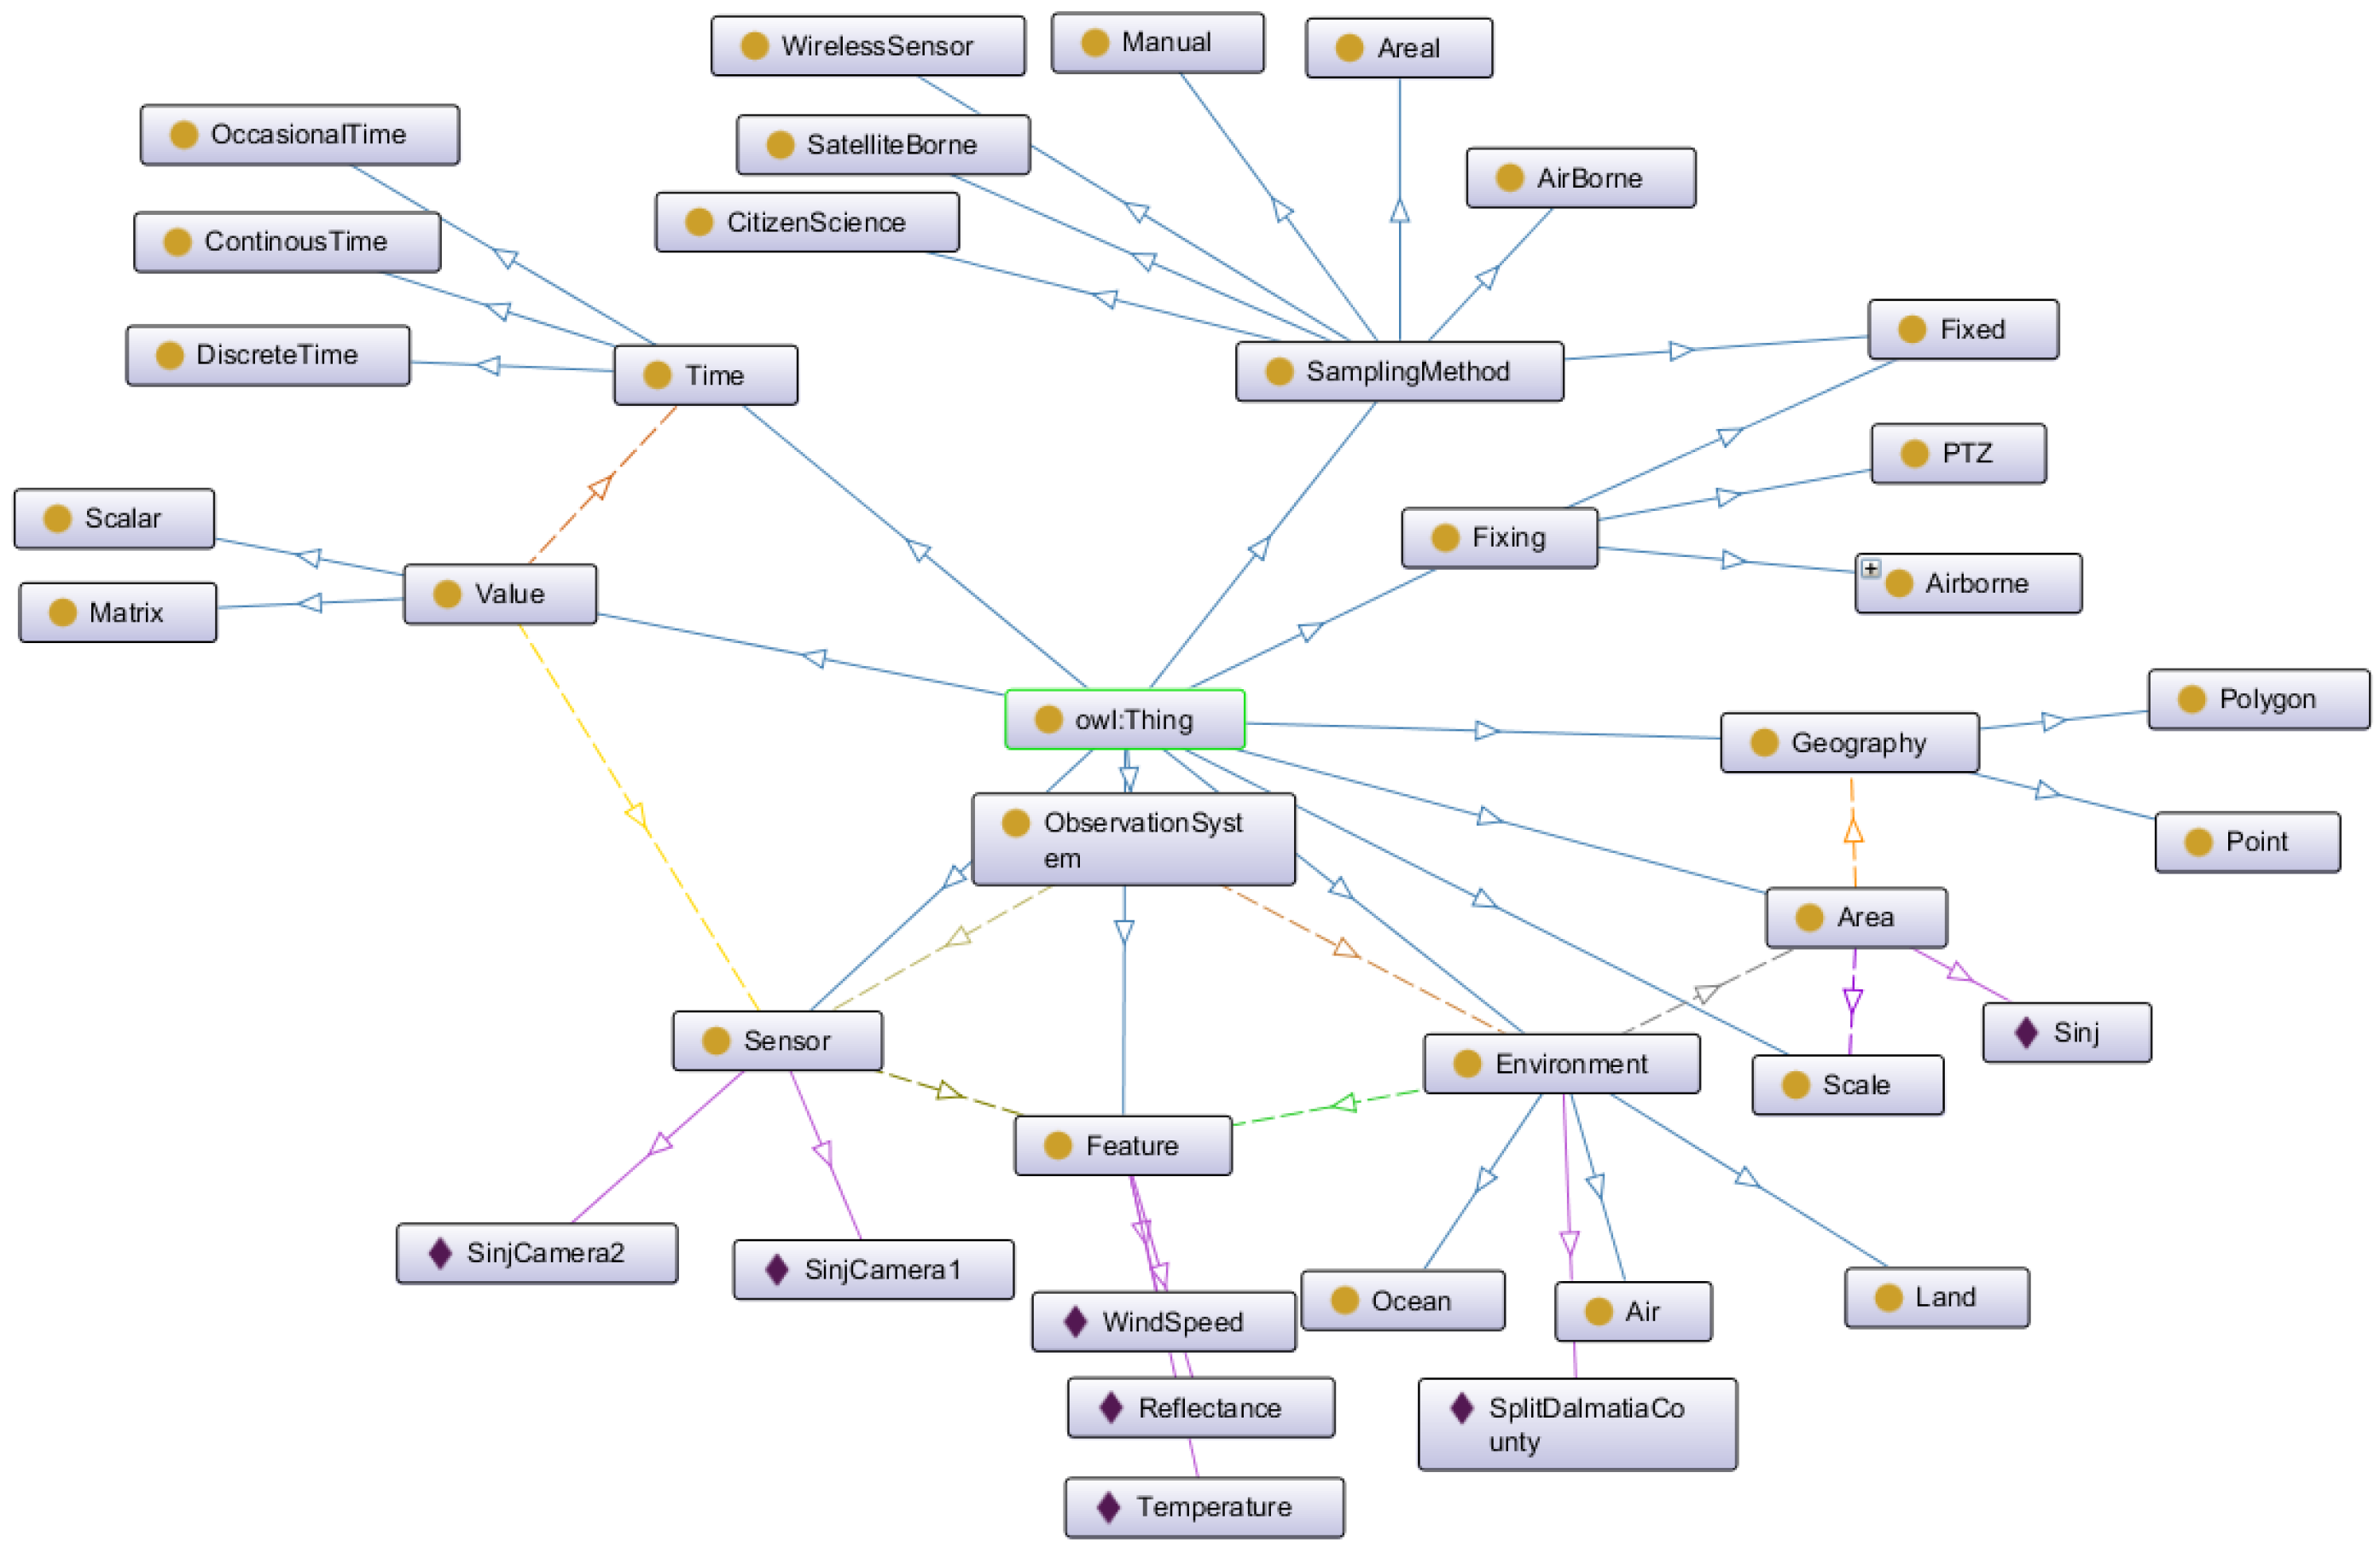
4. Implementation of an Environment Observation System Ontology

In order to build a computer understandable reepresentation of the proposed conceptual framework we used Protégé [45]—a common tool for building ontologies.
The concepts of the conceptual framework described in previous sections are implemented as classes of the ontology. Relationships between the classes are implemented as object properties with specific classes, such as the domain and range. A graphical representation of the concepts of the ontology is shown in Figure 4.
The proposed ontology can be used for the definition of the specific observation system by creating instances of sensors and describing the environment area and features. The classes and instances of the ontology represent compact aggregated knowledge base capabilities for querying and reasoning.

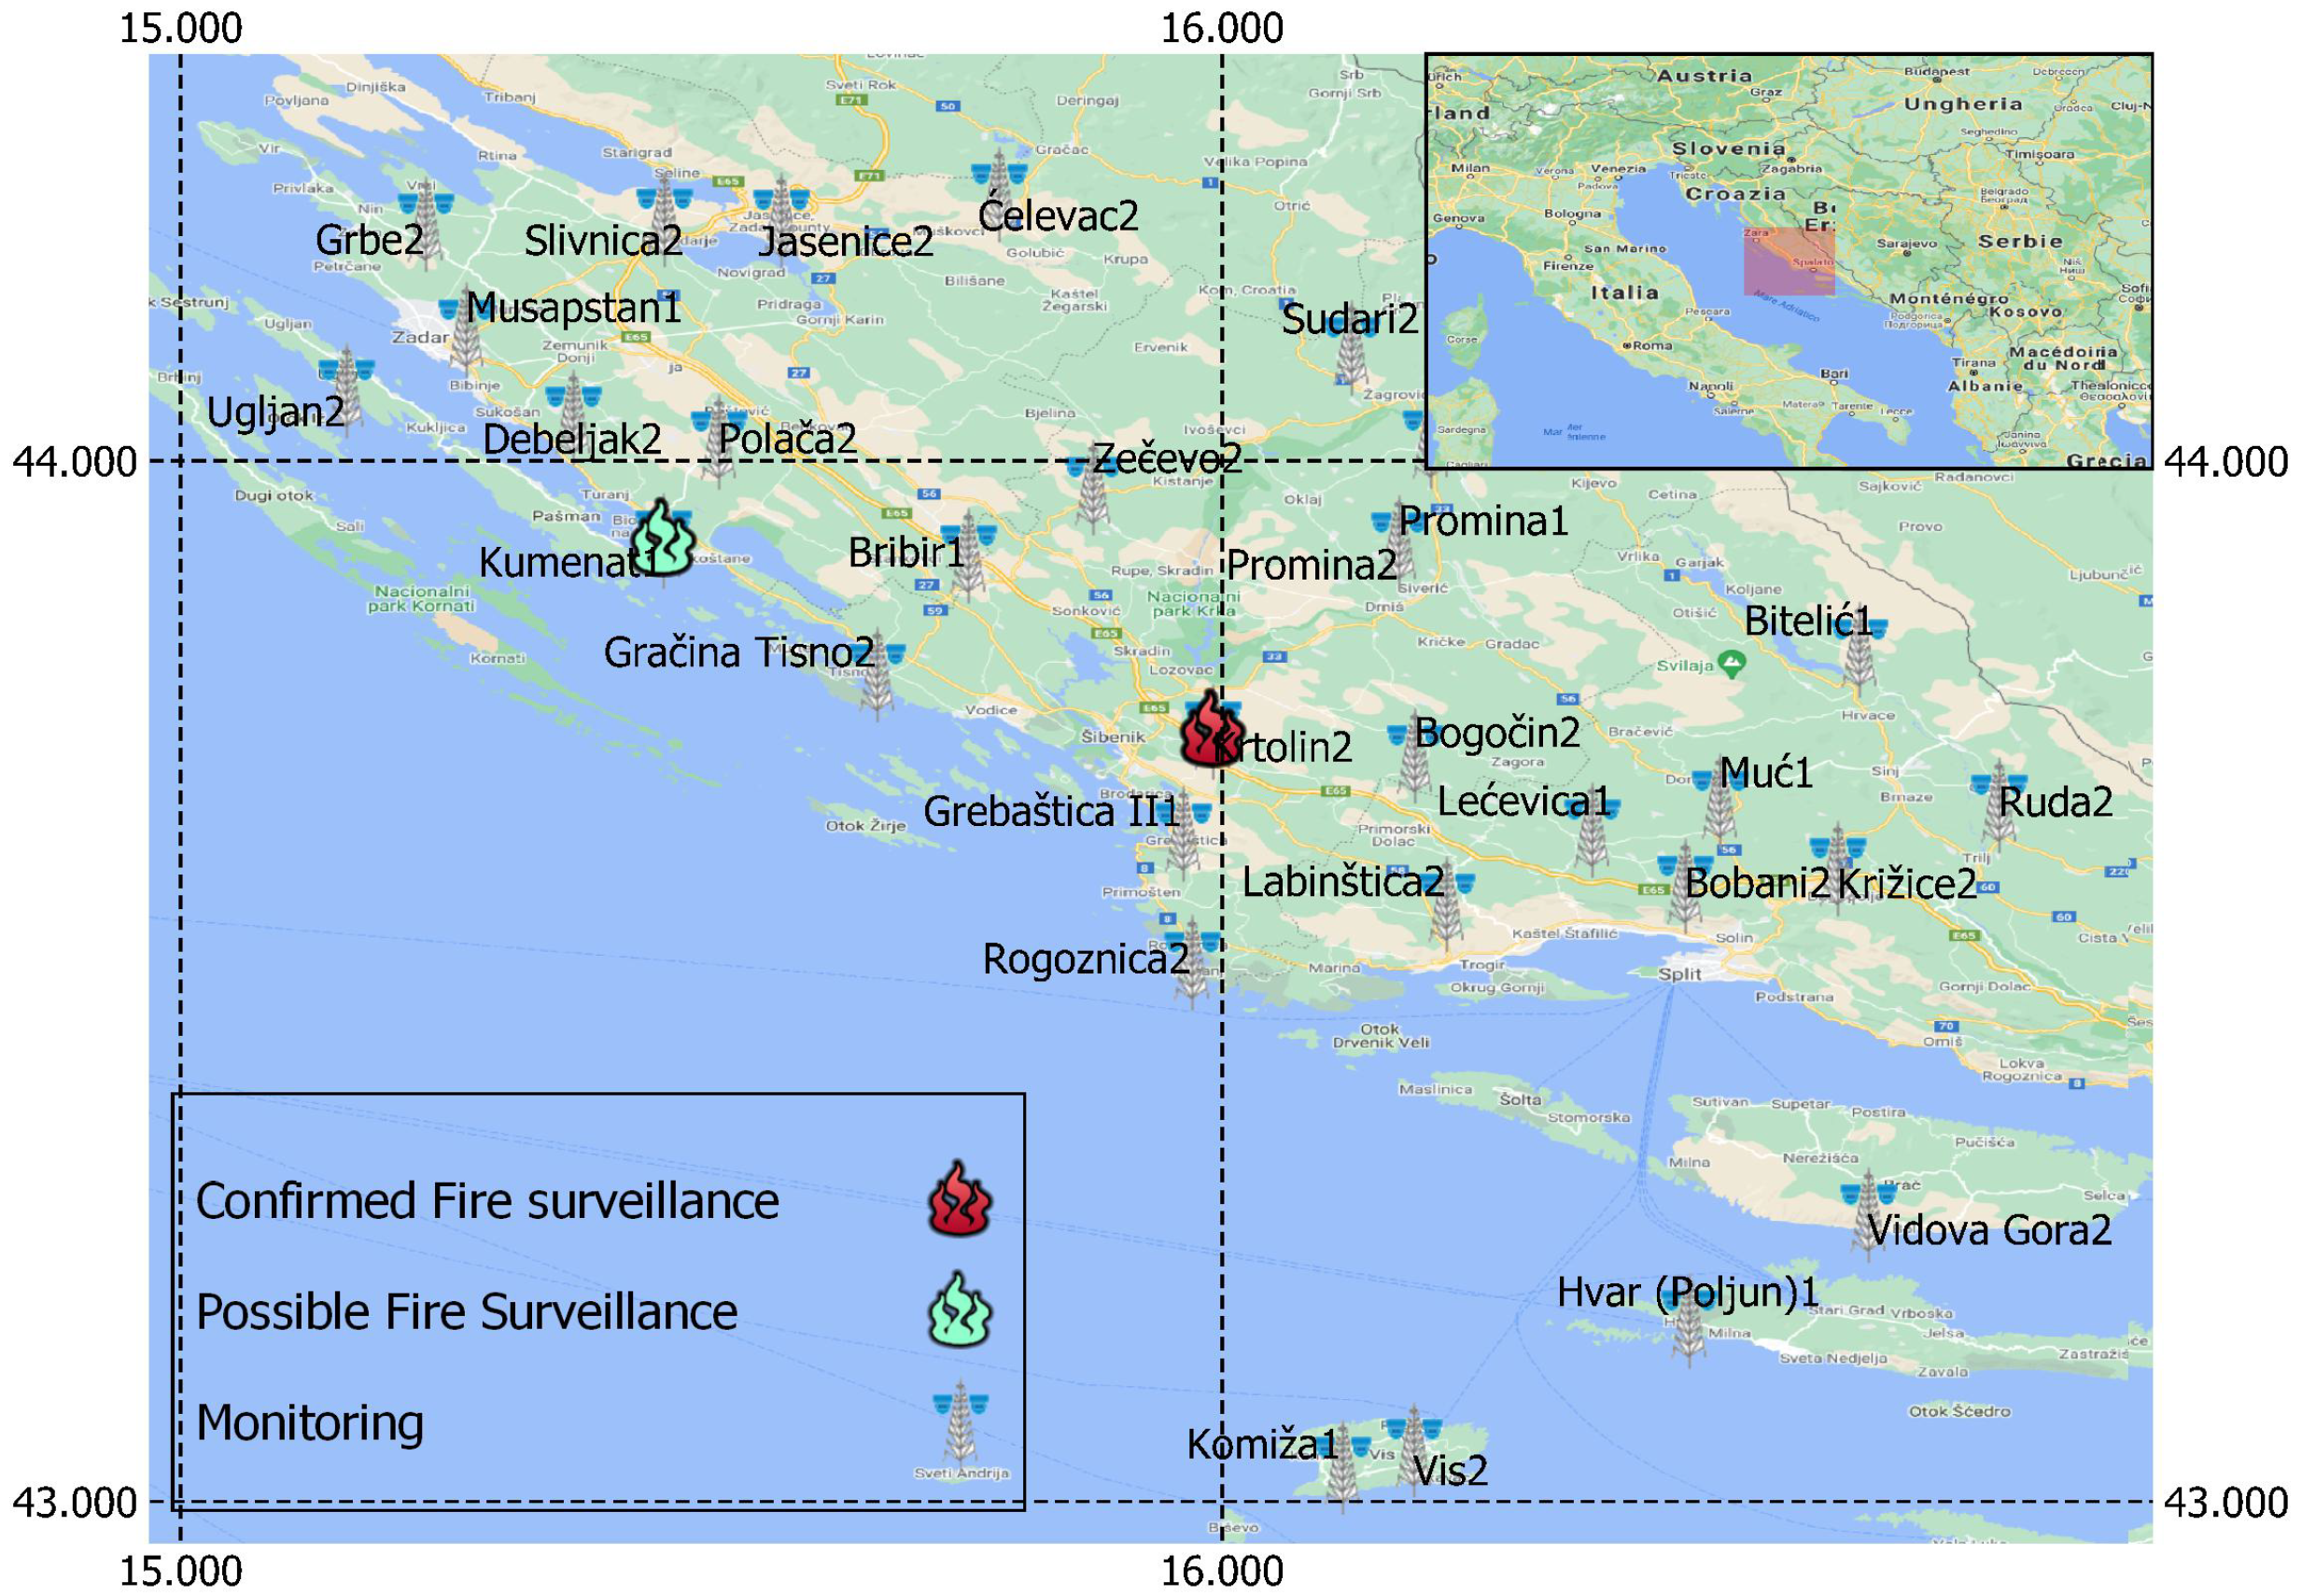
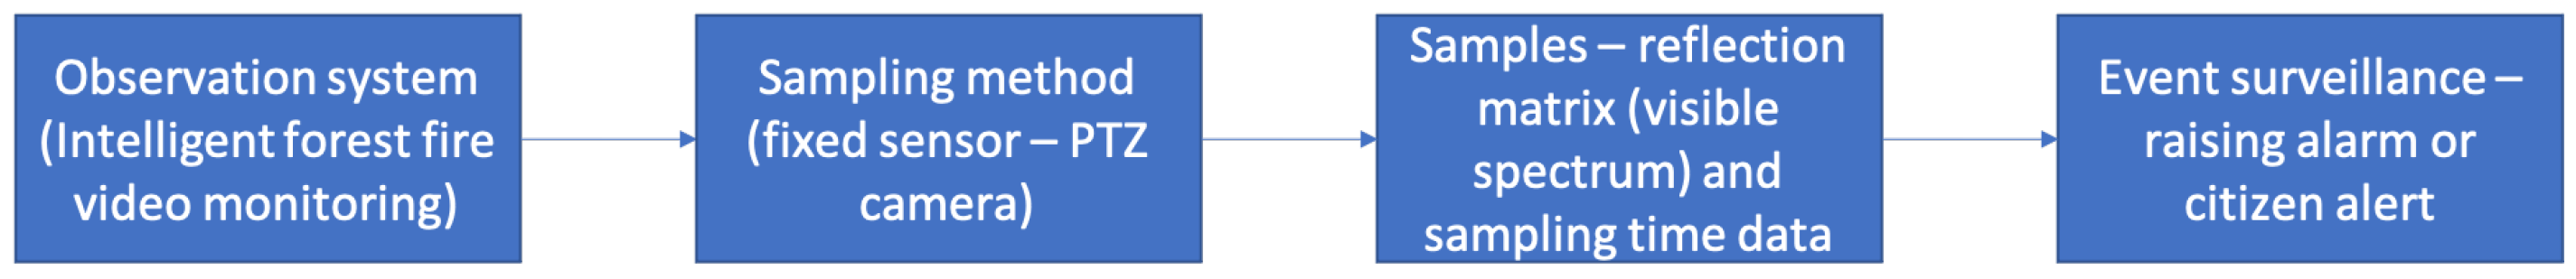
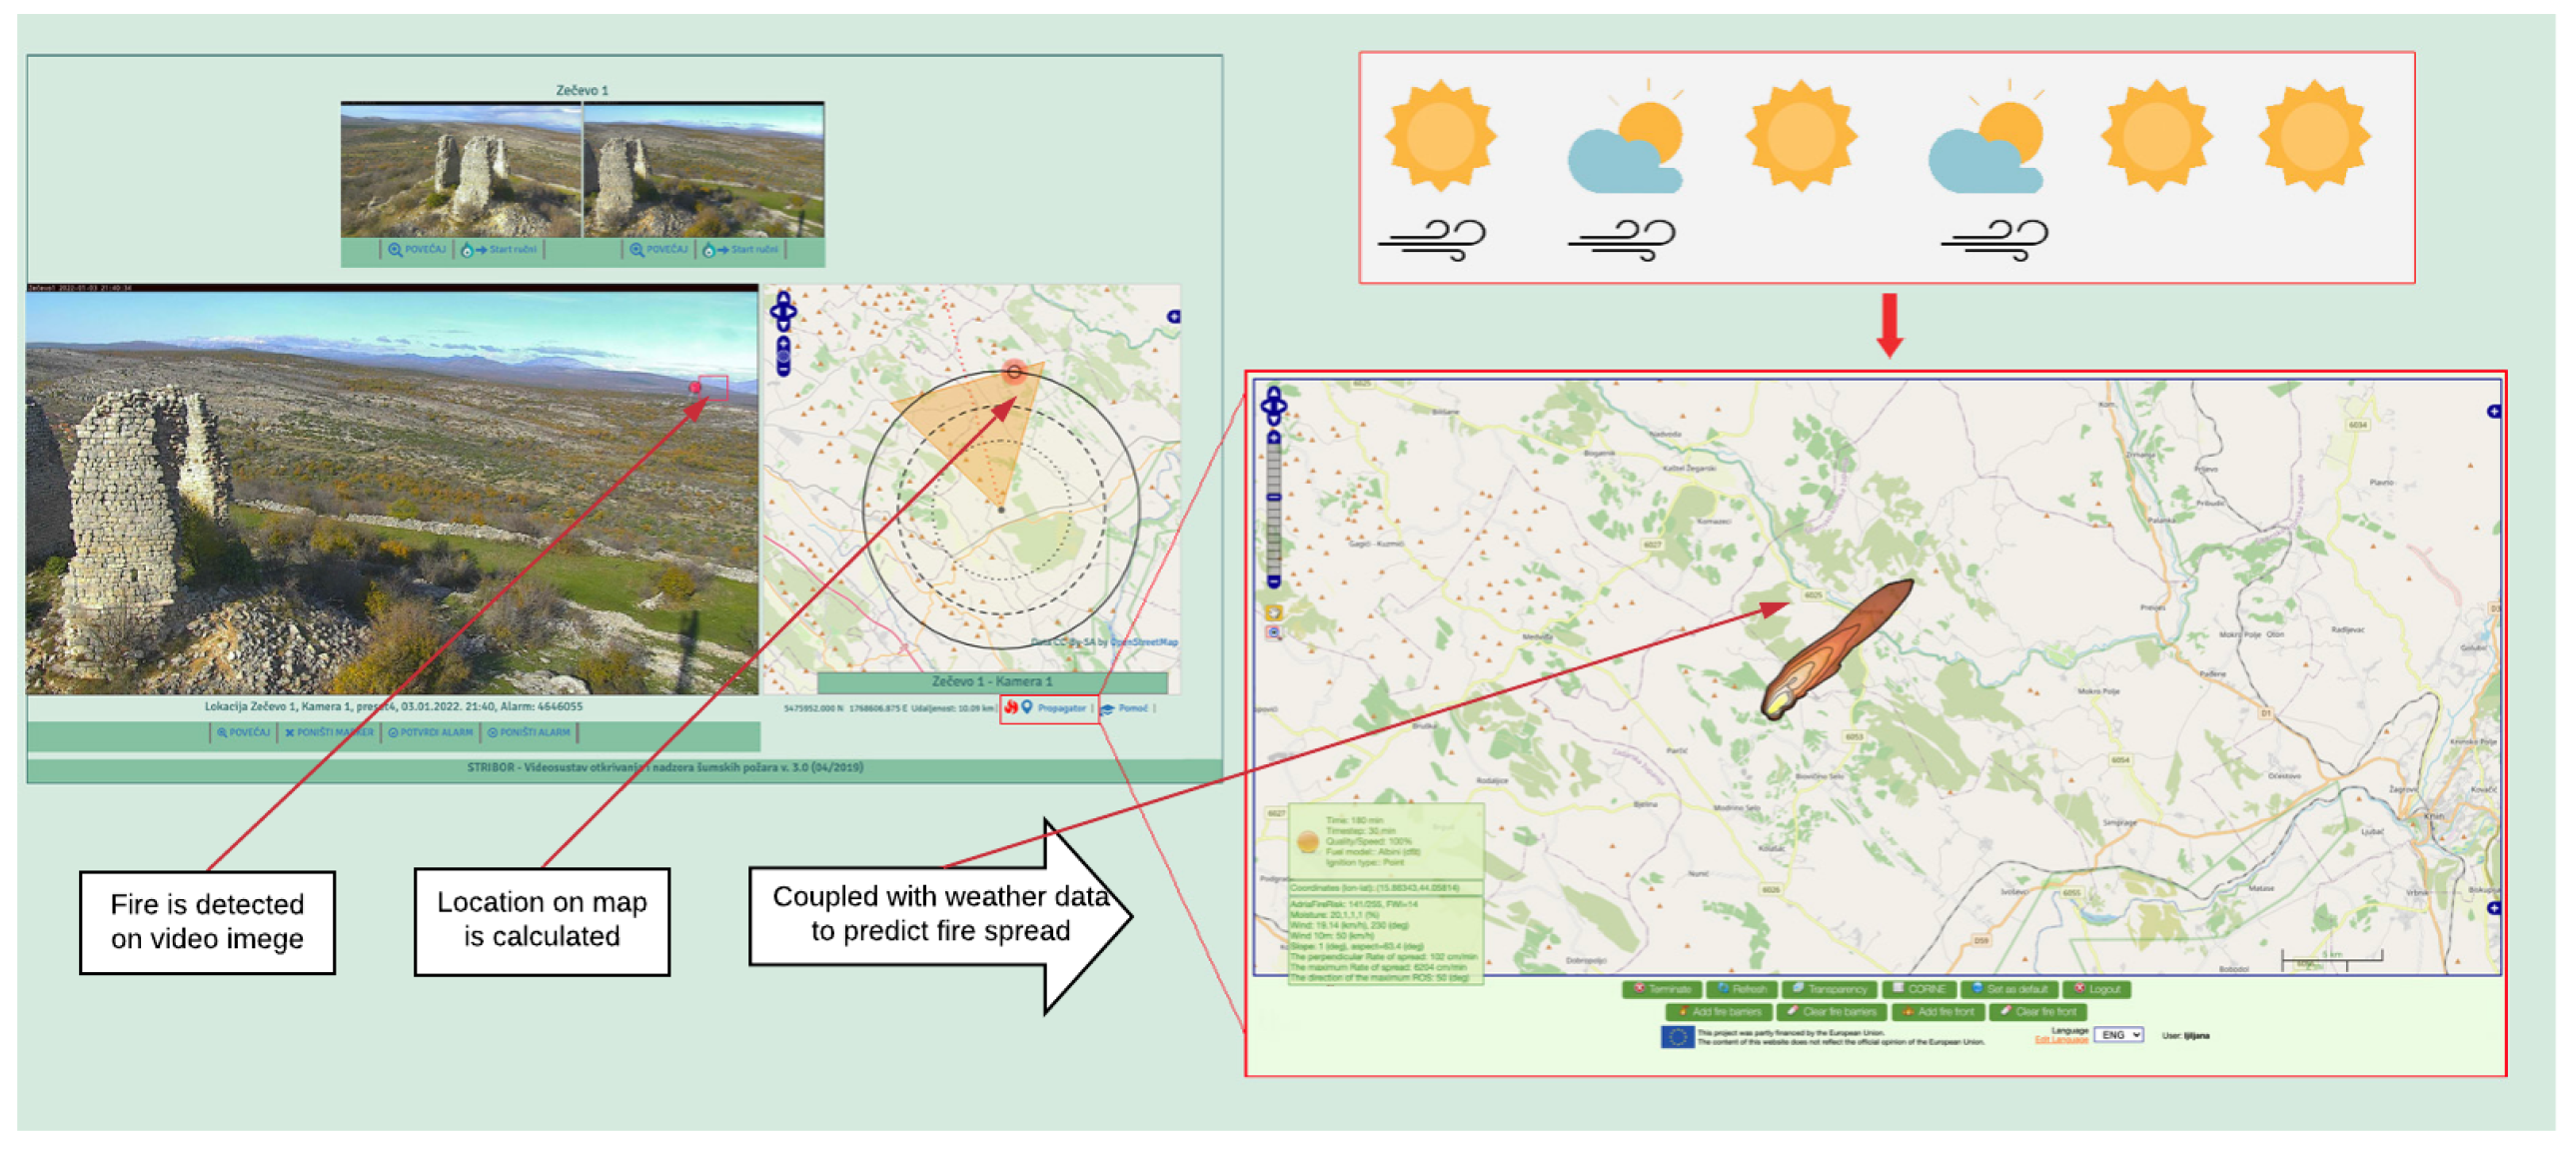
5. A Case Study—Intelligent Forest Fire Video Monitoring and Surveillance in Croatia

A specific domain of environmental management is forest fire management. In this section we present the implementation of an observation system dedicated to forest fire monitoring and surveillance in Croatia through the lens of concepts and relationships of the conceptual framework described in this paper.
Due to its specific Mediterranean location and climate, Croatia, and especially the coastal part of Croatia, occasionally suffers from forest fires. The Mediterranean landscape and vegetation, warm and dry summers and strong dry winds increase the probability of fire occurrence and spread. Preventive activities and early fire detection and responses are among the most frequent measures used in order to save lives, nature and infrastructure from forest fires. Early fire detection and a rapid and appropriate response is of a vital importance for the minimization of fire damage. This led to the initiation of the Intelligent Forest Fire Video Monitoring and Surveillance System [46]. This system was designed as an observation system, consisting of PTZ cameras located in the environment. Each camera has an associated area that it covers. From the aspect of functionality, the system has separate interfaces for different functionalities identified by the functionality taxonomy.
When performing a monitoring functionality, the camera cyclically moves and samples the reflectance images of the i t h area that it covers. The sampled images are used by early fire detection algorithms. In the case that a forest fire is detected, an alarm is raised. The described system can be observed based on the proposed conceptual framework as shown in Figure 5.
In the case of a forest fire event, regardless of whether the fire is detected by the fire detection algorithm or reported by citizens, the system can switch to surveillance mode, displaying all the information relevant to the specific event of the fire.
Figure 6 shows the user interface with the statuses of all the cameras. The visualization on the map indicates the location of the camera, thus suggesting the area of coverage. Different icons are used to represent the status of the camera—the tower indicates that the camera is in its monitoring mode, a green fire icon indicates a possible fire event and a red fire icon indicates a confirmed fire in the area. This interface is used for monitoring the whole area, and each camera video stream can be accessed separately by clicking on the camera, which is typically performed only to inspect a specific event.
In this paper, we proposed a semantic conceptual framework which captures the key concepts associated with the horizontal dimension of the environmental monitoring system by capturing the characteristics of various sensor types and their capabilities. On the other hand, in the vertical dimension of environmental monitoring, we can distinguish between syntactic and semantic data validation and the detection of phenomena. Data validation and phenomenon detection, as integral components of environmental monitoring frameworks, were discussed in [47].
Figure 7 shows the user interface for event surveillance. The interface shows the current image taken by the camera in the field, and the camera’s orientation can be viewed on the map. The orange triangle on the map shows the approximate geographical area visible on the current image. The map can be overlaid with other spatial information (such as weather information, GPS tracking of firefighting vehicles, hydrant locations, etc.). The area covered by the camera’s image can be changed using camera controls—clicking on the map or PTZ commands. Thus, the user controls the area to make the camera record the area where the event is happening.
Figure 8 shows an example of data interoperability between two software systems. The fire detected on the monitoring system is assigned to a location—a point in the area covered by the camera image where a fire is detected. The information on the fire’s location retrieved by the monitoring and surveillance system can be communicated to fire propagation simulation software [48]. The fire propagation simulation software uses this information to calculate the most probable fire spread and returns the shape which the fire will acquire in a two-hour period. The predicted shape of a fire designates the area that should be more carefully surveilled. Cameras with the possibility of recording parts of this area can then be selected.
Figure 9 shows the user interface for the retrieval of archive data. The retrieved data can be filtered using spatial, temporal and feature constraints. The dynamics of the collected data are visible on the graph showing the portion of the fire alarms raised by imageson the camera in a predefined period. By sliding the predefined time window, only the images associated with the time of interest are retrieved. By selecting only the images retrieved by the camera sensors and only those positions covering the specific area, one can select spatially constrained data. The retrieval of all images, coupled with their metadata [49], improves the reusability of the conceptual data.

6. Conclusions

In this paper we proposed a semantic conceptual framework for environmental monitoring and surveillance. This framework focuses on an observation system consisting of sensors measuring the features of the environment. The concepts and their relationships are described and noted using formal notation. A discussion of three aspects of the observation system, namely, the sampling methods, value formats and functionalities, is presented. Each of the three discussed aspects is formally described using variables such as area, features and values. The variables emphasize the interconnectedness of the three discussed aspects. The conceptual framework presented here provides a basic understanding of observation systems by distinguishing concepts such as environment, sensor, monitoring, surveillance and value. A description of the anatomy of the observation system is included, along with a description of the limitations and capabilities of the various types of sensors in terms of sampling procedures and value types. We take into account the spatial and temporal dimensions in all of the concepts discussed within the framework. We discuss the spatial and temporal resolution, as this can be a limiting factor when selecting the sensor type of the observation system. The semantics of these concepts is incorporated in the formal definitions and the ontology notation. The implementation of the presented conceptual framework and ontology is suitable for computer decision making and reasoning, and it has shown itself to be suitable for the description of the Intelligent Forest Fire Monitoring and Surveillance system implemented in the coastal part of Croatia. This case study used a PTZ camera as its elementary sensor. The system consisted of a network of PTZ cameras. Using the semantic conceptual framework proposed in this paper, coverage areas for each camera can be formally described. Additionally, the framework allows for the detection of the coverage area of each camera position. In this paper, we have described how these concepts relate to several functional aspects of the system:
  • The monitoring of a large area with a network of PTZ cameras and the triggering of alarms in cases of forest fire detection;
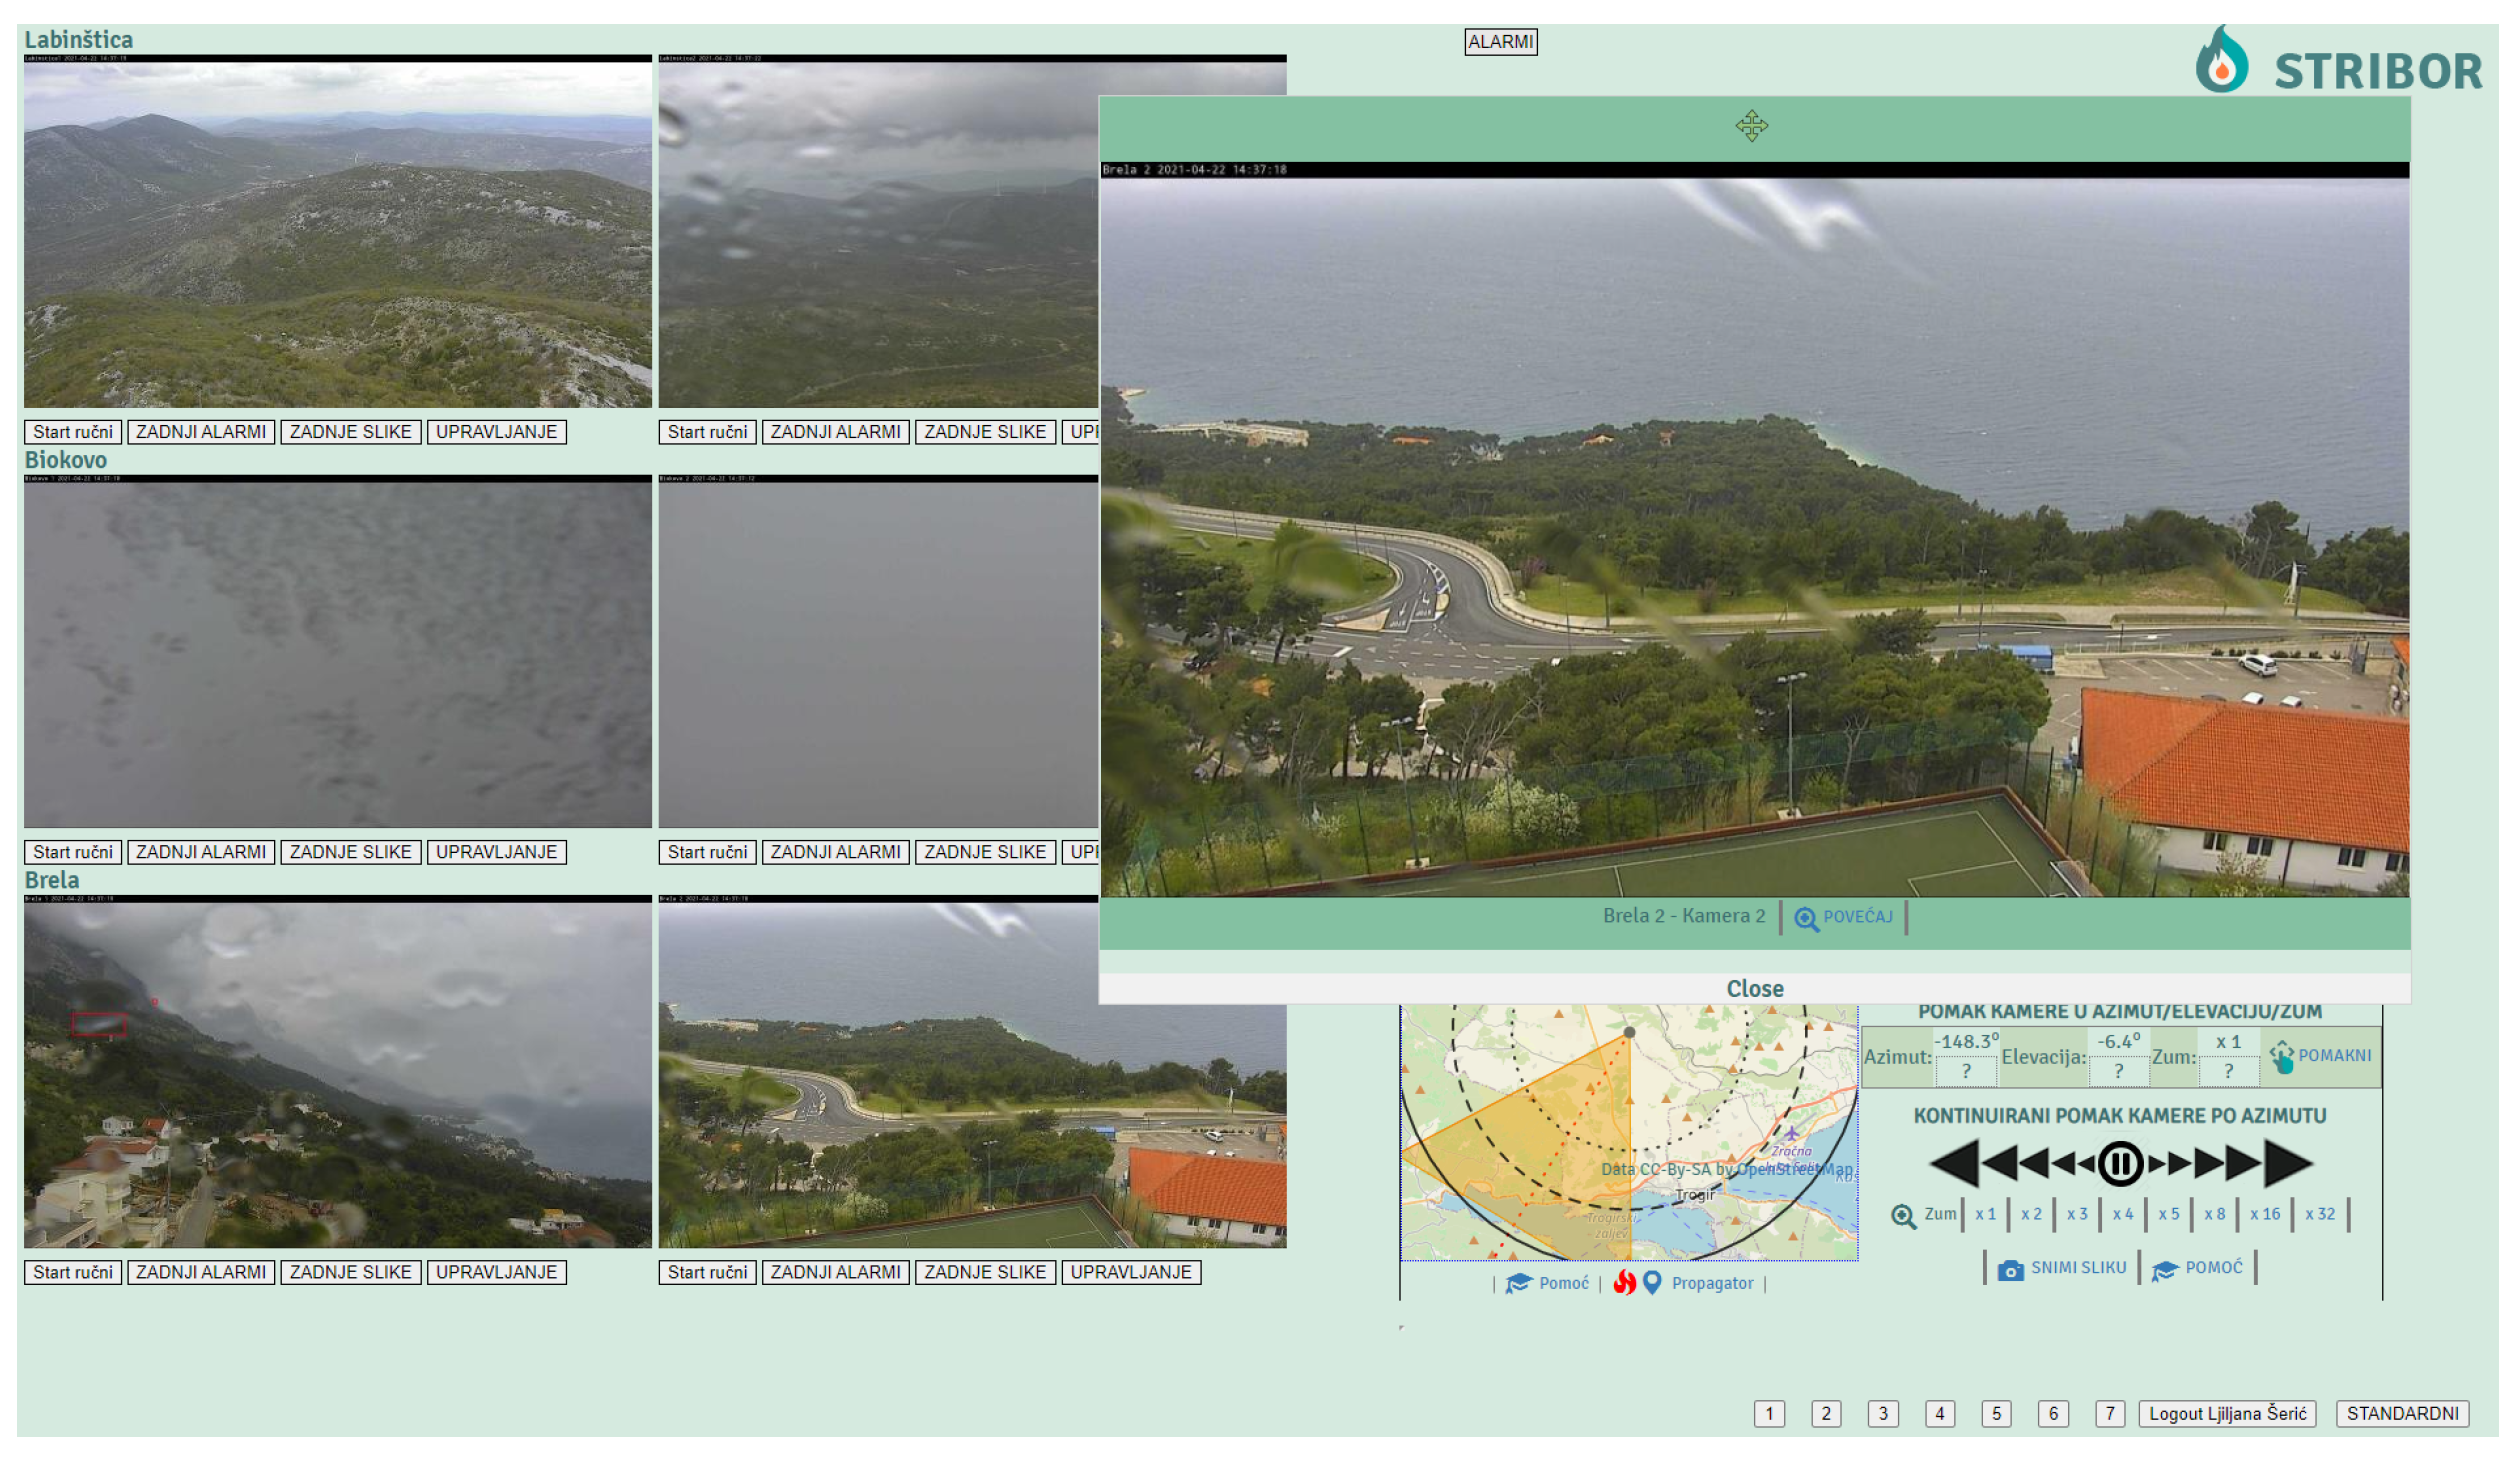
  • Surveillance of an event through adjusting one camera position in order to focus on the area where the event takes place;
  • Interoperability with a fire propagation modeling system by sending the location of the fire ignition and adjusting the area that needs to be surveilled based on the fire propagation forecasting; and
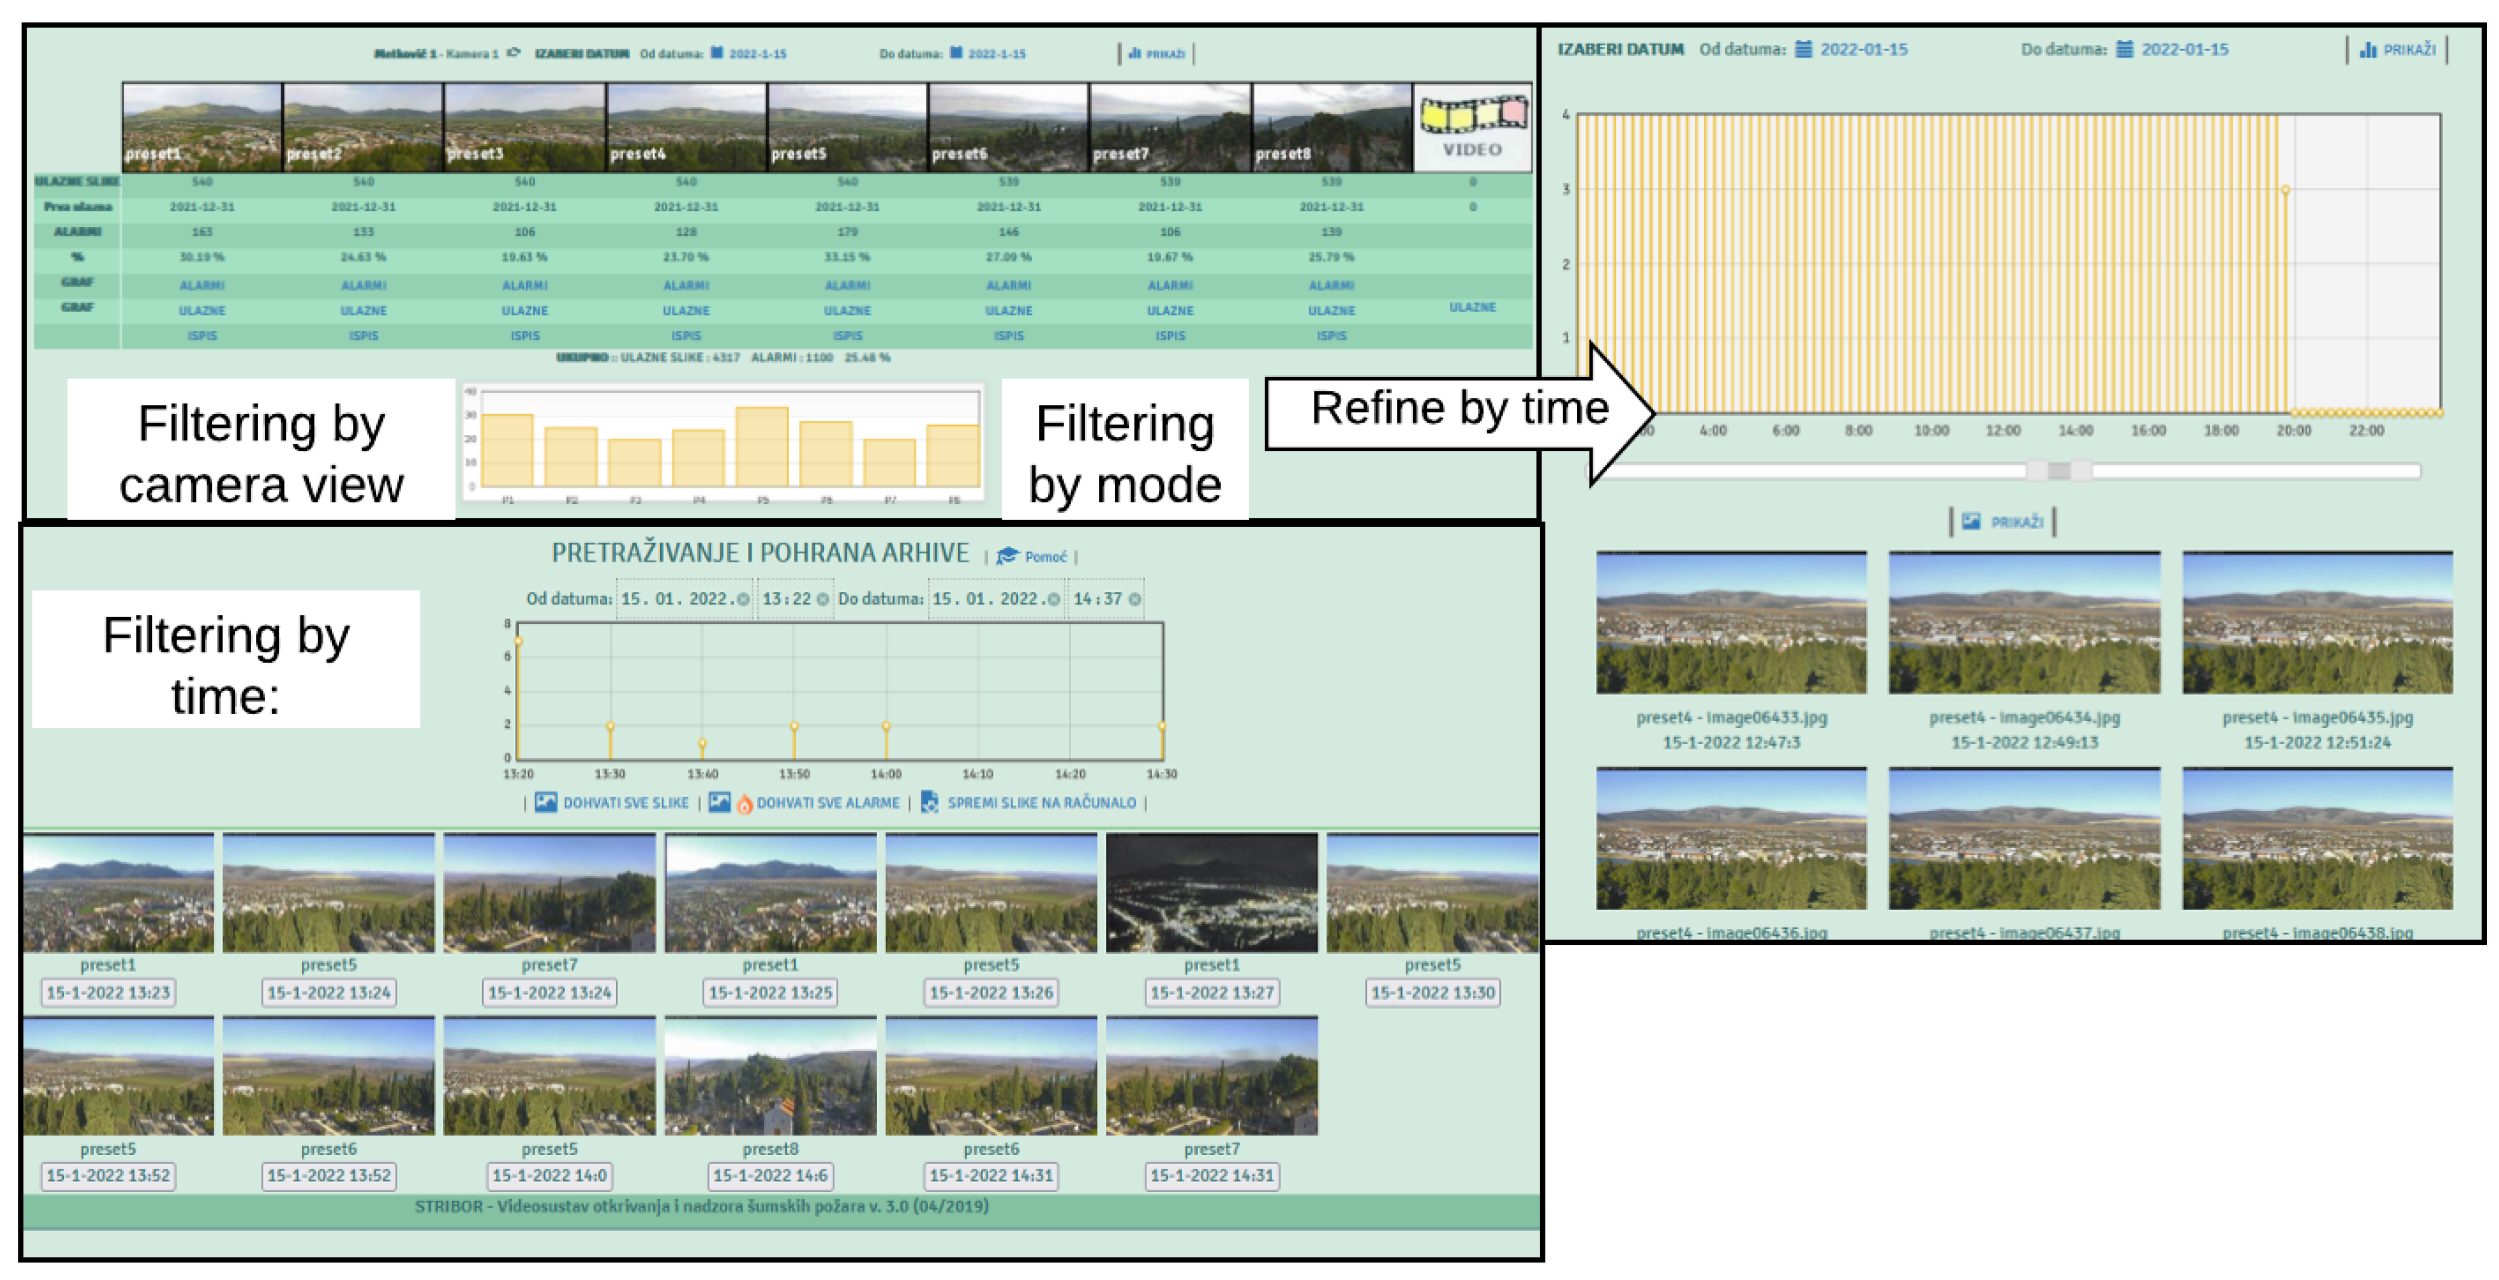
  • Retrieval of archived data with spatio-temporal filtering.
Our future work will be aimed towards the implementation of a coastal water quality monitoring system in the spirit of the proposed conceptual framework.

Author Contributions

Conceptualization, L.Š.; methodology, L.Š. and M.B. (Maja Braović); software, L.Š. and A.I.; validation, M.B. (Marin Bugarić), A.I.; formal analysis, A.I. and M.B. (Marin Bugarić); investigation, M.B. (Maja Braović); resources, M.B. (Maja Braović); writing—original draft preparation, L.Š.; writing—review and editing, M.B. (Marin Bugarić). All authors have read and agreed to the published version of the manuscript.

Funding

This research was supported by the project CAAT (Coastal Auto-purification Assessment Technology) which is funded by the European Union from European Structural and Investment Funds 2014–2020, Contract Number: KK.01.1.1.04.0064.

Acknowledgments

This research was supported through project CAAT (Coastal Auto-purification Assessment Technology), funded by the European Union from European Structural and Investment Funds 2014–2020, Contract Number: KK.01.1.1.04.0064.

Conflicts of Interest

The authors declare no conflict of interest.

Abbreviations

The following abbreviations are used in this manuscript:
ICTInformation and communication technologies
GISGeographic information system
DPSIRDrivers, Pressures, State, Impact and Response
PSRPressures, State and Response
OECDOrganization for Economic Co-operation and Development
SOSASensors, Observations, Samples and Actuators
IoTInternet of Things
OSObservation System
UAVUnmanned Aerial Vehicle
PTZPan-Tilt-Zoom
RGBRed Green Blue

References

  1. Webster, R.; Lark, M. Field Sampling for Environmental Science and Management; Routledge: London, UK, 2012. [Google Scholar]
  2. Othman, M.F.; Shazali, K. Wireless Sensor Network Applications: A Study in Environment Monitoring System. Procedia Eng. 2012, 41, 1204–1210. [Google Scholar] [CrossRef] [Green Version]
  3. Tsakanikas, V.; Dagiuklas, T. Video surveillance systems-current status and future trends. Comput. Electr. Eng. 2018, 70, 736–753. [Google Scholar] [CrossRef]
  4. Toth, C.; Jóźków, G. Remote sensing platforms and sensors: A survey. ISPRS J. Photogramm. Remote Sens. 2016, 115, 22–36. [Google Scholar] [CrossRef]
  5. Strobl, R.; Robillard, P.; Shannon, R.D.; Day, R.L.; McDonnell, A. A water quality monitoring network design methodology for the selection of critical sampling points: Part I. Environ. Monit. Assess. 2006, 112, 137–158. [Google Scholar] [CrossRef]
  6. Jabareen, Y. Building a conceptual framework: Philosophy, definitions, and procedure. Int. J. Qual. Methods 2009, 8, 49–62. [Google Scholar] [CrossRef]
  7. Zhang, S.; Yen, I.L.; Bastani, F.B. Toward Semantic Enhancement of Monitoring Data Repository. In Proceedings of the 2016 IEEE Tenth International Conference on Semantic Computing (ICSC), Laguna Hills, CA, USA, 4–6 February 2016; pp. 140–147. [Google Scholar] [CrossRef]
  8. Badii, A.; Tiemann, M.; Thiemert, D. Data integration, semantic data representation and decision support for situational awareness in protection of critical assets. In Proceedings of the 2014 International Conference on Signal Processing and Multimedia Applications (SIGMAP), Vienna, Austria, 28–30 August 2014; pp. 341–345. [Google Scholar]
  9. Bennett, N.J.; Whitty, T.S.; Finkbeiner, E.; Pittman, J.; Bassett, H.; Gelcich, S.; Allison, E.H. Environmental stewardship: A conceptual review and analytical framework. Environ. Manag. 2018, 61, 597–614. [Google Scholar] [CrossRef] [Green Version]
  10. Gari, S.R.; Newton, A.; Icely, J.D. A review of the application and evolution of the DPSIR framework with an emphasis on coastal social-ecological systems. Ocean. Coast. Manag. 2015, 103, 63–77. [Google Scholar] [CrossRef] [Green Version]
  11. Svarstad, H.; Petersen, L.K.; Rothman, D.; Siepel, H.; Wätzold, F. Discursive biases of the environmental research framework DPSIR. Land Use Policy 2008, 25, 116–125. [Google Scholar] [CrossRef]
  12. Janowicz, K.; Haller, A.; Cox, S.J.; Le Phuoc, D.; Lefrançois, M. SOSA: A lightweight ontology for sensors, observations, samples, and actuators. J. Web Semant. 2019, 56, 1–10. [Google Scholar] [CrossRef] [Green Version]
  13. Honti, G.M.; Abonyi, J. A review of semantic sensor technologies in internet of things architectures. Complexity 2019, 2019, 6473160. [Google Scholar] [CrossRef] [Green Version]
  14. Dziak, D.; Jachimczyk, B.; Kulesza, W.J. IoT-based information system for healthcare application: Design methodology approach. Appl. Sci. 2017, 7, 596. [Google Scholar] [CrossRef]
  15. Makris, D.; Ellis, T. Learning semantic scene models from observing activity in visual surveillance. IEEE Trans. Syst. Man Cybern. Part B (Cybern.) 2005, 35, 397–408. [Google Scholar] [CrossRef] [PubMed] [Green Version]
  16. Wilde, F.D. Water-Quality Sampling by the U.S. Geological Survey—Standard Protocols and Procedures. U.S. Geol. Surv. Fact Sheet, 2010-3121. Available online: https://pubs.usgs.gov/fs/2010/3121/ (accessed on 20 November 2021).
  17. Ministry of Agriculture. Pravilnik o NačInu Prikupljanja Podataka, sadržAju i Vođenju Upisnika te Uvjetiima korišTenja Podataka o šUmskim požArima. 2019. Available online: https://narodne-novine.nn.hr/clanci/sluzbeni/2019_09_82_1708.html (accessed on 20 November 2021).
  18. Nixon, S.; Grath, J.; Bøgestrand, J. EUROWATERNET: The European Environment Agency’s Monitoring and Information Network for Inland Water Resources—Technical Guidelines for Implementation; Final Draft; EEA Technical Report; European Environment Agency—EEA: Copenhagen, Denmark, 1998. [Google Scholar]
  19. Jones, A.; Fernandez-Ugalde, O.; Scarpa, S. LUCAS 2015 Topsoil Survey. Presentation of Dataset and Results; EUR 30332 EN; Publications Office of the European Union: Luxembourg, 2020; ISBN 978-92-76-21080-1. [Google Scholar]
  20. Gohin, F.; Bryère, P.; Lefebvre, A.; Sauriau, P.G.; Savoye, N.; Vantrepotte, V.; Bozec, Y.; Cariou, T.; Conan, P.; Coudray, S.; et al. Satellite and in situ monitoring of Chl-a, Turbidity, and Total Suspended Matter in coastal waters: Experience of the year 2017 along the French Coasts. J. Mar. Sci. Eng. 2020, 8, 665. [Google Scholar] [CrossRef]
  21. Ballabio, C.; Lugato, E.; Fernández-Ugalde, O.; Orgiazzi, A.; Jones, A.; Borrelli, P.; Montanarella, L.; Panagos, P. Mapping LUCAS topsoil chemical properties at European scale using Gaussian process regression. Geoderma 2019, 355, 113912. [Google Scholar] [CrossRef] [PubMed]
  22. Stipaničev, D.; Bugarić, M.; Krstinić, D.; Šerić, L.; Jakovčević, T.; Braović, M.; Štula, M. New Generation of Automatic Ground Based Wildfire Surveillance Systems. Available online: http://hdl.handle.net/10316.2/340132014 (accessed on 20 November 2021).
  23. Andriolo, U.; Mendes, D.; Taborda, R. Breaking wave height estimation from Timex images: Two methods for coastal video monitoring systems. Remote Sens. 2020, 12, 204. [Google Scholar] [CrossRef] [Green Version]
  24. Bjorck, J.; Rappazzo, B.H.; Chen, D.; Bernstein, R.; Wrege, P.H.; Gomes, C.P. Automatic detection and compression for passive acoustic monitoring of the african forest elephant. In Proceedings of the AAAI Conference on Artificial Intelligence, Honolulu, HI, USA, 27 January–1 February 2019; Volume 33, pp. 476–484. [Google Scholar]
  25. Brito, T.; Pereira, A.I.; Lima, J.; Castro, J.P.; Valente, A. Optimal sensors positioning to detect forest fire ignitions. In Proceedings of the 9th International Conference on Operations Research and Enterprise Systems, Valletta, Malta, 22–24 February 2020; pp. 411–418. [Google Scholar]
  26. Azevedo, B.F.; Brito, T.; Lima, J.; Pereira, A.I. Optimum Sensors Allocation for a Forest Fires Monitoring System. Forests 2021, 12, 453. [Google Scholar] [CrossRef]
  27. Mois, G.; Folea, S.; Sanislav, T. Analysis of Three IoT-Based Wireless Sensors for Environmental Monitoring. IEEE Trans. Instrum. Meas. 2017, 66, 2056–2064. [Google Scholar] [CrossRef]
  28. Cui, F. Deployment and integration of smart sensors with IoT devices detecting fire disasters in huge forest environment. Comput. Commun. 2020, 150, 818–827. [Google Scholar] [CrossRef]
  29. Placidi, P.; Morbidelli, R.; Fortunati, D.; Papini, N.; Gobbi, F.; Scorzoni, A. Monitoring soil and ambient parameters in the iot precision agriculture scenario: An original modeling approach dedicated to low-cost soil water content sensors. Sensors 2021, 21, 5110. [Google Scholar] [CrossRef]
  30. Adu-Manu, K.S.; Adam, N.; Tapparello, C.; Ayatollahi, H.; Heinzelman, W. Energy-harvesting wireless sensor networks (EH-WSNs) A review. ACM Trans. Sens. Netw. (TOSN) 2018, 14, 1–50. [Google Scholar] [CrossRef]
  31. Cario, G.; Casavola, A.; Gjanci, P.; Lupia, M.; Petrioli, C.; Spaccini, D. Long lasting underwater wireless sensors network for water quality monitoring in fish farms. In Proceedings of the OCEANS 2017—Aberdeen, Aberdeen, UK, 19–22 June 2017; pp. 1–6. [Google Scholar] [CrossRef]
  32. Garaba, S.P.; Aitken, J.; Slat, B.; Dierssen, H.M.; Lebreton, L.; Zielinski, O.; Reisser, J. Sensing ocean plastics with an airborne hyperspectral shortwave infrared imager. Environ. Sci. Technol. 2018, 52, 11699–11707. [Google Scholar] [CrossRef] [PubMed]
  33. Kukkonen, M.; Maltamo, M.; Korhonen, L.; Packalen, P. Comparison of multispectral airborne laser scanning and stereo matching of aerial images as a single sensor solution to forest inventories by tree species. Remote Sens. Environ. 2019, 231, 111208. [Google Scholar] [CrossRef]
  34. Adão, T.; Hruška, J.; Pádua, L.; Bessa, J.; Peres, E.; Morais, R.; Sousa, J.J. Hyperspectral Imaging: A Review on UAV-Based Sensors, Data Processing and Applications for Agriculture and Forestry. Remote Sens. 2017, 9, 1110. [Google Scholar] [CrossRef] [Green Version]
  35. Pochwała, S.; Anweiler, S.; Deptuła, A.; Gardecki, A.; Lewandowski, P.; Przysiężniuk, D. Optimization of air pollution measurements with unmanned aerial vehicle low-cost sensor based on an inductive knowledge management method. Optim. Eng. 2021, 22, 1783–1805. [Google Scholar] [CrossRef]
  36. Gholizadeh, A.; Žižala, D.; Saberioon, M.; Borůvka, L. Soil organic carbon and texture retrieving and mapping using proximal, airborne and Sentinel-2 spectral imaging. Remote Sens. Environ. 2018, 218, 89–103. [Google Scholar] [CrossRef]
  37. Cao, Q.; Yu, G.; Sun, S.; Dou, Y.; Li, H.; Qiao, Z. Monitoring Water Quality of the Haihe River Based on Ground-Based Hyperspectral Remote Sensing. Water 2022, 14, 22. [Google Scholar] [CrossRef]
  38. Pettorelli, N.; Schulte to Bühne, H.; Tulloch, A.; Dubois, G.; Macinnis-Ng, C.; Queirós, A.M.; Keith, D.A.; Wegmann, M.; Schrodt, F.; Stellmes, M.; et al. Satellite remote sensing of ecosystem functions: Opportunities, challenges and way forward. Remote. Sens. Ecol. Conserv. 2018, 4, 71–93. [Google Scholar] [CrossRef]
  39. Fritz, S.; Fonte, C.C.; See, L. The role of citizen science in earth observation. Remote Sens. 2017, 9, 357. [Google Scholar] [CrossRef] [Green Version]
  40. Bioco, J.; Fazendeiro, P. Towards Forest Fire Prevention and Combat through Citizen Science. In Proceedings of the World Conference on Information Systems and Technologies, Galicia, Spain, 16–19 April 2019; Springer: Berlin/Heidelberg, Germany, 2019; pp. 904–915. [Google Scholar]
  41. Kirchhoff, C.; Callaghan, C.T.; Keith, D.A.; Indiarto, D.; Taseski, G.; Ooi, M.K.; Le Breton, T.D.; Mesaglio, T.; Kingsford, R.T.; Cornwell, W.K. Rapidly mapping fire effects on biodiversity at a large-scale using citizen science. Sci. Total Environ. 2021, 755, 142348. [Google Scholar] [CrossRef]
  42. Quinlivan, L.; Chapman, D.V.; Sullivan, T. Validating citizen science monitoring of ambient water quality for the United Nations sustainable development goals. Sci. Total Environ. 2020, 699, 134255. [Google Scholar] [CrossRef]
  43. Little, S.; Pavelsky, T.M.; Hossain, F.; Ghafoor, S.; Parkins, G.M.; Yelton, S.K.; Rodgers, M.; Yang, X.; Crétaux, J.F.; Hein, C.; et al. Monitoring variations in lake water storage with satellite imagery and citizen science. Water 2021, 13, 949. [Google Scholar] [CrossRef]
  44. Hirth, M.; Seufert, M.; Lange, S.; Meixner, M.; Tran-Gia, P. Performance Evaluation of Hybrid Crowdsensing and Fixed Sensor Systems for Event Detection in Urban Environments. Sensors 2021, 21, 5880. [Google Scholar] [CrossRef] [PubMed]
  45. Musen, M.A. The protégé project: A look back and a look forward. AI Matters 2015, 1, 4–12. [Google Scholar] [CrossRef] [PubMed]
  46. Stula, M.; Krstinic, D.; Seric, L. Intelligent forest fire monitoring system. Inf. Syst. Front. 2012, 14, 725–739. [Google Scholar] [CrossRef]
  47. Šerić, L.; Stipaničev, D.; Štula, M. Observer network and forest fire detection. Inf. Fusion 2011, 12, 160–175. [Google Scholar] [CrossRef]
  48. Bugarić, M.; Stipaničev, D.; Jakovčević, T. AdriaFirePropagator and AdriaFireRisk: User Friendly Web Based Wildfire Propagation and Wildfire Risk Prediction Software. Available online: http://hdl.handle.net/10316.2/445172018 (accessed on 20 November 2021).
  49. Seric, L.; Braovic, M.; Beovic, T.; Vidak, G. Metadata-Oriented Concept-Based Image Retrieval for Forest Fire Video Surveillance System. In Proceedings of the 2018 3rd International Conference on Smart and Sustainable Technologies (SpliTech), Split, Croatia, 26–29 June 2018; pp. 1–5. [Google Scholar]
Figure 1. Sampling method taxonomy.
Electronics 11 00275 g001
Figure 2. Taxonomy for sensor value types.
Electronics 11 00275 g002
Figure 3. Taxonomy for the functionality of observation systems.
Electronics 11 00275 g003
Figure 4. Graphical representation of ontology classes of the environmental observation ontology.
Electronics 11 00275 g004
Figure 5. Concepts of the conceptual framework embodied in the Intelligent Forest Fire Monitoring and Surveillance system.
Electronics 11 00275 g005
Figure 6. Environmental monitoring system displaying the status of various cameras.
Electronics 11 00275 g006
Figure 7. Forest fire surveillance interface displaying all relevant information about the fire event.
Electronics 11 00275 g007
Figure 8. The exchange of information between fire detection and fire propagation software.
Electronics 11 00275 g008
Figure 9. Intelligent forest fire monitoring and surveillance system archive search interface.
Electronics 11 00275 g009
Publisher’s Note: MDPI stays neutral with regard to jurisdictional claims in published maps and institutional affiliations.

