Article

Recognition of Bio-Structural Anisotropy by Polarization Resolved Imaging

1
Dipartimento di Scienze di Base e Applicate per l’Ingegneria, Sapienza Università di Roma, 00161 Roma, Italy
2
Dipartimento di Ingegneria dell’Informazione Elettronica e Telecomunicazioni, Sapienza Università di Roma, 00184 Roma, Italy
3
Fusion and Nuclear Safety Department, ENEA—Casaccia Research Center, 00123 Roma, Italy
*
Author to whom correspondence should be addressed.
Electronics 2022, 11(2), 255; https://doi.org/10.3390/electronics11020255
Submission received: 29 November 2021 / Revised: 4 January 2022 / Accepted: 11 January 2022 / Published: 13 January 2022
(This article belongs to the Special Issue Computational Electromagnetics for Industrial Applications)

Abstract

:
In this paper, we develop a simple technique to identify material texture from far, by using polarization-resolved imaging. Such a technique can be easily implemented into industrial environments, where fast and cheap sensors are required. The technique has been applied to both isotropic references (Teflon bar) and anisotropic samples (wood). By studying the radiance of the samples illuminated by linearly polarized light, different and specific behaviours are identified for both isotropic and anisotropic samples, in terms of multipolar emission and linear dichroism, from which fibre orientation can be resolved.

1. Introduction

Most natural matter is composite, heterogeneous, made up of different materials, present in several phases, and with properties and characteristics different from their bulk equivalents. A composite is presented as a set of micro and nanostructures assembled together: for example, the tissues of living beings, both animal and vegetable, are formed by cells, fibres, membranes, layers, i.e., they are not made up of homogeneous substances but by a set of small structures, aggregated together. Just think of the muscle or wood tissue, both made up of fibres connected together that make it resistant and elastic. Technology has taken an example from nature, engineering materials through the creation of composites in order to create new ones with properties not found in nature. For example, you can think about materials with glass or carbon fibres incorporated in resins or sheathed by adhesive plastic films, in order to create bulks or tissues that are both light and extremely resistant at the same time.
To visualize and characterize the micro- and nano-structuring of a composite, optical microscopy techniques are used, which can be both simple and advanced, such as fluorescence [1] or nonlinear [2]. Microscopy directly observes the individual fibres (even the etymology suggests a “vision at the micron scale”) and, through appropriate image processing, characterizes the order of structuring of the samples studied. The propagation of light in biological tissues [3,4] has always attracted a lot of attention due to the infinite implications that it can entail. For example, consider the possibility of recognizing diseases [5,6,7,8] or discriminating similar tissues [9,10]. To study anisotropic materials, the polarization of light is often used as a probe [4,5,6,7,8,9,10,11,12,13,14,15,16,17,18]: by using electromagnetic fields oscillating parallel or orthogonally to the dipoles of the material, it is also possible to obtain an anisotropic diffusion according to the microscopic alignment of the material. Thus, through the analysis of microscopic images taken using polarized light, it is possible to characterize the morphology of different materials [11,16,17].
By microellissometry [18], or through the study of Mueller matrices [19,20,21,22,23,24,25], it is possible to measure the state of polarization of the light and obtain information on the microscopic or nanoscopic order of the material. In fact, it has been widely documented that both the propagation of light in nanostructured materials [26,27,28,29] and the Lambertian-type emission from non-symmetrical nano-oscillators [30,31,32,33,34] maintain information on the orientation and order of the material.
However, optical microscopy requires time and specific preparation of the samples, which could result in handicaps in the industrial field where, otherwise, fast, economical techniques are required and that can work at great distances, even without special preparation of the samples.
The fourth industrial revolution we are experiencing, known as Industry 4.0, sees a propensity of today’s automation to insert new production procedures, aimed at improving working conditions, creating new business models but above all at increasing the yield of the plants by improving quality. of products. The evolution of industrial computer applications passes through the use of innovative vision and recognition techniques, such as machine learning and augmented reality. These require the support of new sensory techniques, that is, the use of innovative electromagnetic measuring instruments, capable of providing rapid and precise information remotely.
Thus, we asked ourselves whether it is possible to extract information from polarization-resolved images shot at a distance with a simple camera or a video camera, in order to discriminate and characterize the structuring of materials. For this purpose, we acquired and processed images with polarization parallel and orthogonal to that of illumination, highlighting how these are affected by the structuring of the material and its orientation in space. In fact, by studying the polar distribution of the emission in terms of multipolar contributions, up to the fourth order, it is possible to observe that isotropic materials as well as anisotropic ones, with specific spatial orientations, show different optical behaviours.
Multipole analysis of light emission and scattering [35,36,37] has been effectively used to study micro- and nanospheroid [38,39,40], acoustic scattering [41], or light scattered from single biological cells [42]. This is an alternative procedure to the representation of Mueller matrices [24,25], from which to immediately identify whether the material is isotropic or anisotropic and possibly also its spatial orientation.
The present work studies two different types of material: Teflon, as an isotropic reference, and wood, as an anisotropic material. Wood is a good material for optical investigations, being formed by micro- and nano-fibrils [43] oriented along a privileged direction; wood has already been studied by optical techniques in the past to identify structural changes induced by mechanical stresses [44].

2. Materials and Methods

The experimental setup is schematically shown in Figure 1. A sample is homogeneously illuminated from the orthogonal direction (azimuthal angle = 0, polar angle = π/2) by a collimated beam of linearly-polarized light, generated by a blue/violet LED.
The light color is chosen because the short wavelength (405 nm) gives higher sensitivity in resolving texture nano-orientations.
Using an achromatic zoom (180×), a CCD camera (whose response linearity has been previously verified) records the images of the sample at a great distance (about 2 m) and at different azimuthal viewing angles θview (variable from 10° to 70° with 10° steps, at fixed polar angle θpolar= π/2). At each viewing angle, the linear-polarization direction of the illumination is rotated all over 360° (in steps of 10°) and, for each orientation, two images are taken of the parallel and orthogonal polarised light respectively (with respect to the input one). As a reference, the 0° polarisation means TE on the sample (as well as 180° and 360°), while 90° means TM (as well as 270°).
From the digitalised images, the average radiance is calculated for each viewing angle over homogeneous areas of 200 × 200 pixels which correspond to roughly 2 mm2 on the samples (with a signal depth of 8 bits). This particular geometry (average on a fixed area of the image) was chosen to compensate for the angular dispersion of Lambertian emitters. The emissivity of a Lambertian emitter is maximum in the orthogonal direction (θpolar = π/2, θview = 0) and decreases moving away angularly from it, with a cosine type trend. To compensate for this dependence, fixed image areas have been selected which correspond to increasingly larger surfaces on the sample if θview is increased, with a 1/cosine trend. The reciprocal compensation leads to a “clean” observation of the emissivity, formally independent of the angle. Figure 2 shows the average emissivity of a Teflon surface (isotropic reference) illuminated with both TE (0°) and TM (90°) polarisations. As you can see, the reported signals are not affected by the typical Lambertian angular dependence.
In order to have a good comparison between isotropic and structured materials, an opaque white Teflon tablet and a wooden one were chosen respectively (Figure 3). The latter is made of pine wood, obtained from the xylem with a radial cut. In this way, fibres and fibrils constituting the wooden fabric are oriented parallel with respect to the surface. According to the geometry shown in Figure 1, the wood sample was positioned with either vertical (parallel to the polar direction) or horizontal fibres (i.e., in the equatorial plane). As a consequence, vertical fibres were parallel to the electric field for the TE polarization (0°), while horizontal fibres were orthogonal to the electric field for the TM polarization (90°).
The polarisation-dependent emissivity diagrams have been numerically processed in order to identify the origin of the signals and to discriminate those most sensitive to the texture orientation. More specifically, the polarization-dependent trends have been numerically processed by means of Fourier series fitting. For this purpose, the MatLab “Curve Fitting Tool” package was used. Among all the infinite terms, we have used the first four which correspond to the monopole (zero-order/constant term), dipole (first-order), quadrupole (second-order), and octupole (fourth-order) emitters. The third term has been fixed to zero during the fitting procedure because it has no physical meaning. The frequency of the Fourier series was fixed at 2π/360 = 0.01745 rad/°.

3. Results

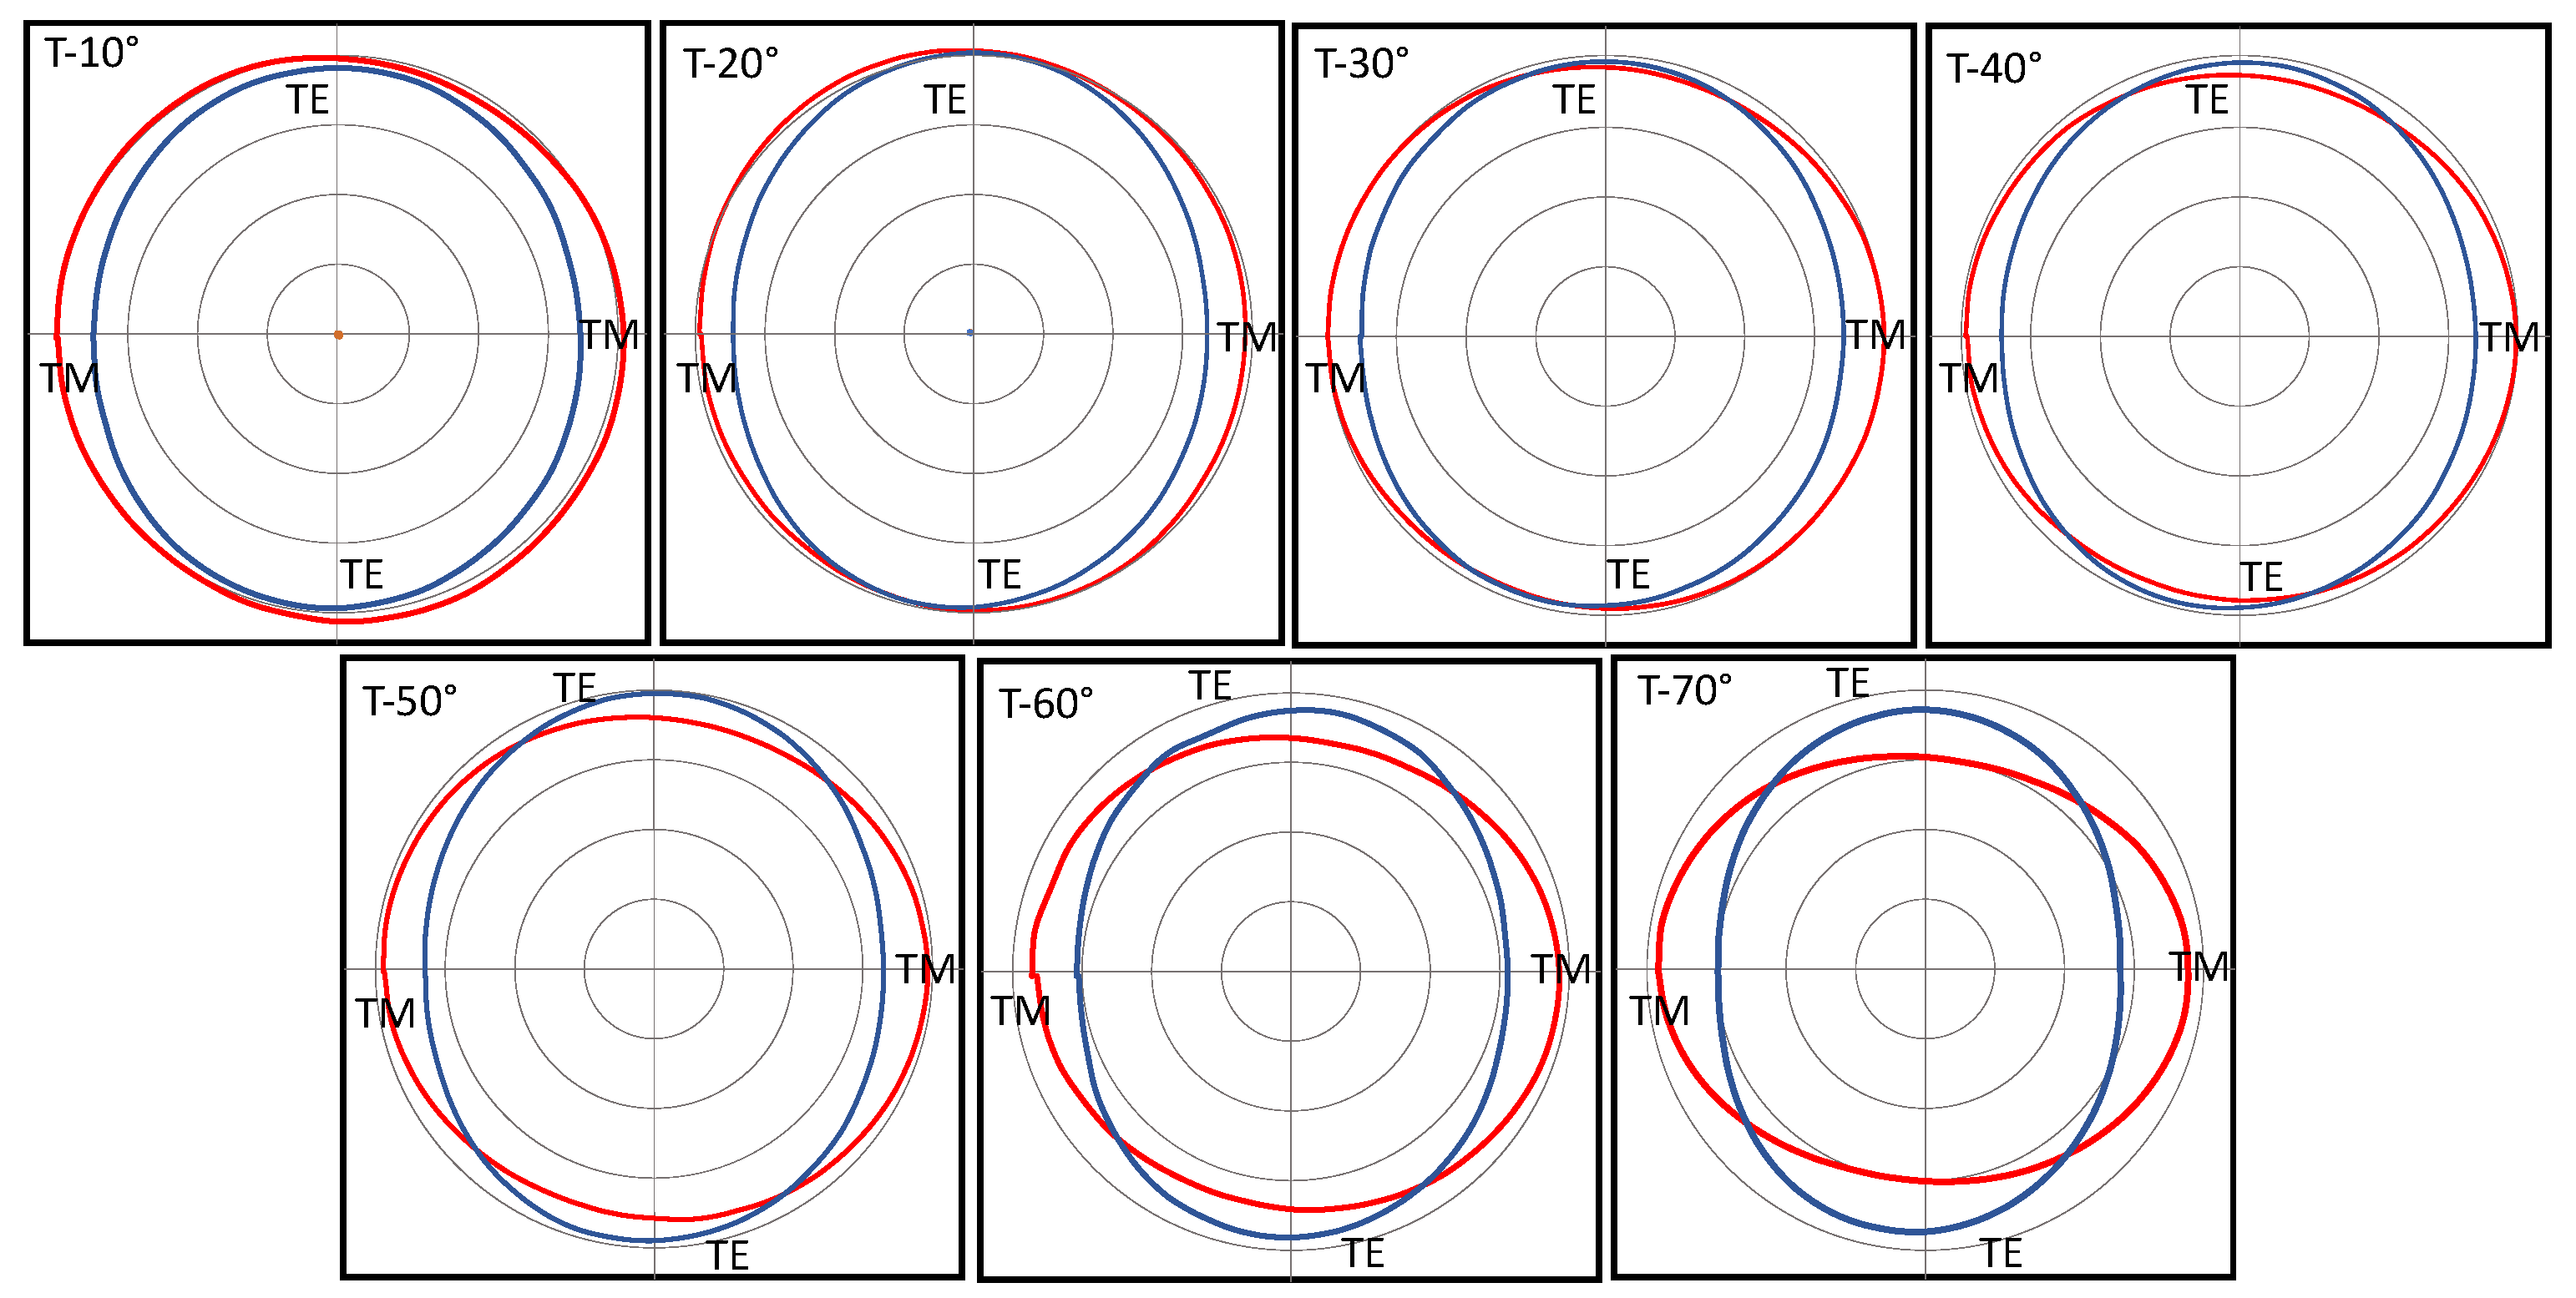
In Figure 4, the polar distributions of the radiance emitted by the Teflon sample are reported to vary the polarization plane of the lightning light. Each figure was recorded at a different angle of observation, ranging from 10° to 70°. The red curves in the figure describe the radiant intensity with polarization parallel to the illumination, while the blue ones represent the radiant intensity with orthogonal polarization. As you can see, towards the orthogonal observation (see 10°) the two curves tend to achieve similar circular shapes (which should coincide for observation at 0° where the TE and TM polarisations coincide). The orthogonal polarization (blue line) has a more flattened trend: this flattening increases with the angle. The red curve is also flattened more by increasing the angle but in the other direction. As you can be seen, although Teflon is an isotropic diffuser, the specific geometry maintains an anisotropic behaviour due to the different TE and TM emissivities, which depend on the emission angle too.
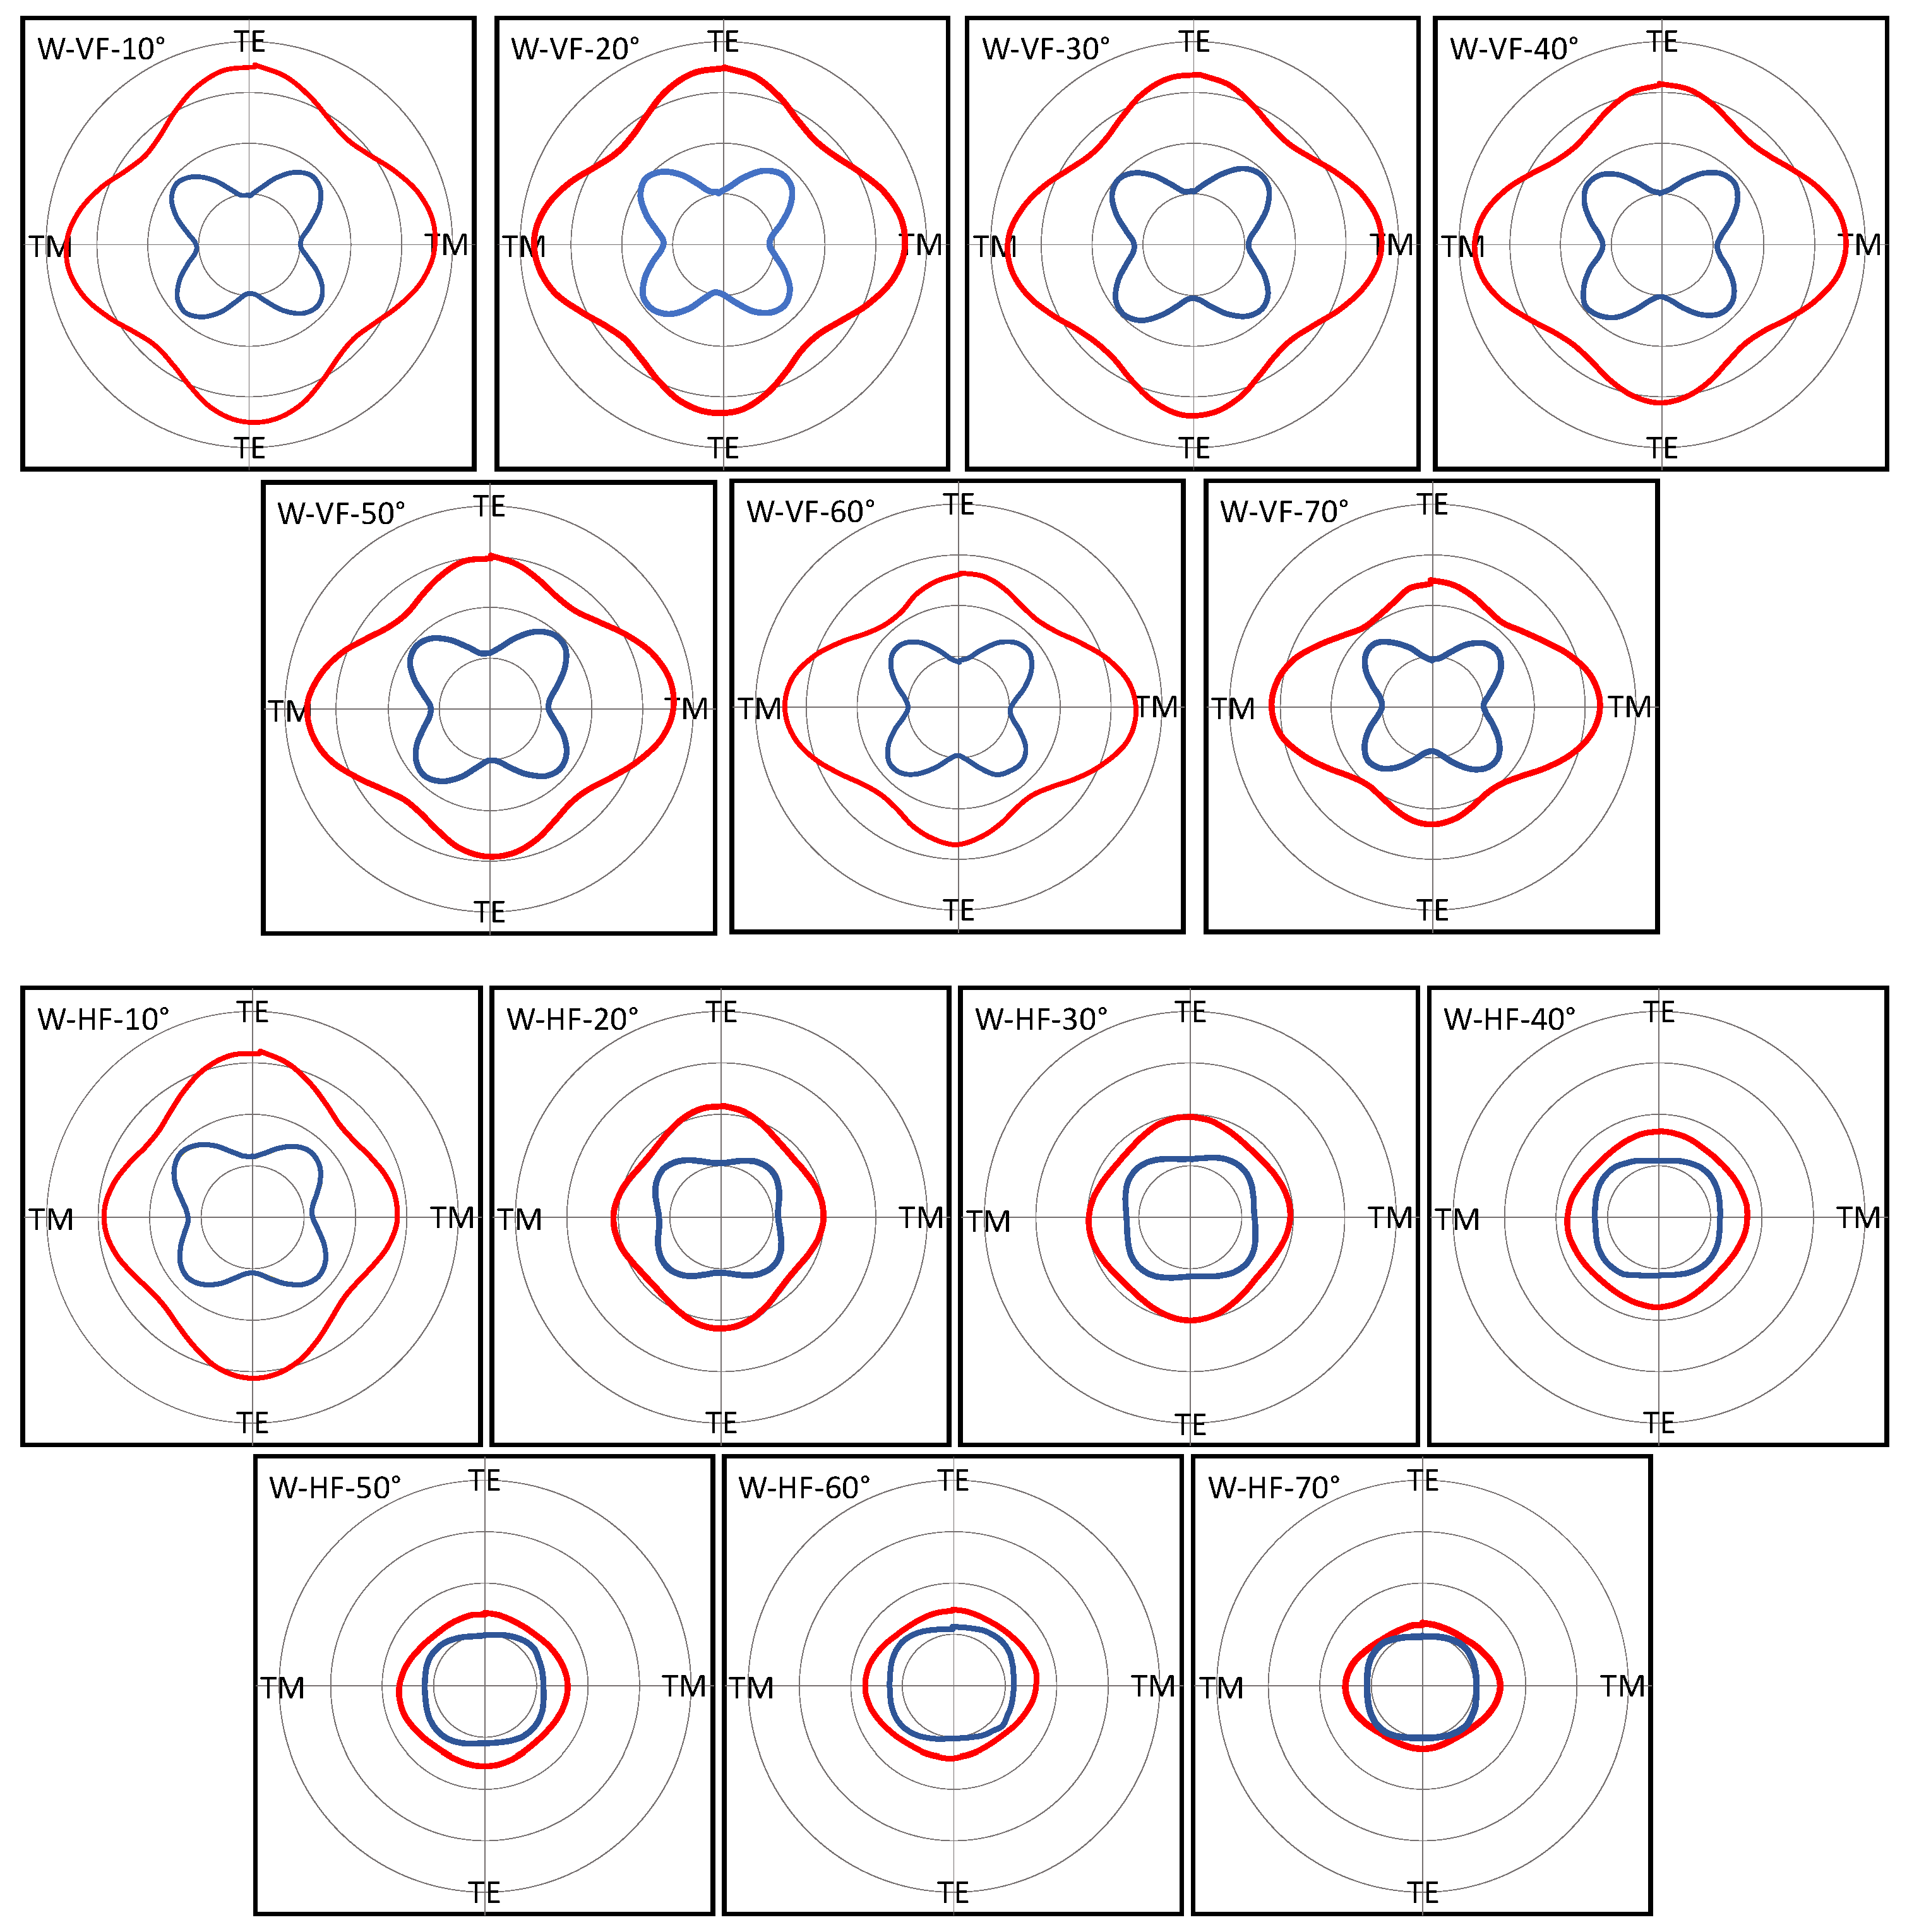
The equivalent radiance of the unisotropic wood samples is shown in Figure 5 for the two orientations of wood with vertical (W-VF) and horizontal (W-HF) fibres. One more time, W-VF means fibres parallel to the TE polarisation while W-HF means fibres parallel to the TM one.
In this case, the distributions of the parallel and orthogonal radiances are very different from each other and do not tend to assume the same distribution going towards the orthogonal observation.
The parallel radiance of the vertical fibres flattens increasing the viewing angle, similarly to that shown in Figure 4 for the isotropic diffuser. This means that the TE emission decreases with the viewing angle much more than the TM one. Instead, the polar distribution of the radiance from horizontal fibres changes significantly for both TE and TM polarisations: the whole emission efficiency becomes lower and lower as the angle increases, and the shape of the distribution also changes.
The polar distributions at the orthogonal polarisation suffer less the viewing angle: the emission from vertical fibres seems completely insensitive to the viewing angle, while for horizontal fibres the main differences appear at 45°-135°-225°-315°: the “flower” type emission is rapidly attenuated, tending to a “squared” distribution. Such variations clearly describe different weights of the multipolar emissive efficiencies. In order to discriminate each contribution, different Fourier elements of the angular distributions were calculated, corresponding to monopole, dipole, quadrupole and octupole emissions. In Figure 6 the normalized multipole contributions are reported. The values related to polarization parallel to the illumination are shown in red while the orthogonal ones are shown in blue.
The dominant contributions are due to monopole emission, as expectable. The Teflon emission is almost completely depolarized (both signals are close to 50%), with a very slight memory of the lightning polarization (red signals). Such memory is attenuated by increasing the viewing angle, towards a perfect depolarization by tending to 90°. This behaviour occurs because Teflon is a “soft” diffuser, and consequently the radiation penetrates inside it before coming out backward, maintaining information of the input. In wood, anisotropy is indeed more evident. The information of the initial polarization is maintained. Wood is certainly a stiffer diffuser than Teflon, where light penetration is very limited if not completely absent. For both fibre alignments, the depolarization of the monopole emission decreases by increasing the viewing angle but never disappears.
Dipole contributions for all three samples are very limited to a few percent, almost negligible.
Quadrupole contributions of Teflon are important and grow by increasing the viewing angle, up to almost 10% of the entire signal such phenomena are also present in the quadrupole emission of wood with vertical fibres only in the parallel polarization component; the orthogonal polarization component, on the other hand, is little affected (for about 1%) by the quadrupole emission. This insensitivity is also present for wood with horizontal fibres. In this case, however, the parallel polarization component exhibits an anomalous behaviour, with a minimum in correspondence of about 40° which can be attributed to Brewster-like loss of emissive efficiency.
The octupole contribution is null for the isotropic sample (Teflon) while in wood it shows high values. The vertical orientation of the fibres gives a contribution of octupole independent of the viewing angle while, for the horizontal orientation of the fibres, the emission efficiency of the octupole terms decreases as the angle of observation increases.
Monopole, quadrupole and octupole radiance contributions are indeed discriminating factors to recognize the orientation of the material texture. Monopole and quadrupole emissions are polarisation sensitive while octupole seems to be perfectly depolarised.

4. Discussion

Figure 6 shows which multipole emission contributions can recognise a structural anisotropy of surfaces. The most efficient emission is undoubtedly the monopole one, as expectable: the first element of a power expansion is always more effective than the following higher-order terms. The isotropic Teflon sample shows a monopole anisotropy quantifiable in a 6% difference between the signals emitted on the two polarisations. This effect is due to a different emissivity of a “soft” material, i.e., a surface that does not reflect specularly but whose incident radiation penetrates and suffers multiple scattering in the volume before being re-emitted backward. The phenomenon is well described by the Kubelka–Munk theory [45,46]. At larger viewing angles, the number of multi-scattering events strongly increases, inducing more efficient depolarisation.
Unlike the isotropic sample, wood shows a stronger monopole anisotropic radiance, quantifiable for a normal observation at about 50–60% of the total signal. Vertical fibres retain more information than horizontal fibres by means of a geometrical shadowing effect. As the observation angle varies, vertical fibres pack up in an increasingly dense manner, showing a stronger anisotropic emissivity (Figure 7).
Instead, the package shadowing does not affect the horizontal fibres, that remain equally spaced, without visibility alteration. This behaviour is well known and experimented with by everyone observing for example the grass of a stadium that appears striped depending on how it has been cut/combed.
Dipole contributions are extremely low (of the order of 1%), and therefore, negligible.
Instead, the quadrupole contributions are important and show different trends for the parallel and orthogonal radiative polarizations. Teflon shows very similar trends on both crossed polarizations. Different behaviours occur for wood, where the crossed emission (i.e., orthogonal to the lightning polarization) is always negligible, reaching a value between 1 and 2%. We do expect that higher polar emissivity is related to smaller textures.
Otherwise, the parallel polarization emission of vertical fibres becomes more and more efficient with the viewing angle. This would be the behaviour for both vertical and horizontal fibres, were it not for the fact that horizontal fibres show a Brewster-like emission quenching at about 30–40°.
Octupole terms are important to recognise wood texture but do not show any anisotropic behaviour.
The quadrupolar anisotropic behaviour can be highlighted by means of a linear dichroism LD factor, defined as the difference between the parallel and orthogonal radiances normalized to their sum:
L D = R R R + R
The LD trends are shown in Figure 8. Teflon dichroism (upper part of Figure 8) is indeed very small, lower than 10%: it has been magnified in order to resolve the slight modifications. A small viewing angles dichroism shows a dipolar trend; at higher angles the quadrupole contribution becomes more and more. This anisotropy is mainly geometric in nature, recognising TE and TM polarisation emissions.
Wood dichroism (lower part of Figure 8) is indeed more effective, arriving at values up to 0.6. LD’s deriving for vertical (solid line) and horizontal (dashed line) fibres are reported on the same graphs for comparison.
As you can see, the linear dichroism of vertical fibres is much more intense than that of horizontal fibres and remains high almost insensitive to the observation angle. On the other hand, the horizontal fibres are strongly affected by the Lambertian behaviour and dichroism tends to quench for viewing angles close to 90°. In both cases, vertical fibres and horizontal fibres, the shape of the dichroism is clearly linked to the quadrupole emission.

5. Conclusions

In conclusion, the performed work has shown that through polarization-resolved imaging it is possible to discriminate between isotropic and anisotropic materials, but also to recognise different texture orientations.
Different textures are discriminated monitoring monopole, quadrupole and octupole contributions to emissions. The discriminator par excellence of the material’s anisotropy is given by the octupole emission, zero for the isotropic reference and different from zero for anisotropic samples. Wood monopole and quadrupole contributions show different behaviours of the polarisation components. Quadrupole crossed radiance (with respect to the lightning polarisation) is always very low; instead, parallel radiance is higher and depends on the observation angle. Orthogonal fibres show a Brewster-like quenching of the quadrupole parallel emission at about 30–40° which is not present with vertical fibres and that can be effectively used as a fibre-orientation detector. We do expect that higher-order polar emissivity would depend on smaller and smaller material texture, but this point is at the moment under investigation.

Author Contributions

Conceptualization, E.F.; methodology, E.F.; software, M.A.; validation, E.F., S.B., M.N.; formal analysis, E.F.; investigation, S.B., M.N.; data curation, E.F.; writing, E.F., M.A., F.F.; writing; supervision, E.F., F.F. All authors have read and agreed to the published version of the manuscript.

Funding

Sapienza Università di Roma, Progetto Ateneo 2107623 Prot. RG120172B9D9AC5A. AMDG.

Data Availability Statement

The experimental data are available on specific request.

Conflicts of Interest

The authors declare no conflict of interest.

References

  1. Levitt, J.A.; Matthews, D.R.; Ameer-Beg, S.M.; Suhling, K. Fluorescence lifetime and polarization-resolved imaging in cell biology. Curr. Opin. Biotechnol. 2009, 20, 28–36. [Google Scholar] [CrossRef] [PubMed]
  2. Goto, A.; Otomo, K.; Nemoto, T. Real-Time Polarization-Resolved Imaging of Living Tissues Based on Two-Photon Excitation Spinning-Disk Confocal Microscopy. Front. Phys. 2019, 56, 7. [Google Scholar] [CrossRef]
  3. Wilson, B.C.; Adam, G. A Monte Carlo model for the absorption and flux distribution of light in tissue. Med. Phys. 1983, 10, 824–830. [Google Scholar] [CrossRef] [PubMed]
  4. Maitland, D.J.; Walsh, J.T. Quantitative Measurements of Linear Birefringence During Heating of Native Collagen. Lasers Surg. Med. 1997, 20, 310–318. [Google Scholar] [CrossRef]
  5. Jacques, S.L.; Lee, K. Polarized video imaging of skin. In Proceedings of the SPIE, San Jose, CA, USA, 1 July 1998; Volume 3245, pp. 356–362. [Google Scholar]
  6. Anastasiadou, M.; De Martino, A.; Clement, D.; Liege, F.; Laude-Boulesteix, B.; Quang, N.; Dreyfuss, J.; Huynh, B.; Schwartz, L.; Cohen, H. Polarimetric imaging for the diagnosis of cervical cancer. Phys. Stat. Sol. 2008, 5, 1423–1426. [Google Scholar] [CrossRef]
  7. Manhas, S.; Swami, M.S.; Patel, H.S.; Uppal, A.; Ghosh, N.; Gupta, P.K. Polarized diffuse reflectance measurements on cancerous and noncancerous tissues. J. Biophotonics 2009, 2, 581–587. [Google Scholar] [CrossRef]
  8. Cheong, W.; Prahl, S.A.; Welch, A.J. A review of the Optical Properties of Biological Tissues. IEEE J. Quant. Electr. 1990, 26, 2166–2185. [Google Scholar] [CrossRef] [Green Version]
  9. Arwin, H. Application of ellipsometry techniques to biological materials. Thin Solid Films 2011, 519, 2589–2592. [Google Scholar] [CrossRef]
  10. He, C.; He, H.; Chang, J.; Chen, B.; Ma, H.; Booth, M.J. Polarisation optics for biomedical and clinical applications: A review. Light Sci. Appl. 2021, 10, 194. [Google Scholar] [CrossRef]
  11. Sakai, S.; Nakagawa, N.; Yamanari, M.; Miyazawa, A.; Yasuno, Y.; Matsumoto, M. Relationship between dermal birefringence and the skin surface roughness of photoaged human skin. J. Biomed. Opt. 2009, 14, 044032. [Google Scholar] [CrossRef]
  12. Ghosh, N.; Vitkin, I.A. Tissue polarimetry: Concepts, challenges, applications and outlook. J. Biomed. Opt. 2011, 16, 110801. [Google Scholar] [CrossRef] [PubMed] [Green Version]
  13. Chin, L.; Yang, X.; McLaughlin, R.A.; Noble, P.B.; Sampson, D.D. En face parametric imaging of tissue birefringence using polarization-sensitive optical coherence tomography. J. Biomed. Opt. 2013, 18, 066005. [Google Scholar] [CrossRef] [PubMed]
  14. Tuchin, V.V. Polarized light interaction with tissues. J. Biomed. Opt. 2016, 21, 071114. [Google Scholar] [CrossRef] [PubMed] [Green Version]
  15. Kienle, A.; Forster, F.K.; Hibst, R. Anisotropy of light propagation in biological tissue. Opt. Lett. 2004, 29, 2617–2619. [Google Scholar] [CrossRef] [PubMed]
  16. Wallenburg, M.A.; Wood, M.F.G.; Ghosh, N.; Vitkin, I.A. Polarimetry-based method to extract geometry-independent metrics of tissue anisotropy. Opt. Lett. 2010, 35, 2570–2572. [Google Scholar] [CrossRef]
  17. Laurent, C.; Ahmed, S.; Boardman, R.; Cook, R.; Dyke, G.; Palmer, C.; Schneider, P.; De Kat, R. Imaging techniques for observing laminar geometry in the feather shaft cortex. J. Microsc. 2020, 277, 154–159. [Google Scholar] [CrossRef]
  18. Cohn, R.F.; Wagner, J.W.; Kruger, J. Dynamic imaging microellipsometry: Theory, system design, and feasibility demonstration. Appl. Opt. 1988, 27, 4664–4671. [Google Scholar] [CrossRef]
  19. He, H.; Zeng, N.; Li, D.; Liao, R.; Ma, H. Quantitative Mueller matrix polarimetry techniques for biological tissues. J. Innov. Opt. Health Sci. 2012, 5, 1250017. [Google Scholar] [CrossRef]
  20. Ghosh, N.; Wood, M.F.G.; Vitkin, I.A. Mueller matrix decomposition for extraction of individual polarization parameters from complex turbid media exhibiting multiple scattering, optical activity and linear birefringence. J. Biomed. Opt. 2008, 13, 044036. [Google Scholar] [CrossRef]
  21. Guo, X.; Wood, M.F.G.; Vitkin, I.A. Angular measurements of light scattered by turbid chiral media using linear Stokes polarimeter. J. Biomed. Opt. 2006, 11, 041105. [Google Scholar] [CrossRef]
  22. Spandana, K.U.; Mahato, K.K.; Nirmal, M. Polarization-resolved Stokes-Mueller imaging: A review of technology and applications. Lasers Med. Sci. 2019, 34, 1283–1293. [Google Scholar]
  23. Ghosh, N.; Wood, M.F.G.; Vitkin, I.A. Polarimetry in turbid, birefringent, optically active media: A Monte Carlo study of Mueller matrix decomposition in the backscattering geometry. J. Appl. Phys. 2009, 105, 102023. [Google Scholar] [CrossRef]
  24. Batool, S.; Nisar, M.; Mangini, F.; Frezza, F.; Fazio, E. Polarization Imaging for Identifying the Microscopical Orientation of Biological Structures. In Proceedings of the URSI GASS 2020 Conference, Rome, Italy, 29 August–5 September 2020. [Google Scholar]
  25. Batool, S.; Nisar, M.; Mangini, F.; Frezza, F.; Fazio, E. To study the Mueller matrix polarimetry for the characterization of wood and Teflon flat samples. Results Opt. 2021, 4, 100102. [Google Scholar] [CrossRef]
  26. Van Tiggelen, B.A.; Maynard, R.; Heiderich, A. Anisotropic Light Diffusion in Oriented Nematic Liquid Crystals. Phys. Rev. Lett. 1996, 77, 639–642. [Google Scholar] [CrossRef] [PubMed]
  27. Johnson, P.M.; Bret, B.P.J.; Rivas, J.G.; Kelly, J.J.; Lagendijk, A. Anisotropic Diffusion of Light in a Strongly Scattering Material. Phys. Rev. Lett. 2002, 89, 243901. [Google Scholar] [CrossRef] [PubMed] [Green Version]
  28. Johnson, P.M.; Faez, S.; Lagendijk, A. Full characterization of anisotropic diffuse light. Opt. Expr. 2008, 16, 7435–7446. [Google Scholar] [CrossRef]
  29. Alerstam, E.; Svensson, T. Observation of anisotropic diffusion of light in compacted granular porous materials. Phys. Rev. E 2012, 85, 040301. [Google Scholar] [CrossRef] [PubMed] [Green Version]
  30. Grzela, G. Directional Light Emission and Absorption by Semiconductor Nanowires. Ph.D. Thesis, Technische Universiteit Eindhoven, Eindhoven, The Netherlands, 2013. [Google Scholar]
  31. Lorente, A.; Boersma, K.F.; Stammes, P.; Tilstra, L.G.; Richter, A.; Yu, H.; Kharbouche, S.; Muller, J.P. The importance of surface reflectance anisotropy for cloud and NO2 retrievals from GOME-2 and OMI. Atmos. Meas. Tech. 2018, 11, 4509–4529. [Google Scholar] [CrossRef] [Green Version]
  32. VanRie, J.; Schütz, C.; Gencȩr, A.; Lombardo, S.; Gasser, U.; Kumar, S.; Salazar-Alvarez, G.; Kang, K.; Thielemans, W. Anisotropic Diffusion and Phase Behavior of Cellulose Nanocrystal Suspensions. Langmuir 2019, 35, 2289–2302. [Google Scholar] [CrossRef] [PubMed]
  33. Gallinelli, T.; Barbet, A.; Druon, F.; Balembois, F.; Georges, P.; Billeton, T.; Chenais, S.; Forget, S. Enhancing brightness of Lambertian light sources with luminescent concentrators: The light extraction issue. Opt. Express 2019, 27, 11830–11843. [Google Scholar] [CrossRef]
  34. Chen, J.; Bhattarai, R.; Cu, J.; Shen, X.; Hoang, T. Anisotropic optical properties of single Si2Te3 nanoplates. Sci. Rep. 2020, 10, 19205. [Google Scholar] [CrossRef]
  35. Poutrina, E.; Urbas, A. Multipole analysis of unidirectional light scattering from plasmonic dimers. J. Opt. 2014, 16, 114005. [Google Scholar] [CrossRef]
  36. Alaee, R.; Rockstuhl, C.; Fernandez-Corbaton, I. An electromagnetic multipole expansion beyond the long-wavelength approximation. Opt. Commun. 2018, 407, 17–21. [Google Scholar] [CrossRef] [Green Version]
  37. Evlyukhin, A.B.; Chichkov, B.N. Multipole decompositions for directional light scattering. Phys. Rev. B 2019, 100, 125415. [Google Scholar] [CrossRef]
  38. Chu, L.; Wang, S. Multipole expansion of the scattering of light from a metal microspheroid. J. Opt. Soc. Am. B 1985, 2, 950–955. [Google Scholar] [CrossRef]
  39. Evlyukhin, A.B.; Reinhardt, C.; Chichkov, B.N. Multipole light scattering by nonspherical nanoparticles in the discrete dipole approximation. Phys. Rev. B 2011, 23, 235429. [Google Scholar] [CrossRef]
  40. Evlyukhin, A.B.; Reinhardt, C.; Evlyukhin, E.; Chichkov, B.N. Multipole analysis of light scattering by arbitrary-shaped nanoparticles on a plane surface. J. Opt. Soc. Am. B 2013, 30, 2589–2598. [Google Scholar] [CrossRef]
  41. Imhof, M.G. Multiple multipole expansions for acoustic scattering. J. Acoust. Soc. Am. 1995, 97, 754. [Google Scholar] [CrossRef]
  42. Videen, G.; Ngo, D. Light scattering multipole solution for a cell. J. Biomed. Opt. 1998, 3, 212–220. [Google Scholar] [CrossRef]
  43. Melelli, A.; Jamme, F.; Legland, D.; Beaugrand, J.; Bourmaud, A. Microfibril angle of elementary flax fibres investigated with polarised second harmonic generation microscopy. Ind. Crops Prod. 2020, 156, 112847. [Google Scholar] [CrossRef]
  44. Niskanen, I.; Räty, J.; Soetedjo, H.; Hibino, K.; Oohashi, H.; Heikkilä, R.; Matsuda, K.; Otani, Y. Measurement of the degree of polarisation of thermally modified Scots pine using a Stokes imaging polarimeter. Opt. Rev. 2020, 27, 178–182. [Google Scholar] [CrossRef] [Green Version]
  45. Kubelka, P.; Munk, F. Ein Beitrag zur Optik der Farbanstriche. Z. Tech. Phys. 1931, 12, 593–601. [Google Scholar]
  46. Sandoval, C.; Kim, A.D. Generalized Kubelka-Munk approximation for multiple scattering of polarized light. J. Opt. Soc. Am. A 2017, 34, 153–160. [Google Scholar] [CrossRef] [PubMed] [Green Version]
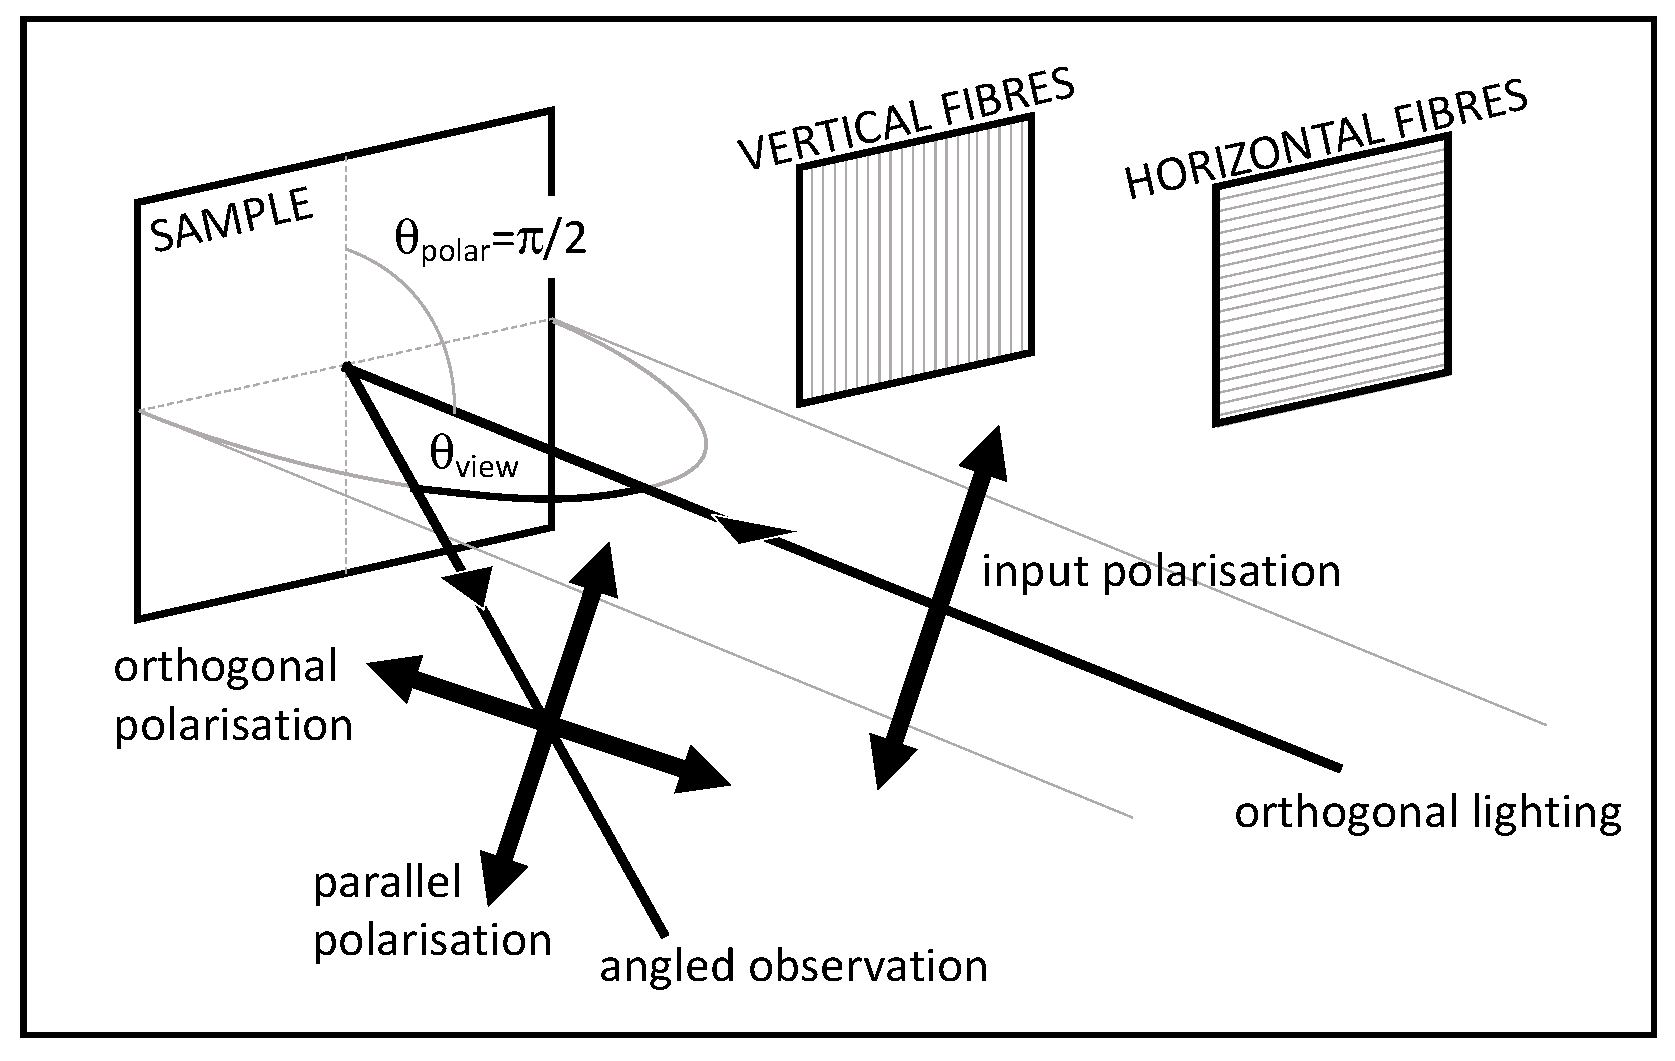
Figure 1. Experimental geometry. A sample is orthogonally illuminated by incoherent linearly-polarized light. A camera records images of the sample surface at different azimuthal angles θview, performing a selection of the observed light polarizations, both parallel and orthogonal to the input one.
Electronics 11 00255 g001
Figure 2. Observed average intensity of the Teflon radiance illuminating with TE (0°) or TM polarizations (90°).
Electronics 11 00255 g002
Figure 3. Wood and Teflon samples. The wood one shows the micro-structure of macroscopic fibres.
Electronics 11 00255 g003
Figure 4. Polar distributions of Teflon radiances for polarizations parallel (red) and orthogonal (blue) to the input one. Images report the measured radiances varying the observation azimuthal angle θview.
Electronics 11 00255 g004
Figure 5. Polar distributions of wood radiances for polarizations parallel (red) and orthogonal (blue) to the input one. Images report the measured radiances varying the observation azimuthal angle θview. Top images refer to wood with vertical fibres (W-VF); bottom images refer to wood with horizontal fibres (W-HF).
Electronics 11 00255 g005
Figure 6. Multi-pole analysis of the obtained polar signals shown in Figure 4 and Figure 5.
Electronics 11 00255 g006
Figure 7. Wood observations at different azimuthal angles θview are influenced by the fibre orientation.
Electronics 11 00255 g007
Figure 8. Polar representation of linear dichroism as the azimuth angle of observation varies, both for the Teflon samples (8 upper panels) and for those of wood (8 lower panels). The wood representations report both the experimental results for vertically (solid line) and horizontally (dashed line) oriented fibres.
Electronics 11 00255 g008
Publisher’s Note: MDPI stays neutral with regard to jurisdictional claims in published maps and institutional affiliations.