
Intelligent Replica Selection in Edge and IoT Environments Using Artificial Neural Networks


Abstract
1. Introduction
1.1. Motivation
1.2. Contributions
2. Related Work
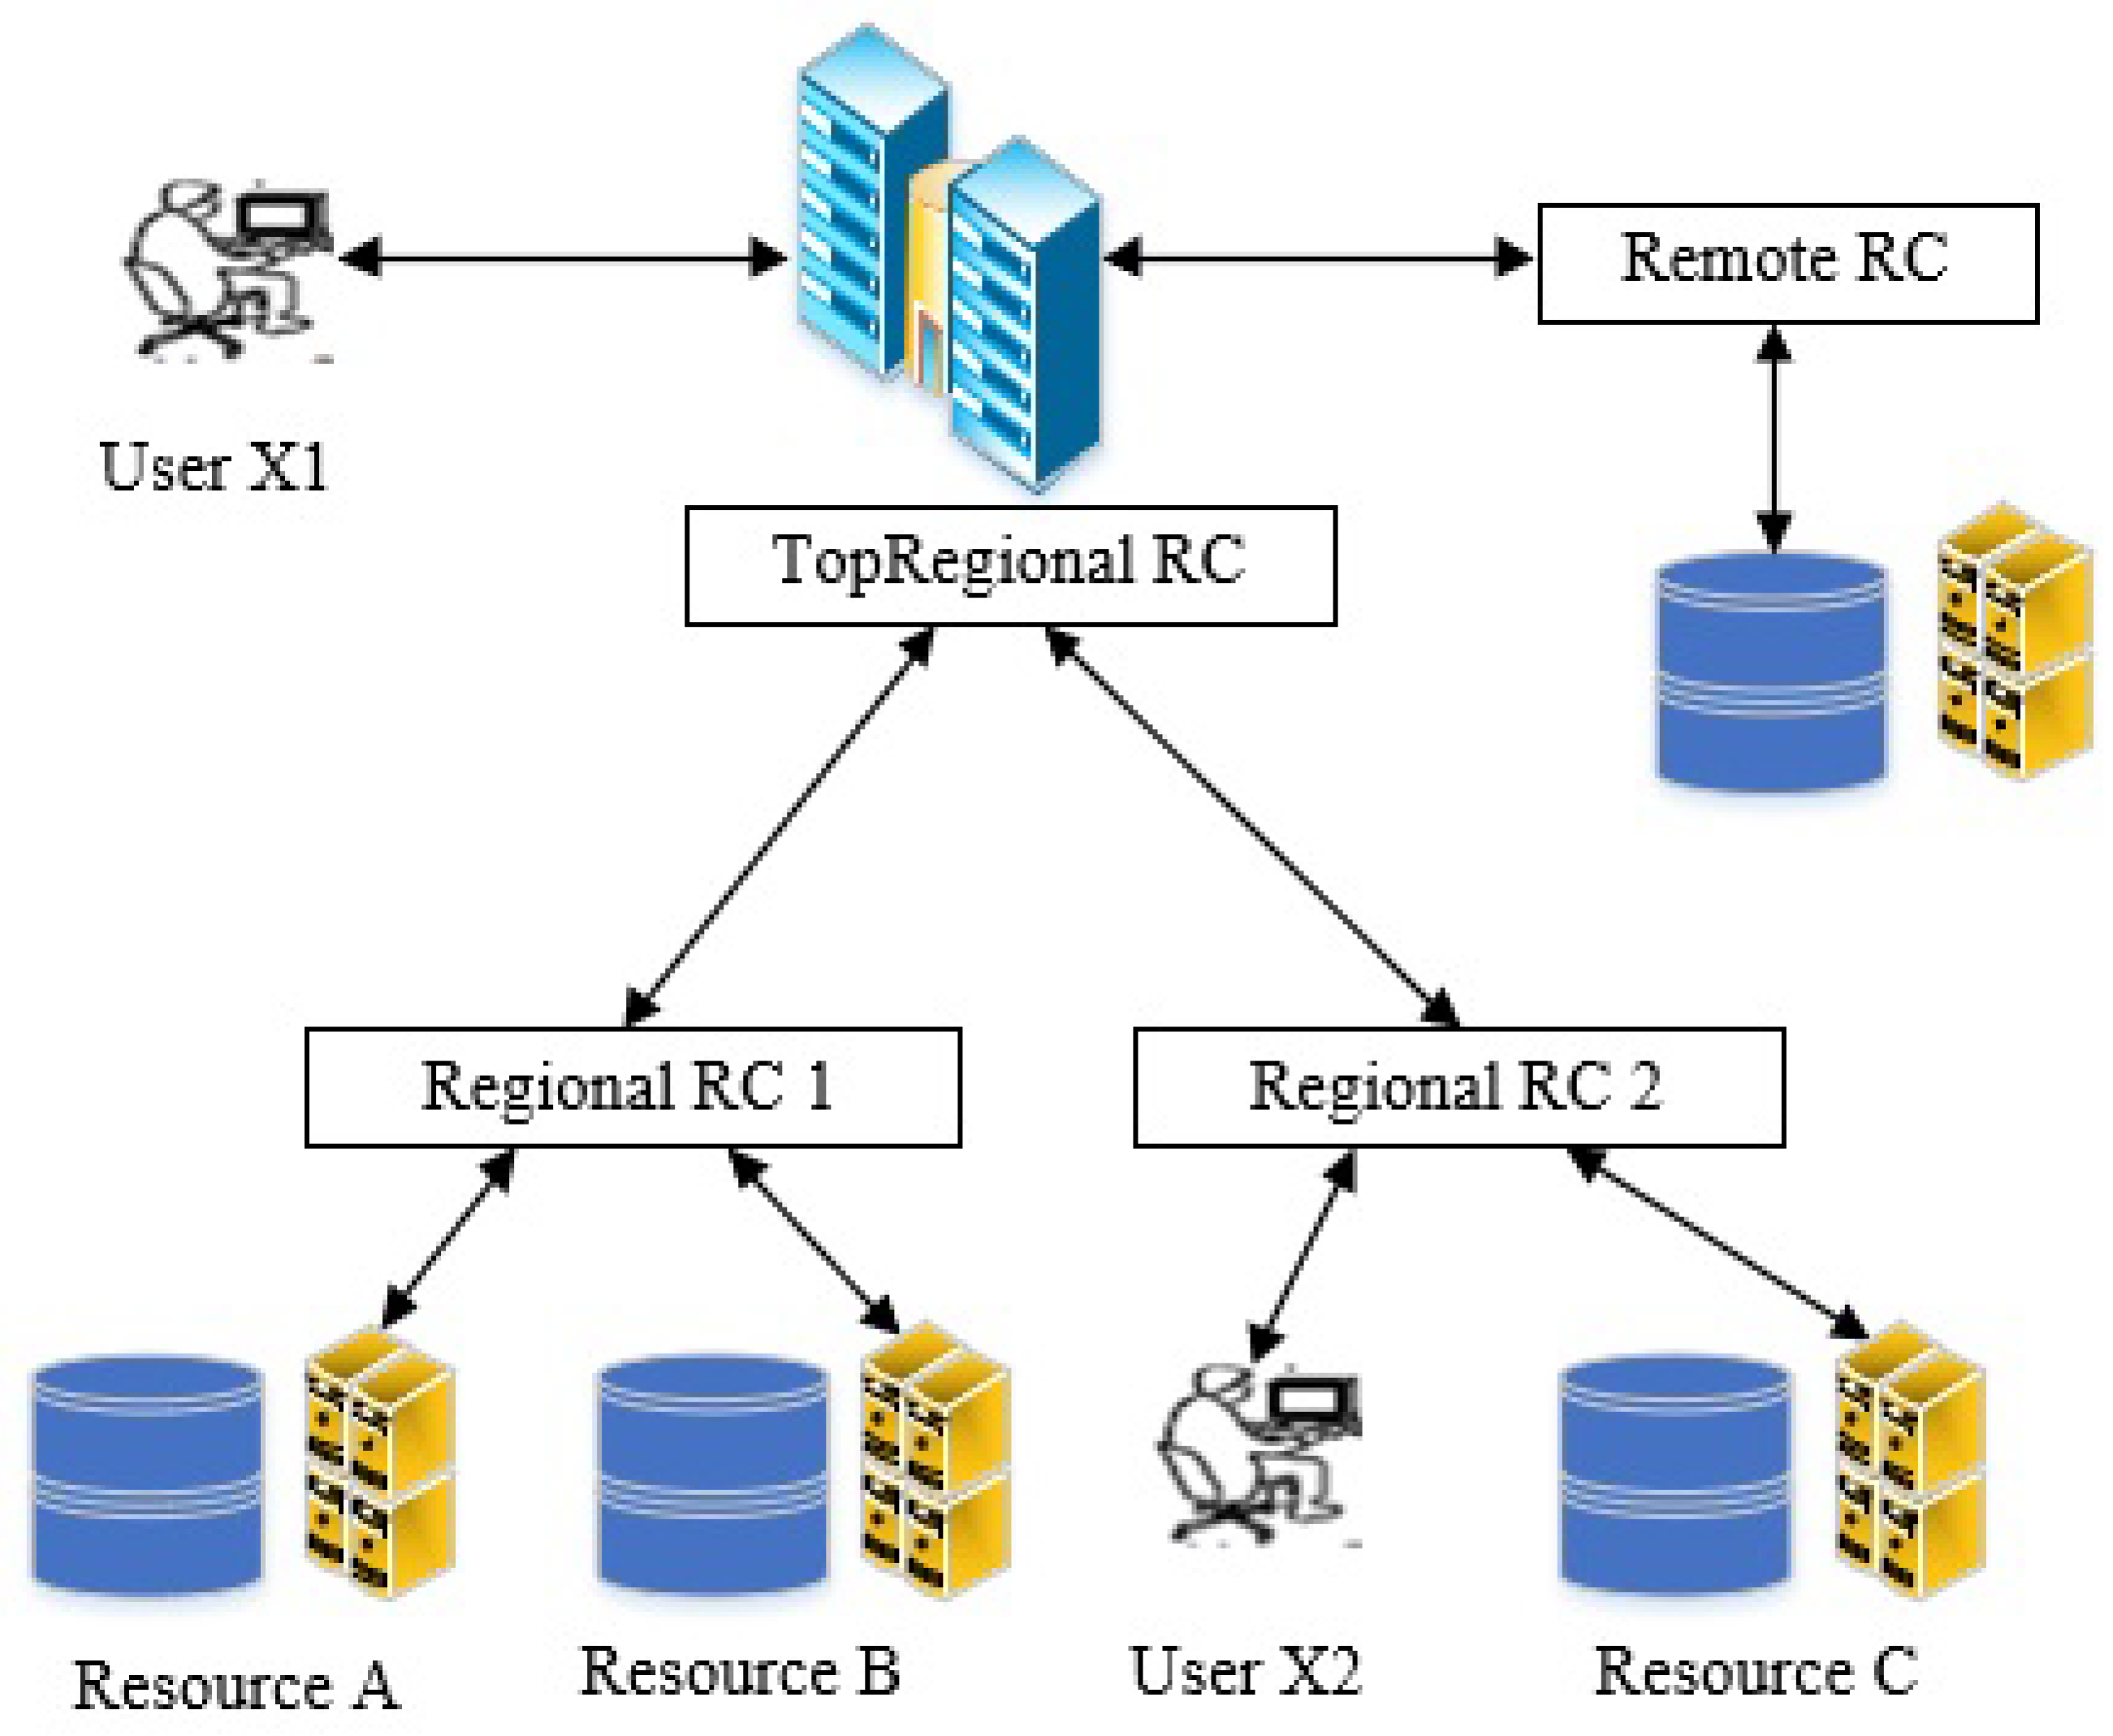
3. Reference Models
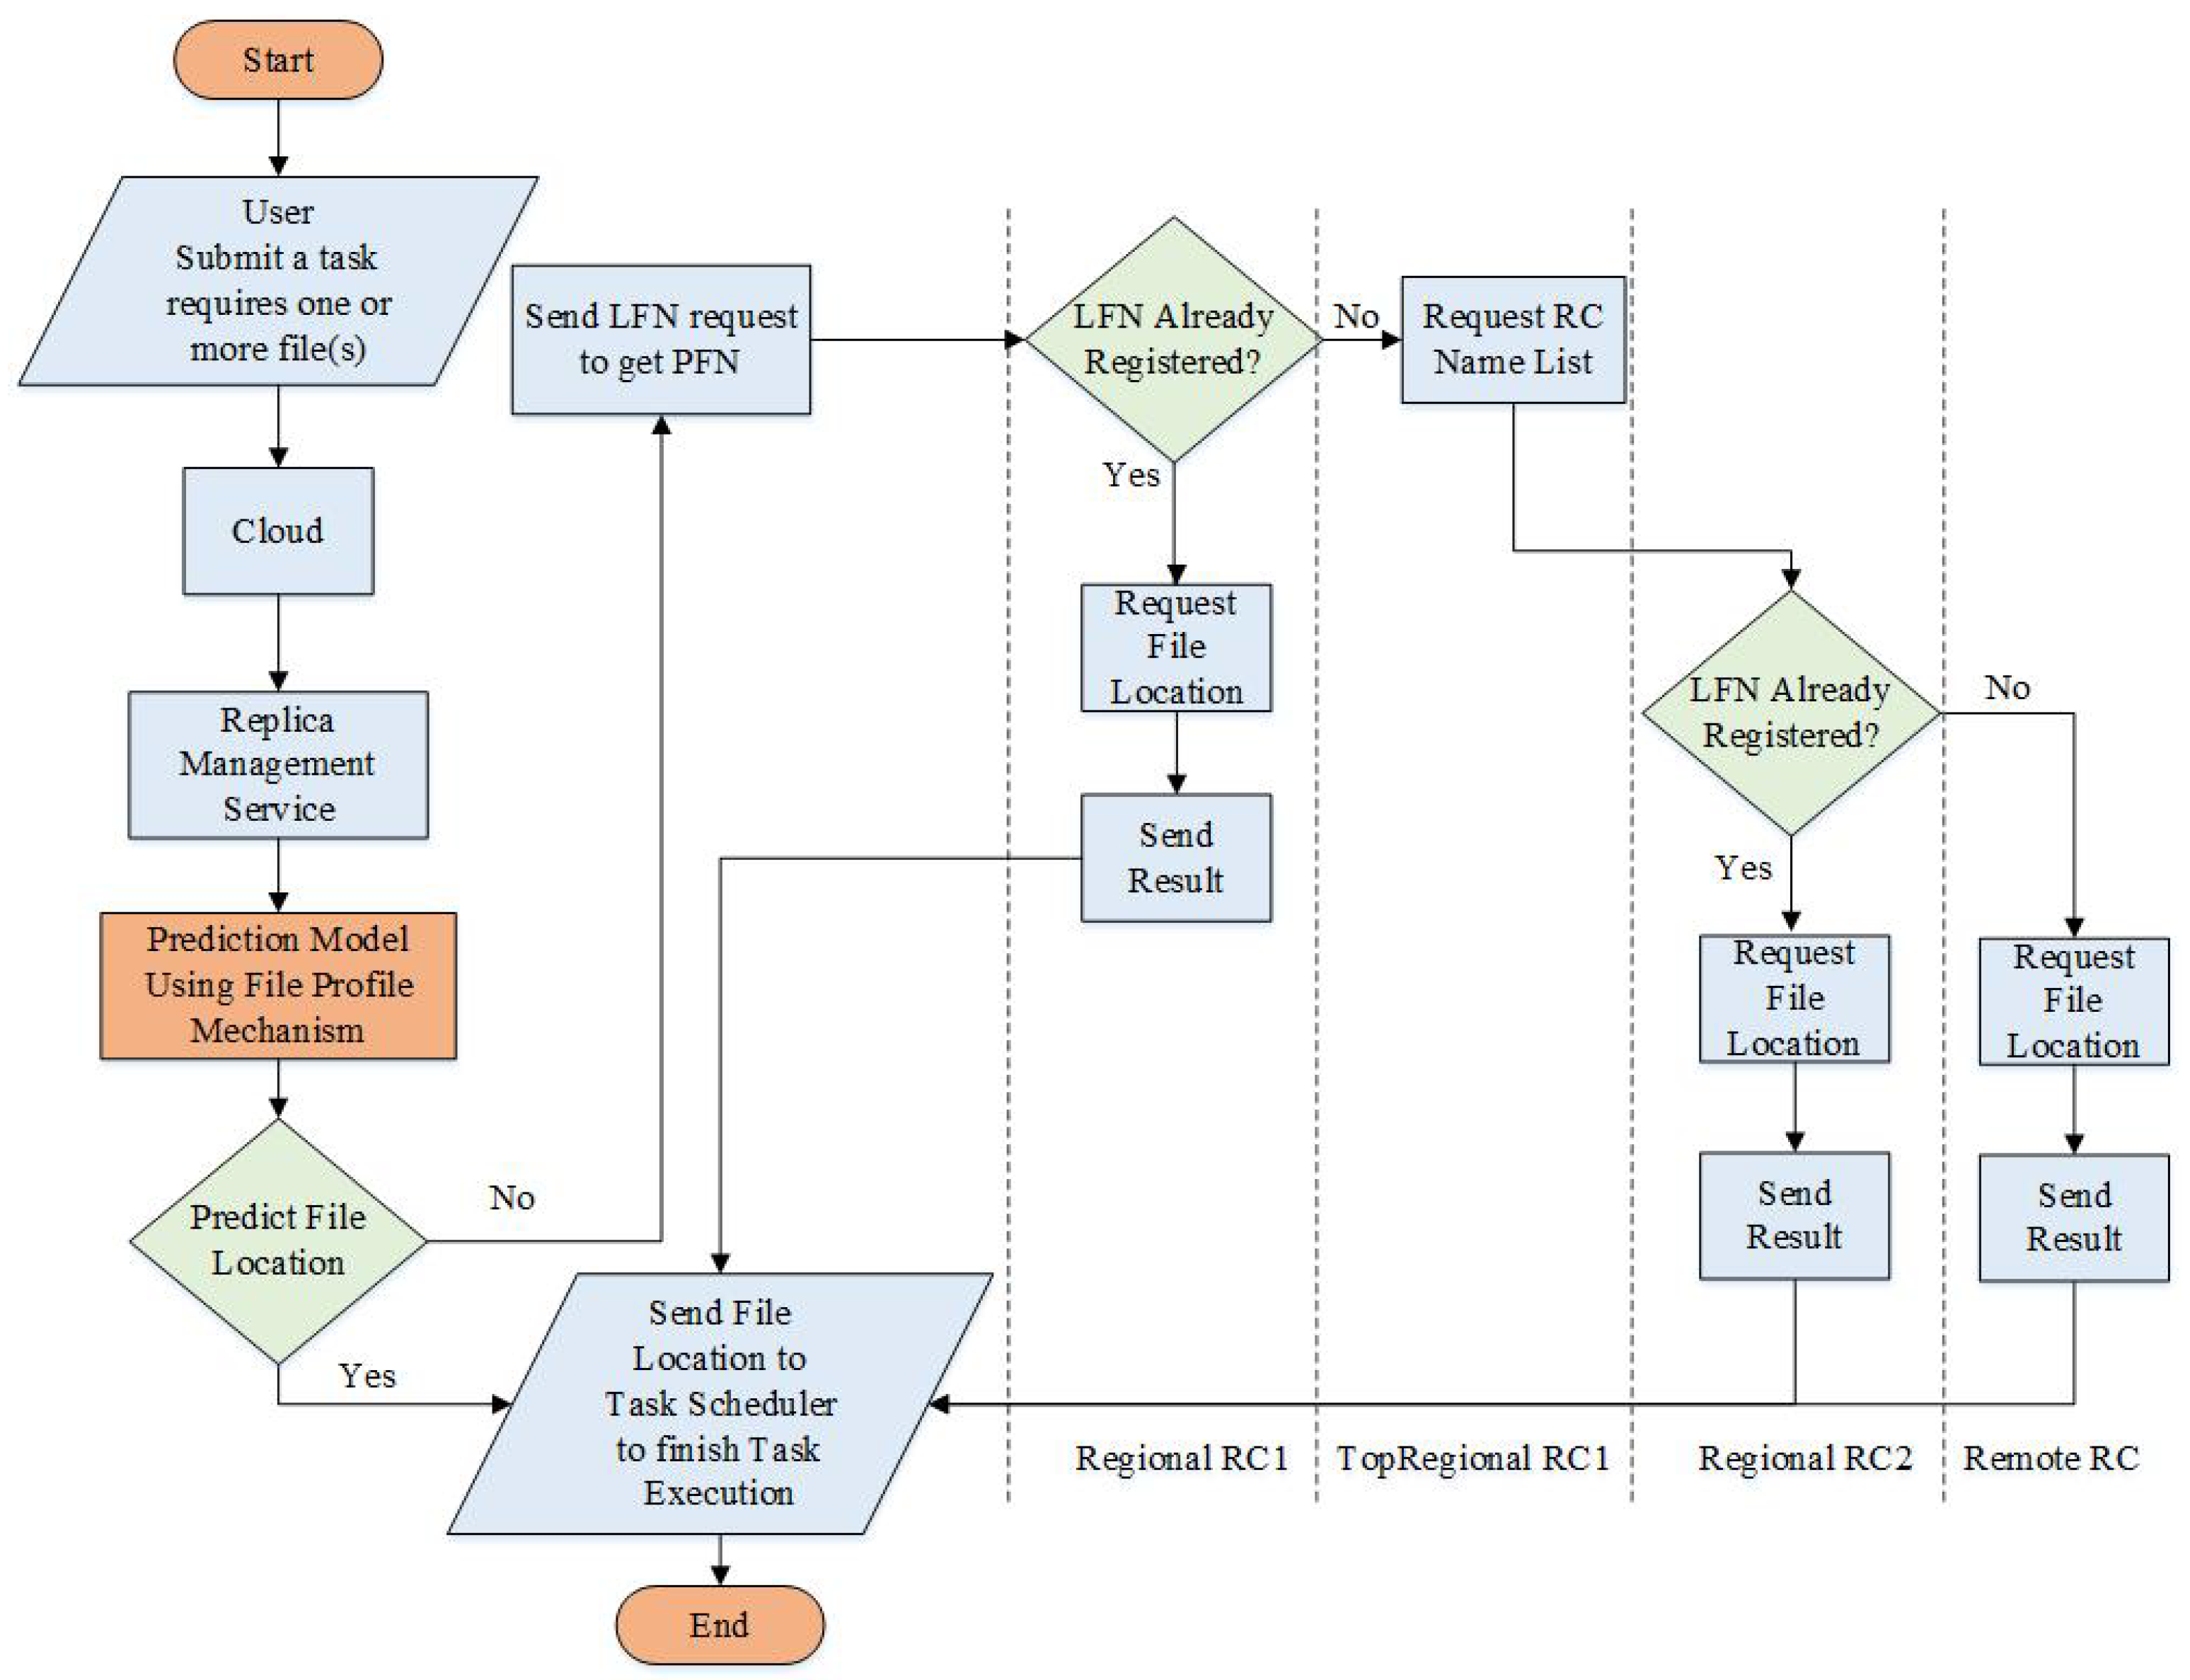
3.1. Reference I: Replica Management System without Prediction
3.2. Reference II: Replica Management System with Prediction
- There will be multiple users spread over different remote sites.
- These users will submit a number of tasks (jobs).
- These tasks (jobs) can require one or more files.
- The files can be located in local or remote resources.
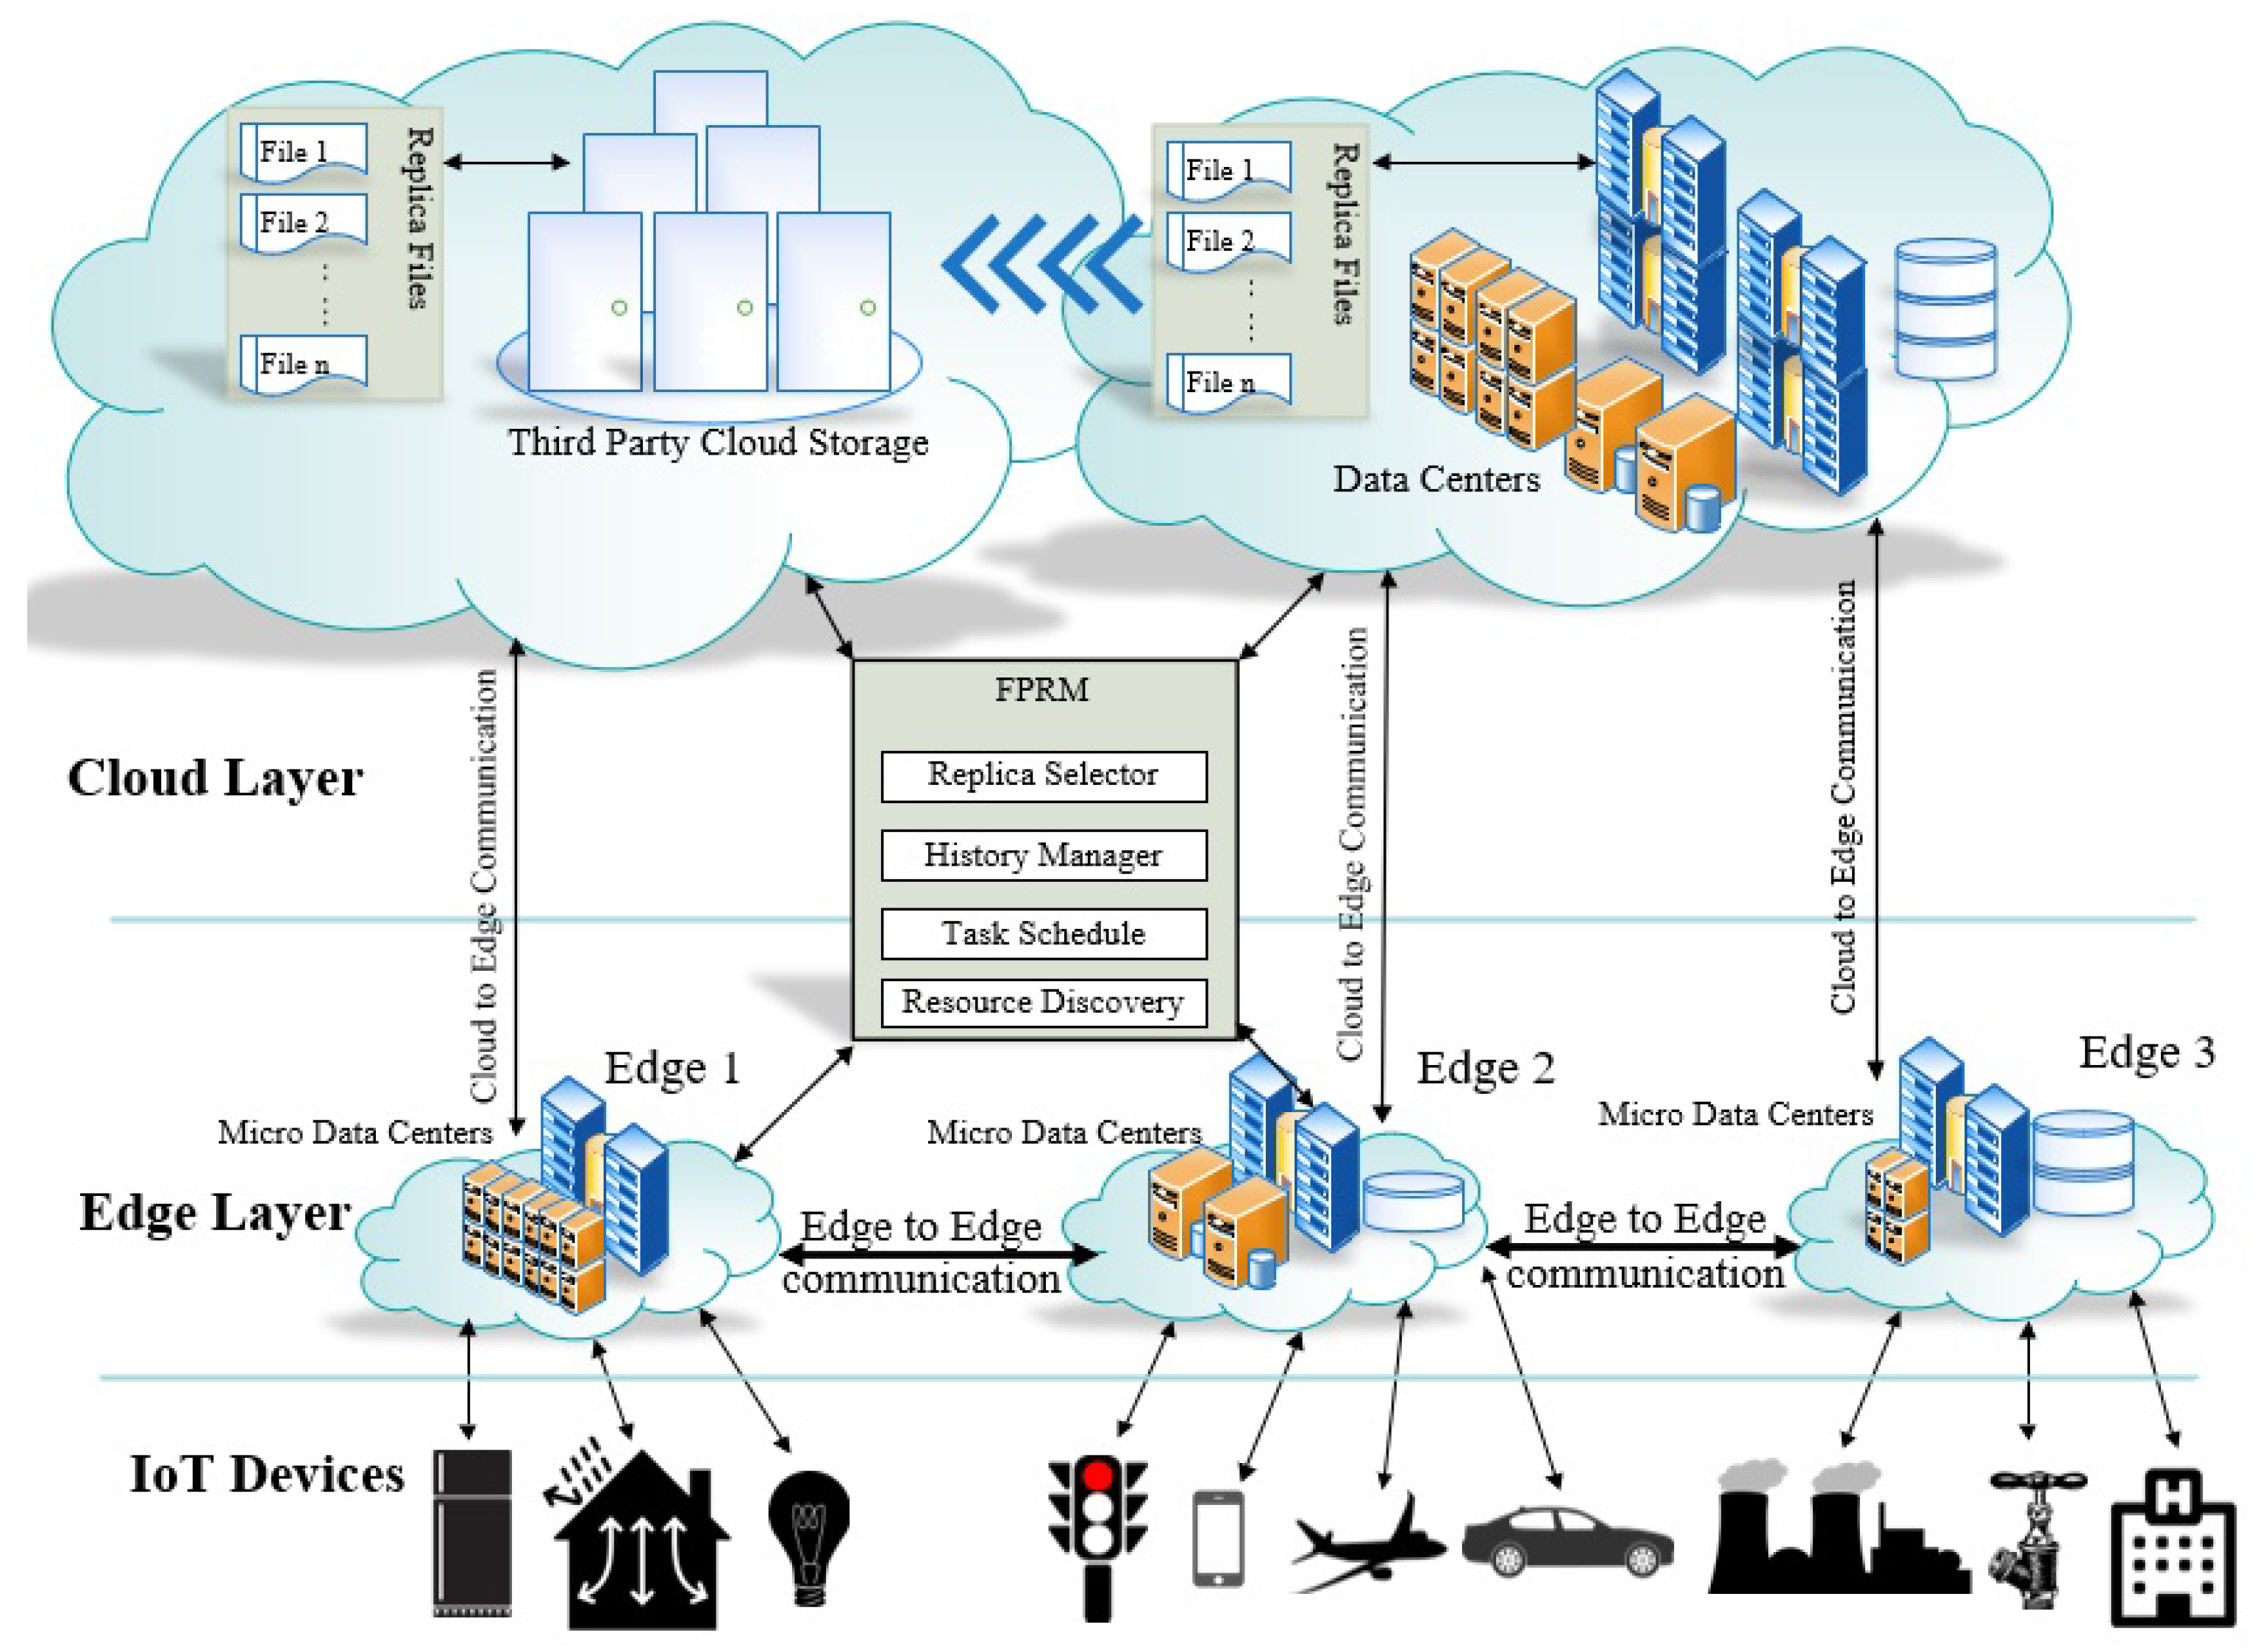
4. FPRM Proposed Model
4.1. AI Technologies
4.1.1. The Neural Networks
4.1.2. The Neural Network Tool justNN
- Data Gathering: acquisition and pre-processing of training data.
- Data Preparation: preparing the data for the neural network to transform data into a form the network can use.
- Network Creation: this involves network architecture, i.e., multi-layer perception.
- Network Training: this involves training the network with the relevant collected data.
- Network Testing: testing the network with unseen data derived from real simulation code.
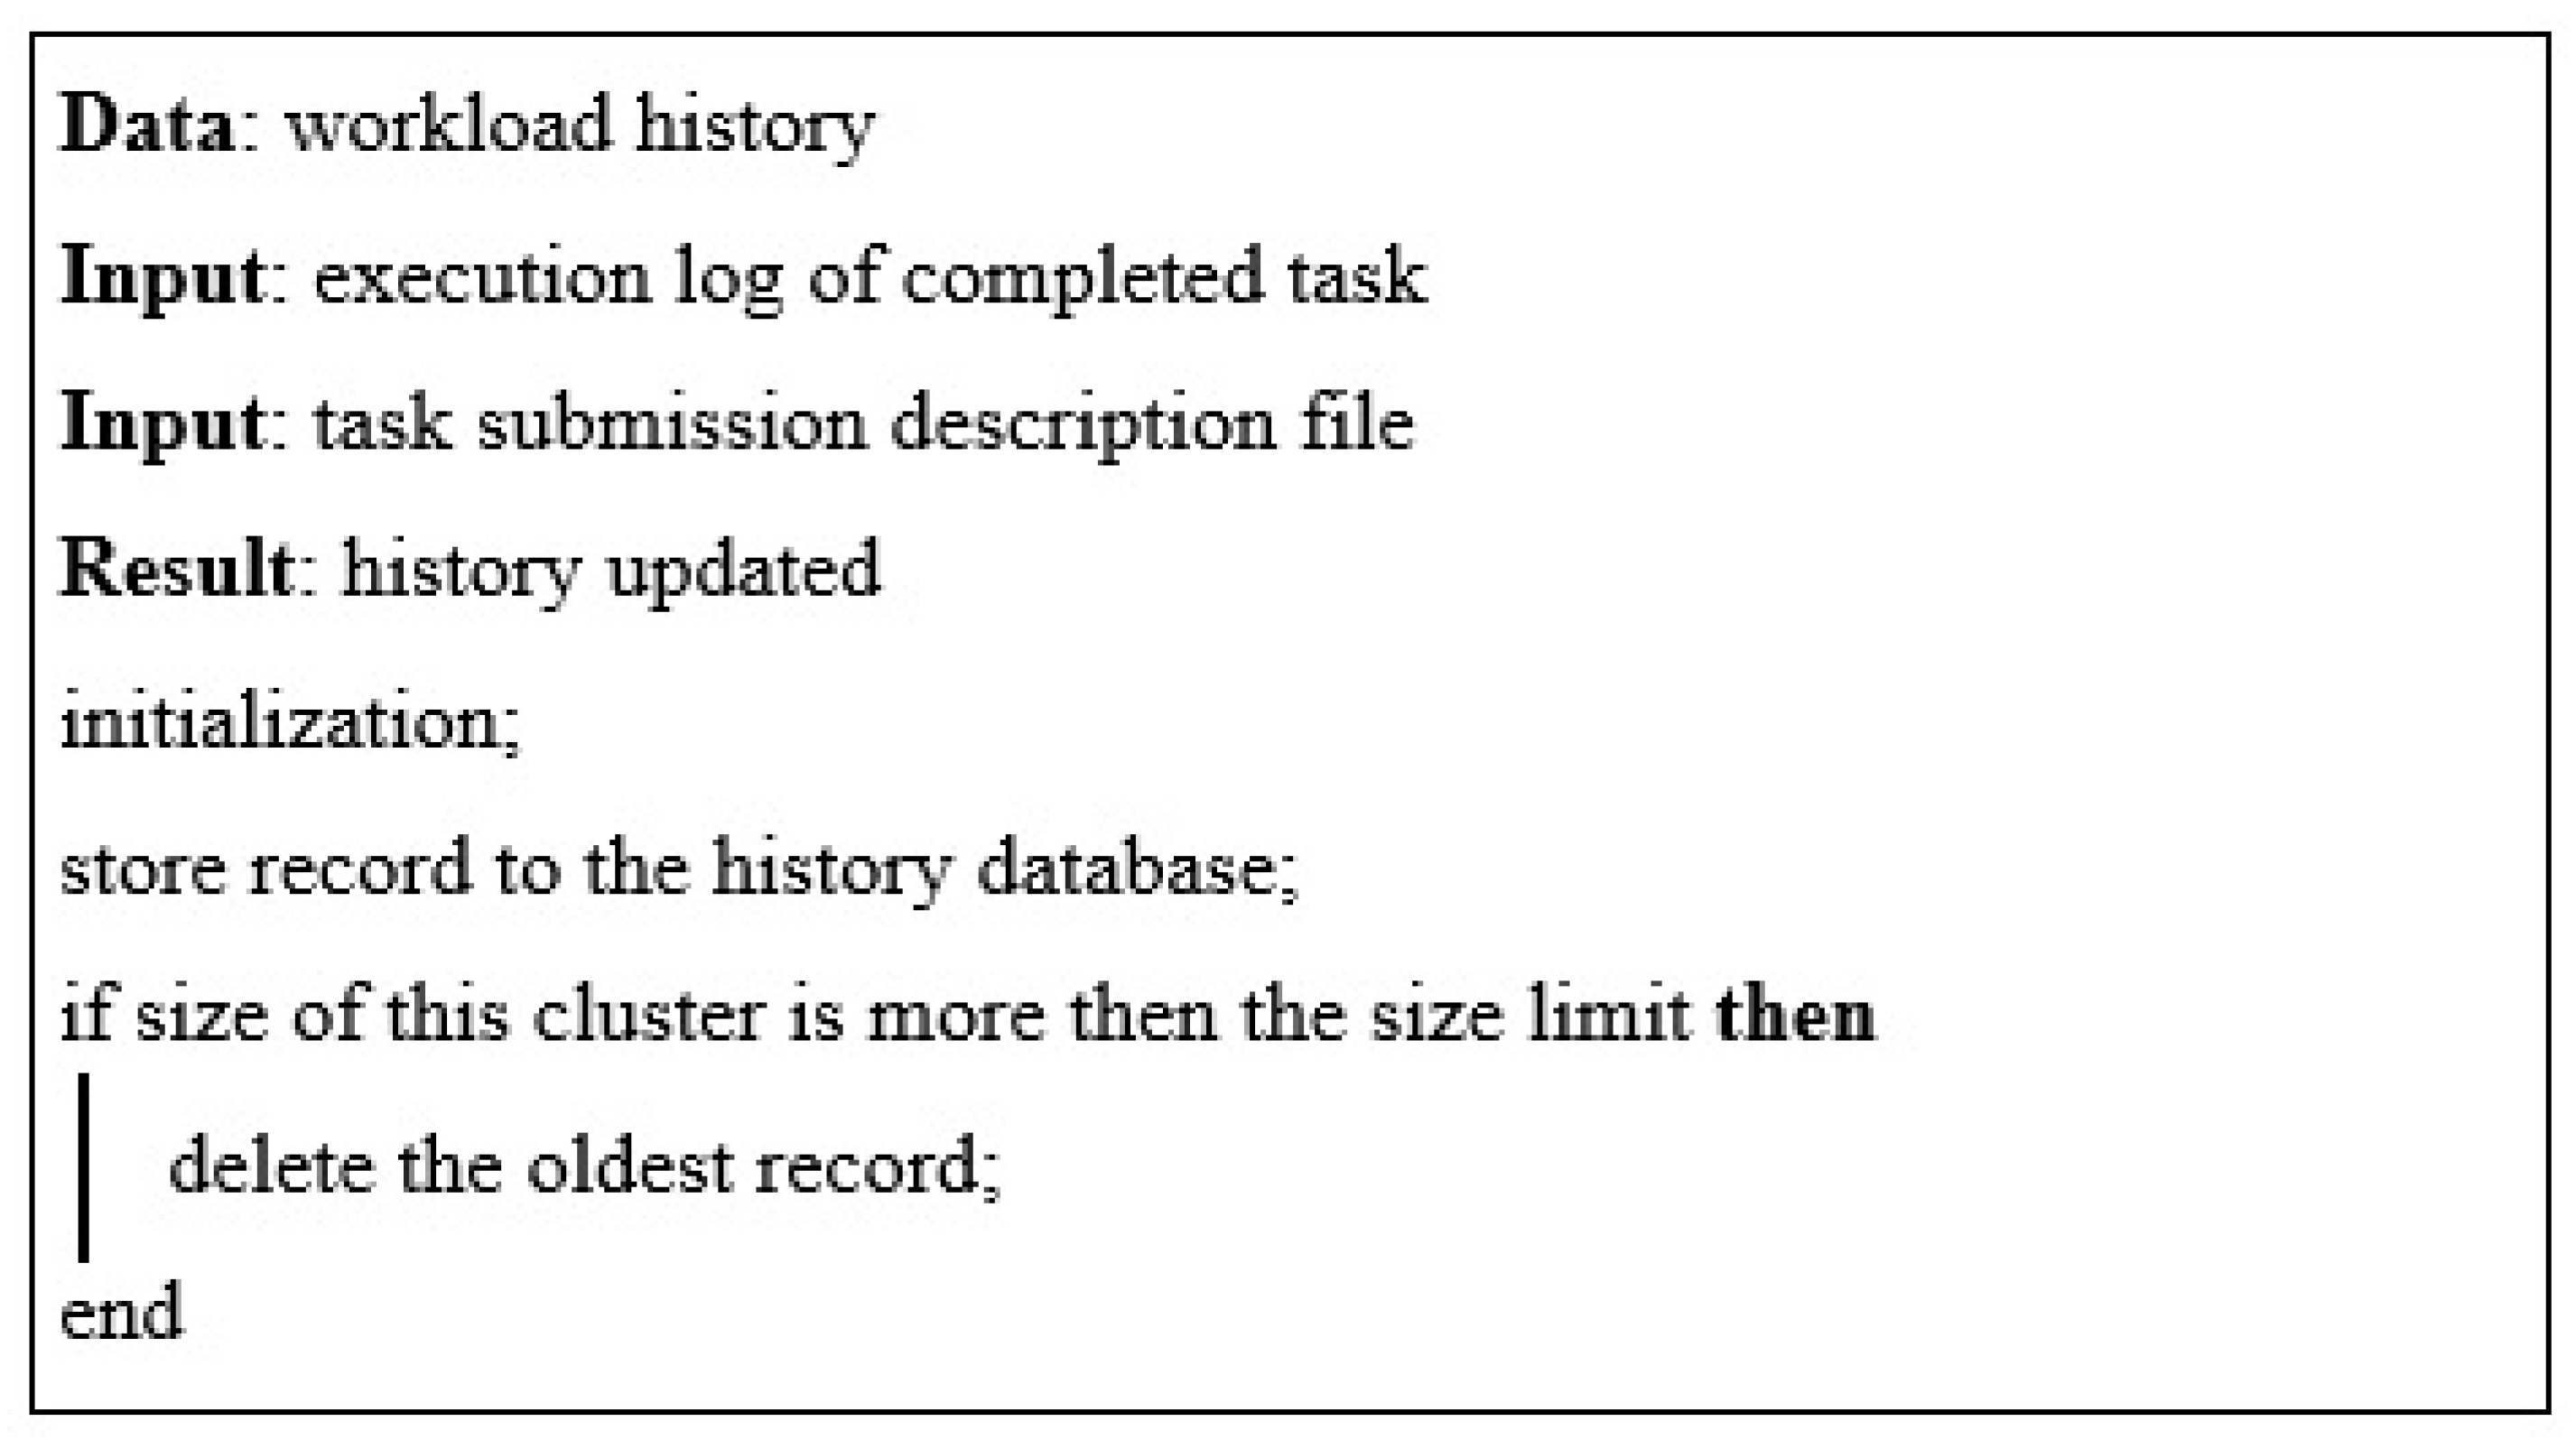
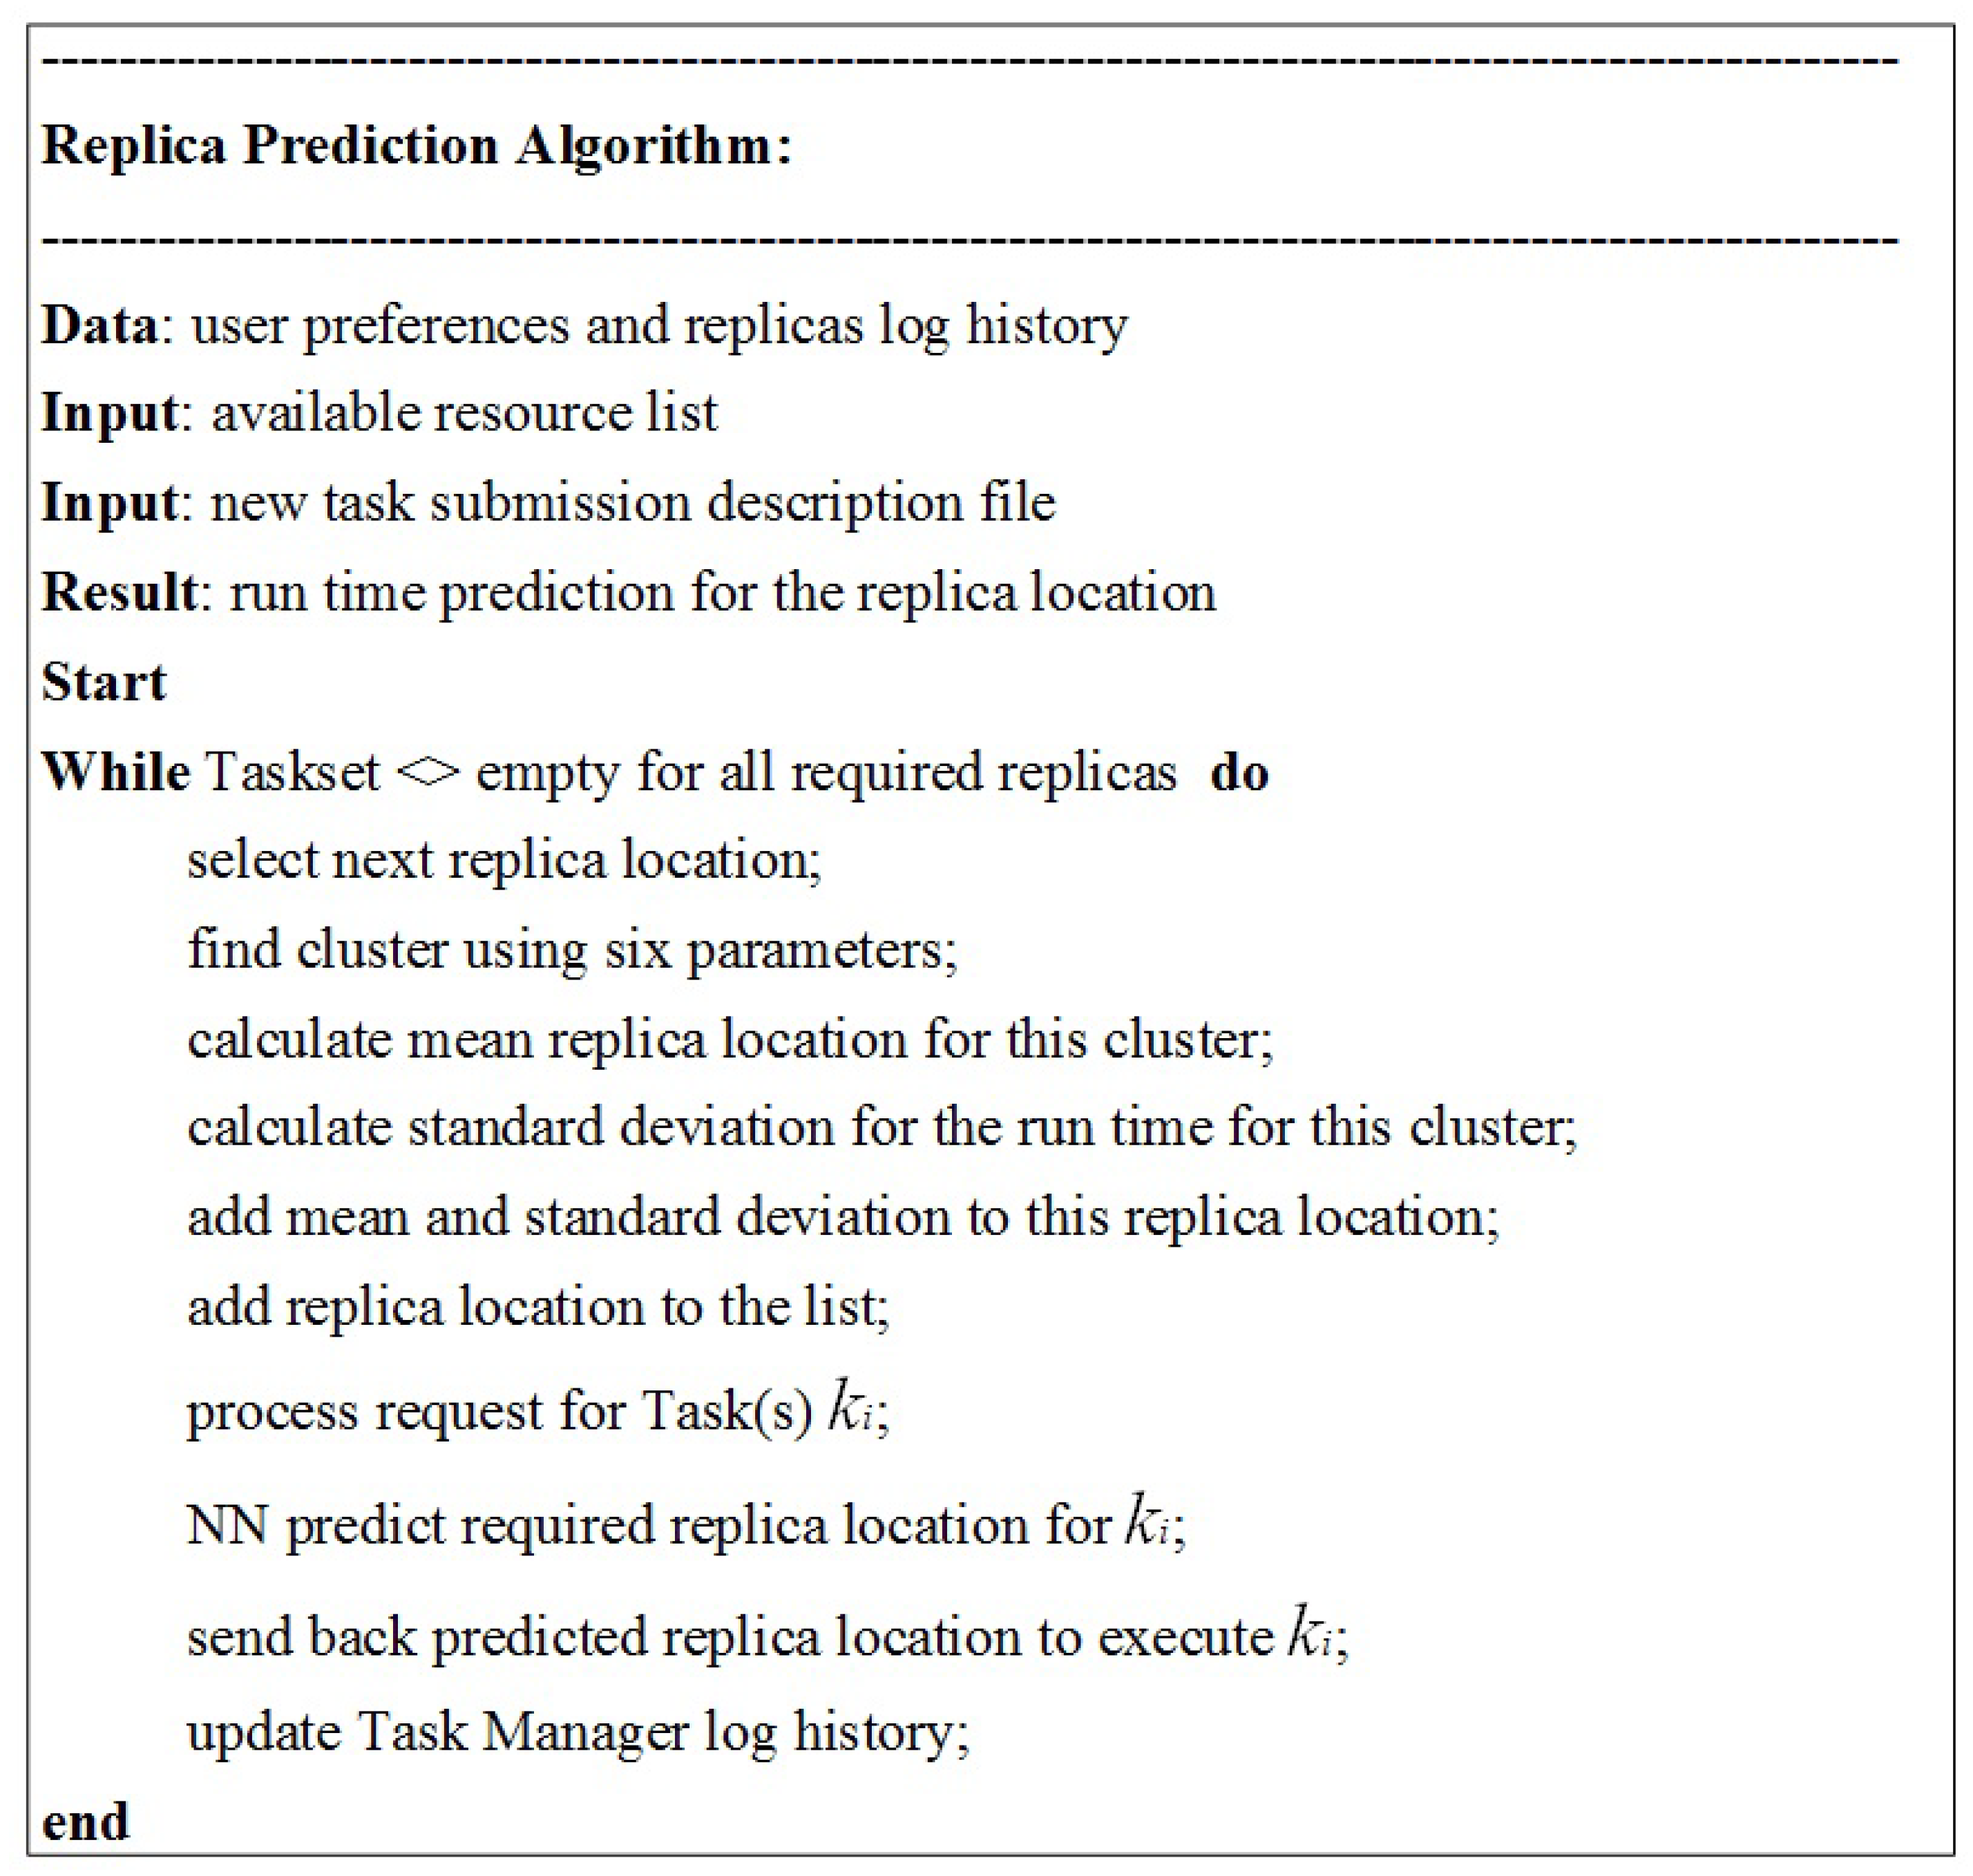
4.2. Description of Proposed Algorithm
- Name: the file name.
- Owner Name: the owner name of this file.
- Attribute Size: the size of this object (in bytes). This object size is not the actual file size. Moreover, this size is used for transferring this object over a network.
- Size: the file size (in MBytes).
- Resource ID: the resource ID that stores this file.
- Creation Time: the file creation time (in milliseconds).
- Transaction Time: the last transaction time of this file (in seconds).
4.3. Edge-Side Replica Prediction and Selection
4.4. Clustering
4.4.1. Mathematical Notations for Clustering
- A feature vector X is a single data item used by the clustering algorithms. It is a d dimensional vector consisting of d measurements: . In the case of workloads, these measurements can represent values of different parameters.
- The scalar components of a feature vector X are called individual features or attributes, e.g., file id, resource id and creation time. Dimension d is the length of a feature vector and represents the total number of features making up the feature vector space.
- A pattern set is denoted by . The pattern vector of this pattern set is denoted by . It can be seen that the pattern set to be clustered can be shown as an n×d matrix.
- The files can be located in local or remote resources.
- A distance measure is a special metric calculated for a feature space and is used to quantify the similarity of different patterns. It will be explained in detail in the coming sections.
4.4.2. Feature Selection
4.4.3. Similarity Measure
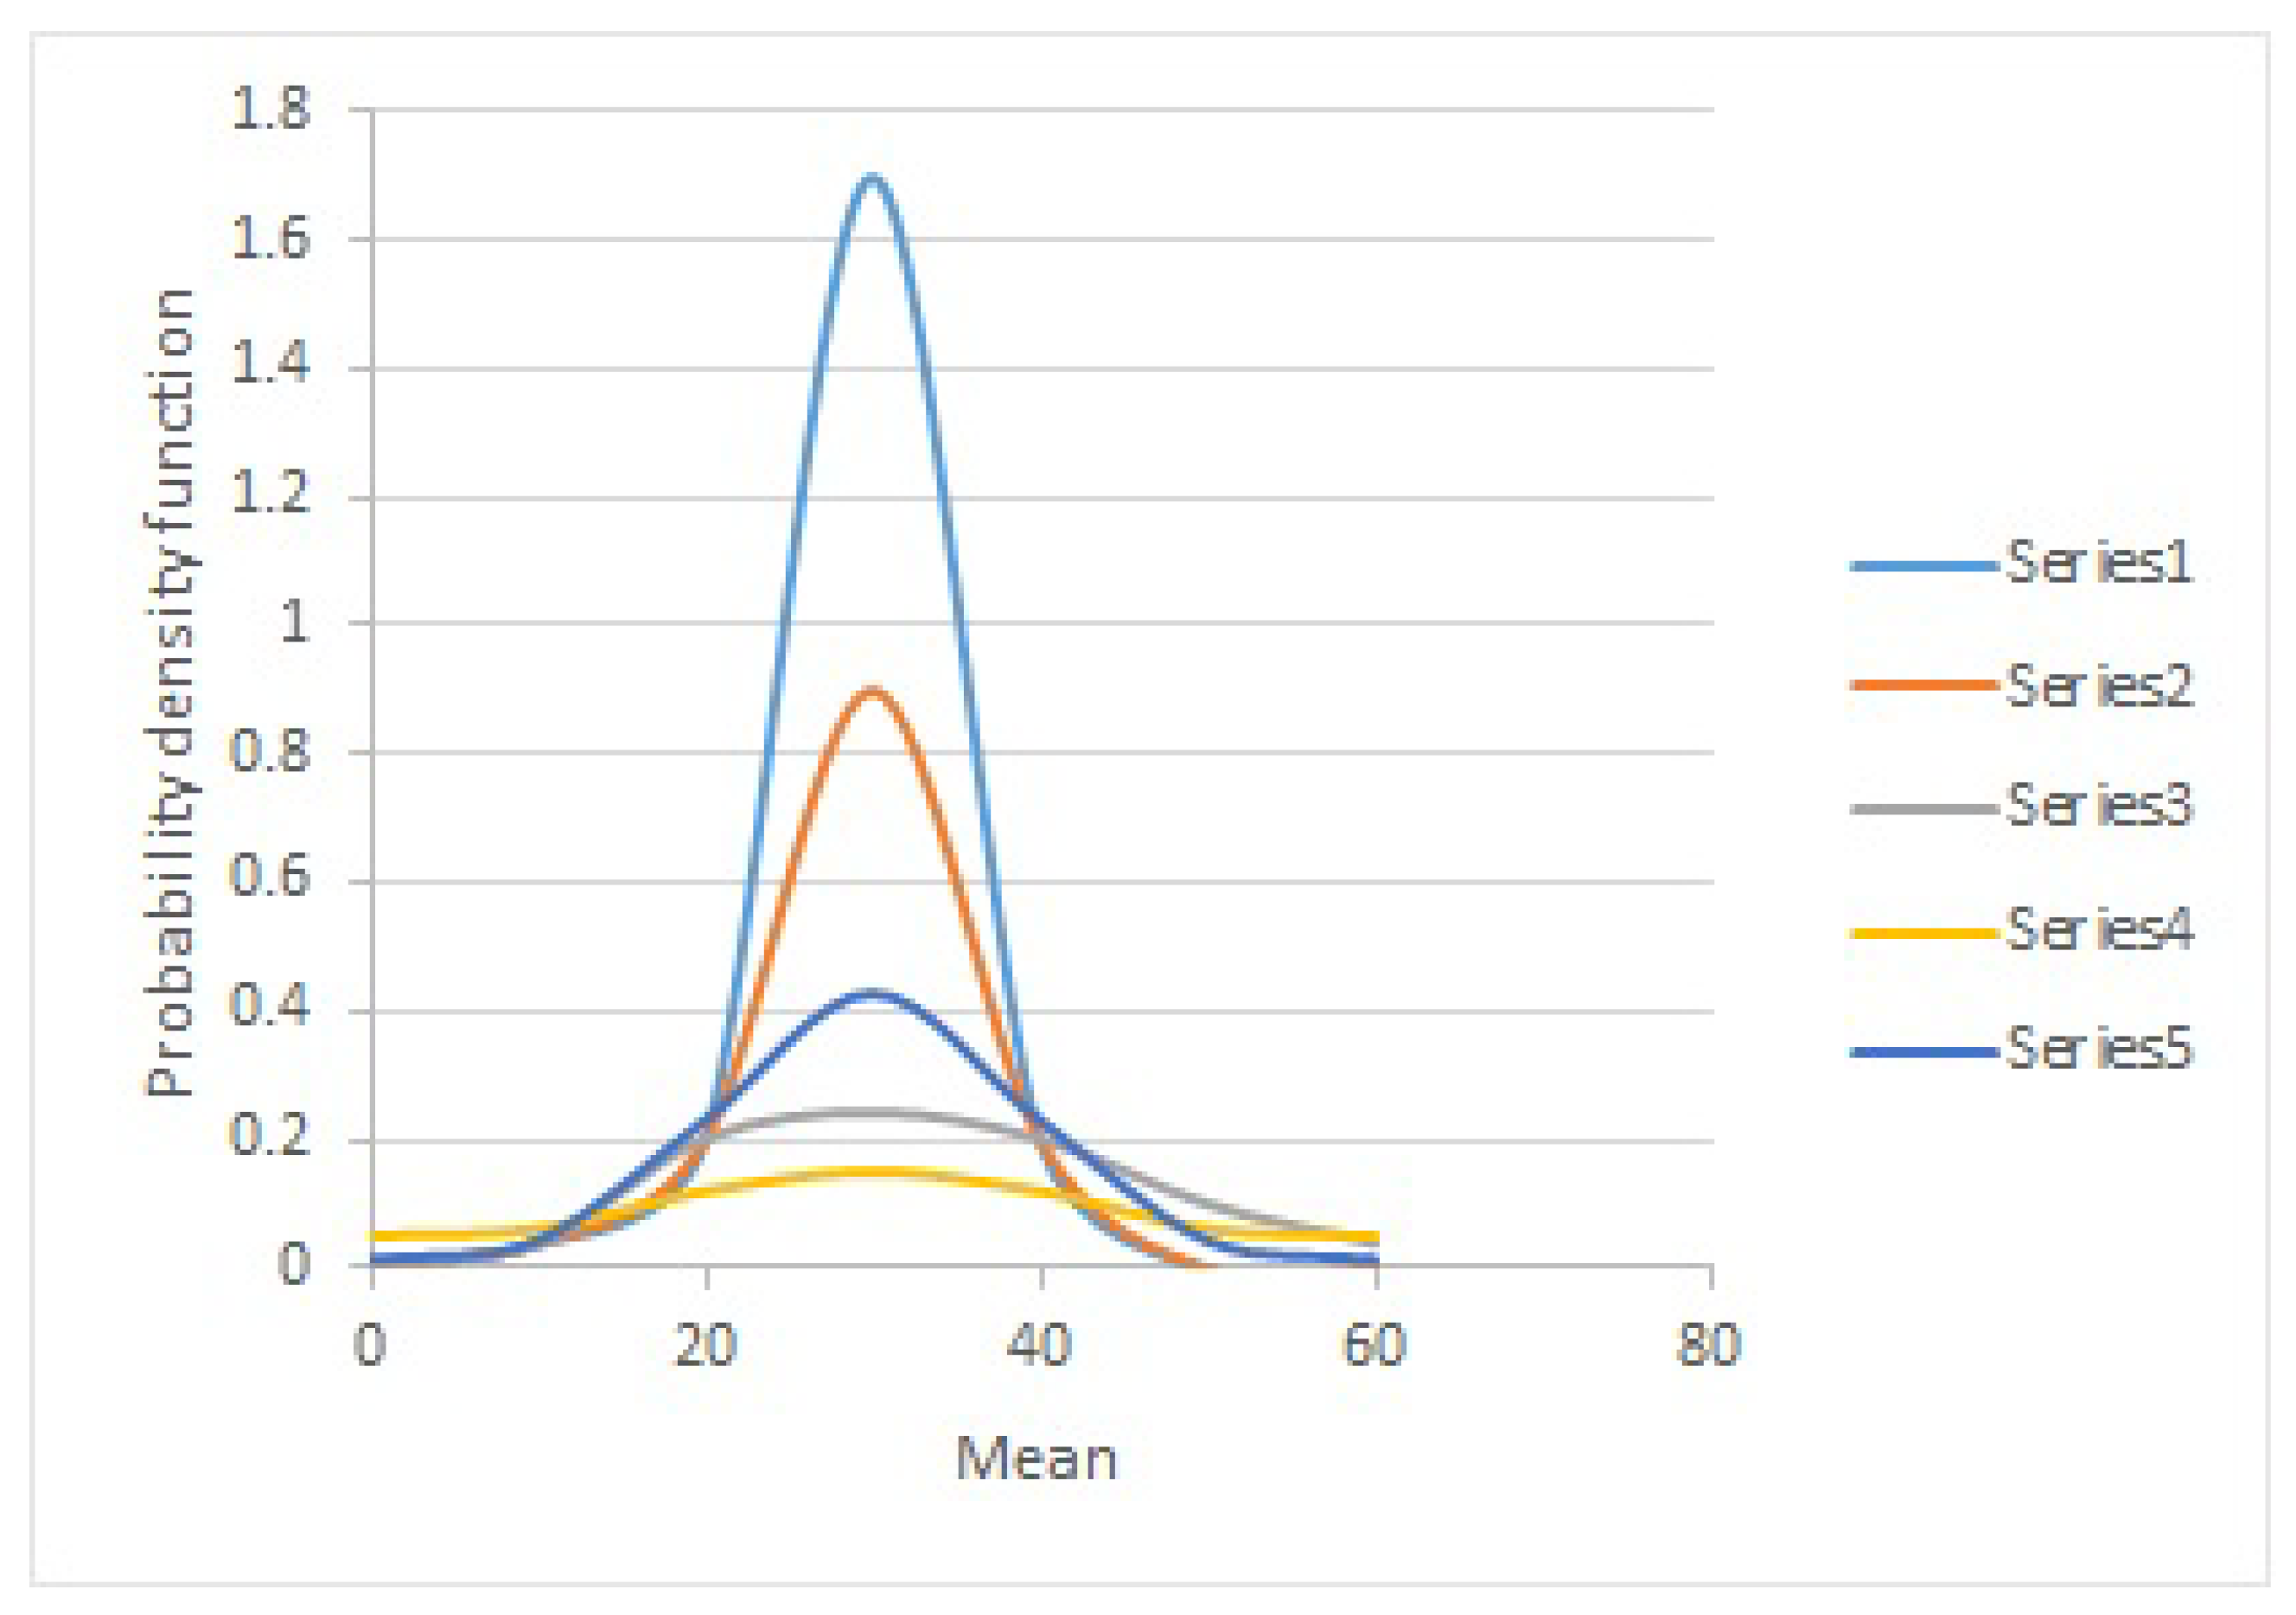
- = Prediction Run Time
- = Mean Run Time
- = Coefficient of Variation
- n = Real number
5. Simulation Testbed and Results
5.1. Simulation Testbed
- The storage system: The storage system has been implemented to simulate the behavior of typical hardware storage. A simple interface that can be used to simulate storage and the retrieval of any amount of data. Accessing files in a SAN at run-time incurs additional delays for task unit execution; this is due to the additional latency that is incurred in transferring the data files through the data center’s internal network.
- Cloudlet: The Cloudlet (cloud task) is represented in CloudSim as a package that holds all the execution details and information of the task (i.e., the size of input and output files, the task owner id and task length expressed in Millions Instruction (MI)). The time required to transfer input and output files between user/IoT and remote resources, then return the results to the owner, is the most important factor that helps to determine the execution time.
- Cloud Resource: The cloud resource has been simulated as a resource with properties as explained below:
- −
- PEs (Processing Elements) have been implemented that objects with a MIPS (Million Instructions Per Second) rating, which represents the CPU speed. The PEs were assembled together to create a machine.
- −
- Objects of the machine were grouped to form a cloud resource.
- −
- CloudSim PEList: The CloudSim PEList maintained a list of PEs that make up a machine.
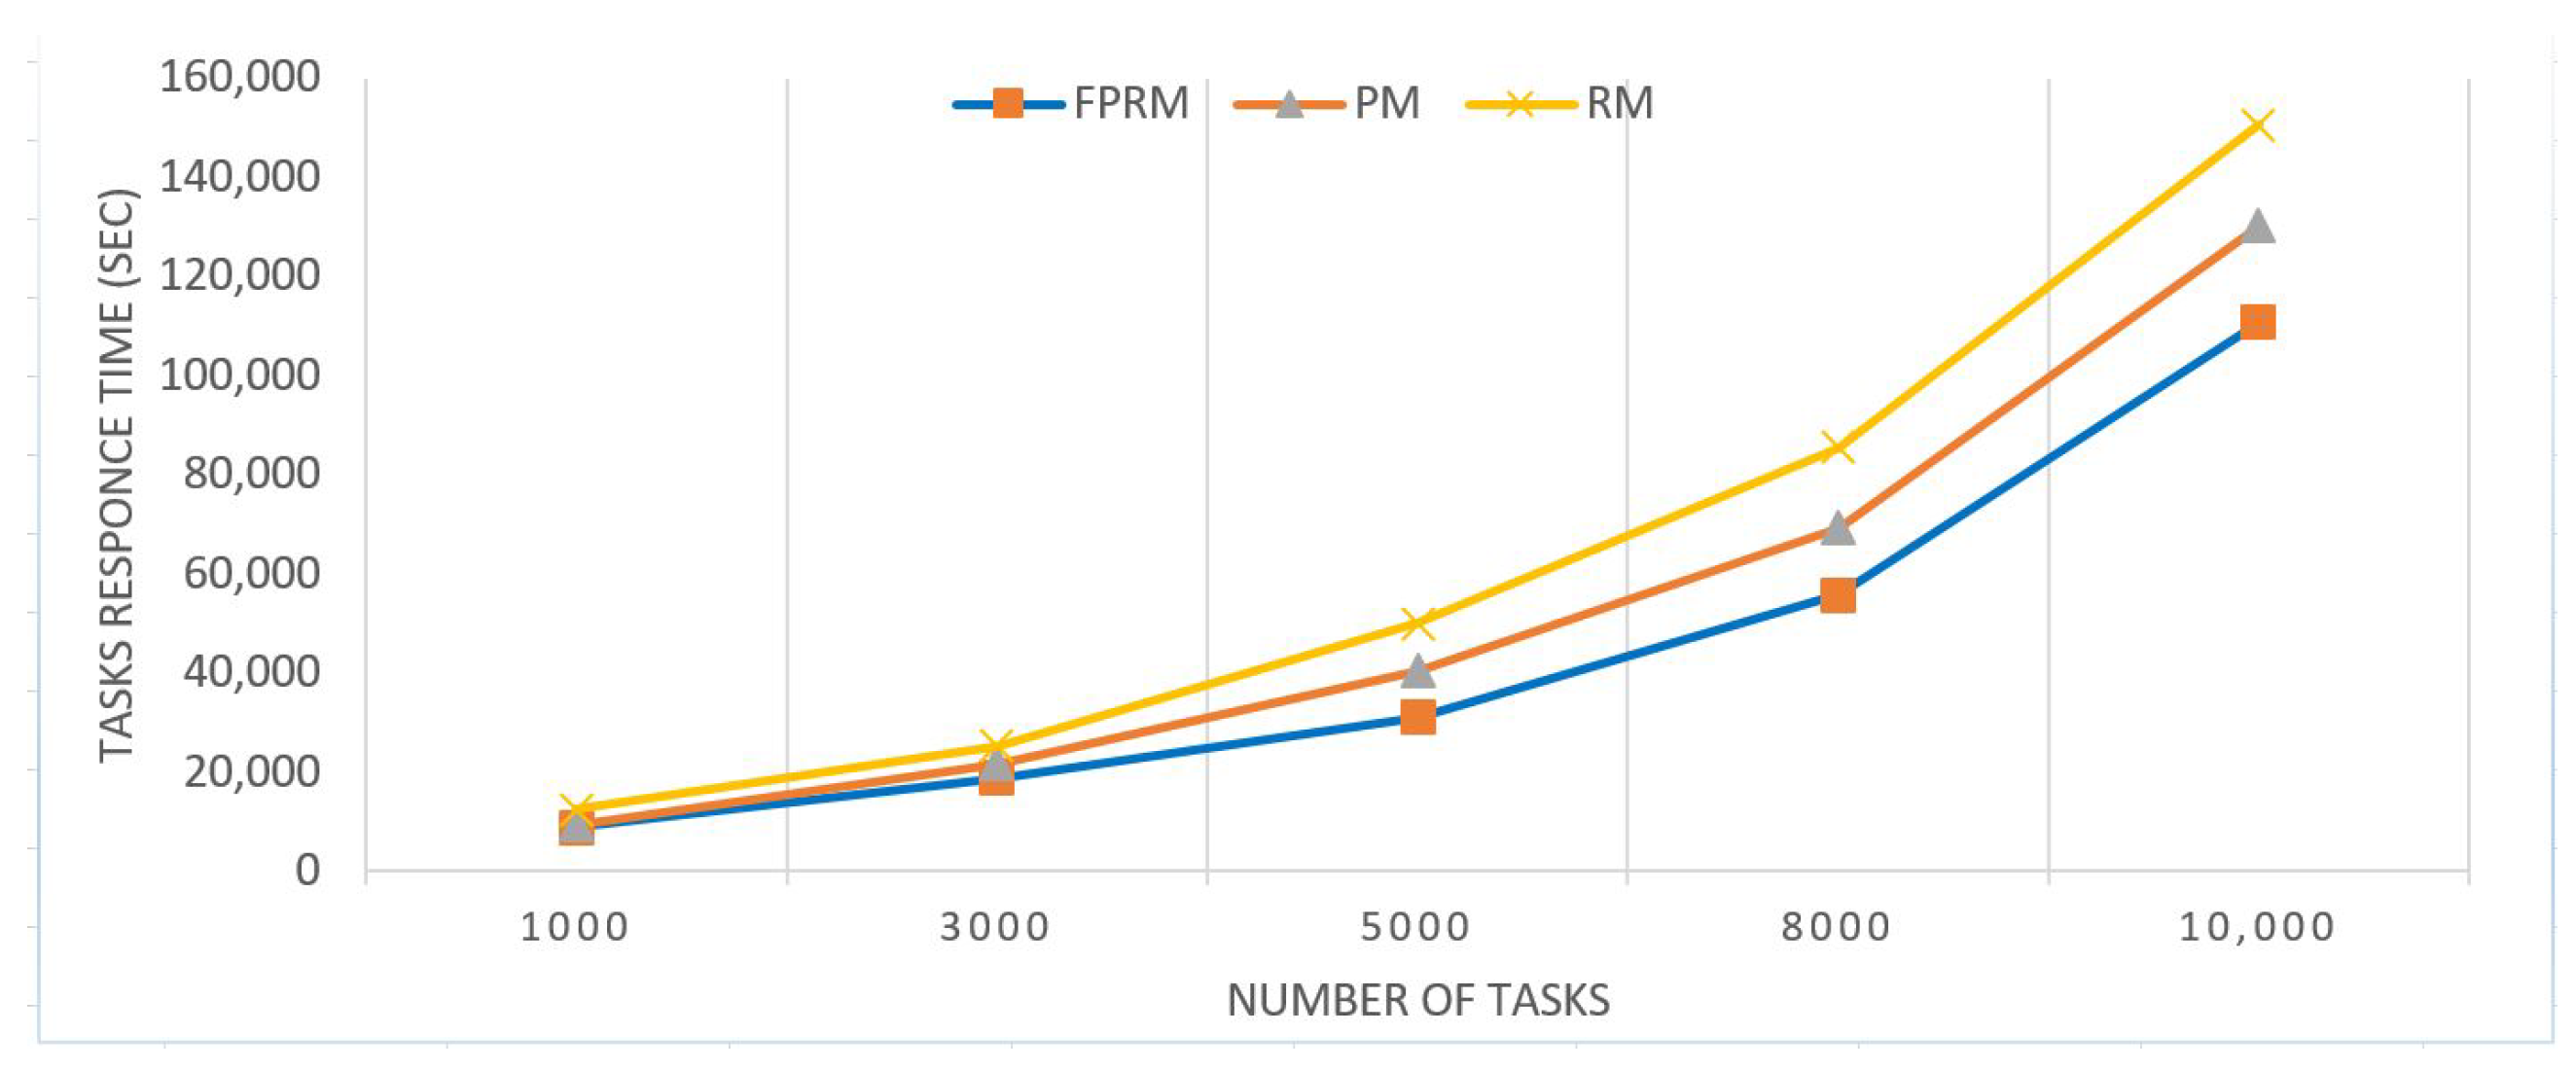
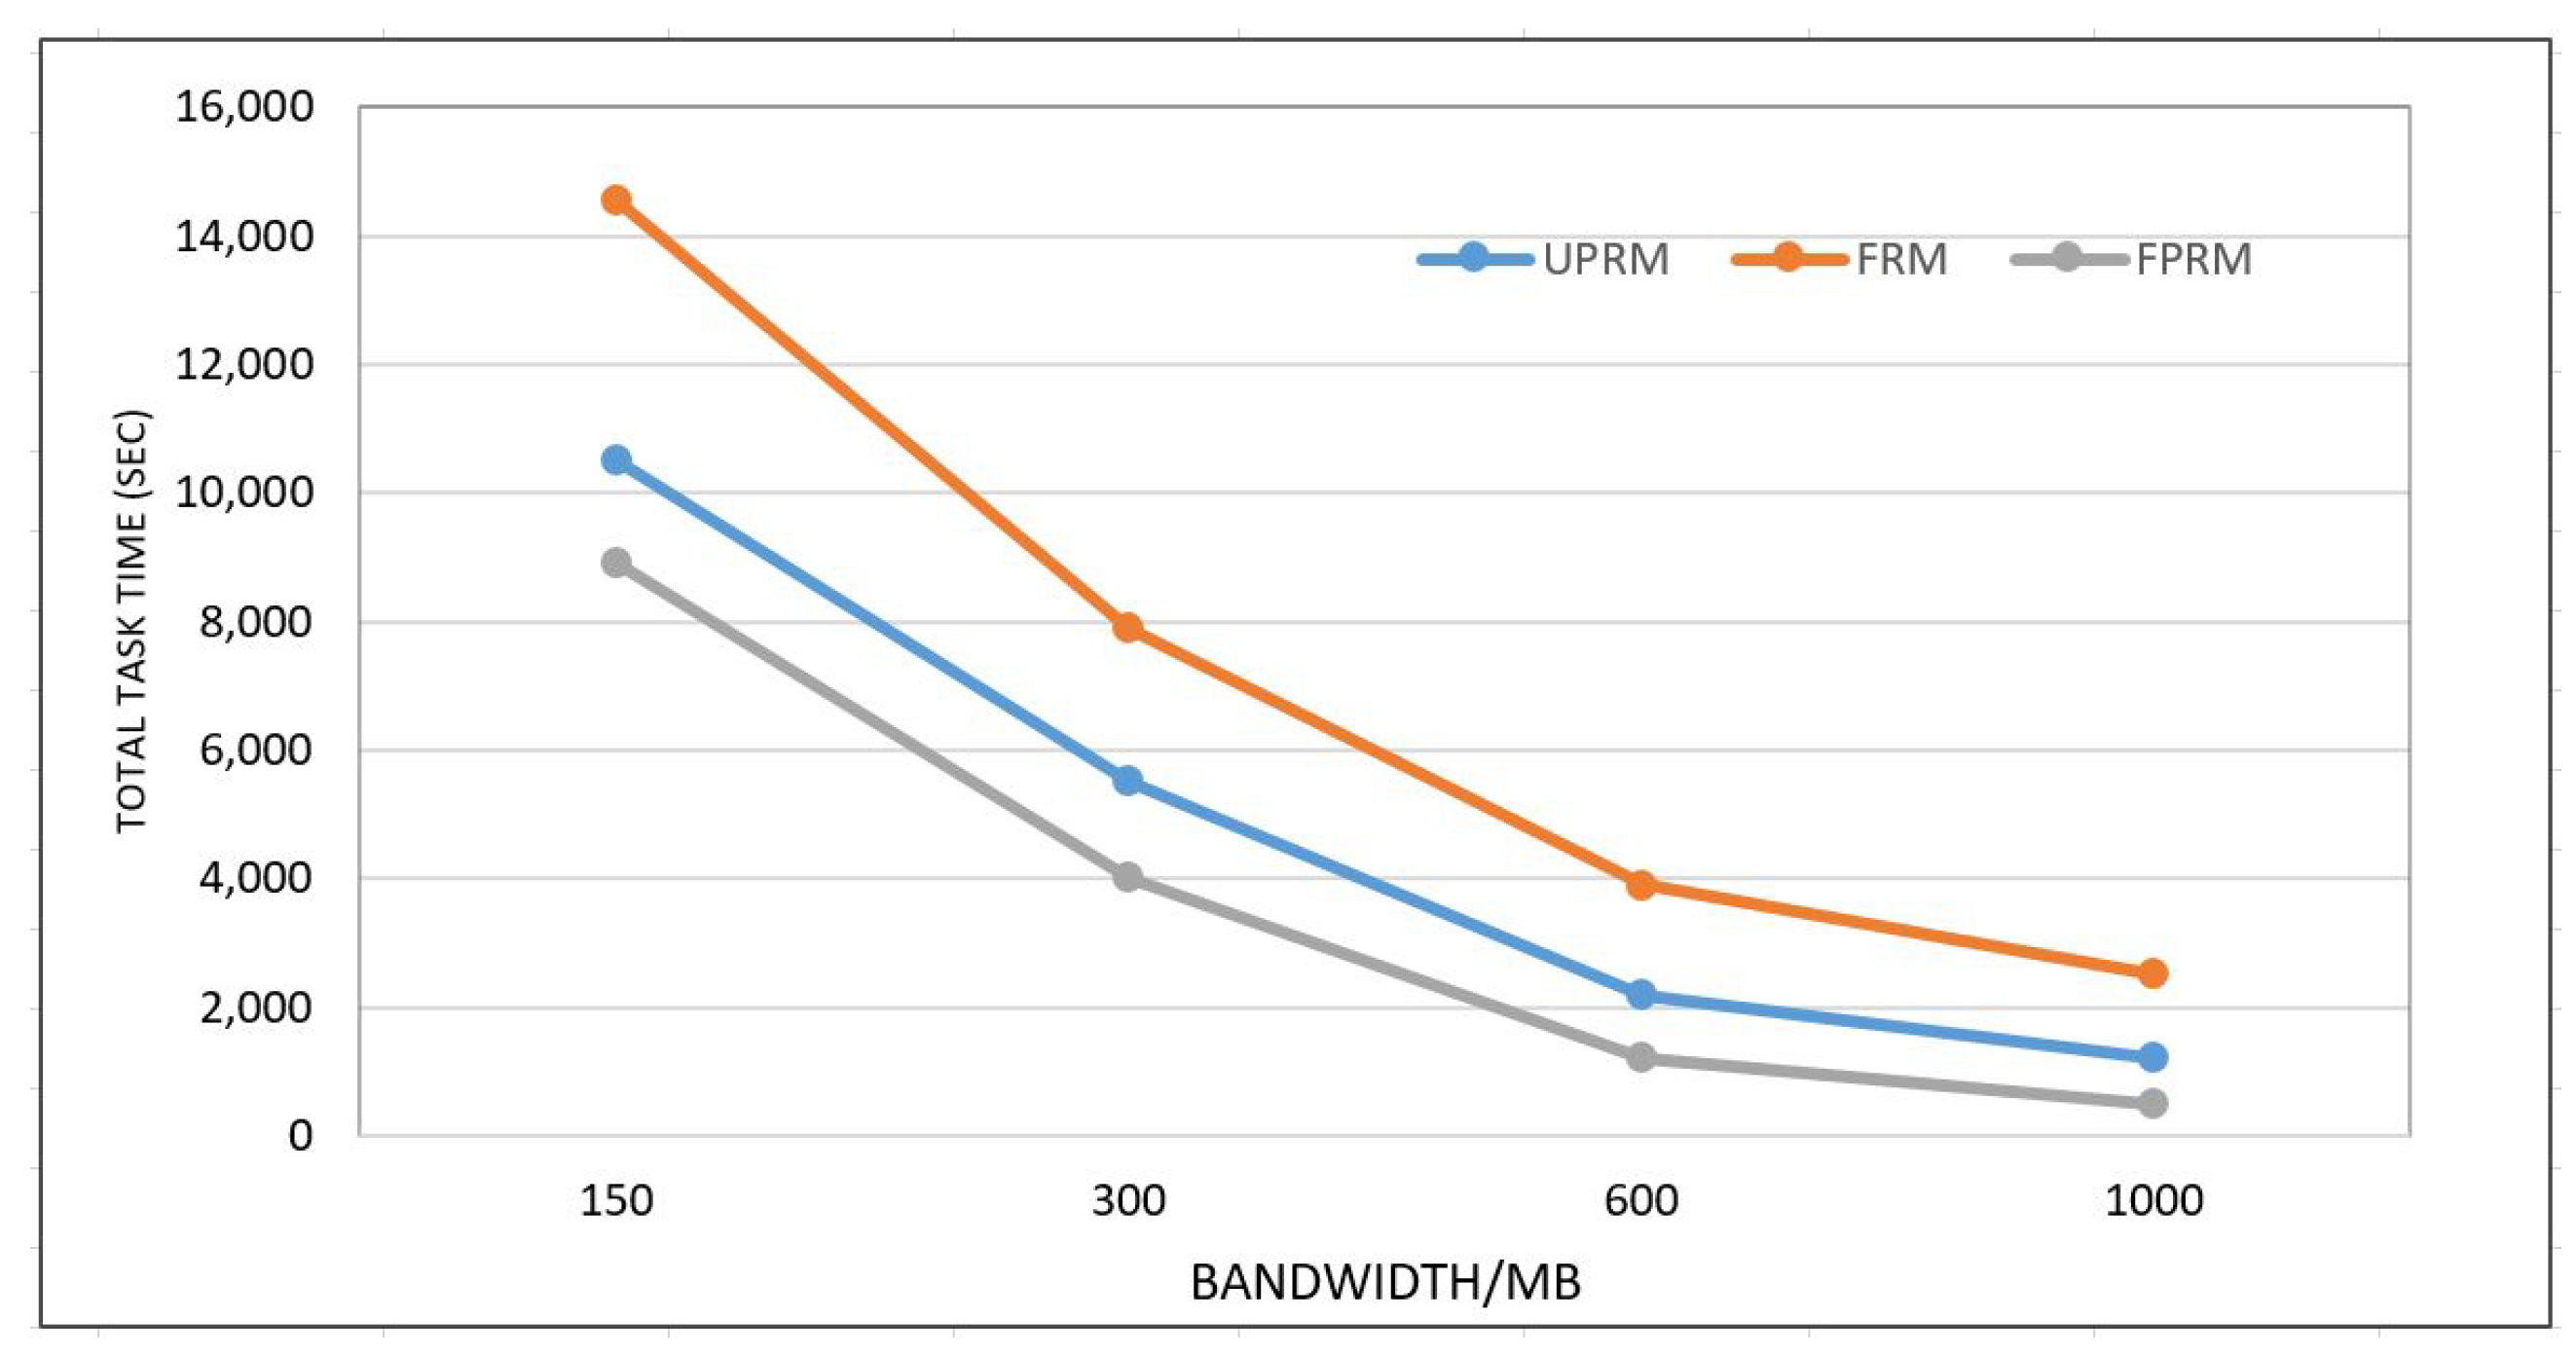
5.2. Simulation Results
6. Conclusions and Future Work
Author Contributions
Funding
Conflicts of Interest
References
- Shao, Z.L.; Huang, C.; Li, H. Replica selection and placement techniques on the IoT and edge computing: A deep study. Wirel. Netw. 2021, 27, 5039–5055. [Google Scholar] [CrossRef]
- Qin, J.; Liang, S.; Song, Y.; Zong, P. Study on Replica Strategy of Big Data Storage based on Cloud Environment. In Proceedings of the 2020 15th International Conference on Computer Science & Education (ICCSE), Delft, The Netherlands, 18–22 August 2020; pp. 642–645. [Google Scholar]
- Ali, M.; Bilal, K.; Khan, S.U.; Veeravalli, B.; Li, K.; Zomaya, A.Y. DROPS: Division and replication of data in cloud for optimal performance and security. IEEE Trans. Cloud Comput. 2015, 6, 303–315. [Google Scholar] [CrossRef]
- Mostafa, N. Cooperative Fog Communications using A Multi-Level Load Balancing. In Proceedings of the 2019 Fourth International Conference on Fog and Mobile Edge Computing (FMEC), Rome, Italy, 10–13 June 2019; pp. 45–51. [Google Scholar] [CrossRef]
- Sadiku, M.N.; Musa, S.M.; Momoh, O.D. Cloud computing: Opportunities and challenges. IEEE Potentials 2014, 33, 34–36. [Google Scholar] [CrossRef]
- Li, C.; Tang, J.; Luo, Y. Scalable replica selection based on node service capability for improving data access performance in edge computing environment. J. Supercomput. 2019, 75, 7209–7243. [Google Scholar] [CrossRef]
- Yang, C.; Huang, Q.; Li, Z.; Liu, K.; Hu, F. Big Data and cloud computing: Innovation opportunities and challenges. Int. J. Digit. Earth 2017, 10, 13–53. [Google Scholar] [CrossRef]
- Mostafa, N.; Al Ridhawi, I.; Hamza, A. An intelligent dynamic replica selection model within grid systems. In Proceedings of the 2015 IEEE 8th GCC Conference & Exhibition, Muscat, Oman, 1–4 February 2015; pp. 1–6. [Google Scholar]
- Al Ridhawi, I.; Mostafa, N.; Masri, W. Location-aware data replication in cloud computing systems. In Proceedings of the 2015 IEEE 11th International Conference on Wireless and Mobile Computing, Networking and Communications (WiMob), Abu Dhabi, United Arab Emirates, 19–21 October 2015; pp. 20–27. [Google Scholar]
- Sun, S.; Yao, W.; Qiao, B.; Zong, M.; He, X.; Li, X. RRSD: A file replication method for ensuring data reliability and reducing storage consumption in a dynamic Cloud-P2P environment. Future Gener. Comput. Syst. 2019, 100, 844–858. [Google Scholar] [CrossRef]
- Kumar, K.A.; Quamar, A.; Deshpande, A.; Khuller, S. SWORD: Workload-aware data placement and replica selection for cloud data management systems. VLDB J. 2014, 23, 845–870. [Google Scholar] [CrossRef]
- Li, Z.; Cai, W.; Turner, S.J. Un-identical federate replication structure for improving performance of HLA-based simulations. Simul. Model. Pract. Theory 2014, 48, 112–128. [Google Scholar] [CrossRef]
- Liu, R.; Feng, S.; Sun, S.; Liu, M. Edge node data replica management method for distribution Internet of Things. In Proceedings of the 2020 4th International Conference on HVDC (HVDC), Xi’an, China, 6–9 November 2020; pp. 830–832. [Google Scholar]
- Wei, J.; Yi, M.; Song, L. Efficient Integrity Verification of Replicated Data in Cloud Computing System. Comput. Secur. 2016, 65. [Google Scholar] [CrossRef]
- Zhang, Y.; Ni, J.; Tao, X.; Wang, Y.; Yu, Y. Provable multiple replication data possession with full dynamics for secure cloud storage. Concurr. Comput. Pract. Exp. 2016, 28, 1161–1173. [Google Scholar] [CrossRef]
- Lakshman, A.; Malik, P. Cassandra: A decentralized structured storage system. ACM SIGOPS Oper. Syst. Rev. 2010, 44, 35–40. [Google Scholar] [CrossRef]
- Suresh, P.L.; Canini, M.; Schmid, S.; Feldmann, A. C3: Cutting Tail Latency in Cloud Data Stores via Adaptive Replica Selection. In Proceedings of the 12th USENIX Symposium on Networked Systems Design and Implementation, Oakland, CA USA, 4–6 May 2015. [Google Scholar]
- Li, C.; Zhang, Y.; Luo, Y. Adaptive replica creation and selection strategies for latency-aware application in collaborative edge-cloud system. Comput. J. 2020, 63, 1338–1354. [Google Scholar] [CrossRef]
- Muthu, T.S.; Pandiaraj, S. Data Grid Optimization using Replica Replacement. In Proceedings of the 2019 6th International Conference on Computing for Sustainable Global Development (INDIACom), New Delhi, India, 13–15 March 2019; pp. 410–414. [Google Scholar]
- Hassan, N.; Gillani, S.; Ahmed, E.; Yaqoob, I.; Imran, M. The role of edge computing in internet of things. IEEE Commun. Mag. 2018, 56, 110–115. [Google Scholar] [CrossRef]
- Saranya, N.; Geetha, K.; Rajan, C. Data replication in mobile edge computing systems to reduce latency in internet of things. Wirel. Pers. Commun. 2020, 112, 2643–2662. [Google Scholar] [CrossRef]
- Gill, N.K.; Singh, S. Dynamic cost-aware re-replication and rebalancing strategy in cloud system. In Proceedings of the 3rd International Conference on Frontiers of Intelligent Computing: Theory and Applications (FICTA), Bhubaneswar, India, 14–15 November 2014; Springer: Berlin/Heidelberg, Germany, 2015; pp. 39–47. [Google Scholar]
- Junfeng, T.; Weiping, L. Pheromone-based genetic algorithm adaptive selection algorithm in cloud storage. Int. J. Grid Distrib. Comput. 2016, 9, 269–278. [Google Scholar] [CrossRef]
- Wakil, K.; Nazif, H.; Panahi, S.; Abnoosian, K.; Sheikhi, S. Method for replica selection in the Internet of Things using a hybrid optimisation algorithm. IET Commun. 2019, 13, 2820–2826. [Google Scholar] [CrossRef]
- Waheed, A.; Shah, M.A.; Mohsin, S.M.; Khan, A.; Maple, C.; Aslam, S.; Shamshirband, S. A Comprehensive Review of Computing Paradigms, Enabling Computation Offloading and Task Execution in Vehicular Networks. IEEE Access 2022, 10, 3580–3600. [Google Scholar] [CrossRef]
- Lin, Z.; Niu, H.; An, K.; Wang, Y.; Zheng, G.; Chatzinotas, S.; Hu, Y. Refracting RIS Aided Hybrid Satellite-Terrestrial Relay Networks: Joint Beamforming Design and Optimization. IEEE Trans. Aerosp. Electron. Syst. 2022, 58, 3717–3724. [Google Scholar] [CrossRef]
- Lin, Z.; Lin, M.; Wang, J.B.; de Cola, T.; Wang, J. Joint Beamforming and Power Allocation for Satellite-Terrestrial Integrated Networks With Non-Orthogonal Multiple Access. IEEE J. Sel. Top. Signal Process. 2019, 13, 657–670. [Google Scholar] [CrossRef]
- Lin, Z.; Lin, M.; de Cola, T.; Wang, J.B.; Zhu, W.P.; Cheng, J. Supporting IoT With Rate-Splitting Multiple Access in Satellite and Aerial-Integrated Networks. IEEE Internet Things J. 2021, 8, 11123–11134. [Google Scholar] [CrossRef]
- Zhang, J.; Su, Q.; Tang, B.; Wang, C.; Li, Y. DPSNet: Multitask Learning Using Geometry Reasoning for Scene Depth and Semantics. IEEE Trans. Neural Netw. Learn. Syst. 2021, 1–12. [Google Scholar] [CrossRef] [PubMed]
- Calheiros, R.N.; Ranjan, R.; De Rose, C.A.; Buyya, R. Cloudsim: A novel framework for modeling and simulation of cloud computing infrastructures and services. arXiv 2009, arXiv:0903.2525. [Google Scholar]
- Mansouri, N. Network and data location aware approach for simultaneous job scheduling and data replication in large-scale data grid environments. Front. Comput. Sci. 2014, 8, 391–408. [Google Scholar] [CrossRef]
- Spillner, J.; Gkikopoulos, P.; Buzachis, A.; Villari, M. Rule-Based Resource Matchmaking for Composite Application Deployments across IoT-Fog-Cloud Continuums. In Proceedings of the 2020 IEEE/ACM 13th International Conference on Utility and Cloud Computing (UCC), Leicester, UK, 7–10 December 2020; pp. 336–341. [Google Scholar] [CrossRef]
- Rajalakshmi, A.; Vijayakumar, D.; Srinivasagan, K.G. An improved dynamic data replica selection and placement in cloud. In Proceedings of the 2014 International Conference on Recent Trends in Information Technology, Chennai, India, 10–12 April 2014; pp. 1–6. [Google Scholar] [CrossRef]
- Kapgate, D. Efficient Service Broker Algorithm for Data Center Selection in Cloud Computing. Int. J. Comput. Sci. Mob. Comput. 2014, 3, 355–365. [Google Scholar]
- Aslam, S.; Herodotou, H.; Mohsin, S.M.; Javaid, N.; Ashraf, N.; Aslam, S. A survey on deep learning methods for power load and renewable energy forecasting in smart microgrids. Renew. Sustain. Energy Rev. 2021, 144, 110992. [Google Scholar] [CrossRef]
- Jones, M. Artificial Intelligence: A Systems Approach; Computer science Series; Infinity Science Press: Hingham, MA, USA, 2008. [Google Scholar]
- Yarali, A. Artificial Intelligence, 5G, and IoT. In Intelligent Connectivity: AI, IoT, and 5G; John Wiley & Sons, Inc.: Hoboken, NJ, USA, 2022; pp. 251–268. [Google Scholar] [CrossRef]
- Mostafa, N.; Ridhawi, I.A.; Aloqaily, M. Fog resource selection using historical executions. In Proceedings of the 2018 Third International Conference on Fog and Mobile Edge Computing (FMEC), Barcelona, Spain, 23–26 April 2018; pp. 272–276. [Google Scholar] [CrossRef]
- Long, Y.; Rong, J. Research on Model of Seismic Anomaly Data Mining Based on Neural Network. In Proceedings of the 2021 IEEE 4th International Conference on Information Systems and Computer Aided Education (ICISCAE), Dalian, China, 24–26 September 2021; pp. 518–522. [Google Scholar] [CrossRef]
- Bui, T.D.; Nguyen, D.K.; Ngo, T.D. Supervising an Unsupervised Neural Network. In Proceedings of the 2009 First Asian Conference on Intelligent Information and Database Systems, Dong Hoi, Vietnam, 1–3 April 2009; pp. 307–312. [Google Scholar] [CrossRef]
- Shanthi, D.; Sahoo, G.; Saravanan, S. Designing an Artificial Neural Network Model for the Prediction of Thromboembolic Stroke. Int. Journals Biom. Bioinform. 2004, 3, 10–18. [Google Scholar]
- Application: JustNN Help—justnn.com. Available online: http://www.justnn.com/application/JustNN.htm (accessed on 21 July 2022).
- Mostafa, N. A dynamic approach for consistency service in cloud and fog environment. In Proceedings of the 2020 Fifth International Conference on Fog and Mobile Edge Computing (FMEC), Paris, France, 20–23 April 2020; pp. 28–33. [Google Scholar]
- Chen, X.; Tang, S.; Lu, Z.; Wu, J.; Duan, Y.; Huang, S.C.; Tang, Q. iDiSC: A new approach to IoT-data-intensive service components deployment in edge-cloud-hybrid system. IEEE Access 2019, 7, 59172–59184. [Google Scholar] [CrossRef]
- Huang, D.; Wang, C.D.; Peng, H.; Lai, J.; Kwoh, C.K. Enhanced ensemble clustering via fast propagation of cluster-wise similarities. IEEE Trans. Syst. Man, Cybern. Syst. 2018, 51, 508–520. [Google Scholar] [CrossRef]
- Wong, A.K.; Li, G.C. Simultaneous pattern and data clustering for pattern cluster analysis. IEEE Trans. Knowl. Data Eng. 2008, 20, 911–923. [Google Scholar] [CrossRef]
- Tian, Y.; Zheng, R.; Liang, Z.; Li, S.; Wu, F.X.; Li, M. A data-driven clustering recommendation method for single-cell RNA-sequencing data. Tsinghua Sci. Technol. 2021, 26, 772–789. [Google Scholar] [CrossRef]
- Tang, R.; Li, P. Index optimization replication algorithm by using the soft subspace clustering method. In Proceedings of the 2014 IEEE 7th Joint International Information Technology and Artificial Intelligence Conference, Chongqing, China, 20–21 December 2014; pp. 414–418. [Google Scholar]
- Gkatzikis, L.; Sourlas, V.; Fischione, C.; Koutsopoulos, I.; Dán, G. Clustered content replication for hierarchical content delivery networks. In Proceedings of the 2015 IEEE International Conference on Communications (ICC), London, UK, 8–12 June 2015; pp. 5872–5877. [Google Scholar]
- Nguyen, D.N.; Tran, X.H.; Nguyen, H.S. A cluster-based file replication scheme for DHT-based file backup systems. In Proceedings of the 2016 International Conference on Advanced Technologies for Communications (ATC), Hanoi, Vietnam, 12–14 October 2016; pp. 204–209. [Google Scholar]
- Armano, G.; Javarone, M.A. Clustering datasets by complex networks analysis. Complex Adapt. Syst. Model. 2013, 1, 1–10. [Google Scholar] [CrossRef][Green Version]
- Faizah, N.; Fabrianto, L.; Prasetyo, R. Unbalanced data clustering with K-means and euclidean distance algorithm approach case study population and refugee data. J. Physics Conf. Ser. Iop Publ. 2020, 1477, 022005. [Google Scholar] [CrossRef]
- Lv, M.; Wang, L.; Hou, Y.; Gao, Q.; Hou, R. Mean shift tracker with grey prediction for visual object tracking. Can. J. Electr. Comput. Eng. 2018, 41, 172–178. [Google Scholar] [CrossRef]
- Bishnu, P.S.; Bhattacherjee, V. Software fault prediction using quad tree-based k-means clustering algorithm. IEEE Trans. Knowl. Data Eng. 2011, 24, 1146–1150. [Google Scholar] [CrossRef]
- Li, G.; Chang, W.; Yang, H. A novel combined prediction model for monthly mean precipitation with error correction strategy. IEEE Access 2020, 8, 141432–141445. [Google Scholar] [CrossRef]
- Khojasteh, H.; Mišić, J.; Mišić, V.B. Task filtering as a task admission control policy in cloud server pools. In Proceedings of the 2015 International Wireless Communications and Mobile Computing Conference (IWCMC), Dubrovnik, Croatia, 24–28 August 2015; pp. 727–732. [Google Scholar]
- Wang, K.; Fang, F.; Da Costa, D.B.; Ding, Z. Sub-channel scheduling, task assignment, and power allocation for OMA-based and NOMA-based MEC systems. IEEE Trans. Commun. 2020, 69, 2692–2708. [Google Scholar] [CrossRef]
- Oracle. Java 2 Platform SE. 2022. Available online: https://docs.oracle.com/javase/1.4.2/docs/api/index.html (accessed on 3 July 2022).


| Series | Mean | Standard Deviation | Coefficient of Variation (CV) |
|---|---|---|---|
| Series1 | 24 | 2 | 0.08 |
| Series2 | 24 | 4 | 0.16 |
| Series3 | 24 | 8 | 0.32 |
| Series4 | 24 | 16 | 0.64 |
| Series5 | 24 | 32 | 1.28 |
| Experiments Parameters | Values/Ranges |
|---|---|
| Number of users | 100–500 |
| Number of tasks per user | 2–10 |
| Total tasks | 1000–10,000 |
| Number of files accessed per task | 5 |
| Total files | 2500 |
| Size of single file | 2.5–20 GB |
| Total size of files | 50,000 GB |
| Number of sites | 30 |
| Available storage of each site | 100 GB–1 TB |
| Task delay | 2500 ms |
| Bandwidth | 100–1000 MB |
| # of Tasks | FPRM/sec | PM/sec | RM/sec |
|---|---|---|---|
| 1000 | 8900 | 9500 | 12,540 |
| 3000 | 18,865 | 21,608 | 25,243 |
| 5000 | 30,988 | 40,512 | 50,020 |
| 8000 | 55,796 | 69,214 | 85,600 |
| 10,000 | 110,796 | 130,214 | 150,600 |
| # of Tasks | FPRM/Milsec | PM/Milsec | RM/Milsec |
|---|---|---|---|
| 1000 | 33,000 | 59,000 | 98,000 |
| 3000 | 105,000 | 189,000 | 312,000 |
| 5000 | 190,000 | 375,000 | 965,000 |
| 8000 | 318,000 | 796,000 | 1,628,000 |
| 10,000 | 420,000 | 940,000 | 2,230,000 |
Publisher’s Note: MDPI stays neutral with regard to jurisdictional claims in published maps and institutional affiliations. |
© 2022 by the authors. Licensee MDPI, Basel, Switzerland. This article is an open access article distributed under the terms and conditions of the Creative Commons Attribution (CC BY) license (https://creativecommons.org/licenses/by/4.0/).
Share and Cite
Mostafa, N.; Aly, W.H.F.; Alabed, S.; Al-Arnaout, Z. Intelligent Replica Selection in Edge and IoT Environments Using Artificial Neural Networks. Electronics 2022, 11, 2531. https://doi.org/10.3390/electronics11162531
Mostafa N, Aly WHF, Alabed S, Al-Arnaout Z. Intelligent Replica Selection in Edge and IoT Environments Using Artificial Neural Networks. Electronics. 2022; 11(16):2531. https://doi.org/10.3390/electronics11162531
Chicago/Turabian StyleMostafa, Nour, Wael Hosny Fouad Aly, Samer Alabed, and Zakwan Al-Arnaout. 2022. "Intelligent Replica Selection in Edge and IoT Environments Using Artificial Neural Networks" Electronics 11, no. 16: 2531. https://doi.org/10.3390/electronics11162531
APA StyleMostafa, N., Aly, W. H. F., Alabed, S., & Al-Arnaout, Z. (2022). Intelligent Replica Selection in Edge and IoT Environments Using Artificial Neural Networks. Electronics, 11(16), 2531. https://doi.org/10.3390/electronics11162531