
Research on Cosine-Sum Windows with Maximum Side-Lobe Decay for High Precision ADC Spectral Testing

Abstract
:1. Introduction
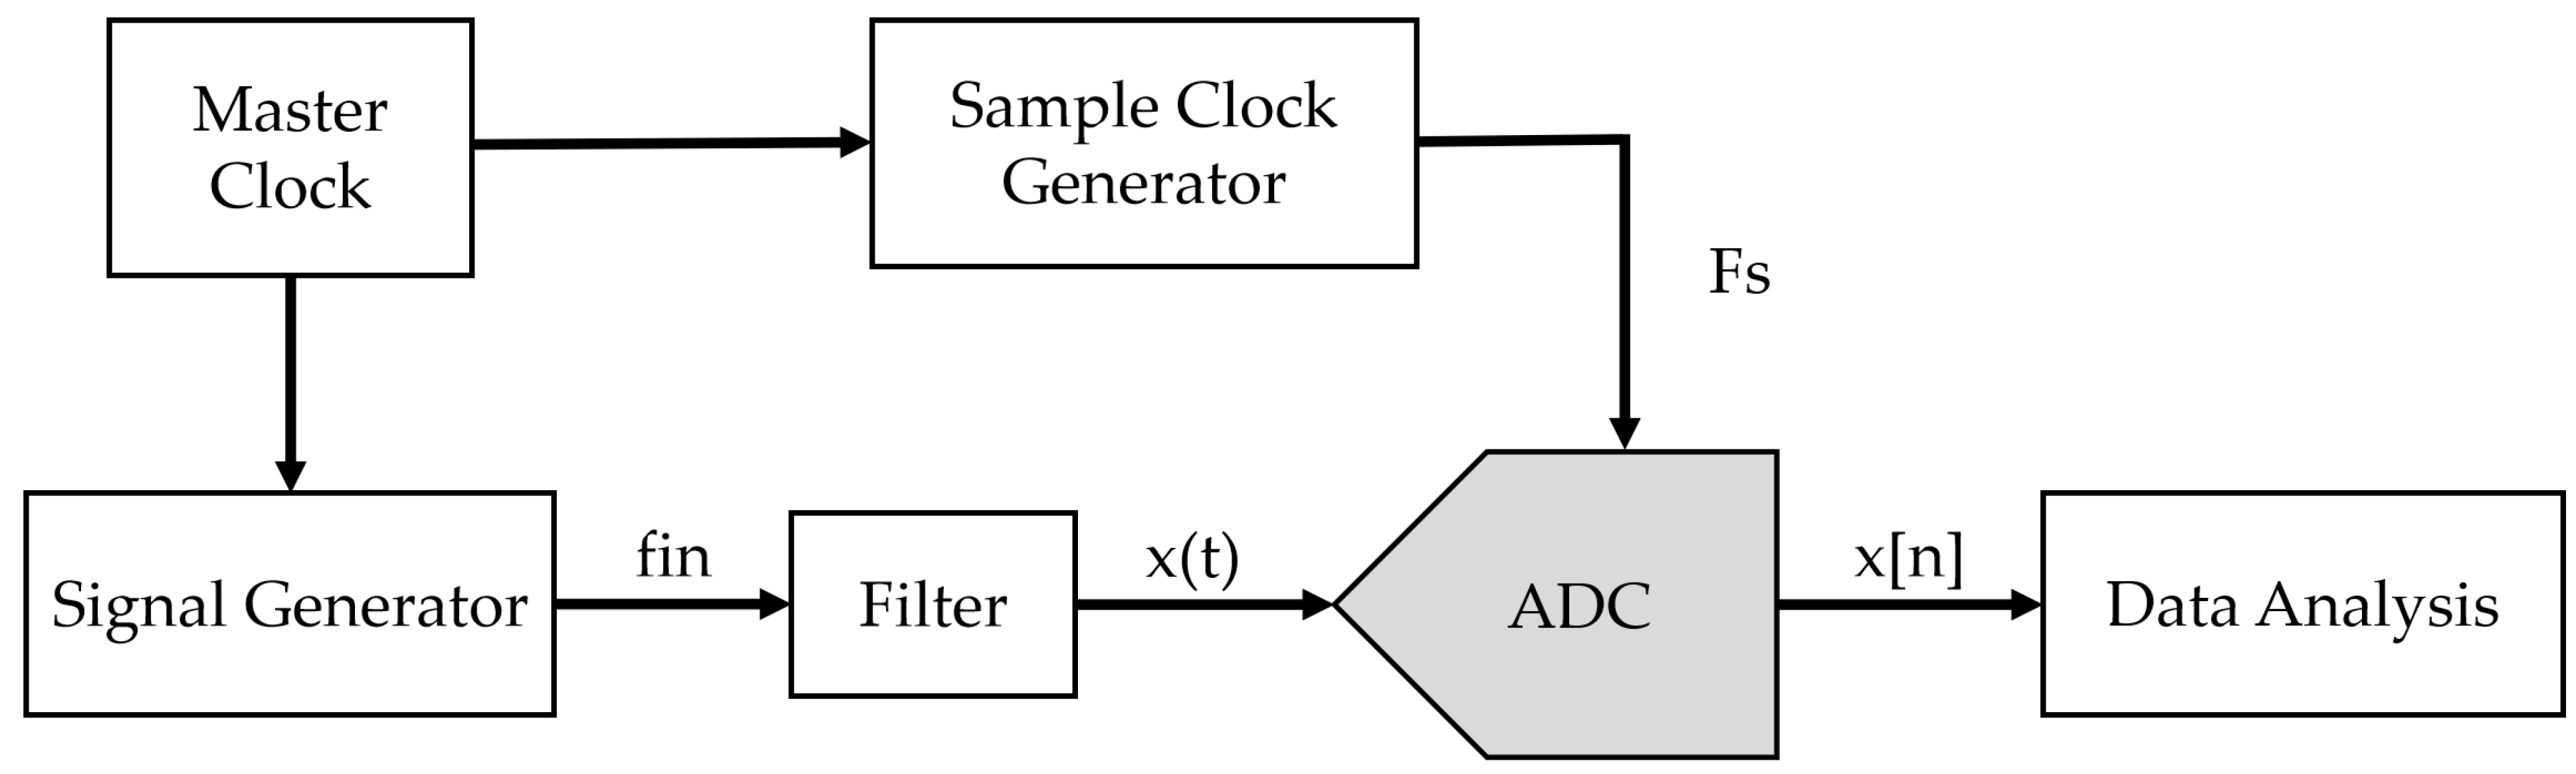
2. ADC Spectral Testing
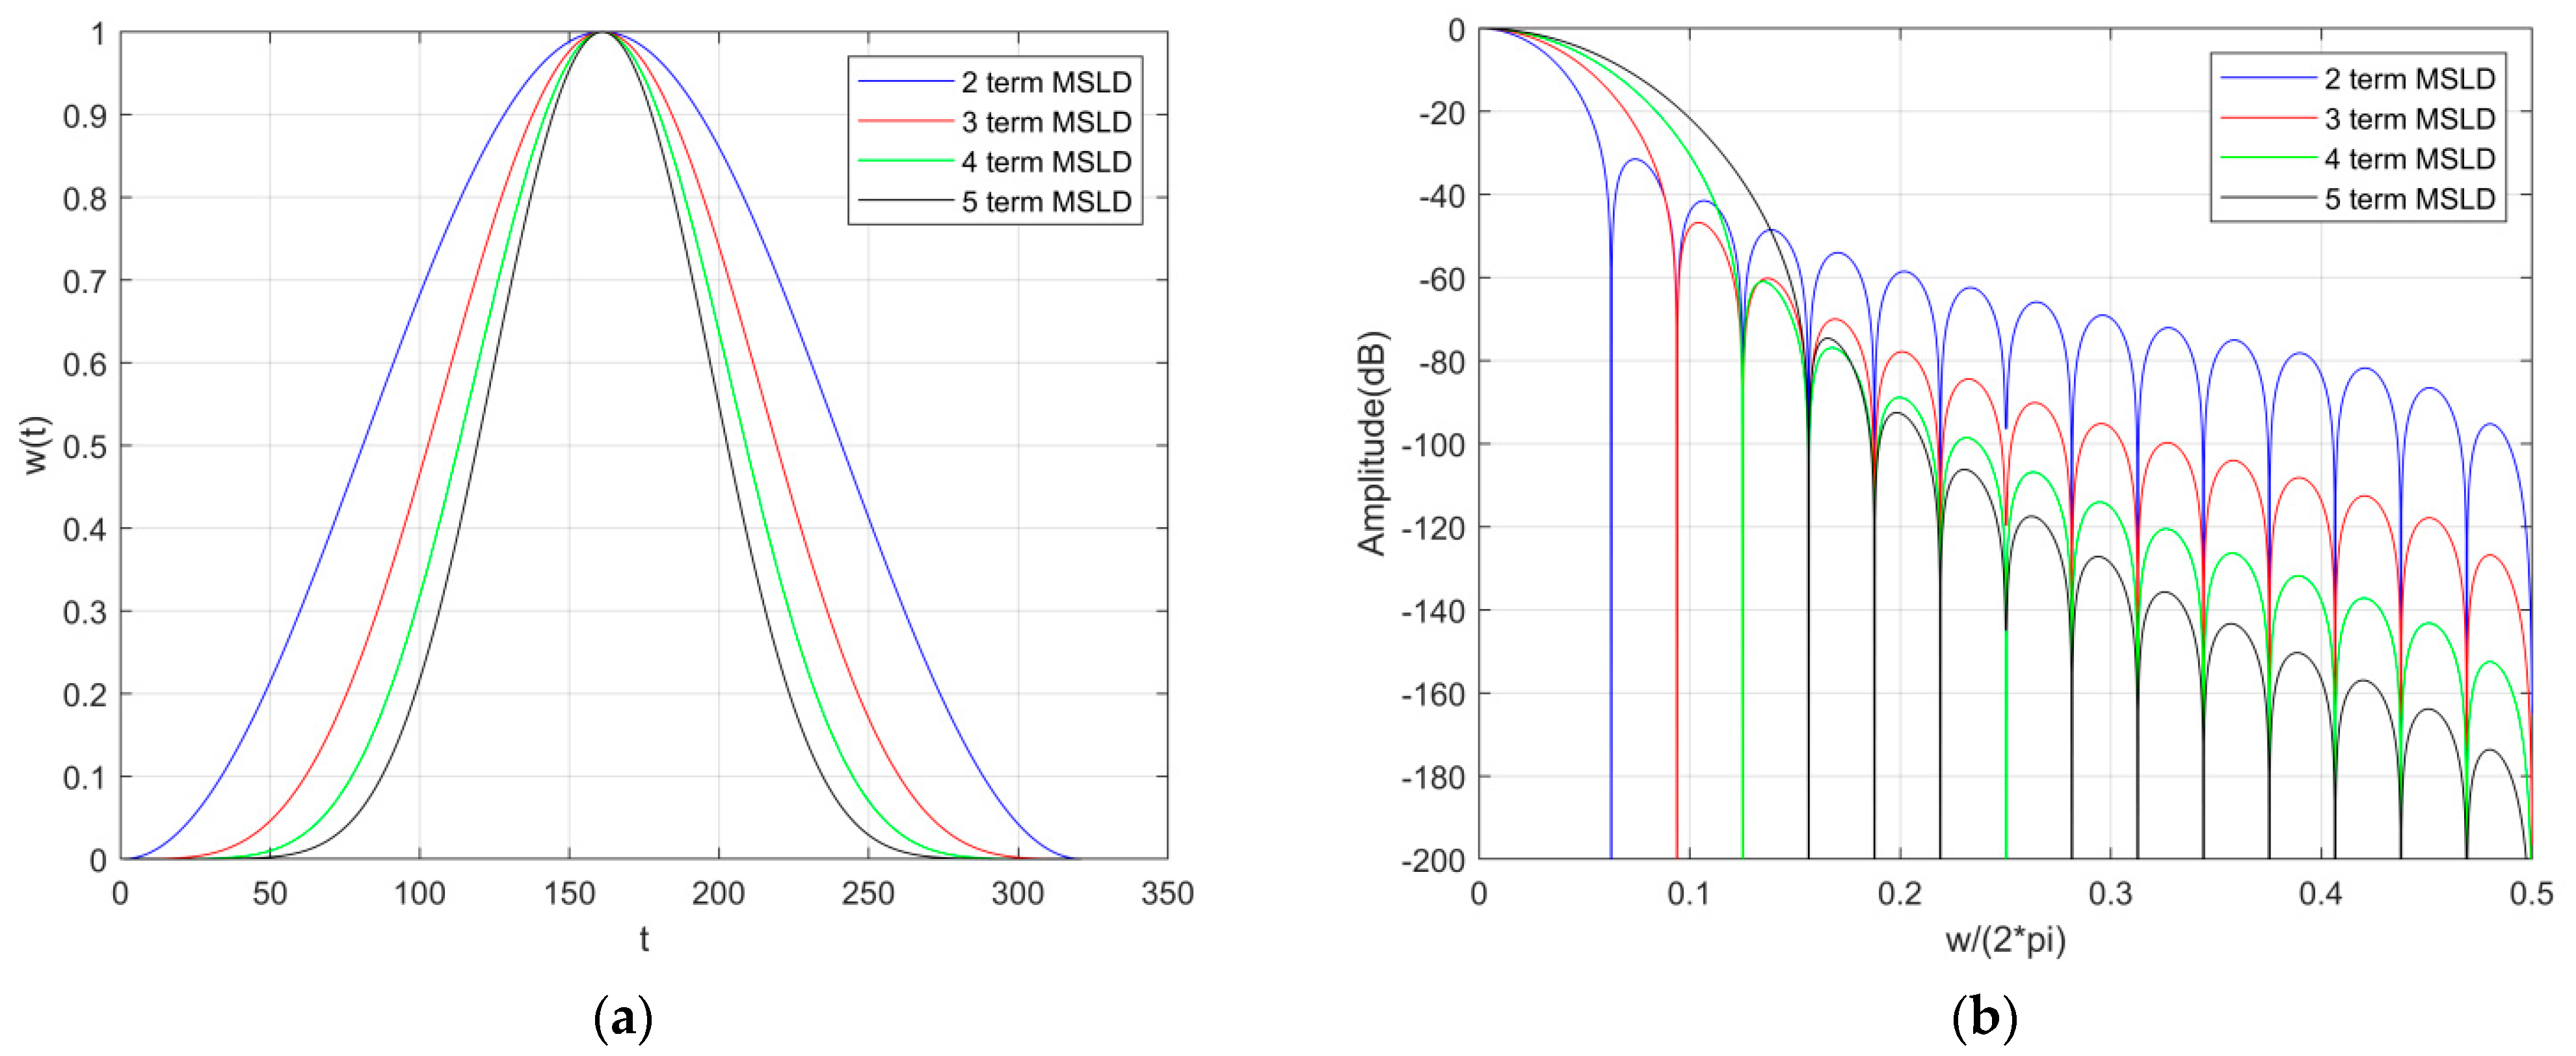
3. The Maximum Side-Lobe Decay Windows
4. Simulation Results
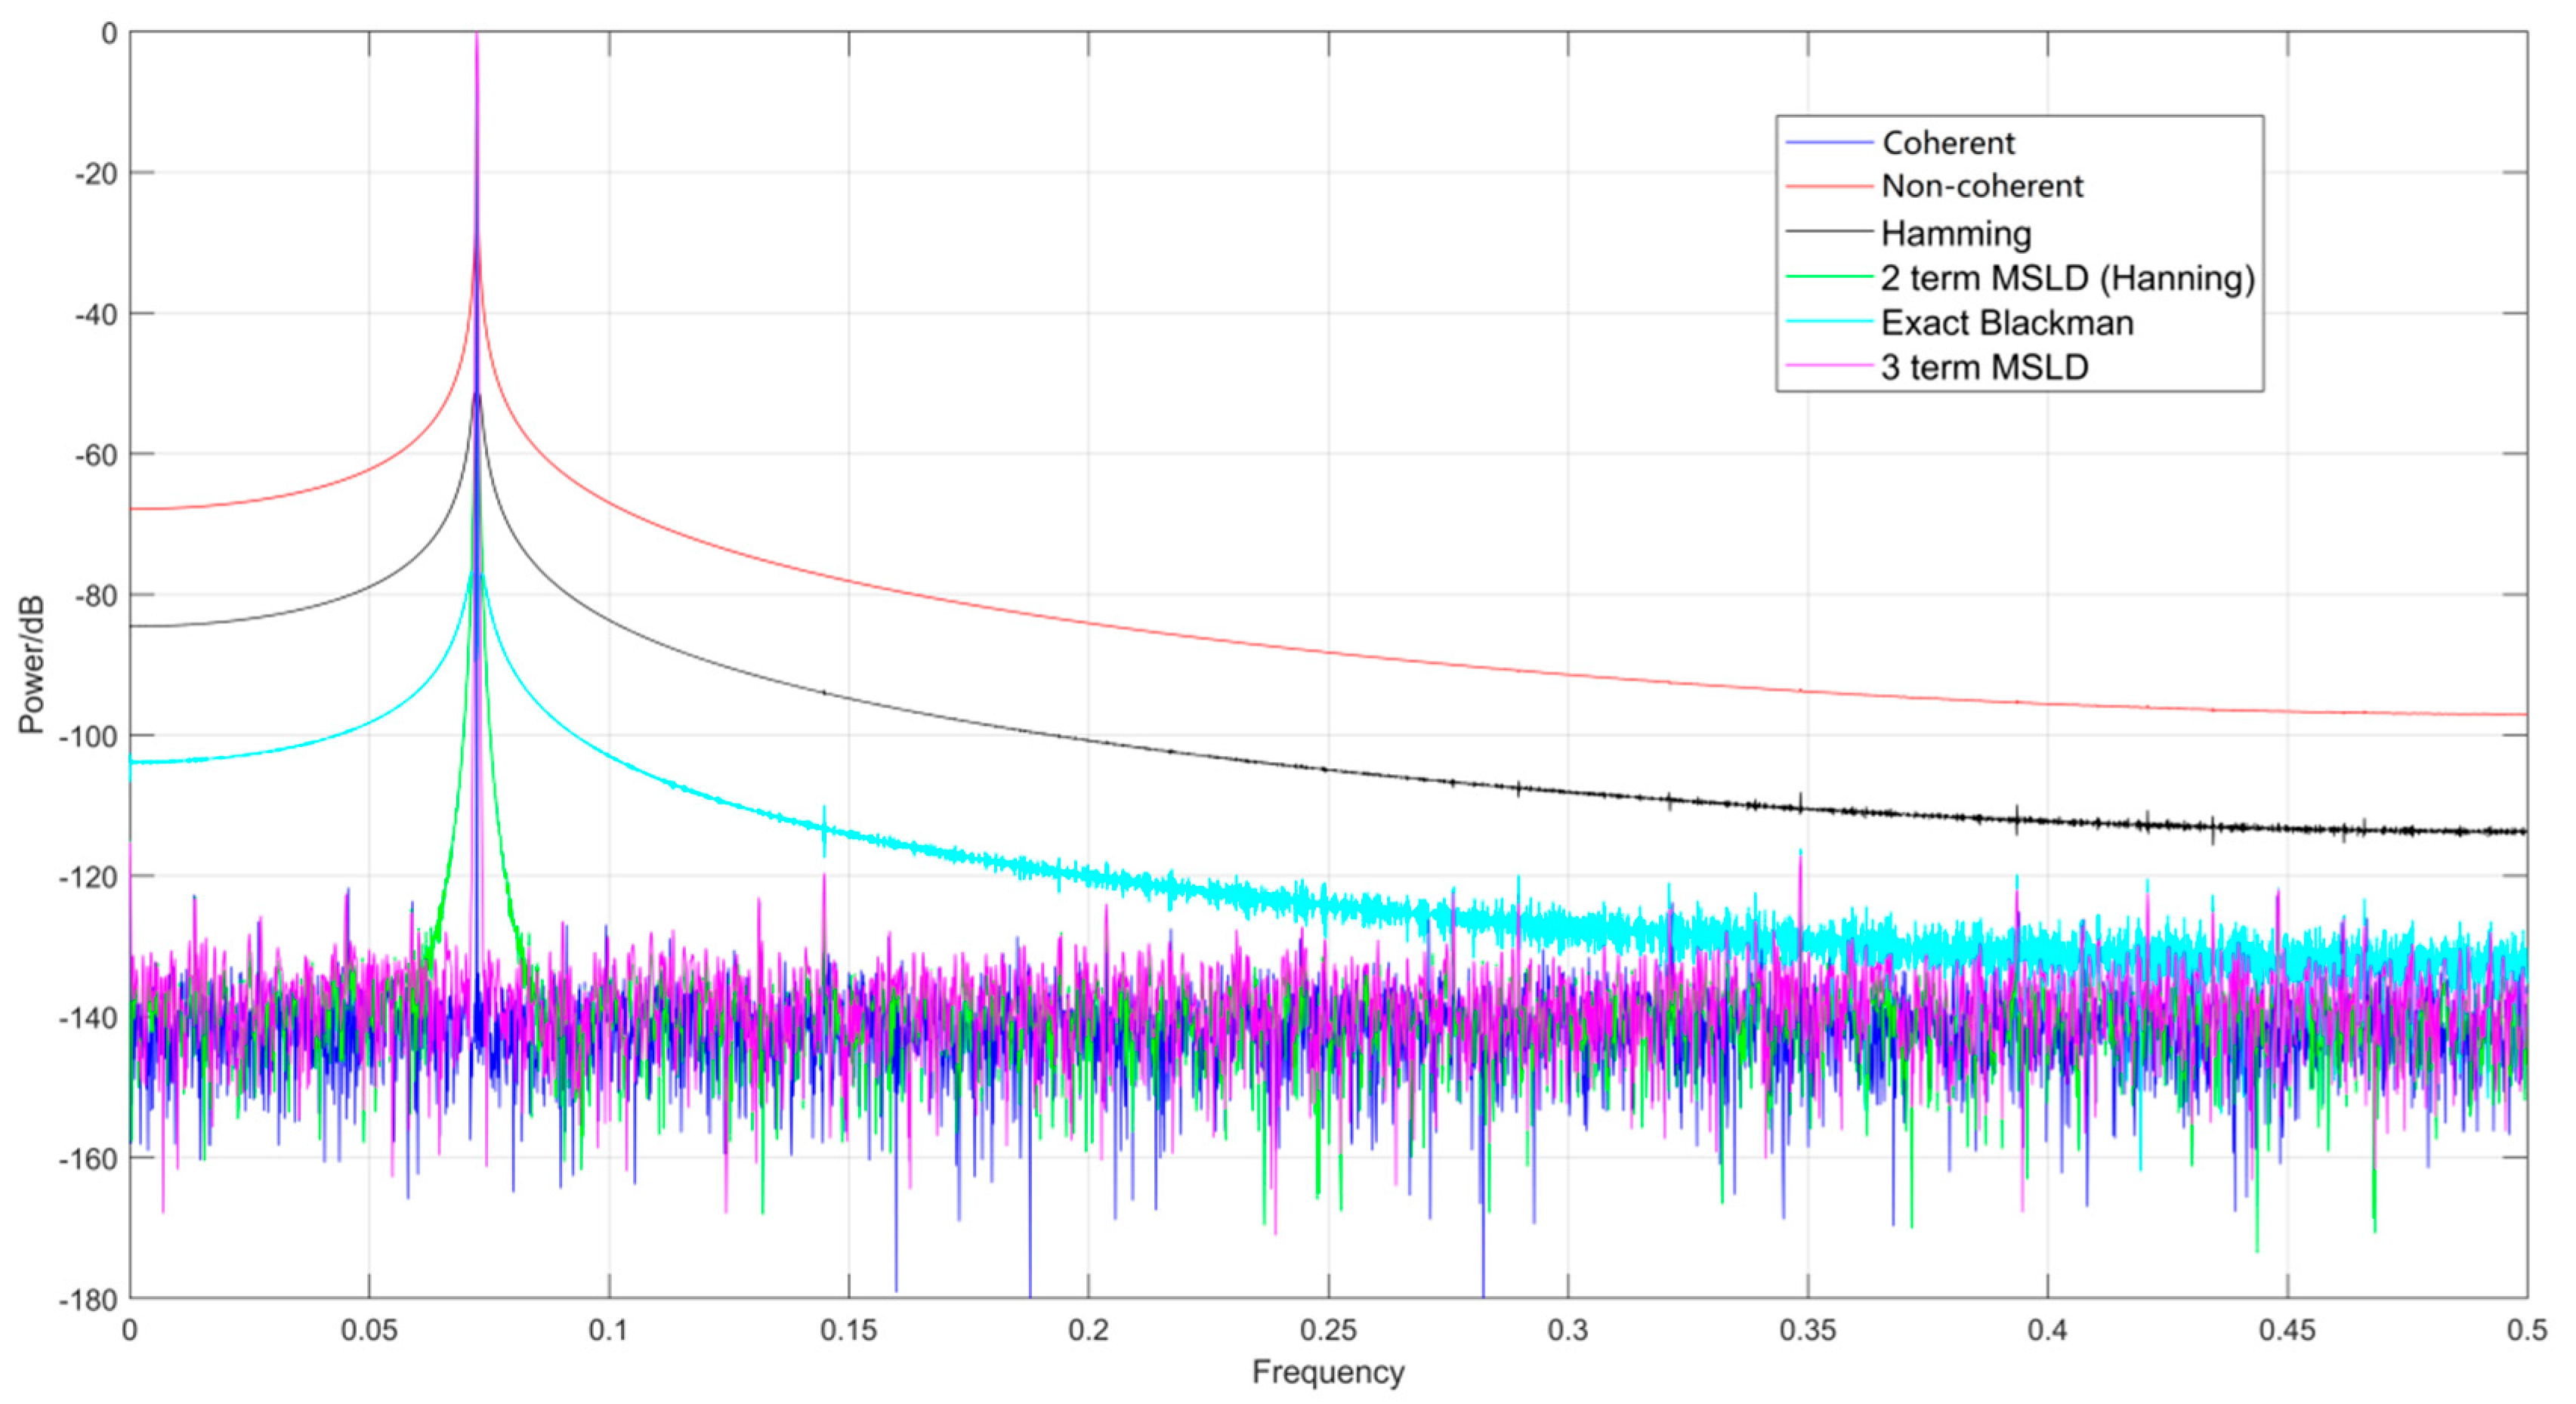
4.1. Functionality
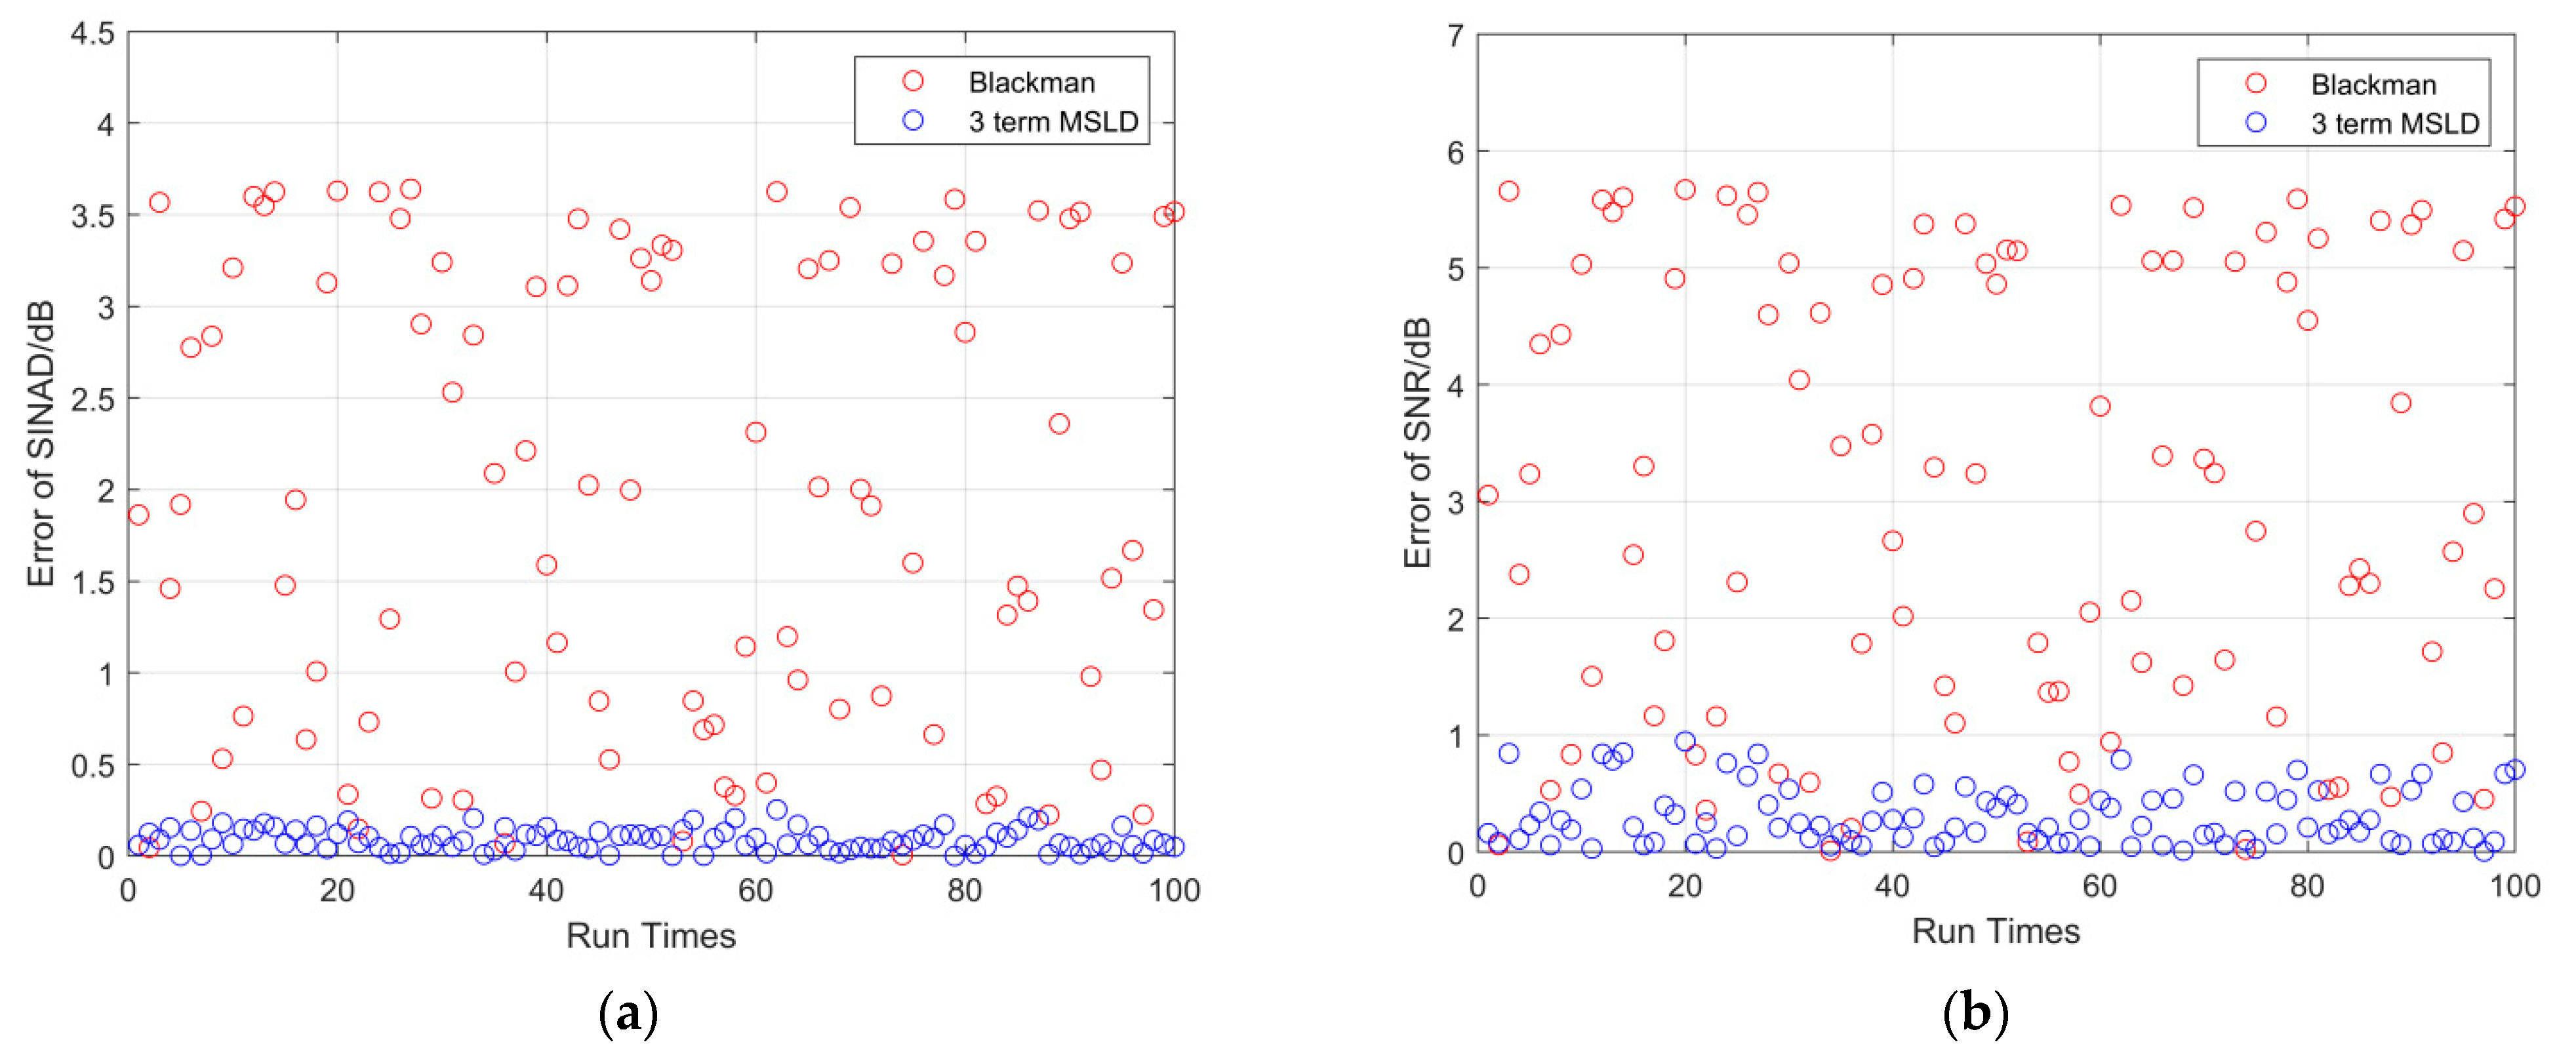
4.2. Robustness
4.3. Computation Time
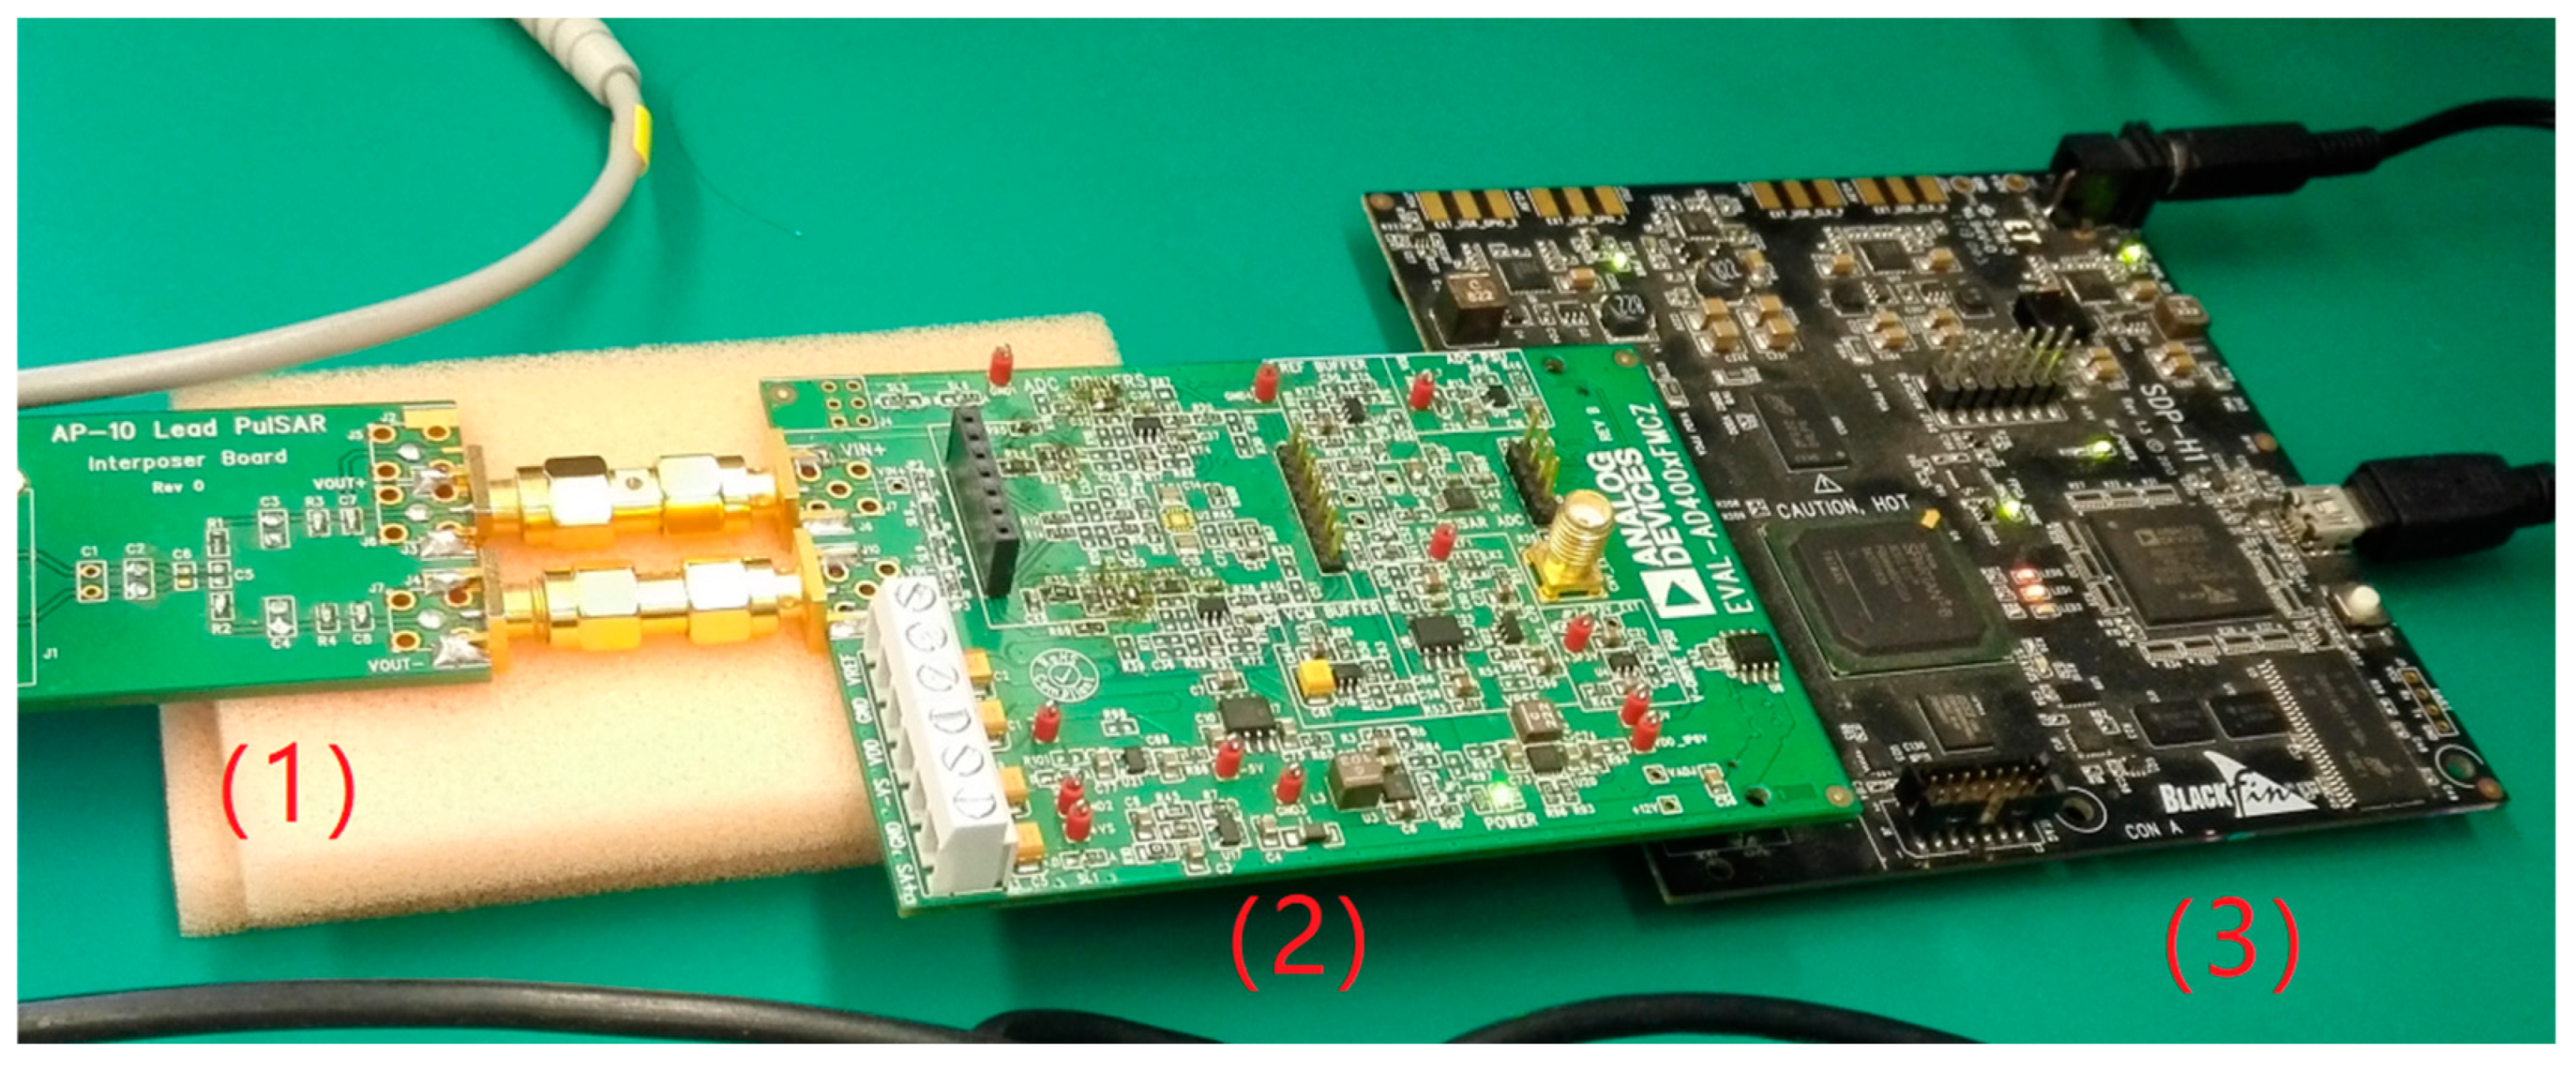
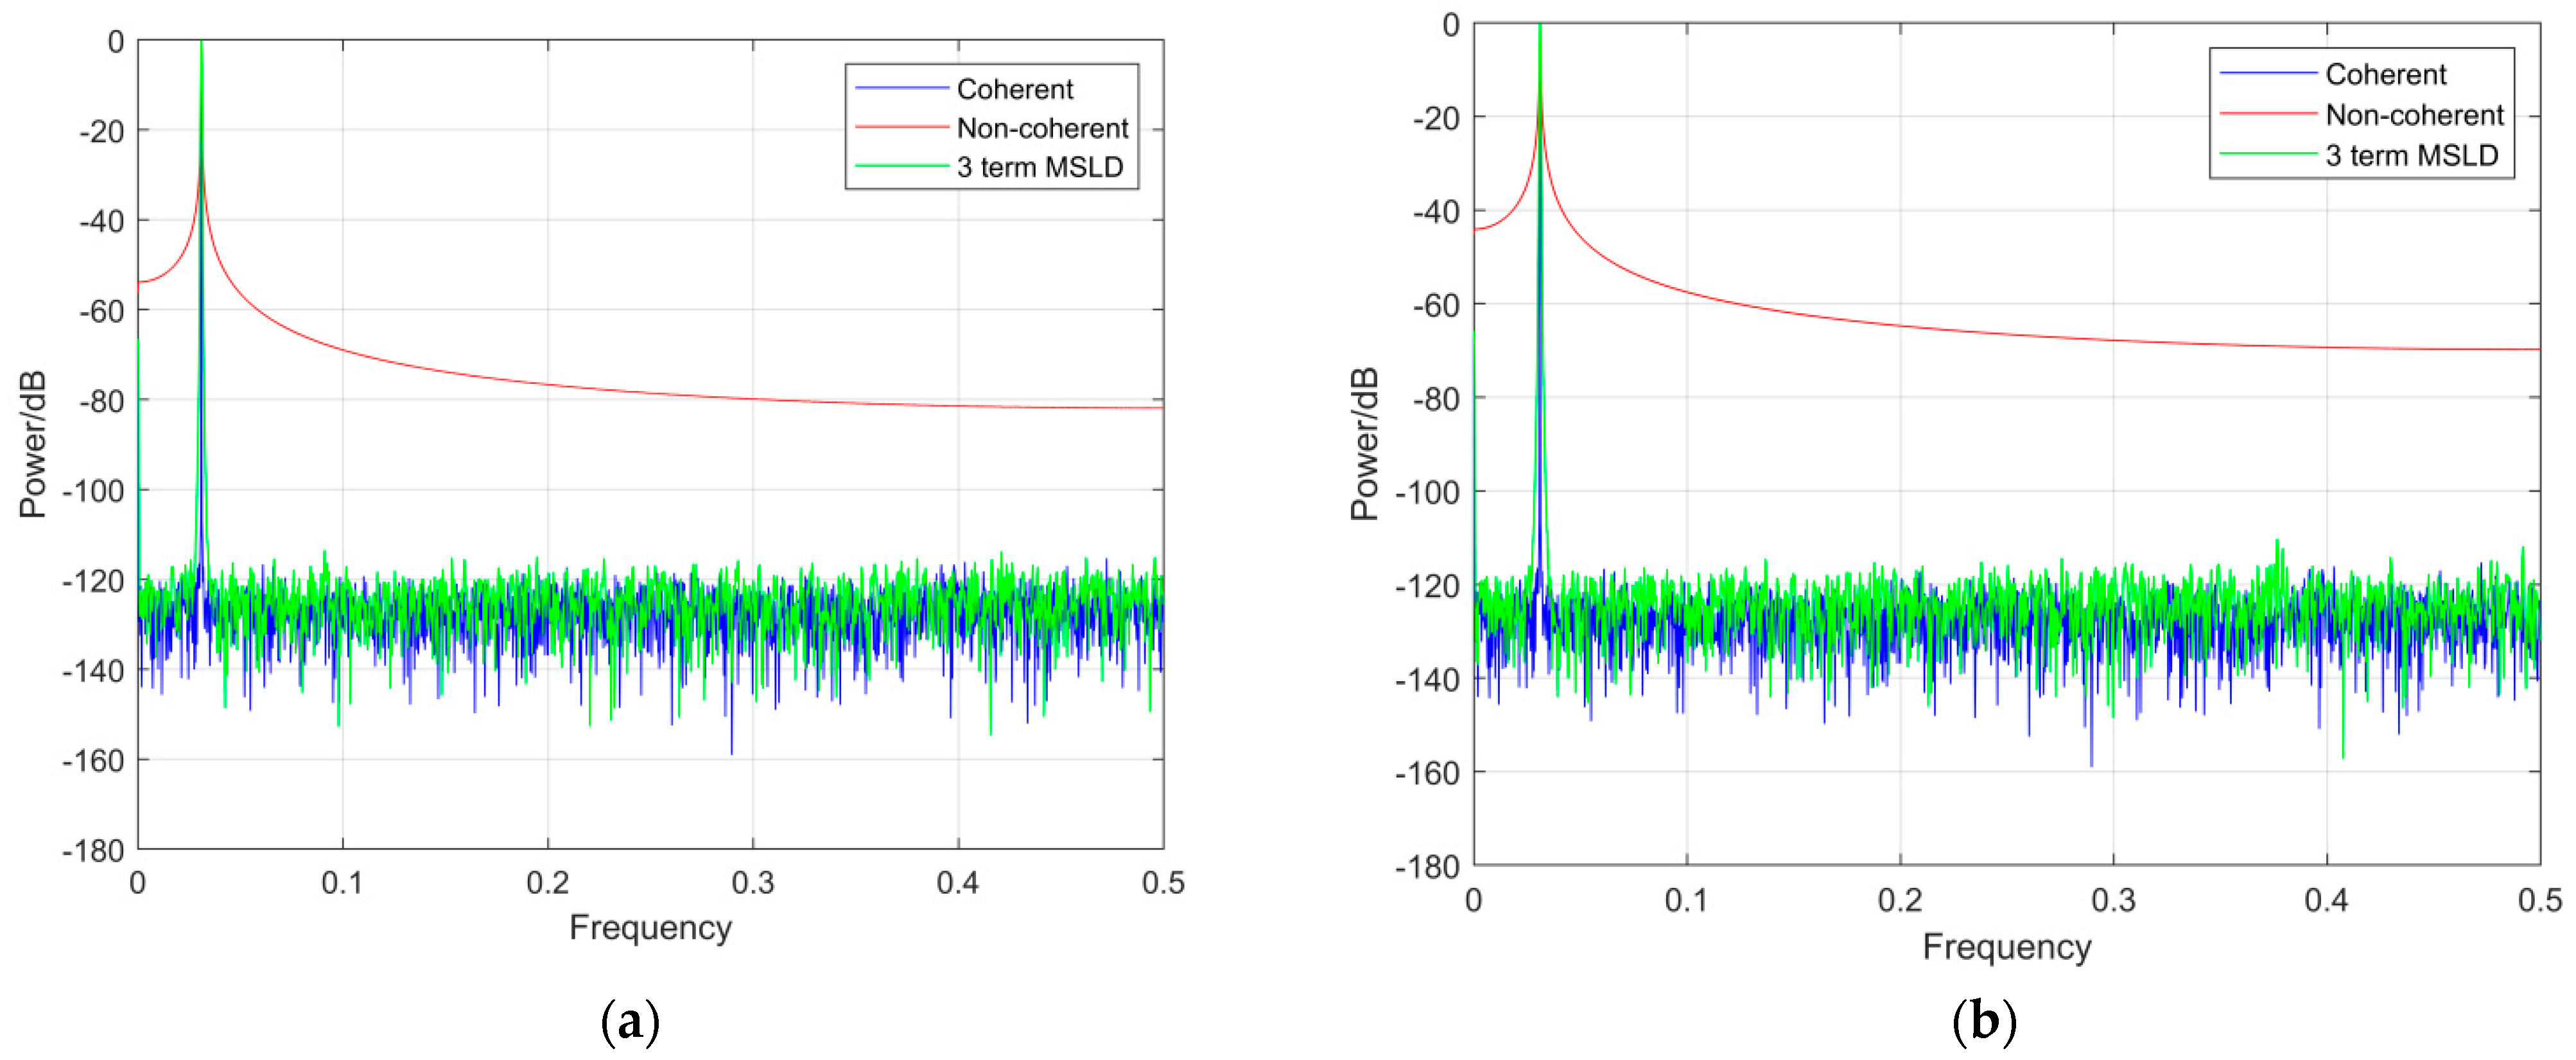
5. Experimental Results
6. Conclusions
Author Contributions
Funding
Institutional Review Board Statement
Informed Consent Statement
Data Availability Statement
Acknowledgments
Conflicts of Interest
References
- Oppenheim, A.; Schafer, R. Discrete-Time Signal Processing; Prentice Hall: Englewood Cliffs, NJ, USA, 1999. [Google Scholar]
- Burns, M.; Roberts, G. An Introduction to Mixed-Signal IC Test and Measurement; Oxford University Press: Oxford, NY, USA, 2012. [Google Scholar]
- Kester, W. Analog-Digital Conversion; Analog Devices, Inc.: Norwood, MA, USA, 2004. [Google Scholar]
- IEEE Std. 1057TM-2007; IEEE Standard for Digitizing Waveform Recorders. IEEE: New York, NY, USA, 2008.
- IEEE Std. 1241TM-2010; IEEE Standard for Terminology and Test Methods for Analog to Digital Converters. IEEE: New York, NY, USA, 2011.
- IEEE Std. 1658TM-2011; IEEE Standard for Terminology and Test Methods of Digital-to-Analog Converter Devices. IEEE: New York, NY, USA, 2011.
- Chen, P.; Yin, J.; Zhang, F.; Mak, P.; Martins, R.; Staszewski, R. Mismatch Analysis of DTCs With an Improved BIST-TDC in 28-nm CMOS. IEEE Trans. Circuits Syst. I 2022, 69, 196–206. [Google Scholar] [CrossRef]
- Xie, C.; Li, X.; Lei, Y.; Chen, H.; Song, Z. BIST-Based Fault Diagnosis for PCM With Enhanced Test Scheme and Fault-Free Region Finding Algorithm. IEEE Trans. Very Large Scale Integr. (VLSI) Syst. 2020, 28, 1652–1664. [Google Scholar] [CrossRef]
- Kohtani, M.; Murakami, T.; Utagawa, Y.; Arai, T.; Yamaura, S. 76- to 81-GHz CMOS Built-In Self-Test With 72-dB C/N and Less Than 1 ppm Frequency Tolerance for Multi-Channel Radar Applications. IEEE J. Solid-State Circuits 2021, 56, 1345–1359. [Google Scholar] [CrossRef]
- Shah, S.; Hasler, J. Tuning of Multiple Parameters with a BIST System. IEEE Trans. Circuits Syst. I 2017, 64, 1772–1780. [Google Scholar] [CrossRef]
- Emara, A.; Romanov, D.; Roberts, G.; Aouini, S.; Ziabakhsh, S.; Parvizi, M.; Ben-Hamida, N. An Area-Efficient High-Resolution Segmented ΣΔ-DAC for Built-In Self-Test Applications. IEEE Trans. Very Large Scale Integr. (VLSI) Syst. 2021, 29, 1861–1874. [Google Scholar] [CrossRef]
- Pintelon, R.; Schoukens, J. An improved sine-wave fitting procedure for characterizing data acquisition channels. IEEE Trans. Instrum. Meas. 1996, 45, 588–593. [Google Scholar] [CrossRef]
- Belega, D.; Petri, D.; Dallet, D. Amplitude and Phase Estimation of Real-Valued Sine Wave via Frequency-Domain Linear Least-Squares Algorithms. IEEE Trans. Instrum. Meas. 2018, 67, 1065–1077. [Google Scholar] [CrossRef]
- Pálfi, V.; Kollár, I. Acceleration of the ADC Test with Sine-Wave Fit. IEEE Trans. Instrum. Meas. 2013, 62, 880–888. [Google Scholar] [CrossRef]
- Lapuh, R. Estimating the Fundamental Component of Harmonically Distorted Signals from Noncoherently Sampled Data. IEEE Trans. Instrum. Meas. 2015, 64, 1419–1424. [Google Scholar] [CrossRef]
- Sudani, S.; Wu, M.; Chen, D. A novel robust and accurate spectral testing method for non-coherent sampling. In Proceedings of the IEEE International Test Conference (ITC), Anaheim, CA, USA, 20–22 September 2011. [Google Scholar]
- Sudani, S.; Chen, D. FIRE: A Fundamental Identification and Replacement Method for Accurate Spectral Test Without Requiring Coherency. IEEE Trans. Instrum. Meas. 2013, 62, 3015–3025. [Google Scholar] [CrossRef]
- Zhuang, Y.; Chen, D. Accurate Spectral Testing with Non-Coherent Sampling for Multi-Tone Test. IEEE Trans. Circuits Syst. II 2017, 64, 1357–1361. [Google Scholar] [CrossRef]
- Wu, M.; Ban, C.; Xu, J.; Geng, L.; Chen, D. MIRE: A Multitone Identification and Replacement Method for Multitone Spectral Test Without Requiring Coherent Sampling. IEEE Trans. Instrum. Meas. 2020, 69, 4578–4591. [Google Scholar] [CrossRef]
- Sudani, S.; Xu, L.; Chen, D. A Comparative Study of State-of-the-Art High-Performance Spectral Test Methods. IEEE Des. Test 2015, 32, 26–35. [Google Scholar] [CrossRef]
- Harris, F. On the use of windows for harmonic analysis with the discrete Fourier transform. Proc. IEEE 1978, 66, 51–83. [Google Scholar] [CrossRef]
- Belega, D.; Ciugudean, M.; Stoiciu, D. Choice of the cosine-class windows for ADC dynamic testing by spectral analysis. Measurement 2007, 40, 361–371. [Google Scholar] [CrossRef]
- Huang, S.; Fan, X.; Liu, S.; Yang, S. Research on Optimized Combined Cosine Windows with Maximum Side Lobe Decay for Harmonic Analysis. In Proceedings of the International Conference on Intelligent Computation Technology and Automation (ICICTA), Changsha, China, 10–11 October 2009. [Google Scholar]
- Albrecht, H. Tailoring of Minimum Sidelobe Cosine-Sum Windows for High-Resolution Measurements. Signal Process. J. 2010, 3, 20–29. [Google Scholar]
- Sato, K.; Ishida, T.; Okamoto, T.; Ichikawa, T.; Wei, J.; Nakatani, T.; Zhao, Y.; Katayama, S.; Yamamoto, S.; Kuwana, A.; et al. Revisit to Accurate ADC Testing with Incoherent Sampling Using Proper Sinusoidal Signal and Sampling Frequencies. In Proceedings of the IEEE International Test Conference (ITC), Anaheim, CA, USA, 10–15 October 2021. [Google Scholar]


| Window | Coefficient | Largest Side-Lobe Level (dB) | Decay Rate (dB/Octave) |
|---|---|---|---|
| 2-term (Hanning) | a0 = 0.5 a1 = 0.5 | −31.47 | 18 |
| 3-term | a0 = 0.375 a1 = 0.5 a2 = 0.125 | −46.74 | 30 |
| 4-term | a0 = 0.3125 a1 = 0.46875 a2 = 0.1875 a3 = 0.03125 | −62.54 | 42 |
| 5-term | a0 = 0.2734375 a1 = 0.4375 a2 = 0.21875 a3 = 0.0625 a4 = 0.0078125 | −74.61 | 54 |
| Windows | The Largest Side-Lobe Level (dB) | Decay Rate (dB/Octave) |
|---|---|---|
| Hamming (2-term) | −43.19 | 6 |
| 2-term MSLD | −31.47 | 18 |
| Blackman (3-term) | −58.11 | 18 |
| Exact Blackman (3-term) | −68.24 | 6 |
| Blackman-Harris (3-term) | −62.05 | 6 |
| Minimum Blackman (3-term) | −70.83 | 6 |
| 3-term MSLD | −46.74 | 30 |
| Minimum Blackman (4-term) | −92.01 | 6 |
| 4-term MSLD | −62.54 | 42 |
| Rife-Vincent (5-term) | −75.29 | 6 |
| 5-term MSLD | −74.61 | 54 |
| SINAD (dB) | SNR (dB) | THD (dB) | SFDR (dB) | |
|---|---|---|---|---|
| Coherent | 102.733 | 102.888 | −117.287 | 119.992 |
| Non-coherent | 23.007 | 23.007 | −69.679 | 70.504 |
| Hamming | 45.789 | 45.789 | −87.621 | 88.454 |
| 2-term MSLD (Hanning) | 85.159 | 85.162 | −117.253 | 119.418 |
| Exact Blackman | 66.226 | 66.227 | −107.334 | 108.321 |
| 3-term MSLD | 102.642 | 102.785 | −117.519 | 119.307 |
| Method | Time (ms) | Functionality |
|---|---|---|
| Hamming | 0.71 | Inaccurate |
| Exact Blackman | 1.16 | Inaccurate |
| 3-term MSLD (Proposed) | 1.07 | Accurate |
| Method in [17] | 9.34 | Accurate |
| Method in [14] | >15 | Accurate |
| SINAD | SNR | THD | SFDR | |
|---|---|---|---|---|
| Coherent | 92.634 | 92.675 | −112.851 | 117.659 |
| Non-coherent (J = 127.13) | 21.855 | 21.859 | −53.186 | 54.496 |
| 3-term MSLD (J = 127.13) | 92.836 | 92.885 | −112.308 | 115.481 |
| Non-coherent (J = 127.45) | 14.292 | 14.296 | −44.801 | 46.271 |
| 3-term MSLD (J = 127.45) | 93.137 | 93.190 | −112.325 | 115.283 |
Publisher’s Note: MDPI stays neutral with regard to jurisdictional claims in published maps and institutional affiliations. |
© 2022 by the authors. Licensee MDPI, Basel, Switzerland. This article is an open access article distributed under the terms and conditions of the Creative Commons Attribution (CC BY) license (https://creativecommons.org/licenses/by/4.0/).
Share and Cite
Fu, J.; Yang, Z.; Song, J.; Zhan, Y.; Qiao, S. Research on Cosine-Sum Windows with Maximum Side-Lobe Decay for High Precision ADC Spectral Testing. Electronics 2022, 11, 2037. https://doi.org/10.3390/electronics11132037
Fu J, Yang Z, Song J, Zhan Y, Qiao S. Research on Cosine-Sum Windows with Maximum Side-Lobe Decay for High Precision ADC Spectral Testing. Electronics. 2022; 11(13):2037. https://doi.org/10.3390/electronics11132037
Chicago/Turabian StyleFu, Jiangduo, Zhong Yang, Jiayin Song, Yi Zhan, and Shushan Qiao. 2022. "Research on Cosine-Sum Windows with Maximum Side-Lobe Decay for High Precision ADC Spectral Testing" Electronics 11, no. 13: 2037. https://doi.org/10.3390/electronics11132037
APA StyleFu, J., Yang, Z., Song, J., Zhan, Y., & Qiao, S. (2022). Research on Cosine-Sum Windows with Maximum Side-Lobe Decay for High Precision ADC Spectral Testing. Electronics, 11(13), 2037. https://doi.org/10.3390/electronics11132037