Abstract
Detecting stress when performing physical activities is an interesting field that has received relatively little research interest to date. In this paper, we took a first step towards redressing this, through a comprehensive review and the design of a low-cost body area network (BAN) made of a set of wearables that allow physiological signals and human movements to be captured simultaneously. We used four different wearables: OpenBCI and three other open-hardware custom-made designs that communicate via bluetooth low energy (BLE) to an external computer—following the edge-computingconcept—hosting applications for data synchronization and storage. We obtained a large number of physiological signals (electroencephalography (EEG), electrocardiography (ECG), breathing rate (BR), electrodermal activity (EDA), and skin temperature (ST)) with which we analyzed internal states in general, but with a focus on stress. The findings show the reliability and feasibility of the proposed body area network (BAN) according to battery lifetime (greater than 15 h), packet loss rate (0% for our custom-made designs), and signal quality (signal-noise ratio (SNR) of 9.8 dB for the ECG circuit, and 61.6 dB for the EDA). Moreover, we conducted a preliminary experiment to gauge the main ECG features for stress detection during rest.
Keywords:
wearable; emotion; stress; human activity recognition; EDA; ECG; EEG; BR; ST; inertial units 1. Introduction
The wearable technology market has mushroomed over the last decade, along with the development of the Internet of Things (IoT), and this trend shows no sign of abating (https://www.grandviewresearch.com/industry-analysis/global-wearable-sensor-market, accessed on 24 November 2021). Human movement analysis (HMA) using wearable inertial sensors has become a new research hotspot due to its extensive use in a large variety of application domains such as health-care, sports tracking, fitness, game console design, and smart homes. Attention has focused especially on the benefits that these devices have on people’s health [1]. Several studies have demonstrated its efficacy in controlling people’s weight [2], creating adherence to physical activity (PA) [3,4,5], regulating the intensity of PA; especially for those who have suffered from heart failure [6], assessing rehabilitation exercises [7,8], reducing sedentary behavior (SB) [9] for the elderly [10,11], etc.
We are interested in measuring the induced psychological stress on physiological signals when people perform different activities. The resulting information could be used to adapt the level or intensity of the activity being performed, or change the ambient conditions where possible. Applied to PA, for example, the goal would be to create adherence to certain programs, increasing the time working out, and reducing the SB by dynamically adapting the intensity of the exercise and/or adding motivating elements to the environment.
Emotion recognition and HMA detection might require wearable devices containing motion-sensitive elements (such as inertial units), and specific circuits that measure subtle physiological changes in bio-electrical signals caused by variations in the emotional state. Detecting stress when performing physical activities has received growing interest in the last years and it is an emerging research topic. Real applications involve the development of tasks that can become very challenging. The challenges can be summarized as follows:
- The need for a low-cost framework with a design that allows capturing physiological signals and human movements through wearables at the same time. Data generated and collected play a key role in the stress response. Therefore, data quality is essential to ensure the best information possible.
- As body area networks generate large volumes of data, the need to manage and maintain these datasets is of great importance.
- The assessment of a wide range of physiological signals could help to better understand the mechanisms of the stress response with different persons and situations.
- Selection of features to produce a good performance using a low number of features at a low computational cost. A reduced number of features reduces the risk of overfitting while a low computational cost contributes to implementing real-time systems using wearable electronics.
- The autonomy of wearable devices is a critical factor during device engineering.
In this work, we outline the first steps towards this goal and provide a complete description of the devices and optimal wearable placements for HMA. The devices included in this network measure a great variety of physiological signals in real time and send the information to a remote computer for their storage and synchronization. The collected raw data involves a starting point for researchers to analyze the subject’s emotional states and the identification of the PA. In summary, the main contributions of this work are as follows:
- This paper includes a comprehensive review of state-of-the-art technologies focusing especially on current status and research trends.
- We propose a new wearable low-cost body network with three own designs and an overall of thirteen different measurements.
- Experimental results validate the proposal through the analysis of some functional characteristics such as the signal quality, the packet loss rate, and the battery life.
- A preliminary study is conducted in order to extract the main ECG features for stress detection during rest.
The rest of this paper is organized as follows. A review of related work is presented in Section 1.1. Then the details of our proposed BAN are introduced in Section 2. Section 3 describes the methodology while results and discussion are presented in Section 4 and Section 5, respectively. Finally, the last section concludes this paper and suggests some future work.
1.1. Related Works
1.1.1. Human Movement Analysis (HMA)
The taxonomy of applications for HMA involves (1) motion measurement, or (2) its classification. In the former, kinematic measures from different body parts, such as velocity, acceleration, or orientation, are obtained to assess range of motion (ROM), the intensity of physical exercise, its quality, or another characteristic. In the latter, the aim is to detect or identify, the human movement or activity.
On the upper limbs, typical placements include putting the inertial unit on a glove, in a watch, or on an armband, to detect fingers, hand, or arm movements, respectively. On the lower limbs, these devices can be integrated into an insole of a shoe, placed at the ankle, calf, and/or thigh, and are very useful for detecting displacements at different speeds or for the analysis of walking quality. On the trunk, studies have placed the wearables at different positions on the back, chest, waist, or hip to identify activities such as walking, running, lying, standing, etc. Finally, on the head, they are usually included in a headband or placed behind the ears [12].
PA is an example of human activity that can be classified into four groups depending on its intensity: very low, low, medium, and high [13]. Lying down, eating, walking, or running are examples of activities sorted from very low to high intensity. Other activities can be considered transitional. For example, lying on a bed or standing still are two very low-intensity activities, while getting up is a transition between them.
Table 1 and Table 2 summarize a review of recent works, sorted by year of publication, related to human activity recognition through wearables, while Figure 1 depicts some relevant conclusions. Overall, most of the studies detected a variable number of human activities, from one to nine, including the identification of sports [14,15,16], activities of daily living (ADL) [17,18,19], also featuring house activities [20] such as washing, shelving items, sweeping, ironing, vacuuming, driving, etc. In most studies, the typical attempted activities were: walking, jogging, standing, sitting, lying, squatting, going upstairs/downstairs, running, among others. Some papers also included the recognition of coughing [21] or the phases associated to drinking [22]. Only a small number of studies included a greater number of activities (>20) [23,24].

Table 1.
Description of selected studies for HMA identification. Some acronyms: accelerometer (Acc), breathing rate (BR), deep belief network (DBN), Decision tree (DT), electrocardiography (ECG), extreme learning machine (ELM), electromyography (EMG), inertial measurement unit (IMU), random forest (RF), support vector machine (SVM).
Table 2.
Description of selected studies for HMA identification. Some acronyms: accelerometer (Acc), activities of daily living (ADL), breathing rate (BR), convolutional neural networks (CNN), deep learning (DL), decision tree (DT), electrocardiography (ECG), electromyography (EMG), gaussian mixture model (GMM), hierarchical hybrid classification (HHC), hidden Markov models (HMM), inertial measurement unit (IMU), nonparametric weighted feature extraction (NWFE), principal component analysis (PCA), random forest (RF).
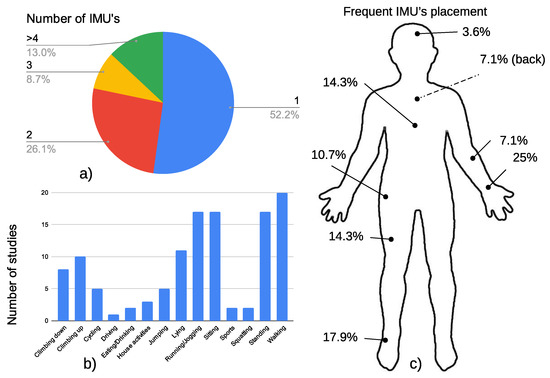
Figure 1.
Representation of (a) the number of IMUs included in the literature review, (b) the most common human activities detected, and (c) the usual sensor placement.
Detecting human movements through wearables is achieved mainly by accelerometers [30,31,32], inertial units, that also include gyroscopes or magnetometers [16,27], or the use of smartphones or smartwatches [36,38], which integrate all these elements. Other studies have also analyzed the use of a set of pressure sensors placed in a shoe insole [19] or integrated into an armband, to detect upper limb movements [22]. In turn physiological variables, such as muscular activity [14], breathing [35,37], and heart rate [21,32,36], have also demonstrated their effectiveness in measuring the intensity of the activity and improving the detection of human activity in general. Many commercial wearables use heart rate (HR) based on a photoplethysmography (PPG) circuit embedded in a smartwatch [41], which helps keep HR under a maximum limit during PA and is especially useful for people who have suffered heart failure [6].
More than half of the studies analyzed considered using only one inertial element, while fewer than 13% of them used four or more inertial units. We also analyzed the frequency of placement of these wearables. The preferred position was the the wrist [24], ankle [26], thigh [15], or chest [37].
Results showed that the accuracy was high in general, in the range [80%–100%) [28,29] using a wide variety of classifiers. Traditionally, various methods from the field of signal processing have been leveraged to distill collected sensor data. These have included k-NN [14,30,33,35], random forest (RF), decision tree (DT) [20,38], gaussian mixture model (GMM) and hidden Markov models (HMM) [16,24] or even models based exclusively on thresholds [29 ], all of which requires domain-specific expert knowledge to process raw data. Feature engineering is required to fit a model and this is expensive and not scalable. Deep learning, especially CNN, that can automatically learn intricate activity features, have gained a lot of attention in HMA task. There are currently two approaches to this last line of work those [37,39] that directly employ the collected raw sensor data for automated feature extraction using the deep neural network and those [40] that represent the time series data in a modified space that makes the feature extraction process easier by reducing the effects of noise or random variations.
The number of participants enrolled in these studies varied greatly. More than 150 people took part in [24], while other studies accomplished the experiment with very few subjects (<3) [14,17,34]. There was a median number of 10 participants in the selected studies in Table 1 and Table 2. Researchers have created various public benchmark datasets to test machine learning algorithms in HMA tasks. The following are examples of these datasets:
- UCI-HAR Dataset [42]: This was collected by University of California Irvine. The six ADL activities performed in a supervised scenario were standing, lying, walking, walking upstairs, and walking downstairs. The data were collected by triaxial angular velocity.
- OPPORTUNITY Dataset [43]: The project was conducted by the University of Sussex. They built a rich sensor environment consisting of 15 wireless and wired networked sensor systems. As a result, they collected 17 morning activity data.
- PAMAP2 Dataset [44]: This was collected by the Department of Augmented Vision German Research Center of artificial intelligence. The researchers recorded 18 activities including walking, cycling, rope jumping, etc. All subjects wore three IMUs and a heart-rate monitor.
- UniMib-SHAR Dataset [45]: This was collected by the University of Milan-Bicocca. The samples were acquired by a smartphone with Android operating system. The whole dataset was designed to monitor human activity and detect falls. A total of 30 volunteers contributed 11,771 samples.
1.1.2. Stress Detection
Phychological stress can be defined as “a state of mental or emotional strain or tension resulting from adverse or demanding circumstances” that taken to an extreme might produce distress. Like other kinds of emotions, stress can be defined by the circumplex model [46], which holds that any emotion can be represented in an N-dimensional space, where two of the coordinate axis would explain most of the emotional variations. These axis are called valence and arousal [47]. Valence is related to pleasure and varies from low values (very unpleasant) to high values (very pleasant). Arousal is related to the intensity of emotion, ranging from very low to very high.
Emotions have their origin in the brain but may indirectly affect other physiological signals [48]. Namely, stress produces an increase in the electrical activity of the sympathetic nervous system (SNS), that along with the inhibition of the parasympathetic nervous system (PSNS), makes changes in heart rate (HR), breathing rate (BR), electrodermal activity (EDA), and skin temperature (ST). Several papers have directly analyzed emotions through EEG [49,50,51,52,53] or studied their effects on variables such as HR [54,55], EDA [55,56], BR [57], or ST [56]. Combining several of these signals in a multimodal approach may benefit detection accuracy [58]. Accuracy varies depending on the number of detected emotions, extracted features and the classification method. A relatively recent review [59] found that emotion detection based on EEG signals could achieve an accuracy of 88.86% for the four emotion classes. Multimodal measurements based on ECG, EMG, and other bio-signals achieved 79.3% for four emotive states. Other techniques deal with the emotion classification based on the use of images or speech. Every frame of the visual data is analyzed to extract certain features (like anatomical landmarks). These facial features are then used to train classifiers allowing the system to estimate emotions with an accuracy of 89% [59]. Speech or voice analysis can be used as a diagnostic tool to identify frustration and stress, but the accuracy (80.46% for happiness and sadness) is not comparable to EEG or facial landmarks [59].
Table 3 summarizes some recent studies found in the scientific literature about different techniques used to detect stress and sorted in ascending order by publication year. The most analyzed signal was the EDA [60,61,62,63,64,65] which is more efficient when it is obtained from the left-hand fingers [66]. When using EDA features alone, the accuracy obtained was generally high. For example, in [61], for a four-class classifier, associated with the quadrants of the dimensional model for emotions (high valence and arousal—HVHA, low valence and arousal—LVLA, high valence and low arousal—HVLA, and low valence and high arousal—LVHA), the accuracy was 82%. With a binary classification (stress, no stress) [65] higher accuracy (91%) can be achieved. Stress causes an increase in electrical bursts towards the sweat glands that produce changes in skin conductance. In [67] the authors found that the best consistent features from the EDA was the driver function given by Ledalab [68] (a Matlab GUI for EDA analysis), which is obtained by applying a deconvolution process. Other studies have used only HR features, derived from PPG or/and ECG signals [69], or EEG features [70], with an accuracy of 86.9% or 97.95%, respectively.
Table 3.
Description of selected studies for stress detection. Some acronyms: CNN, electrocardiography (ECG), EDA, electroencephalography (EEG), electromyography (EMG), electroeculography (EOG), Eye tracking (ET) GMM, HHC, HMM, NWFE, principal component analysis (PCA), photoplethysmography (PPG), Perceived stress level (PSS) RF, Skin conductance response (SCR),Trier social stress test (TSST), SVM.
Higher accuracies can be achieved by combining EDA with other physiological signals. In [64], the authors proposed an experiment to evaluate different car setups with a simulator with EDA, ECG, and eye tracking (ET). Results showed that the accuracy of 72% was mainly due to EDA because there were no significant changes in HR or pupil size during the experiment. In [63] the authors obtained an accuracy of 92% for detecting stress from EDA, PPG, and Acc with an SVM classifier. Interestingly, in this work, the stress detection was combined with the identification of other PAs.
2. The Proposed BAN
The goal of the proposed BAN, with multiple sensors measuring physiological signals and body kinetics is to integrate and correlate the acquired data to observe the evolution of stress during different PAs.
The BAN is intended for research purposes, giving preference to the collection of raw signals for further analysis. The final selected set of signals—both physiological and IMU—and wearables, may be less than the ones presented.
2.1. Hardware Designs
We designed a four-wearable-device body area network (BAN) to capture human movements and physiological signals, both at the same time. A total of ten different measurements were obtained with a network deployed on the body: four movement measures from the IMUs placed at the wrist, ankle, chest and head; the ST obtained from the wrist; the EDA at the middle phalanges; a one-channel ECG, with electrodes placed at the chest; breathing rate (BR) with a sensor placed in an oxygen mask; an eight-channel EEG. Additionally, the ambient temperature () could also be registered by three of these devices, which may be useful for detecting when the activity is performed outdoors [76].
Three out of the four devices are based on the Arduino Nano 33 IoT, which runs at 3.3 V and features an IMU with a 3-axis accelerometer and gyroscope, an ambient temperature sensor, up to 6-channel 12-bit analog-to-digital converter (ADC), and a low-consumption wireless bluetooth low energy (BLE) communication circuit (the BLE chipset in Arduino Nano 33 IoT has −88 dBm in its receiver sensitivity and its transmit power is 5 dBm; on the other hand, the Raspberry-Pi-4-model-B-BLE’s chipset has −96.5 dBm in its receiver sensitivity and its transmit power is 8.5 dBm).
The simplest design is called the “Type 1”, which only registers body movements through the IMU included in the Arduino Nano itself. The two other designs also take physiological measurements. The “Type 2” includes ST and EDA circuits, whereas the “Type 3” measures ECG and BR (Figure 2). To record the physiological signals, two additional analog-to-digital channels of the Arduino Nano were used in both wearables. All the wearable cases were the same size: 57 × 39 × 19 mm, they weighed roughly 45 g, and made of PLA, which is a biocompatible material. The schematics can be found in the supplementary material section or in GitHub (https://github.com/TAIS-RG/aai-wearables, accessed on 28 December 2021).
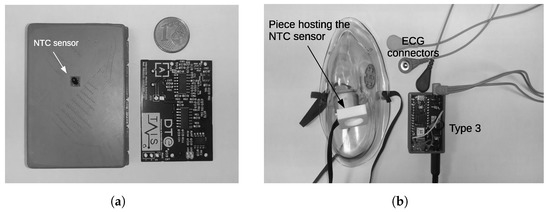
Figure 2.
Samples of 2 of our proposed wearable designs. (a) Device that records the EDA and the ST signals (Type 2). This is a bottom view and the printed circuit board; (b) the circuit board for ECG and BR measurements (Type 3). The ECG connectors, the face mask and the piece hosting the temperature sensor for air flow detection are also shown.
The fourth wearable is based on OpenBCI, that allows up to 16 EEG channels to be measured, and features a 3-axis accelerometer, and a BLE. Table 4 summarizes the measures picked up by each wearable type in the proposed BAN and the sampling frequencies used to capture the physiological signal, battery level, and IMU outputs.
Table 4.
Sampling frequency () used for each input signal.
2.1.1. Type 1: IMU and
As explained above, this design is based on the Arduino Nano 33 IoT which incorporates the LM6DS3 circuit (calibration of the IMUs is not necessary, because the manufacturer provides the calibrated devices, so it is not recommended to modify the settings), a 6-axis IMU, sampled at 26 Hz, and a temperature sensor, sampled at a rate of 13 Hz. The wearable also includes a charger (TP4056), a low-dropout regulator (LDO) (MIC5504), an on/off switch, a 950 mAh Li-ion battery, and a level checker voltage divider, connected to the A0 input to monitor battery voltage level continuously (Figure 3).
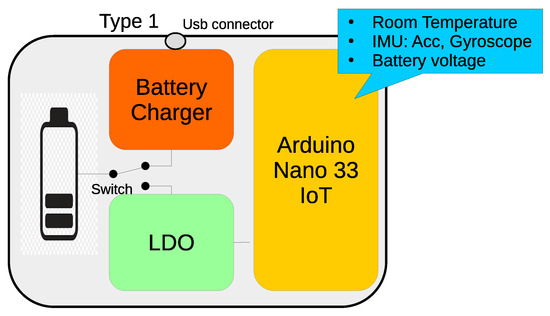
Figure 3.
Block diagram of the Type 1 wearable. It contains a battery charger, LDO, battery checker, and an Arduinio Nano 33. These elements are also included in Types 2 and 3.
The designs shown below are based on this basic architecture. However, they differ in the circuits added to measure the physiological signals.
2.1.2. Type 2: EDA and Skin Temperature (ST)
This wearable device contains the same functionalities as the “Type 1” but also adds two circuits for the measurement of electrodermal activity (EDA) and skin temperature (ST) (Figure 4). Basically, the EDA circuit follows the same structure as the one presented in [77]. It implements a first-stage non-inverter amplifier with a 16-step programmable gain in the negative feedback branch, making it possible to adjust signal output to the type of electrode (dry or wet) [78], and the subject’s skin resistance over a wide range (67 k–10 MΩ). For this reason, a set of selectable resistors are multiplexed by an analog switch circuit (4066). Four Arduino digital outputs (D5:D2) allow the specific gain to be controlled. Thus, it is necessary to verify that the selected reference resistance is adequate to prevent the amplifier from being saturated.
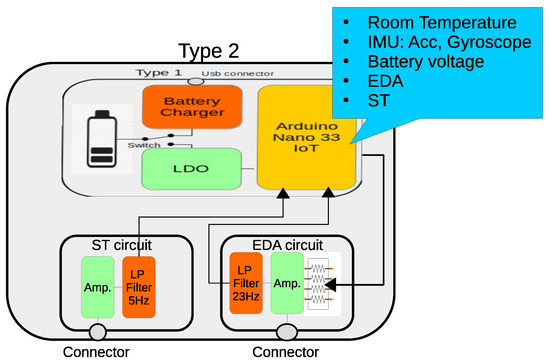
Figure 4.
Block diagram of the the Type 2 wearable. It contains an EDA circuit with a programmable gain amplifier to adapt to different skin resistances and a low-pass filter. The ST circuit is made of an input amplifier and an output low-pass filter.
Another amplifier, connected to a second-order passive low-pass filter, with a cutoff frequency of 23.4 Hz, adjusts the output signal to the maximum range of the ADC and completes the EDA circuit.
The Type 2 wearable also contains a circuit for measuring the ST. It is based on a 10 kΩ NTC thermistor (GA10K4A1A), that is placed in contact with the skin surface. The circuit contains an inverter amplifier with a gain of 6.2 and a low-pass filter with a cutoff frequency of 5.46 Hz. The operating range is 24–33 °C which is enough for the location of the sensor, since human temperature changes from one part of the body to another [79,80].
2.1.3. Type 3: ECG and Breathing
This design contains the same functionalities as the “Type 1” and adds two circuits for the measurement of ECG and BR (Figure 5).
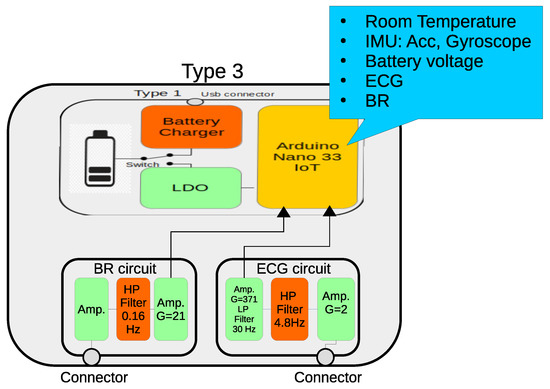
Figure 5.
Block diagram of the the “Type 3” wearable. It contains ECG and BR circuits.
The ECG is a slight modification of the one presented in [77]. It uses three passive electrodes, one of them to reduce power line interference; a high-impedance-input differential amplifier, with a gain of approximately 2; a passive one-pole high-pass filter with a T-shape resistor network that removes skin-electrode potential without reducing the CMRR; an instrumentation amplifier with a gain of 371, and a two-pole passive low-pass filter. The ECG frequency bandwidth spans from 4.8 Hz up to 30 Hz.
The BR sensor is also based on the thermistor model GA10K4A1A, which was attached to an oxygen facial mask. The aim of this design is not to measure inspiration/expiration flow but just its rhythm. The thermistor responds quickly as the expired air flows around the sensor, at a higher temperature than the ambient air. It has a first-stage inverter amplifier, followed by a high filter with a cutoff frequency of 0.16 Hz that removes the dependence on ambient temperature. A second amplifier, with a gain of 21.3, increases the temperature variation caused by the respiratory flow.
2.1.4. OpenBCI
OpenBCI (https://openbci.com/, accessed on 28 December 2021) is a low-cost open-hardware device for measuring EEG signals. It is based on the ADS1299-8 integrated circuit, which is a low-noise, 8-channel, 24-bit, analog-to-digital converter for EEG and biopotential measurements. It has an extension board that allows the number of EEG channels to be increased to 16. The sampling rate is 250 Hz for 8-channel and 125 Hz for the 16-channel settings. OpenBCI includes an IMU that delivers data at a rate of 25 Hz, along with the EEG channels, through a BLE connection. As with the other wearable designs, we added a charger circuit and a 950 mAh battery.
The validation of the data quality delivered by this consumer-grade EEG headset has already been investigated and confirmed in different studies [81].
2.2. Software
2.2.1. Communication
As computation resources are more limited on wearables, some authors have suggested using external and more powerful devices to process the signals [82,83]. In our case, we used the “edge computing” concept implemented on a Raspberry Pi 4 B with Raspberry Pi OS and an ad hoc application called LSL Recorder [84], for data synchronization and storage, based on Lab-Streaming Layer (LSL). This software is an easy-to-use, open-source, multi-platform, recording system developed on Java that can save data from several devices at the same time, while maintaining synchronization with the experimental phase markers based on LSL library, such that LSL is “a system for the unified collection of measurement time series in research experiments that handles both the networking, time-synchronization, (near-) real-time access as well as optionally the centralized collection, viewing and disk recording of the data” [85] (Figure 6).
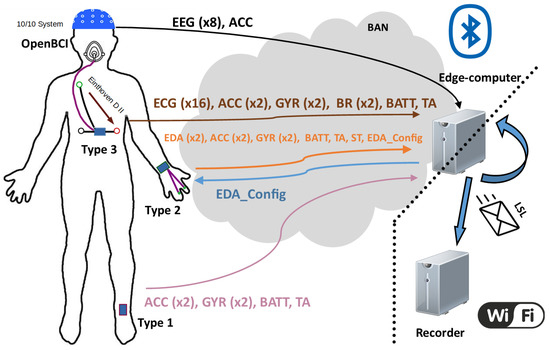
Figure 6.
Illustration of the communication process. Signals are sent via the BAN network to the coordinating node (edge computer), where they are inserted into LSL streams towards an ending node, where data are read and stored.Left, sensor placements on the body; center, the BAN network showing the information contained in each frame and their direction towards/from the edge-computer; bottom right the LAN network that connects the edge-computer with the recording node.
Furthermore, communication is the biggest drain on power in wearables [86]. Less data transmission means increased autonomy. In our wearables, data transmission was reduced to 13 times per second andused frames with different lengths to send all available data. The selected technology for the communication between different wearables and the edge computer was BLE 4.2. To simplify transmission and reduce energy consumption, the data collected were sent through only one characteristic of a single generic attribute profile (GATT) of the BLE service to reduce the operation time of the communication service, energy consumption, and consequently, extend the battery life. The service was defined with the Universally Unique IDentifier (UUID) 0xACC0, and 0xACC5 characteristic for sending data from the wearables). In the case of the Type 2 device, whose EDA resistor network can be configured in real time, an additional byte-length characteristic (0xACC6) was implemented to allow users to select the desired resistor combination. Note that these selected numbers are not currently assigned by any Bluetooth Alliance specification. Finally, the OpenBCI used its own RFduino-based communication system and the implementation of an additional service was not necessary.
2.2.2. GUI
The graphical interface is very simple and contains two differentiated areas allowing users to manage communication with the custom-made wearables or with the OpenBCI (Figure 7).
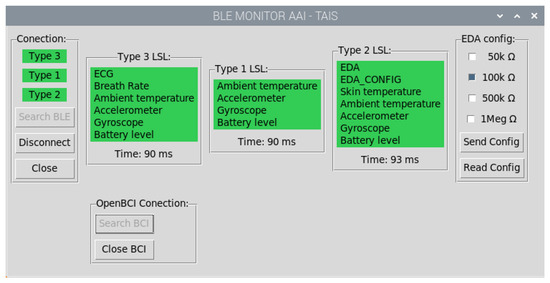
Figure 7.
Application grafical user interface (GUI) developed to manage communication with the wearables. The process consists of: searching for the devices, setting and starting to send data. The color indicates the status: red means device not found, cyan indicates device found, and green indicates that data is being sent.
Users can look for and connect to any wearable type, and not all of them have to be active at the same time. As a wearable is turned on, the edge computer automatically starts pairing it. By clicking on the wearable type in the GUI, the device begins transmitting data. The GUI uses a color code to show the connection status (unpaired/turned off—red, paired—cyan, and transmitting—green) for any wearable type and OpenBCI. Additionally, for the Type 2, the GUI contains a checkbox list that allows the resistor network to be configured in real-time (see Figure 7).
OpenBCI communicates through RFduino, whose dongle is detected as a COM port by the operating system. Once this port is opened, the software controls the communication in a different thread to avoid interference with the other wearables and the use of the GUI itself.
2.2.3. Data Synchronization
As soon as the data are received, they are sent through the LSL cloud [85] which adds a timestamp to every incoming piece of information. LSL uses the transmission control protocol (TCP), which guarantees that the data are correctly received. LSL is very useful for keeping the synchronization and data coherence in a simple way. The data streams are recorded by LSL Recorder [84], a software application that can be run in any computer connected to the same LAN as the edge computer, or on the edge computer itself.
Only the latency in the Bluetooth communication may be relevant, introducing a maximum error between received signals of 38.5 ms, owing to the selected Bluetooth transmission frequency of 13 Hz. Bluetooth keeps the received data in order.
3. Methodology
The first step, before using the BAN, was to validate the proposal through the analysis of some functional characteristics such as battery life, the packet loss rate and signal quality for the ST and BR circuits, which were not based on previous works. In this study, we also wanted to contribute with a preliminary study about the significant features of ECG for detecting stress. Other physiological signals and kinematic information provided by IMUs for human activity recognition did not fall within the scope of this work.
3.1. Battery Life and Packet Loss Rate
Battery life and packet loss rate tests were performed simultaneously. They consisted of charging all the wearables to 100%, pairing them with the central node, and then recording the received packets. The experiment ended when the battery level reached the minimum recommended operating voltage for the battery (3.6 V). The ambient temperature field was substituted by an incremental identifier to allow the estimation of the frame loss rate in our custom-made wearables.
Every data packet transmitted by OpenBCI contains an incremental frame identifier, which allows it to follow the same procedure as the one explained above. The difference lay in the battery voltage measurement, which was performed by an external Arduino Uno, whose analog input was connected to the battery.
3.2. Data Quality Assessment
The SNR figure was calculated to assess data quality. For the EDA, ST, and BR we applied the same method as in [77]: a low-pass filter, with a cutoff frequency of 5 Hz, based on a Gaussian window length of 50 implemented in Ledalab [68]; the output of this filter was considered as the signal, whereas its difference with the original signal was the noise.
We did not perform any other SNR assessment, since, as explained above, OpenBCI has already been validated by other studies [81], and some features of the proposed ECG and EDA circuits had slight changes compared to their counterparts published in [77]. However, as the cutoff frequency of the high-pass input filter in the first stage of the ECG circuit was increased, we expected the SNR to be worse than that reported in [77].
3.3. Human Activity and Stress Recognition
This section describes a set of human activities performed by participants in a room with artificial lighting at a comfortable temperature. They wore the devices as shown in Figure 6. The Type 1, 2, and 3 elements were placed at the left leg—over the bottom part of peroneus longus—left wrist and chest—over the bottom part of sternum—respectively, and the OpenBCI at the nape. We opted for Einthoven triangle’s lead II configuration for ECG electrode placement.
Figure 8 depicts the sequence of the activities. The temporal order was: (1) sit for 5 min in front of a computer with the screen turned off; (2) stress test for 4 min; (3) stand up and sit down several times for 2 min; (4) raise and lower both arms for 2 min; (5) walk around the room for another 2 min. The first activity was longer than the others because it also served as baseline for the physiological measurements for the stress test. Interleaved 1 min resting periods between activities helped the physiological baseline to recover before the following activity started. A computer program controlled the different phases of the experiment through visual and audio indications.
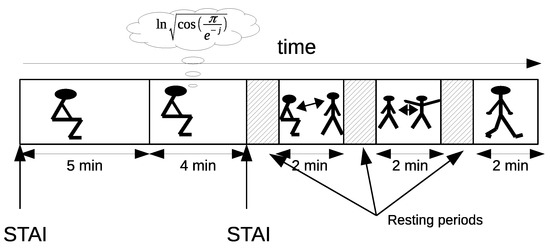
Figure 8.
Experimental temporal sequence. It contains five activities: initial rest, arithmetic task, sit-to-stand activity, raising the arms, and walking. Two State-Trait Anxiety Inventory (STAI) tests were given to participants at the beginning and end of the arithmetic task. The remainders were three simple PAs with short interleaved resting periods to stabilize physiological variables.
The stress test consisted of performing an arithmetic task with time constraints based on the Montreal Imaging Stress Task [87]. A Java application was developed to implement the GUI interface [88], showing mathematical operations (add, subtract, multiplication) whose results were always in the range between 0 and 9. Additional stressors were added to motivate participants to improve their manipulated score indicator, which was always less than the averaged population result.
Subjects filled in two questionnaires, based on the standard State-Trait Anxiety Inventory (STAI) [89], at the beginning of the experiment and at the end of the stress test. The range of results of testing was between 0 and 60 with the minimum and maximum values indicating total stress/anxiety and complete relaxation respectively. For this study, we only analyzed the variations that a stressful situation could induce in the ECG signal.
Twelve people (two women and ten men) took part in this experiment with an age range between 26 and 56 (mean 37.86; sd 9.93).
ECG Signal Processing for Stress Recognition
In general, outliers were avoided by using the interquartile-range method. Namely, those values not within the (Q1 − 1.5(Q3 − Q1), Q3 + 1.5(Q3 − Q1)) range were removed from the analysis. Q1 and Q3 represent the lower and upper quartiles respectively.
Firstly, the RR segments were obtained using the Pan–Tompkins algorithm [90] to estimate HR. Then, different temporal and frequency features were extracted from it [91] (see Table 5 for a brief description). The mean frequencies of each band (fmVLF, fmLF, fmHF), and the median of RR segments (Mrr), were also obtained. The statistical significance between the stressful situation and the initial resting period was found using the one-way ANOVA analysis.
Table 5.
Common features obtain from ECG data.
4. Results
The next sections detail the results obtained regarding battery life, data quality, stress indicators and physical activity from the signals captured by our proposal.
4.1. Battery Life and Data Loss Rate
In the data transmission test, no lost frames were detected in any device, barring a small number in OpenBCI (see Figure 9 and Table 6). On the whole, these did not follow a specific pattern, although, there were occasional bursts of up to 200 lost frames, according to the frame indicator of the OpenBCI frame counter field.
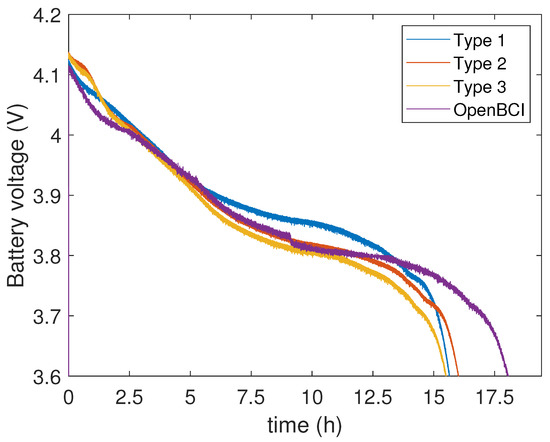
Figure 9.
Battery voltage level over time. Under 3.6 V the devices turn off.
Table 6.
Battery lifetime and frame loss rate for the four wearables.
4.2. Data Quality
Figure 10 shows some segments of the BR and ST signals and their Fourier transform plots. Frequencies over 2 Hz were considered as noise, and, for the BR signal in particular, the DC component was also removed from the analysis. As shown in the figure, the SNR for BR was 29 dB and 8 dB for ST. In the case of the ECG, the SNR was 9.78 dB.
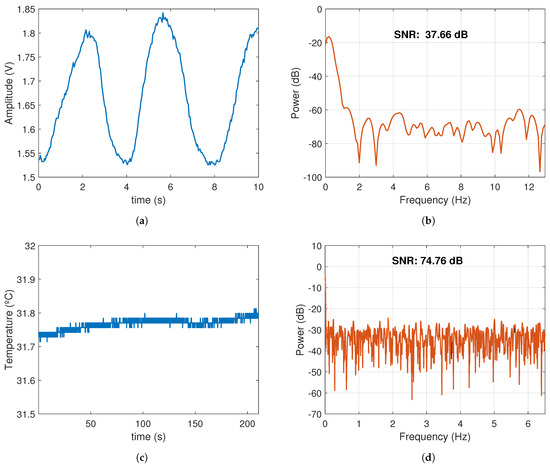
Figure 10.
BR and ST signal segments and their SNR during sit-to-stand activity. (a) BR signal: 3 complete exhalation/inspiration cycles. (b) SNR of the BR signal. (c) ST changes during 200 s of exercise. (d) SNR of the ST signal.
4.3. Human Activity and Physiological Signals
This section shows some signals captured during the experiment. At the beginning of the experiment, there was a 5 min activity consisting of sitting in a relaxed way. Figure 11 shows a segment of 30 s containing the ECG and BR signals. As one can see, the HR was 56 bpm and BR 12 bpm. A shorter ECG segment was also plotted to show the typical QRS-complex and P and T waves. Frequencies higher than 20 Hz were removed from the ECG signal through a low-pass digital filter with a length of 31 and a Hamming window. This filtering was needed for power line interference removal. No filter was applied for the BR signal.
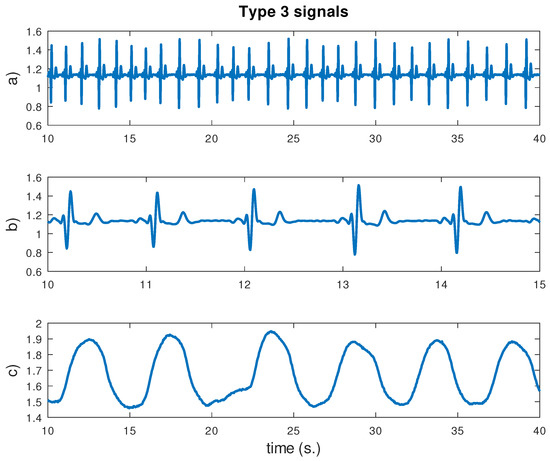
Figure 11.
ECG and breathing signals for 30 s. during the first phase of the experiment. From top to bottom: (a) ECG signal; (b) ECG signal detail for 5 s; (c) breathing signal. Vertical units are in converter units.
Figure 12 shows the “Type 2” outputs during a period of the experiment comprising rest and physical activity (sit-to-stand exercise). Motion activity, skin temperature and conductance were monitored at the same time. Skin conductance increased during the activity, and contains several peaks (phasic component), which are typical in EDA recordings. The ST was almost constant, although there was a slightly downward trend at the end of the record, maybe due to an increase in skin hydration caused by more activity in the sweat glands.
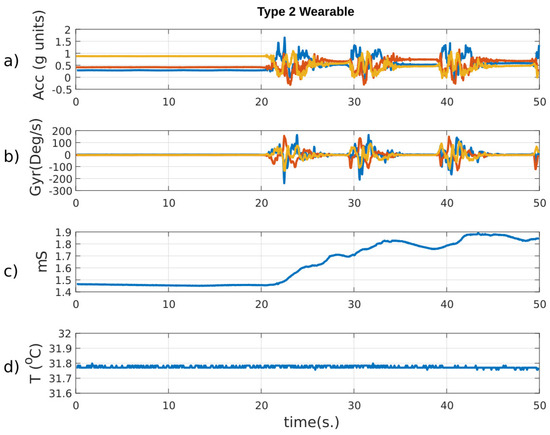
Figure 12.
Main signals delivered by the Type 2 wearable during sit-to-stand exercise. From top to bottom: (a) 3-axis accelerometer data in g units; (b) 3-axis gyroscope data in deg/s; (c) skin conductance, and (d) skin temperature. At 20, 30, and 40 s the subject performed several movements that are reflected as oscillations in the IMUs and as an increase in the skin conductance.
Finally, Figure 13 shows the set of data collected simultaneously from the accelerometers of the four wearables when an activity was started after a resting period. The IMU axis for each wearable are also shown on the left. At rest, participants were sitting still. Therefore, the gravity force made the vertical axis of all IMUs show higher values than the others. Subjects then stood up and sat down several times, with brief periods when they remained still. As can be seen, the resting position of the leg during the exercise was different to the preceding segment of the experiment, when they were sitting still. The identification of the activities through the IMU and the analysis of the physiological signals will be addressed in future works.
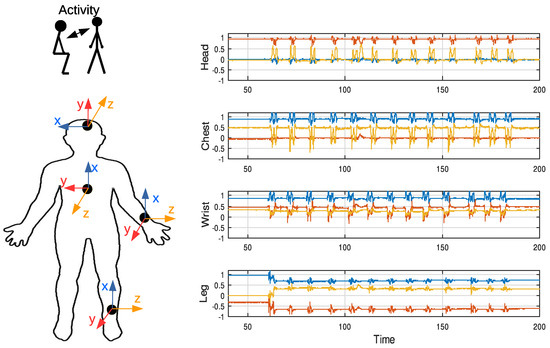
Figure 13.
Accelerometer signals collected during the activity of sitting down and standing up. These movements cause oscillations in the IMUs data.
4.4. Main ECG Features for Stress Detection
The STAI tests allowed us to verify if there was any induced stress during that part of the experiment. Results showed that the average difference between them, for all participants, was −7.5 with a standard error of 2.18%. A negative value indicates that the task was stressful. The ANOVA analysis confirmed the significance of such a difference (p = 0.004). Consequently, the arithmetic task acted as an efficient stressor.
Table 7 contains the ANOVA p-values for all ECG features analyzed. As can be seen, only and had statistically significant differences, where both parameters decreased around 10% and 50%, respectively, with respect to the resting period. Although the total number of subjects is not high, the results obtained allow us to establish a trend.
Table 7.
ANOVA p-values for each ECG feature.
5. Discussion
5.1. Hardware Design
Many wearable units have been employed for research, health, or sport tracking purposes. Some of them allow researchers to access the raw data, while others deliver processed data. In this work, we have focused on the former, and particularly on those with continuous streaming of acquired data. Table 8 presents a summary of the main features of some commercial units [92], along with new designs found in recent papers. All of them have IMUs for HMA, but not many include the necessary electronics for the measurement of physiological signals. Commercial solutions are available for acquiring multiple bio-electrical sources (EMG, ECG), skin conductance, or breathing rhythm through the measure of thorax movements with an elastic strap.
Table 8.
Main features for some commercial wearable units and devices found in the scientific literature. † Consumption when streaming; ‡ Equivalent area for a circular-shape wearable.
The size and weight of the wearable units are important from the user’s perspective. The smaller and lighter the wearable, the more comfortable it is. As for size, the proposed solutions are in line with many other devices. However, the weight is inconvenient, mainly due to the battery (20 g) and the wearable case, with 2 mm thick walls.
Not all wearables deliver raw data or make them accessible for the researcher. For example, the ativPAL, a smartwatch endowed with an IMU, only offers processed data to customers. The remaining units in Table 8 store the raw data in internal memory or/and can transmit them, in real-time, through a wireless link.
A key factor in wearables is battery lifetime or power consumption. Our devices stream data continuously and keep working for 16 h on average, powered by a 950 mAh Li–ion battery (Figure 9), which is more than enough for many ADLs scenarios in research. Several commercial units show a higher consumption than ours, but battery lifetime is much longer in the newest designs [21]. To conclude, we will need to extend the lifetime of our wearables.
There are a range of alternatives for reducing power consumption [93]: (a) Task offloading. It reduces the processing on the wearable itself and using edge computing [82] or fog computing [94] when possible. (b) Duty cycling. It puts the processor into sleep state to reduce power consumption, even though it may affect activity recognition [95]. (c) Low-power communications. Data transmission is the most consuming task in wearables [96], and BLE and Zigbee are the most efficient technologies. (d) Low-power hardware design, which involves designing with low-power units or increasing the integration level with application-specific integrated circuit (ASIC) or system on-chip (SoC) [97]. (e) Data compression. When the sampling frequency is high, the volume of data is considerable. In this case, compressing techniques, which are also useful for protecting biological information should be implemented [98].
We tested the effect of increasing packet length up to 200 bytes to reduce the number of radio wake-ups. With this frame size, the device can send data at a rate of 4.33 Hz. However, we did not obtain a significant improvement in their autonomy (an increase of just 0.84%). The processor selected for all wearable types was an important source of power drain. According to the manufacturer’s electrical specifications, the Arduino Nano IoT needs 47 mA in continuous operation. In the future, the duty cycling solution should be implemented to save power and extend battery lifetime.
5.2. Signal Quality
Although there is plenty of literature on ECG circuit solutions, SNR is not often found in their results. Table 9 shows a comparative between our ECG circuit and studies that used the same fabrication technology. In general, our circuit scored quite well in SNR. Additionally, ECG signals acquired by conventional equipment, which is at the disposal of researchers through databases like PhysioNet [99], show an SNR of 10 dB on average, which is similar to our results. Higher SNR figures can be found in ECG designs based on integrated circuits [100] (26.37 dB) but with the main drawback of higher cost.
Table 9.
Comparative with other low-cost ECG circuits.
There are also relatively few studies involving EDA circuit design that include SNR in their results. Table 10 shows a comparative according to several features. Our design gets a slightly lower SNR than in [102] when using wet electrodes. With the low-pass filtering at the end of the second stage, the SNR increased to 61.64 dB.
Table 10.
Comparative with other low-cost EDA circuits. SNR for wet electrodes; The platform does not apply any kind of filtering.
In a previous work [77], the authors tested different boards for the ST measurement, with SNR higher than 50 dB. Our results obtained an improved SNR of 74.76 dB with this new design.
In [105], the authors presented a BR design which measured torso movements using a pressure-sensor array, obtaining an SNR of 9.7 dB. Our design outperformed that value by more than 20 dB using their method, and 377.66 dB using the method described above. While our design may seem unfriendly and obtrusive, it has the advantage that it is more insensitive to motion artifacts than a pressure sensor placed around the chest during the practice of PA. Some models on the market use a flexible thread that fits behind the ears, and a set of two short prongs, placed in the nostrils, and a third prong that falls down just in front of the mouth. However, unlike this more friendly design, the facial mask guarantees that the whole inhaled or exhaled air flows around the temperature sensor.
5.3. Artifacts
An important question regarding the recording of physiological signals when performing PA is to know the extent to which motion artifacts will affect feature extraction. For example, in ECG recording, typical picked-up noise may come from several sources. One of the most important, known as motion artifact, is due to the geometrical changes between the electrode surface, the electrolyte, and the skin, that temporally affects electrode impedance. Another common issue is interferences due to other bio-potential sources like muscular activation EMG that generally appear as an increase of background noise in the baseline of the ECG signal. Nevertheless, we do not expect this EMG interference to become a serious problem limiting efficacy in extracting the heart rate (HR). Figure 14 shows a segment of the ECG containing motion artifacts. As can be seen, these artifacts do not appear to be significant enough to affect QRS-complex detection with the Pan–Tompkins algorithm (Figure 15). In conclusion, the HR will not be affected by motion artifacts when performing light PA.
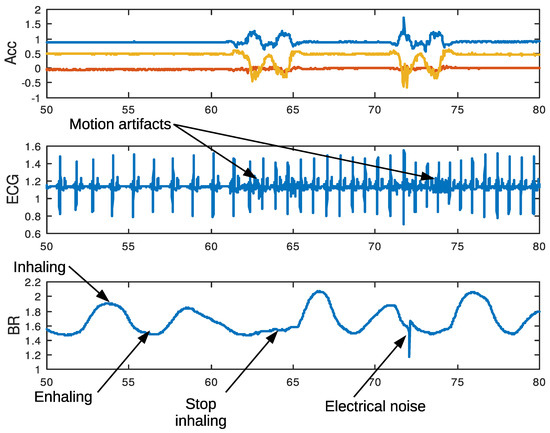
Figure 14.
Artifacts and rhythm alterations in physiological signals during sit-to-stand exercise. A movement may cause motion noise in ECG, stop breathing, and poor electrode contact.
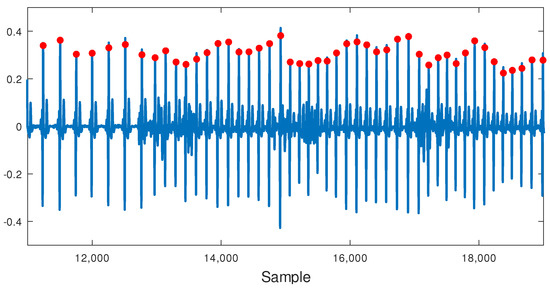
Figure 15.
Pan–Tompkins algorithm output (red circles) for an ECG segment including light PA. Motion artifacts do not affect QRS-complex detection.
Figure 14 also shows a segment of BR during sit-to-stand exercise. Signal valleys and peaks reflect the process of expiration and inspiration, falling on the former and rising on the latter. At the beginning of the exercise, the valley extends for a while, because the subject stops inhaling for a short period of time. This change in the normal breathing pattern is common and appears frequently. Occasionally, other patterns consisting of a sequence of two or more small peaks appears following the previous inhalation, as a result of short inspirations. All these changing patterns in BR are the result of physiological phenomena and may affect automatic BR estimation when based solely on peak on peaks detection. An electrical noise, like the one shown in the figure, often appears, maybe as a consequence of connector movements. However, this noise can easily be removed using a digital low-pass filter.
Denoising techniques must be used for EEG data, with lower voltage values than other bio-electrical signals, or when performing more vigorous activities, to reduce motion artifacts’ influence [106,107]. However, we will study its usefulness and feasibility in the future.
5.4. Stress Recognition
STAI test and two ECG features show a trend an increasing stress level during arithmetic tasks. The smaller of pNN50 and Mrr indicated lower heartbeat variability, so subjects’ arousal was increased, meaning that the PSNS activity decreased. These results were consistent with previous studies where HR increased during stressful tasks [73].
Using different sources of bio-signals to detect stress, several studies have shown that features coming from the ECG signal are significant [60], have high correlation indexes with the perceived stress level (PSS) [73], and very high accuracy rates [72].
6. Conclusions and Future Work
In this paper, we have presented a completed BAN with low-cost wearables that supposes an excellent framework for capturing physiological signals and detecting human movements simultaneously. As a starting point, the paper includes a comprehensive literature review that describes the most relevant techniques in this research field. The proposed BAN includes a four wearable device body network with three own designs and an overall of thirteen different measurements, where EDA, ST, ECG, EEG, and BR are acquired as physiological measurements.
The experiments we conducted to validate the system and demonstrated the robustness of data transmission with any packet loss detected during a long use of the system providing more than 15 h of autonomy. The power consumption of wearable devices is a critical factor during device engineering and our BAN can operate for up to 16 h using a 950 mAh battery. Finally, a preliminary study was conducted in order to extract the main ECG features for stress detection during rest.
In future research, we will study other physiological signals and introduce stress during the realization of human activities with the purpose of analyzing the mechanism and correlation of stress and activity recognition, their assessment and detection approach with wearable sensors. In addition, we will explore new techniques to increase the autonomy of the wearables based on the reduction of the amount of packets to transmit or on implementing low-power consumption techniques. Finally, we will integrate the devices into soft structures.
Author Contributions
All authors contributed equally to this research. All authors have read and agreed to the published version of the manuscript.
Funding
This research was funded by: (a) project AAI, Grant PID2019-104323RB-C32 funded by MCIN/AEI/ 10.13039/501100011033, (b) project AIRPLANE, with reference PID2019-104323RB-C31, of Spain’s Ministry of Science and Innovation, and (c) project CM/JIN/2019-022 of the University of Alcalá.
Institutional Review Board Statement
This research was approved by the Ethics Committee of A Coruña-Ferrol with ID 2020/597.
Informed Consent Statement
The participants agreed to take part in this study.
Acknowledgments
We want to thank participants in this study for their enthusiasm and patience. We are especially grateful to Silvia Molina Criado, who helped us design the circuit cases with the 3D printer; Thais Pousada García, who applied for the approval of the Ethics Committee; Patrick Partridge, for the revision of the manuscript, and, finally, the anonymous reviewers, whose comments and suggestions helped us improve the quality of this manuscript.
Conflicts of Interest
The authors declare no conflict of interest.
Abbreviations
The following abbreviations are used in this manuscript:
| ambient temperature | |
| Acc | accelerometer |
| ADC | analog-to-digital converter |
| ADL | activities of daily living |
| ASIC | application-specific integrated circuit |
| BAN | body area network |
| BLE | bluetooth low energy |
| BR | breathing rate |
| CNN | convolutional neural networks |
| DBN | deep belief network |
| DL | deep learning |
| DT | decision tree |
| ECG | electrocardiography |
| EDA | electrodermal activity |
| EEG | electroencephalography |
| ELM | extreme learning machine |
| EMG | electromyography |
| EOG | electroeculography |
| ET | eye tracking |
| GATT | generic attribute profile |
| GMM | Gaussian mixture model |
| GUI | grafical user interface |
| HF | high frequency |
| HHC | hierarchical hybrid classification |
| HMA | human movement analysis |
| HMM | hidden Markov models |
| HR | heart rate |
| HRV | heart rate variability |
| IMU | inertial measurement unit |
| LDO | low-dropout regulator |
| LF | low frequency |
| LSL | lab-streaming layer |
| Mrr | the median of RR segments |
| NN | neural networks |
| NWFE | nonparametric weighted feature extraction |
| PA | physical activity |
| PCA | principal component analysis |
| pNN50 | percentage of successive RR intervals that differ by more than 50 ms |
| PPG | photoplethysmography |
| PSNS | parasympathetic nervous system |
| PSS | perceived stress level |
| RF | random forest |
| RMSSD | root mean square of successive differences between normal heartbeats |
| ROM | range of motion |
| SB | sedentary behavior |
| SCR | skin conductance response |
| SDNN | standard deviation of NN intervals |
| SNR | signal-noise ratio |
| SNS | sympathetic nervous system |
| SoC | system on-chip |
| ST | skin temperature |
| STAI | state-trait anxiety inventory |
| SVM | support vector machine |
| TCP | transmission control protocol |
| TSST | trier social stress test |
| UUID | universally unique identifier |
| VLF | very low frequency |
References
- Strath, S.J.; Rowley, T.W. Wearables for promoting physical activity. Clin. Chem. 2018, 64, 53–63. [Google Scholar] [CrossRef] [PubMed]
- Yen, H.Y.; Chiu, H.L. The effectiveness of wearable technologies as physical activity interventions in weight control: A systematic review and meta-analysis of randomized controlled trials. Obes. Rev. 2019, 20, 1485–1493. [Google Scholar] [CrossRef] [PubMed]
- Ridgers, N.D.; Timperio, A.; Brown, H.; Ball, K.; Macfarlane, S.; Lai, S.K.; Richards, K.; Mackintosh, K.A.; McNarry, M.A.; Foster, M.; et al. Wearable activity tracker use among Australian adolescents: Usability and acceptability study. JMIR mHealth uHealth 2018, 6, e86. [Google Scholar] [CrossRef] [PubMed]
- Maher, C.; Ryan, J.; Ambrosi, C.; Edney, S. Users’ experiences of wearable activity trackers: A cross-sectional study. BMC Public Health 2017, 17, 880. [Google Scholar] [CrossRef] [PubMed] [Green Version]
- Edward, K.L.; Garvey, L.; Rahman, M.A. Wearable activity trackers and health awareness: Nursing implications. Int. J. Nurs. Sci. 2020, 7, 179–183. [Google Scholar] [CrossRef] [PubMed]
- Alharbi, M.; Straiton, N.; Gallagher, R. Harnessing the potential of wearable activity trackers for heart failure self-care. Curr. Heart Fail. Rep. 2017, 14, 23–29. [Google Scholar] [CrossRef] [PubMed]
- Bahadori, S.; Immins, T.; Wainwright, T.W. A review of wearable motion tracking systems used in rehabilitation following hip and knee replacement. J. Rehabil. Assist. Technol. Eng. 2018, 5, 2055668318771816. [Google Scholar] [CrossRef]
- Porciuncula, F.; Roto, A.V.; Kumar, D.; Davis, I.; Roy, S.; Walsh, C.J.; Awad, L.N. Wearable movement sensors for rehabilitation: A focused review of technological and clinical advances. Pm&r 2018, 10, S220–S232. [Google Scholar]
- Lynch, B.M.; Nguyen, N.H.; Moore, M.M.; Reeves, M.M.; Rosenberg, D.E.; Boyle, T.; Vallance, J.K.; Milton, S.; Friedenreich, C.M.; English, D.R. A randomized controlled trial of a wearable technology-based intervention for increasing moderate to vigorous physical activity and reducing sedentary behavior in breast cancer survivors: The ACTIVATE Trial. Cancer 2019, 125, 2846–2855. [Google Scholar] [CrossRef] [PubMed]
- Liu, J.Y.W.; Kor, P.P.K.; Chan, C.P.Y.; Kwan, R.Y.C.; Sze-Ki, D. The effectiveness of a wearable activity tracker (WAT)-based intervention to improve physical activity levels in sedentary older adults: A systematic review and meta-analysis. Arch. Gerontol. Geriatr. 2020, 91, 104211. [Google Scholar] [CrossRef] [PubMed]
- Vargemidis, D.; Gerling, K.; Spiel, K.; Abeele, V.V.; Geurts, L. Wearable Physical Activity Tracking Systems for Older Adults—A Systematic Review. ACM Trans. Comput. Healthc. 2020, 1, 1–37. [Google Scholar] [CrossRef]
- Dong, M.; Fang, B.; Li, J.; Sun, F.; Liu, H. Wearable sensing devices for upper limbs: A systematic review. Proc. Inst. Mech. Eng. Part H J. Eng. Med. 2021, 235, 117–130. [Google Scholar] [CrossRef] [PubMed]
- Ainsworth, B.E.; Haskell, W.L.; Whitt, M.C.; Irwin, M.L.; Swartz, A.M.; Strath, S.J.; O Brien, W.L.; Bassett, D.R.; Schmitz, K.H.; Emplaincourt, P.O.; et al. Compendium of physical activities: An update of activity codes and MET intensities. Med. Sci. Sport. Exerc. 2000, 32, S498–S504. [Google Scholar] [CrossRef] [PubMed] [Green Version]
- Biagetti, G.; Crippa, P.; Falaschetti, L.; Orcioni, S.; Turchetti, C. Human activity monitoring system based on wearable sEMG and accelerometer wireless sensor nodes. Biomed. Eng. Online 2018, 17, 132. [Google Scholar] [CrossRef] [PubMed] [Green Version]
- Hsu, Y.L.; Yang, S.C.; Chang, H.C.; Lai, H.C. Human daily and sport activity recognition using a wearable inertial sensor network. IEEE Access 2018, 6, 31715–31728. [Google Scholar] [CrossRef]
- Li, H.; Derrode, S.; Pieczynski, W. Lower limb locomotion activity recognition of healthy individuals using semi-Markov model and single wearable inertial sensor. Sensors 2019, 19, 4242. [Google Scholar] [CrossRef] [Green Version]
- Jayasinghe, U.; Harwin, W.S.; Hwang, F. Comparing clothing-mounted sensors with wearable sensors for movement analysis and activity classification. Sensors 2020, 20, 82. [Google Scholar] [CrossRef] [Green Version]
- Choudhury, N.A.; Moulik, S.; Choudhury, S. Cloud-based Real-time and Remote Human Activity Recognition System using Wearable Sensors. In Proceedings of the 2020 IEEE International Conference on Consumer Electronics-Taiwan (ICCE-Taiwan), Taoyuan, Taiwan, 28–30 September 2020; pp. 1–2. [Google Scholar]
- Hegde, N.; Bries, M.; Swibas, T.; Melanson, E.; Sazonov, E. Automatic recognition of activities of daily living utilizing insole-based and wrist-worn wearable sensors. IEEE J. Biomed. Health Inform. 2017, 22, 979–988. [Google Scholar] [CrossRef] [PubMed]
- Sztyler, T.; Stuckenschmidt, H. On-body localization of wearable devices: An investigation of position-aware activity recognition. In Proceedings of the 2016 IEEE International Conference on Pervasive Computing and Communications (PerCom), Sydney, Australia, 14–19 March 2016; pp. 1–9. [Google Scholar]
- Liu, J.; Chen, J.; Jiang, H.; Jia, W.; Lin, Q.; Wang, Z. Activity recognition in wearable ECG monitoring aided by accelerometer data. In Proceedings of the 2018 IEEE international symposium on circuits and systems (ISCAS), Florence, Italy, 27–30 May 2018; pp. 1–4. [Google Scholar]
- Xiao, Z.G.; Menon, C. Towards the development of a wearable feedback system for monitoring the activities of the upper-extremities. J. Neuroeng. Rehabil. 2014, 11, 2. [Google Scholar] [CrossRef] [Green Version]
- Al-Fatlawi, A.H.; Fatlawi, H.K.; Ling, S.H. Recognition physical activities with optimal number of wearable sensors using data mining algorithms and deep belief network. In Proceedings of the 2017 39th Annual International Conference of the IEEE Engineering in Medicine and Biology Society (EMBC), Jeju, Korea, 11–15 July 2017; pp. 2871–2874. [Google Scholar]
- Dutta, A.; Ma, O.; Toledo, M.; Pregonero, A.F.; Ainsworth, B.E.; Buman, M.P.; Bliss, D.W. Identifying free-living physical activities using lab-based models with wearable accelerometers. Sensors 2018, 18, 3893. [Google Scholar] [CrossRef] [PubMed] [Green Version]
- Zhang, Y.; Markovic, S.; Sapir, I.; Wagenaar, R.C.; Little, T.D. Continuous functional activity monitoring based on wearable tri-axial accelerometer and gyroscope. In Proceedings of the 2011 5th International Conference on Pervasive Computing Technologies for Healthcare (PervasiveHealth) and Workshops, Dublin, Ireland, 23–26 May 2011; pp. 370–373. [Google Scholar]
- Chuang, F.C.; Wang, J.S.; Yang, Y.T.; Kao, T.P. A wearable activity sensor system and its physical activity classification scheme. In Proceedings of the 2012 international joint conference on neural networks (IJCNN), Brisbane, Australia, 10–15 June 2012; pp. 1–6. [Google Scholar]
- Zhang, M.; Sawchuk, A.A. Human daily activity recognition with sparse representation using wearable sensors. IEEE J. Biomed. Health Inform. 2013, 17, 553–560. [Google Scholar] [CrossRef] [PubMed]
- Khan, A.M.; Lawo, M.; Homer, P. Wearable recognition system for physical activities. In Proceedings of the 2013 9th International Conference on Intelligent Environments, Athens, Greece, 16–17 July 2013; pp. 245–249. [Google Scholar]
- He, Z.; Bai, X. A wearable wireless body area network for human activity recognition. In Proceedings of the 2014 Sixth International Conference on Ubiquitous and Future Networks (ICUFN), Shanghai, China, 8–11 July 2014; pp. 115–119. [Google Scholar]
- Safi, K.; Attal, F.; Mohammed, S.; Khalil, M.; Amirat, Y. Physical activity recognition using inertial wearable sensors—A review of supervised classification algorithms. In Proceedings of the 2015 International Conference on Advances in Biomedical Engineering (ICABME), Beirut, Lebanon, 16–18 Sept. 2015; pp. 313–316. [Google Scholar]
- Attal, F.; Mohammed, S.; Dedabrishvili, M.; Chamroukhi, F.; Oukhellou, L.; Amirat, Y. Physical human activity recognition using wearable sensors. Sensors 2015, 15, 31314–31338. [Google Scholar] [CrossRef] [Green Version]
- Park, H.; Dong, S.Y.; Lee, M.; Youn, I. The role of heart-rate variability parameters in activity recognition and energy-expenditure estimation using wearable sensors. Sensors 2017, 17, 1698. [Google Scholar] [CrossRef] [PubMed]
- Wang, D.; Candinegara, E.; Hou, J.; Tan, A.H.; Miao, C. Robust human activity recognition using lesser number of wearable sensors. In Proceedings of the 2017 International Conference on Security, Pattern Analysis, and Cybernetics (SPAC), Shenzhen, China, 15–17 December 2017; pp. 290–295. [Google Scholar]
- Huang, Y.C.; Yi, C.W.; Peng, W.C.; Lin, H.C.; Huang, C.Y. A study on multiple wearable sensors for activity recognition. In Proceedings of the 2017 IEEE Conference on Dependable and Secure Computing, Taipei, Taiwan, 7–10 August 2017; pp. 449–452. [Google Scholar]
- Verma, H.; Paul, D.; Bathula, S.R.; Sinha, S.; Kumar, S. Human Activity Recognition with Wearable Biomedical Sensors in Cyber Physical Systems. In Proceedings of the 2018 15th IEEE India Council International Conference (INDICON), Coimbatore, India, 16–18 December 2018; pp. 1–6. [Google Scholar]
- Nandy, A.; Saha, J.; Chowdhury, C.; Singh, K.P. Detailed human activity recognition using wearable sensor and smartphones. In Proceedings of the 2019 International Conference on Opto-Electronics and Applied Optics (Optronix), Kolkata, India, 18–20 March 2019; pp. 1–6. [Google Scholar]
- Qi, W.; Aliverti, A. A multimodal wearable system for continuous and real-time breathing pattern monitoring during daily activity. IEEE J. Biomed. Health Inform. 2019, 24, 2199–2207. [Google Scholar] [CrossRef] [PubMed]
- Das, D.B.; Birant, D. Classification of Hand-Based and Non-Hand-Based Physical Activities Using Wearable Sensors. In Proceedings of the 2020 4th International Symposium on Multidisciplinary Studies and Innovative Technologies (ISMSIT), Istanbul, Turkey, 22–24 October 2020; pp. 1–5. [Google Scholar]
- Huang, W.; Zhang, L.; Wenbin, G.; Min, F.; He, J. Shallow Convolutional Neural Networks for Human Activity Recognition Using Wearable Sensors. IEEE Trans. Instrum. Meas. 2021, 70, 1–11. [Google Scholar] [CrossRef]
- Mahmud, T.; Sazzad, Q.; Anowarul, S.; Kung, S.Y. A Novel Multi-Stage Training Approach for Human Activity Recognition from Multimodal Wearable Sensor Data Using Deep Neural Network. IEEE Sens. J. 2021, 21, 1715–1726. [Google Scholar] [CrossRef]
- El-Amrawy, F.; Nounou, M.I. Are currently available wearable devices for activity tracking and heart rate monitoring accurate, precise, and medically beneficial? Healthc. Inform. Res. 2015, 21, 315. [Google Scholar] [CrossRef] [PubMed]
- Anguita, D.; Ghio, A.; Oneto, L.; Parra, X.; Reyes-Ortiz, J.L. A Public Domain Dataset for Human Activity Recognition using Smartphones. In Proceedings of the 21th European Symposium on Artificial Neural Networks, Computational Intelligence and Machine Learning (ESANN), Bruges, Belgium, 24–26 April 2013. [Google Scholar]
- Roggen, D. Collecting complex activity datasets in highly rich networked sensor environments. In Proceedings of the Seventh International Conference on Networked Sensing Systems (INSS), Kassel, Germany, 15–18 June 2010. [Google Scholar]
- Reiss, A.; Stricker, D. Introducing a New Benchmarked Dataset for Activity Monitoring. In Proceedings of the 16th IEEE International Symposium on Wearable Computers (ISWC), Newcastle, UK, 18–22 June 2012. [Google Scholar]
- Micucci, D.; Mobilio, M.; Paolo, N. UniMiB SHAR: A Dataset for Human Activity Recognition Using Acceleration Data from Smartphones. Appl. Sci. 2017, 7, 1101. [Google Scholar] [CrossRef] [Green Version]
- Russell, J.A. A circumplex model of affect. J. Personal. Soc. Psychol. 1980, 39, 1161. [Google Scholar] [CrossRef]
- Russell, J.A.; Barrett, L.F. Core affect, prototypical emotional episodes, and other things called emotion: Dissecting the elephant. J. Personal. Soc. Psychol. 1999, 76, 805. [Google Scholar] [CrossRef]
- Schmidt, P.; Reiss, A.; Dürichen, R.; Laerhoven, K.V. Wearable-based affect recognition—A review. Sensors 2019, 19, 4079. [Google Scholar] [CrossRef] [Green Version]
- Suhaimi, N.S.; Mountstephens, J.; Teo, J. EEG-Based Emotion Recognition: A State-of-the-Art Review of Current Trends and Opportunities. Comput. Intell. Neurosci. 2020, 2020, 8875426. [Google Scholar] [CrossRef] [PubMed]
- Lu, X.; Liu, X.; Stolterman Bergqvist, E. “It sounds like she is sad” Introducing a Biosensing Prototype that Transforms Emotions into Real-time Music and Facilitates Social Interaction. In Proceedings of the Extended Abstracts of the 2019 CHI Conference on Human Factors in Computing Systems, Glasgow, UK, 4–9 May 2019; pp. 1–6. [Google Scholar]
- Liu, Y.; Sourina, O.; Nguyen, M.K. Real-time EEG-based emotion recognition and its applications. In Transactions on Computational Science XII; Springer: Berlin/Heidelberg, Germany, 2011; pp. 256–277. [Google Scholar]
- Quesada-Tabares, R.; Molina-Cantero, A.J.; Gómez-González, I.; Merino-Monge, M.; Castro-García, J.A.; Cabrera-Cabrera, R. Emotions Detection based on a Single-electrode EEG Device. In Proceedings of the 4th International Conference on Physiological Computing Systems—Volume 1: PhyCS, Madrid, Spain, 27–28 July 2017; pp. 89–95. [Google Scholar] [CrossRef]
- Quesada-Tabares, R.; Molina-Cantero, A.J.; Escudero-Fombuena, J.I.; Merino-Monge, M.; Gómez-González, I.M.; Lebrato-Vázquez, C.; Castro-García, J.A. Looking for Emotions on a Single EEG Signal. In Physiological Computing Systems; Springer: Cham, Switzerland, 2016; pp. 78–92. [Google Scholar]
- Rattanyu, K.; Ohkura, M.; Mizukawa, M. Emotion monitoring from physiological signals for service robots in the living space. In Proceedings of the ICCAS 2010, Seoul, Korea, 27–30 October 2010; pp. 580–583. [Google Scholar]
- Fernández-Aguilar, L.; Martínez-Rodrigo, A.; Moncho-Bogani, J.; Fernández-Caballero, A.; Latorre, J.M. Emotion detection in aging adults through continuous monitoring of electro-dermal activity and heart-rate variability. In Proceedings of the International Work-Conference on the Interplay Between Natural and Artificial Computation, Almería, Spain, 3–7 June 2019; pp. 252–261. [Google Scholar]
- Schmidt, P.; Reiss, A.; Duerichen, R.; Marberger, C.; Van Laerhoven, K. Introducing wesad, a multimodal dataset for wearable stress and affect detection. In Proceedings of the 20th ACM International Conference on Multimodal Interaction, Boulder, CO, USA, 16–20 October 2018; pp. 400–408. [Google Scholar]
- He, C.; Yao, Y.j.; Ye, X.s. An emotion recognition system based on physiological signals obtained by wearable sensors. In Wearable Sensors and Robots; Springer: Singapore, 2017; pp. 15–25. [Google Scholar]
- Gedam, S.; Paul, S. Automatic Stress Detection Using Wearable Sensors and Machine Learning: A Review. In Proceedings of the 2020 11th International Conference on Computing, Communication and Networking Technologies (ICCCNT), Kharagpur, India, 1–3 July 2020; pp. 1–7. [Google Scholar]
- Egger, M.; Ley, M.; Hanke, S. Emotion recognition from physiological signal analysis: A review. Electron. Notes Theor. Comput. Sci. 2019, 343, 35–55. [Google Scholar] [CrossRef]
- Menghini, L.; Gianfranchi, E.; Cellini, N.; Patron, E.; Tagliabue, M.; Sarlo, M. Stressing the accuracy: Wrist-worn wearable sensor validation over different conditions. Psychophysiology 2019, 56, e13441. [Google Scholar] [CrossRef] [PubMed]
- Al Machot, F.; Elmachot, A.; Ali, M.; Al Machot, E.; Kyamakya, K. A deep-learning model for subject-independent human emotion recognition using electrodermal activity sensors. Sensors 2019, 19, 1659. [Google Scholar] [CrossRef] [PubMed] [Green Version]
- Sparrow, L.; Six, H.; Varona, L.; Janin, O. Validation of Affect-tag Affective and Cognitive Indicators. Front. Neuroinform. 2021, 15, 535542. [Google Scholar] [CrossRef]
- Sevil, M.; Rashid, M.; Hajizadeh, I.; Askari, M.R.; Hobbs, N.; Brandt, R.; Park, M.; Quinn, L.; Cinar, A. Discrimination of simultaneous psychological and physical stressors using wristband biosignals. Comput. Methods Programs Biomed. 2021, 199, 105898. [Google Scholar] [CrossRef]
- Zontone, P.; Affanni, A.; Bernardini, R.; Del Linz, L.; Piras, A.; Rinaldo, R. Emotional Response Analysis Using Electrodermal Activity, Electrocardiogram and Eye Tracking Signals in Drivers with Various Car Setups. In Proceedings of the 2020 28th European Signal Processing Conference (EUSIPCO), Amsterdam, The Netherlands, 18–21 January 2021; pp. 1160–1164. [Google Scholar]
- Liapis, A.; Faliagka, E.; Katsanos, C.; Antonopoulos, C.; Voros, N. Detection of Subtle Stress Episodes During UX Evaluation: Assessing the Performance of the WESAD Bio-Signals Dataset. In Proceedings of the IFIP Conference on Human-Computer Interaction, Bari, Italy, 30 August–3 September 2021; pp. 238–247. [Google Scholar]
- Sanchez-Comas, A.; Synnes, K.; Molina-Estren, D.; Troncoso-Palacio, A.; Comas-González, Z. Correlation Analysis of Different Measurement Places of Galvanic Skin Response in Test Groups Facing Pleasant and Unpleasant Stimuli. Sensors 2021, 21, 4210. [Google Scholar] [CrossRef]
- Lutin, E.; Hashimoto, R.; De Raedt, W.; Van Hoof, C. Feature Extraction for Stress Detection in Electrodermal Activity. In Proceedings of the BIOSIGNALS 2021—14th International Conference on Bio-Inspired Systems and Signal Processing, Online, 11–13 February 2021; pp. 177–185. [Google Scholar]
- Benedek, M.; Kaernbach, C. A continuous measure of phasic electrodermal activity. J. Neurosci. Methods 2010, 190, 80–91. [Google Scholar] [CrossRef] [Green Version]
- Dobbins, C.; Fairclough, S. Signal processing of multimodal mobile lifelogging data towards detecting stress in real-world driving. IEEE Trans. Mob. Comput. 2018, 18, 632–644. [Google Scholar] [CrossRef] [Green Version]
- Halim, Z.; Rehan, M. On identification of driving-induced stress using electroencephalogram signals: A framework based on wearable safety-critical scheme and machine learning. Inf. Fusion 2020, 53, 66–79. [Google Scholar] [CrossRef]
- Markova, V.; Ganchev, T.; Kalinkov, K. Clas: A database for cognitive load, affect and stress recognition. In Proceedings of the 2019 International Conference on Biomedical Innovations and Applications (BIA), Varna, Bulgaria, 8–9 November 2019; pp. 1–4. [Google Scholar]
- Can, Y.S.; Chalabianloo, N.; Ekiz, D.; Fernandez-Alvarez, J.; Repetto, C.; Riva, G.; Iles-Smith, H.; Ersoy, C. Real-life stress level monitoring using smart bands in the light of contextual information. IEEE Sens. J. 2020, 20, 8721–8730. [Google Scholar] [CrossRef]
- Mocny-Pachońska, K.; Doniec, R.J.; Sieciński, S.; Piaseczna, N.J.; Pachoński, M.; Tkacz, E.J. The Relationship between Stress Levels Measured by a Questionnaire and the Data Obtained by Smart Glasses and Finger Pulse Oximeters among Polish Dental Students. Appl. Sci. 2021, 11, 8648. [Google Scholar] [CrossRef]
- Wu, M.H.; Chang, T.C. Evaluation of Effect of Music on Human Nervous System by Heart Rate Variability Analysis Using ECG Sensor. Sens. Mater. 2021, 33, 739–753. [Google Scholar] [CrossRef]
- Ben Khelifa, M.M.; Lamti, H.A.; Hugel, V. A Muscular and Cerebral Physiological Indices Assessment for Stress Measuring during Virtual Wheelchair Guidance. Brain Sci. 2021, 11, 274. [Google Scholar] [CrossRef] [PubMed]
- Zhou, S.M.; Hill, R.A.; Morgan, K.; Stratton, G.; Gravenor, M.B.; Bijlsma, G.; Brophy, S. Classification of accelerometer wear and non-wear events in seconds for monitoring free-living physical activity. BMJ Open 2015, 5, e007447. [Google Scholar] [CrossRef]
- Castro-García, J.A.; Molina-Cantero, A.J.; Merino-Monge, M.; Gómez-González, I.M. An Open-Source Hardware Acquisition Platform for Physiological Measurements. IEEE Sens. J. 2019, 19, 11526–11534. [Google Scholar] [CrossRef]
- Boucsein, W. Electrodermal Activity; Springer: Boston, MA, USA, 2012. [Google Scholar] [CrossRef]
- Werner, J.; Heising, M.; Rautenberg, W.; Leimann, K. Dynamics and topography of human temperature regulation in response to thermal and work load. Eur. J. Appl. Physiol. Occup. Physiol. 1985, 53, 353–358. [Google Scholar] [CrossRef]
- Werner, J. Measurement of Temperatures of the Human Body. In Comprehensive Biomedical Physics; Elsevier: Amsterdam, The Netherlands, 2014; pp. 107–126. [Google Scholar] [CrossRef]
- Sawangjai, P.; Hompoonsup, S.; Leelaarporn, P.; Kongwudhikunakorn, S.; Wilaiprasitporn, T. Consumer Grade EEG Measuring Sensors as Research Tools: A Review. IEEE Sens. J. 2020, 20, 3996–4024. [Google Scholar] [CrossRef]
- Abbas, N.; Zhang, Y.; Taherkordi, A.; Skeie, T. Mobile edge computing: A survey. IEEE Internet Things J. 2017, 5, 450–465. [Google Scholar] [CrossRef] [Green Version]
- Pace, P.; Fortino, G.; Zhang, Y.; Liotta, A. Intelligence at the edge of complex networks: The case of cognitive transmission power control. IEEE Wirel. Commun. 2019, 26, 97–103. [Google Scholar] [CrossRef]
- Merino-Monge, M.; Molina-Cantero, A.J.; Castro-García, J.A.; Gómez-González, I.M. An Easy-to-use Multi-source Recording And Synchronization Software for Experimental Trials. IEEE Access 2020, 8, 200618–200634. [Google Scholar] [CrossRef]
- Kothe, C. Lab Streaming Layer (LSL). Available online: https://github.com/sccn/labstreaminglayer (accessed on 18 July 2018).
- Thielen, M.; Sigrist, L.; Magno, M.; Hierold, C.; Benini, L. Human body heat for powering wearable devices: From thermal energy to application. Energy Convers. Manag. 2017, 131, 44–54. [Google Scholar] [CrossRef] [Green Version]
- Dedovic, K.; Renwick, R.; Mahani, N.K.; Engert, V.; Lupien, S.J.; Pruessner, J.C. The Montreal Imaging Stress Task: Using functional imaging to investigate the effects of perceiving and processing psychosocial stress in the human brain. J. Psychiatry Neurosci. 2005, 30, 319–325. [Google Scholar]
- Merino, M.; Gómez, I.; Molina, A.J. EEG feature variations under stress situations. In Proceedings of the Annual International Conference of the IEEE Engineering in Medicine and Biology Society, EMBS, Milan, Italy, 25–29 August 2015; pp. 6700–6703. [Google Scholar] [CrossRef]
- Spielberger, C.D. State-Trait anxiety inventory. In The Corsini Encyclopedia of Psychology; John Wiley & Sons, Inc.: Hoboken, NJ, USA, 2010; p. 1. [Google Scholar]
- Pan, J.; Tompkins, W.J. A real-time QRS detection algorithm. IEEE Trans. Biomed. Eng. 1985, BME-32, 230–236. [Google Scholar] [CrossRef]
- Sörnmo, L.; Laguna, P. Bioelectrical Signal Processing in Cardiac and Neurological Applications; Academic Press: Cambridge, MA, USA, 2005. [Google Scholar]
- Rodríguez-Martín, D.; Pérez-López, C.; Samà, A.; Cabestany, J.; Català, A. A wearable inertial measurement unit for long-term monitoring in the dependency care area. Sensors 2013, 13, 14079–14104. [Google Scholar] [CrossRef]
- Qaim, W.B.; Ometov, A.; Molinaro, A.; Lener, I.; Campolo, C.; Lohan, E.S.; Nurmi, J. Towards Energy Efficiency in the Internet of Wearable Things: A Systematic Review. IEEE Access 2020, 8, 175412–175435. [Google Scholar] [CrossRef]
- Naha, R.K.; Garg, S.; Georgakopoulos, D.; Jayaraman, P.P.; Gao, L.; Xiang, Y.; Ranjan, R. Fog computing: Survey of trends, architectures, requirements, and research directions. IEEE Access 2018, 6, 47980–48009. [Google Scholar] [CrossRef]
- Starliper, N.; Mohammadzadeh, F.; Songkakul, T.; Hernandez, M.; Bozkurt, A.; Lobaton, E. Activity-aware wearable system for power-efficient prediction of physiological responses. Sensors 2019, 19, 441. [Google Scholar] [CrossRef] [PubMed] [Green Version]
- Barr, K.C.; Asanović, K. Energy-aware lossless data compression. ACM Trans. Comput. Syst. (TOCS) 2006, 24, 250–291. [Google Scholar] [CrossRef] [Green Version]
- Gawali, D.H.; Wadhai, V.M. Recent trends in energy management of wireless wearable bio sensor design. In Proceedings of the 2017 11th International Conference on Intelligent Systems and Control (ISCO), Coimbatore, India, 5–6 January 2017; pp. 408–412. [Google Scholar]
- Pushpalatha, S.; Shivaprakasha, K. Energy-efficient communication using data aggregation and data compression techniques in wireless sensor networks: A survey. In Proceedings of the Advances in Communication, Signal Processing, VLSI, and Embedded Systems, Nitte, India, 23–24 May 2020; pp. 161–179. [Google Scholar]
- Goldberger, A.L.; Amaral, L.A.; Glass, L.; Hausdorff, J.M.; Ivanov, P.C.; Mark, R.G.; Mietus, J.E.; Moody, G.B.; Peng, C.K.; Stanley, H.E. PhysioBank, PhysioToolkit, and PhysioNet: Components of a New Research Resource for Complex Physiologic Signals. Circulation 2000, 101, e215–e220. [Google Scholar] [CrossRef] [Green Version]
- Basak, D.; Nishanth, P.; Paily, R.P. A low noise preamplifier and switched capacitor filter for heart-rate detection. In Proceedings of the 2013 International Conference on Advanced Electronic Systems (ICAES), Pilani, India, 21–23 September 2013; pp. 184–188. [Google Scholar]
- Díaz-Suárez, R.A.; Pinzon-Parada, A.L.; Hernández-García, J.; Tirado-Romero, J.S.; Díaz-Meza, C.F. Development an active electrodes system for acquisition and wireless transmission of electrocardiography signal lead II. DYNA 2018, 85, 253–259. [Google Scholar] [CrossRef]
- da Silva, H.P.; Fred, A.; Martins, R. Biosignals for Everyone. IEEE Pervasive Comput. 2014, 13, 64–71. [Google Scholar] [CrossRef]
- Zangróniz, R.; Martínez-Rodrigo, A.; Pastor, J.M.; López, M.T.; Fernández-Caballero, A. Electrodermal Activity Sensor for Classification of Calm/Distress Condition. Sensors 2017, 17, 2324. [Google Scholar] [CrossRef] [PubMed] [Green Version]
- Konijnenburg, M.; Stanzione, S.; Yan, L.; Jee, D.W.; Pettine, J.; Wegberg, R.V.; Kim, H.; van Liempd, C.; Fish, R.; Schuessler, J.; et al. A Multi(bio)sensor Acquisition System With Integrated Processor, Power Management, 8 × 8 LED Drivers, and Simultaneously Synchronized ECG, BIO-Z, GSR, and Two PPG Readouts. IEEE J. Solid-State Circuits 2016, 51, 2584–2595. [Google Scholar] [CrossRef]
- Townsend, D.I.; Holtzman, M.; Goubran, R.; Frize, M.; Knoefel, F. Measurement of torso movement with delay mapping using an unobtrusive pressure-sensor array. IEEE Trans. Instrum. Meas. 2010, 60, 1751–1760. [Google Scholar] [CrossRef]
- Shukla, S.; Roy, V.; Prakash, A. Wavelet Based Empirical Approach to Mitigate the Effect of Motion Artifacts from EEG Signal. In Proceedings of the 2020 IEEE 9th International Conference on Communication Systems and Network Technologies (CSNT), Gwalior, India, 10–12 April 2020; pp. 323–326. [Google Scholar]
- Xiong, F.; Chen, D.; Huang, M. A wavelet adaptive cancellation algorithm based on multi-inertial sensors for the reduction of motion artifacts in ambulatory ECGs. Sensors 2020, 20, 970. [Google Scholar] [CrossRef] [PubMed] [Green Version]
Publisher’s Note: MDPI stays neutral with regard to jurisdictional claims in published maps and institutional affiliations. |
© 2022 by the authors. Licensee MDPI, Basel, Switzerland. This article is an open access article distributed under the terms and conditions of the Creative Commons Attribution (CC BY) license (https://creativecommons.org/licenses/by/4.0/).