Article

Parameter Extraction of Photovoltaic Module Using Tunicate Swarm Algorithm

1
Research and Development Department, University of Petroleum and Energy Studies, Dehradun 248007, India
2
Department of Electrical and Electronics Engineering, School of Engineering, University of Petroleum and Energy Studies, Dehradun 248007, India
3
MCAST Energy Research Group, Institute of Engineering and Transport, Malta College of Arts, Science and Technology, Paola PLA9032, Malta
*
Author to whom correspondence should be addressed.
Electronics 2021, 10(8), 878; https://doi.org/10.3390/electronics10080878
Submission received: 3 March 2021 / Revised: 23 March 2021 / Accepted: 2 April 2021 / Published: 7 April 2021
(This article belongs to the Special Issue Energy Harvesting and Energy Storage Systems)

Abstract

:
In the renewable energy sector, the extraction of parameters for solar photovoltaic (PV) cells is a widely studied area of research. Parameter extraction is a non-linear complex optimization problem for solar PV cells. In this research work, the authors have implemented the Tunicate swarm algorithm (TSA) to estimate the optimized value of the unknown parameters of a PV cell/module under standard temperature conditions. The simulation results have been compared with four different, pre-existing optimization algorithms: gravitational search algorithm (GSA), a hybrid of particle swarm optimization and gravitational search algorithm (PSOGSA), sine cosine (SCA), and whale optimization (WOA). The comparison of results broadly demonstrates that the TSA algorithm outperforms the existing optimization algorithms in terms of root mean square error (RMSE) and convergence rate. Furthermore, the statistical results confirm that the TSA algorithm is a better algorithm in terms of average robustness and precision. The Friedman ranking test is also carried out to demonstrate the competency and reliability of the implemented approach.

1. Introduction

Solar energy is emerged as a potential renewable source of energy. For the eighth year in a row, solar power has received the greatest proportion of groundbreaking investment opportunities in renewable energy sources. Because of the high investment cost of PV-generating installations, it is necessary to estimate the behavior of the PV-system from the designing phase to assure efficient utilization of solar energy in electricity generation [1,2]. Solar energy is also reflected as an extremely capable renewable resource owing to its usage and non-polluting nature [1,2,3]. Moreover, its modularity and scalability have added to its extensive acceptance in power systems through different photovoltaic (PV) configurations [4]. For simulating, controlling, and evaluating the photovoltaic systems, modeling of the solar-cell installation must be done. Whenever photovoltaics start operating, the solar-cell parameters could be utilized for accounting for the detectability and analysis [3]. However, the practical aspect is that photovoltaic devices are majorly bare compared to several outer atmospheric belongings, and its photovoltaic arrays do not last always efficiently which will harm the production of sun-based devices [4]. Accordingly, this is a critical estimation of the practical performance of photovoltaic arrays in the process to achieve, enhance, and simulate these types of systems/devices. With this aim, we frequently use a reliable prototype to measure current and voltage files [5].
The importance of photovoltaics is estimated to be a major stimulating topic by scientists/researchers and firms to progress energy adaption and reduce costs [6,7,8]. To boost the systematic performance of photovoltaics, modeling the photovoltaic cells and their segments is a crucial part. The non-linear dimensions and sporadic nature of meteorologic static make it difficult to identify cell constraints [9]. Furthermore, the production firms require assurance of the performance of photovoltaic units for approx. twenty-five years; photovoltaic arrangements are dependent on location and unavoidably undergo degradation, along with possible occurrences of electrical faults. So, we can considerably work on a systematic model that predicts the practical behavior of the photovoltaic cell in possible working conditions [10].
Generally, PV systems are vulnerable to outside atmospheric aspects such as temperature and irradiance, which affect the effectiveness of solar energy [11]. Thus, it is essential to generate current–voltage modeling setups for enhancing and controlling PV arrangements [12]. Generally, single, double, and triple diode models are majorly used for photovoltaic cells [13,14,15], and are extensively used to specify the current–voltage connections. Parameters of the photovoltaics help to determine the accurateness and dependability of the models. However, due to unbalanced operational cases, such as faults and aging, the models’ parameters are not accessible. Therefore, the development of an active methodology to accurately extract these parameters turn out to be critical. The single diode model (SDM) is majorly used in the approximation of these constraints because of ease and acceptance. The double diode model (DDM) is expected to be as accurate as SDM, especially in lower solar irradiance; nevertheless, it desires to exist for a long consuming time [16,17,18,19,20]. To get more accurate and precise parameters from nonlinear implicit equations with high accuracy, evolutionary algorithms [21,22,23,24,25,26,27,28,29,30,31] were proposed. The bio-related algorithms are more accurate and powerful optimization algorithms for simplifying nonlinear transcendental equations, as they do not include complex mathematics. In the proposed work, TSA is implemented for the parameter extraction of the solar cell/module, and the results clearly show the superiority of the TSA over particle swarm optimization (PSO). The reason for this is that PSO has the problem of getting stuck in the local optima solution due to poor exploration capabilities for searching for the optimal solution in the search space, while the searching mechanism of TSA provides a good trade-off between exploration and exploitation capabilities [18]. Hence, TSA provides a more optimal solution as compared with PSO and other existing algorithms.
In this manuscript, we have discussed, initially, the problem formulation followed by a mathematical model for solar PV cell/module, as presented in Section 2. In Section 3, a brief introduction of the TSA algorithm is discussed and is implemented to estimate the optimized value of the unknown parameters of a PV module model. In Section 4, the simulation results of the TSA algorithm are discussed and compared with those of pre-existing metaheuristic algorithms. Section 5 entails the discussion and finally, the manuscript is concluded in Section 6.

2. Problem Statement

In a photovoltaic solar cell, the parallel circuits are formulated using single-diode and double-diode models. In the solar cell, the correlation between the current and voltage is represented using equivalent circuit models.

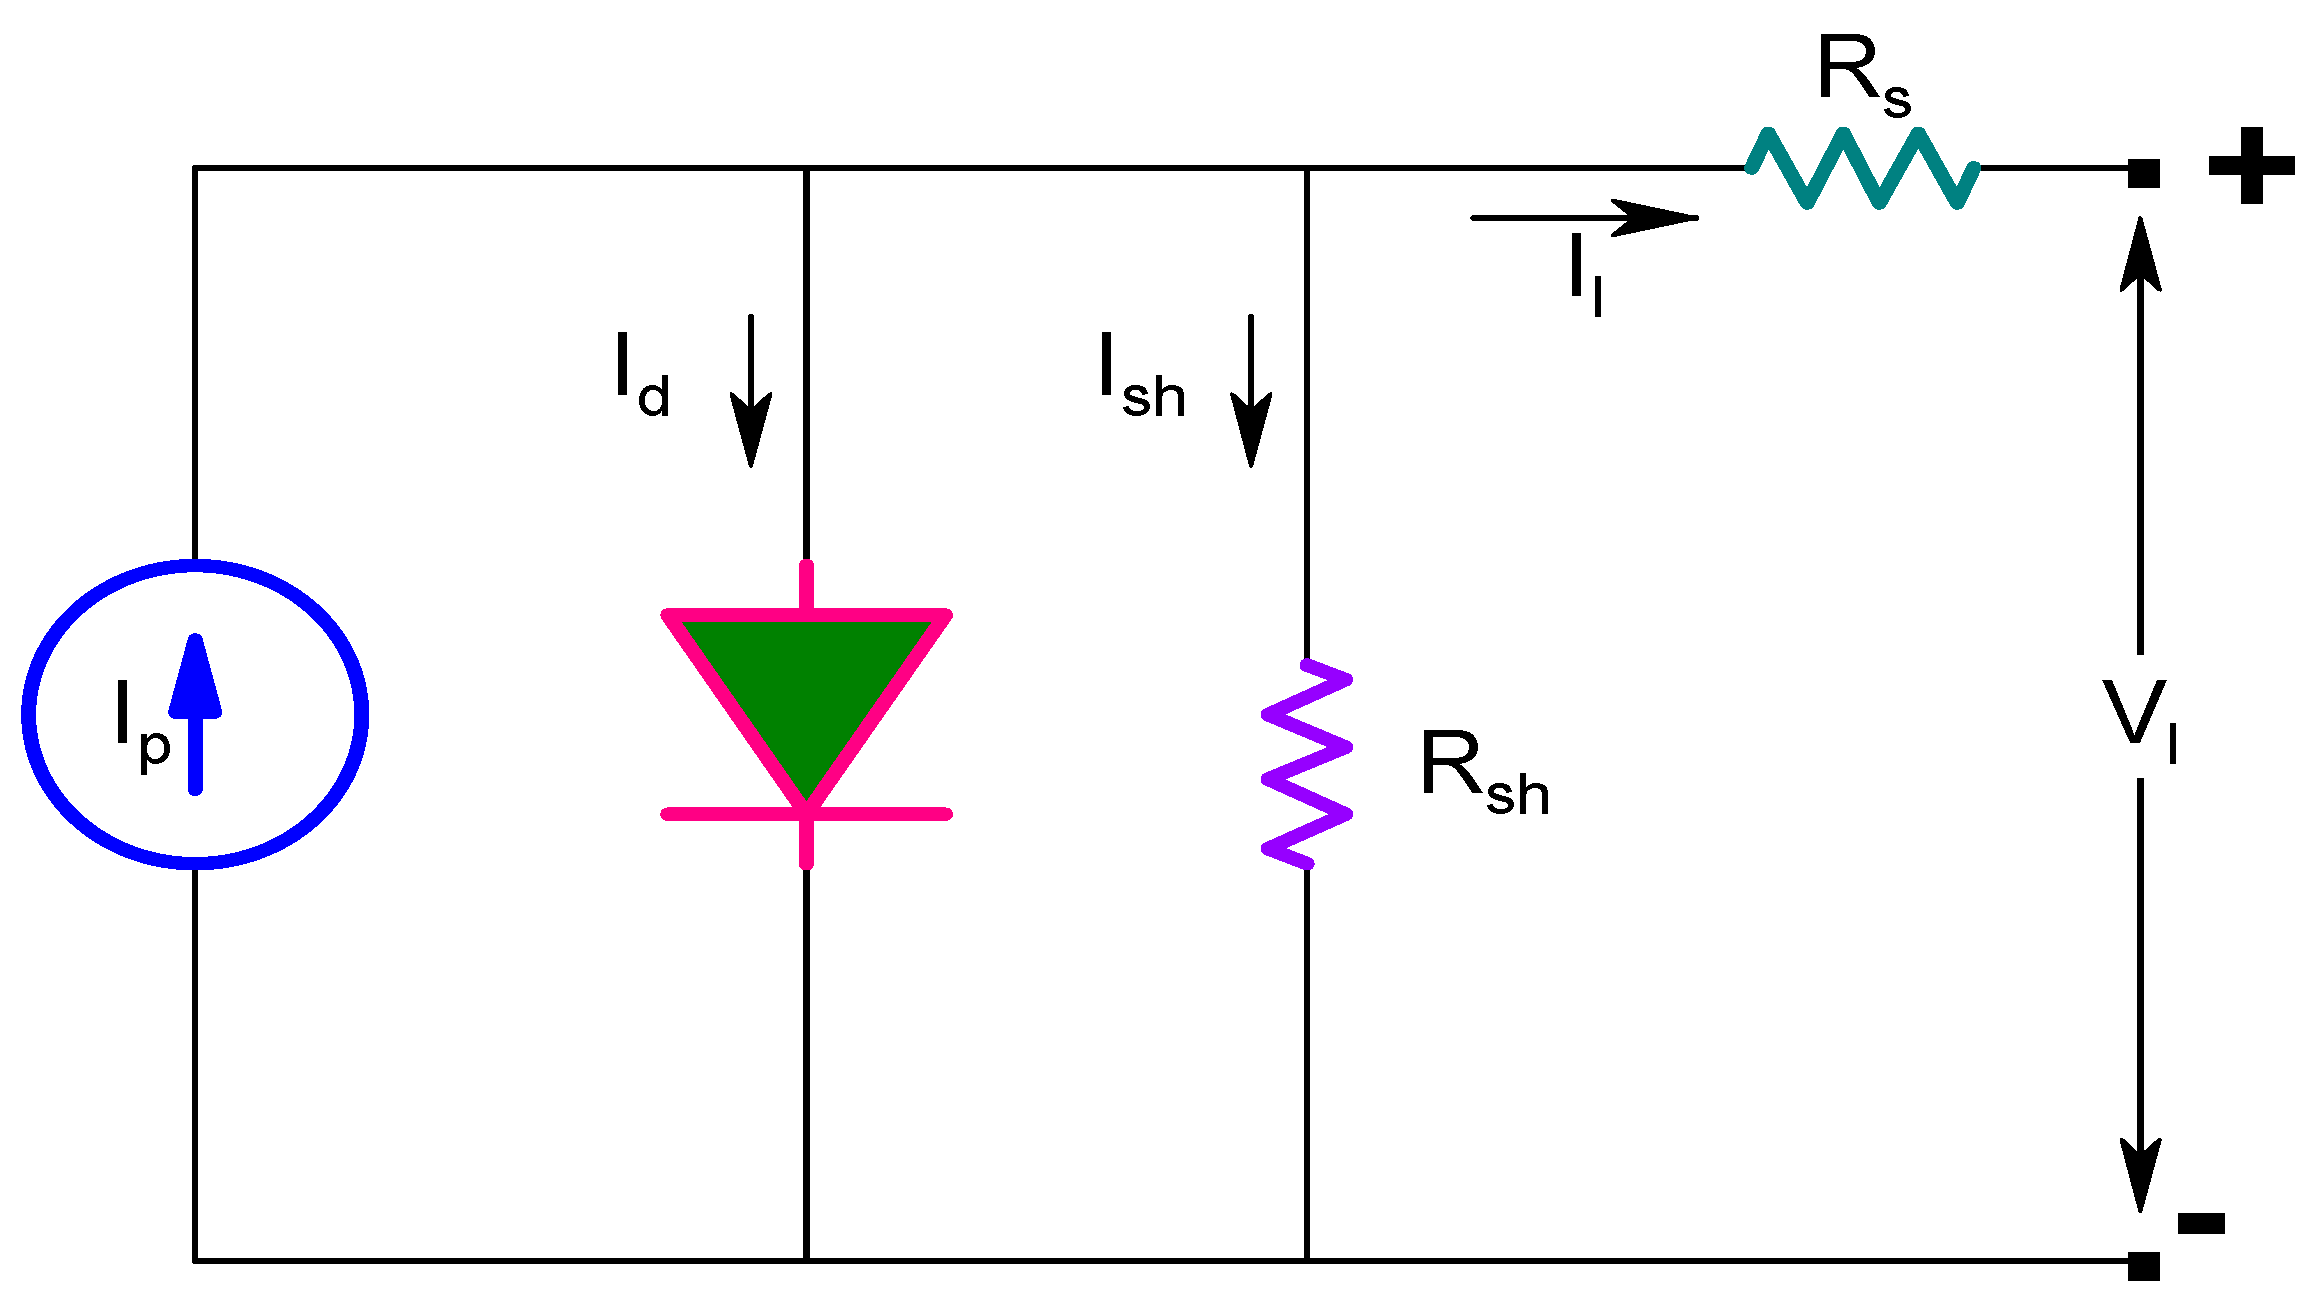
2.1. Photovoltaic Panel Module Model

The equivalent circuit of PV panel module is shown in Figure 1. The relation between the current and voltage at the output terminal for the PV panel module is expressed as:
I l / N p = I p I S D [ e x p ( q ( V l / N s + R s I l / N p ) a k B T ) 1 ] V l / N s + R s I l / N p R s h
where N s and N p represent the number of solar cells connected in series and parallel, respectively.   I l stands for cell current in the output, I p represents the photogenerated current, I S D stands for the reverse saturation current. V l , a , R s , k B , T and q are the cell output voltage, diode ideality constant, series resistance, Boltzmann constant (1.381 × 10⁻²³ J/K), junction temperature (°K), and electron charge (1.602 × 10⁻¹⁹ C), respectively. It is depicted in Figure 1 that only five parameters ( I p , I S D , a,   R s and R s h ) are needed to be estimated for the minimum value of RMSE.

2.2. Objective Function

The key deliverables in this work are the optimization of unknown specifications for both SDM and DDM models to reduce the error between the experimental and estimated data. The objective function for error used here is the same as the one that authors have used previously in [23,24,25]:
RMSE = 1 k   N = 1 k f ( V l , I l ,   )
where V l   and I l are the measured voltage and current of the PV module. The parameter k stands for the number of experimental data sets. The best solution found by the TSA is represented by a vector X.
For the PV panel module model,
( f s i n g l e ( V l ,   I l ,   X ) =   I p I S D [ e x p ( q ( V l N s + R s I l N p ) a 1 k B T ) 1 ] V l N s + R s I l N p R s h I l N p   ( X =   I p ,   I S D ,   a ,   R s ,   R s h   )   )

3. Tunicate Swarm Algorithm

In [6], authors have proposed a new metaheuristic algorithm known as the Tunicate swarm algorithm. These are visible from a few meters’ distance and create a pale blue–green bioluminescent light which is intense in nature. These are cylindrically shaped and must open at one end only when they grow to the size of a few millimeters. Each tunic consists of growing a gelatinous tunic which helps to join all individuals. These tunicates are opened at one end only, and they grow up to a few millimeters in size. In every tunicate, a gelatinous tunic grows, which helps all the individuals to join. Each tunicate, through atrial syphons, generates jet propulsion from its opening by receiving water from the adjacent sea. To understand the actions of jet propulsion using the mathematical model, the tunicate should fulfill three conditions: prevent collisions between candidate solutions, step more toward the location of the best solution, and stick close to the best solution. Figure 2 depicts the process flow chart of TSA for parameter extraction.

3.1. Prevent Collisions between Candidate Solutions

We initialize the parameters A (constant), gravity force ( G ), water flow advection in the deep ocean ( F ), social force M and the maximum number of iterations:
A = G M
G = c 2 + c 3 F
  F = 2 × c 1
M = P m i n + c 1 × P m a x P m i n
where, c 1 , c 2 , c 3 are random numbers in the range [0,1], and P m i n and P m a x are considered as 1 and 4, respectively.

3.2. Step More toward the Location of the Best Solution

The search agents are moved in the direction of the finest neighbors after successfully preventing a conflict with the neighbors:
  P D = | F S r a n d × P p ( x ) |
where P D is the total distance between the search agent and food source, r a n d is the random number in the range [0,1], x indicates the current iteration, F S indicates the position of the food source, and P p ( x ) is the position of the tunicates.

3.3. Stick Close to the Best Solution

The search agent could even establish its position as the leading search agent.
P p ( x ) = { F S + A × P D ,   i f   r a n d 0.5 F S A × P D ,   i f   r a n d   < 0.5
The position of all the tunicates is updated with respect to the position of the first two tunicates as follows:
P p ( x + 1 ) = P p ( x ) + P p ( x + 1 ) 2 + c 1
where P p ( x + 1 ) represents the updated position of the tunicates.

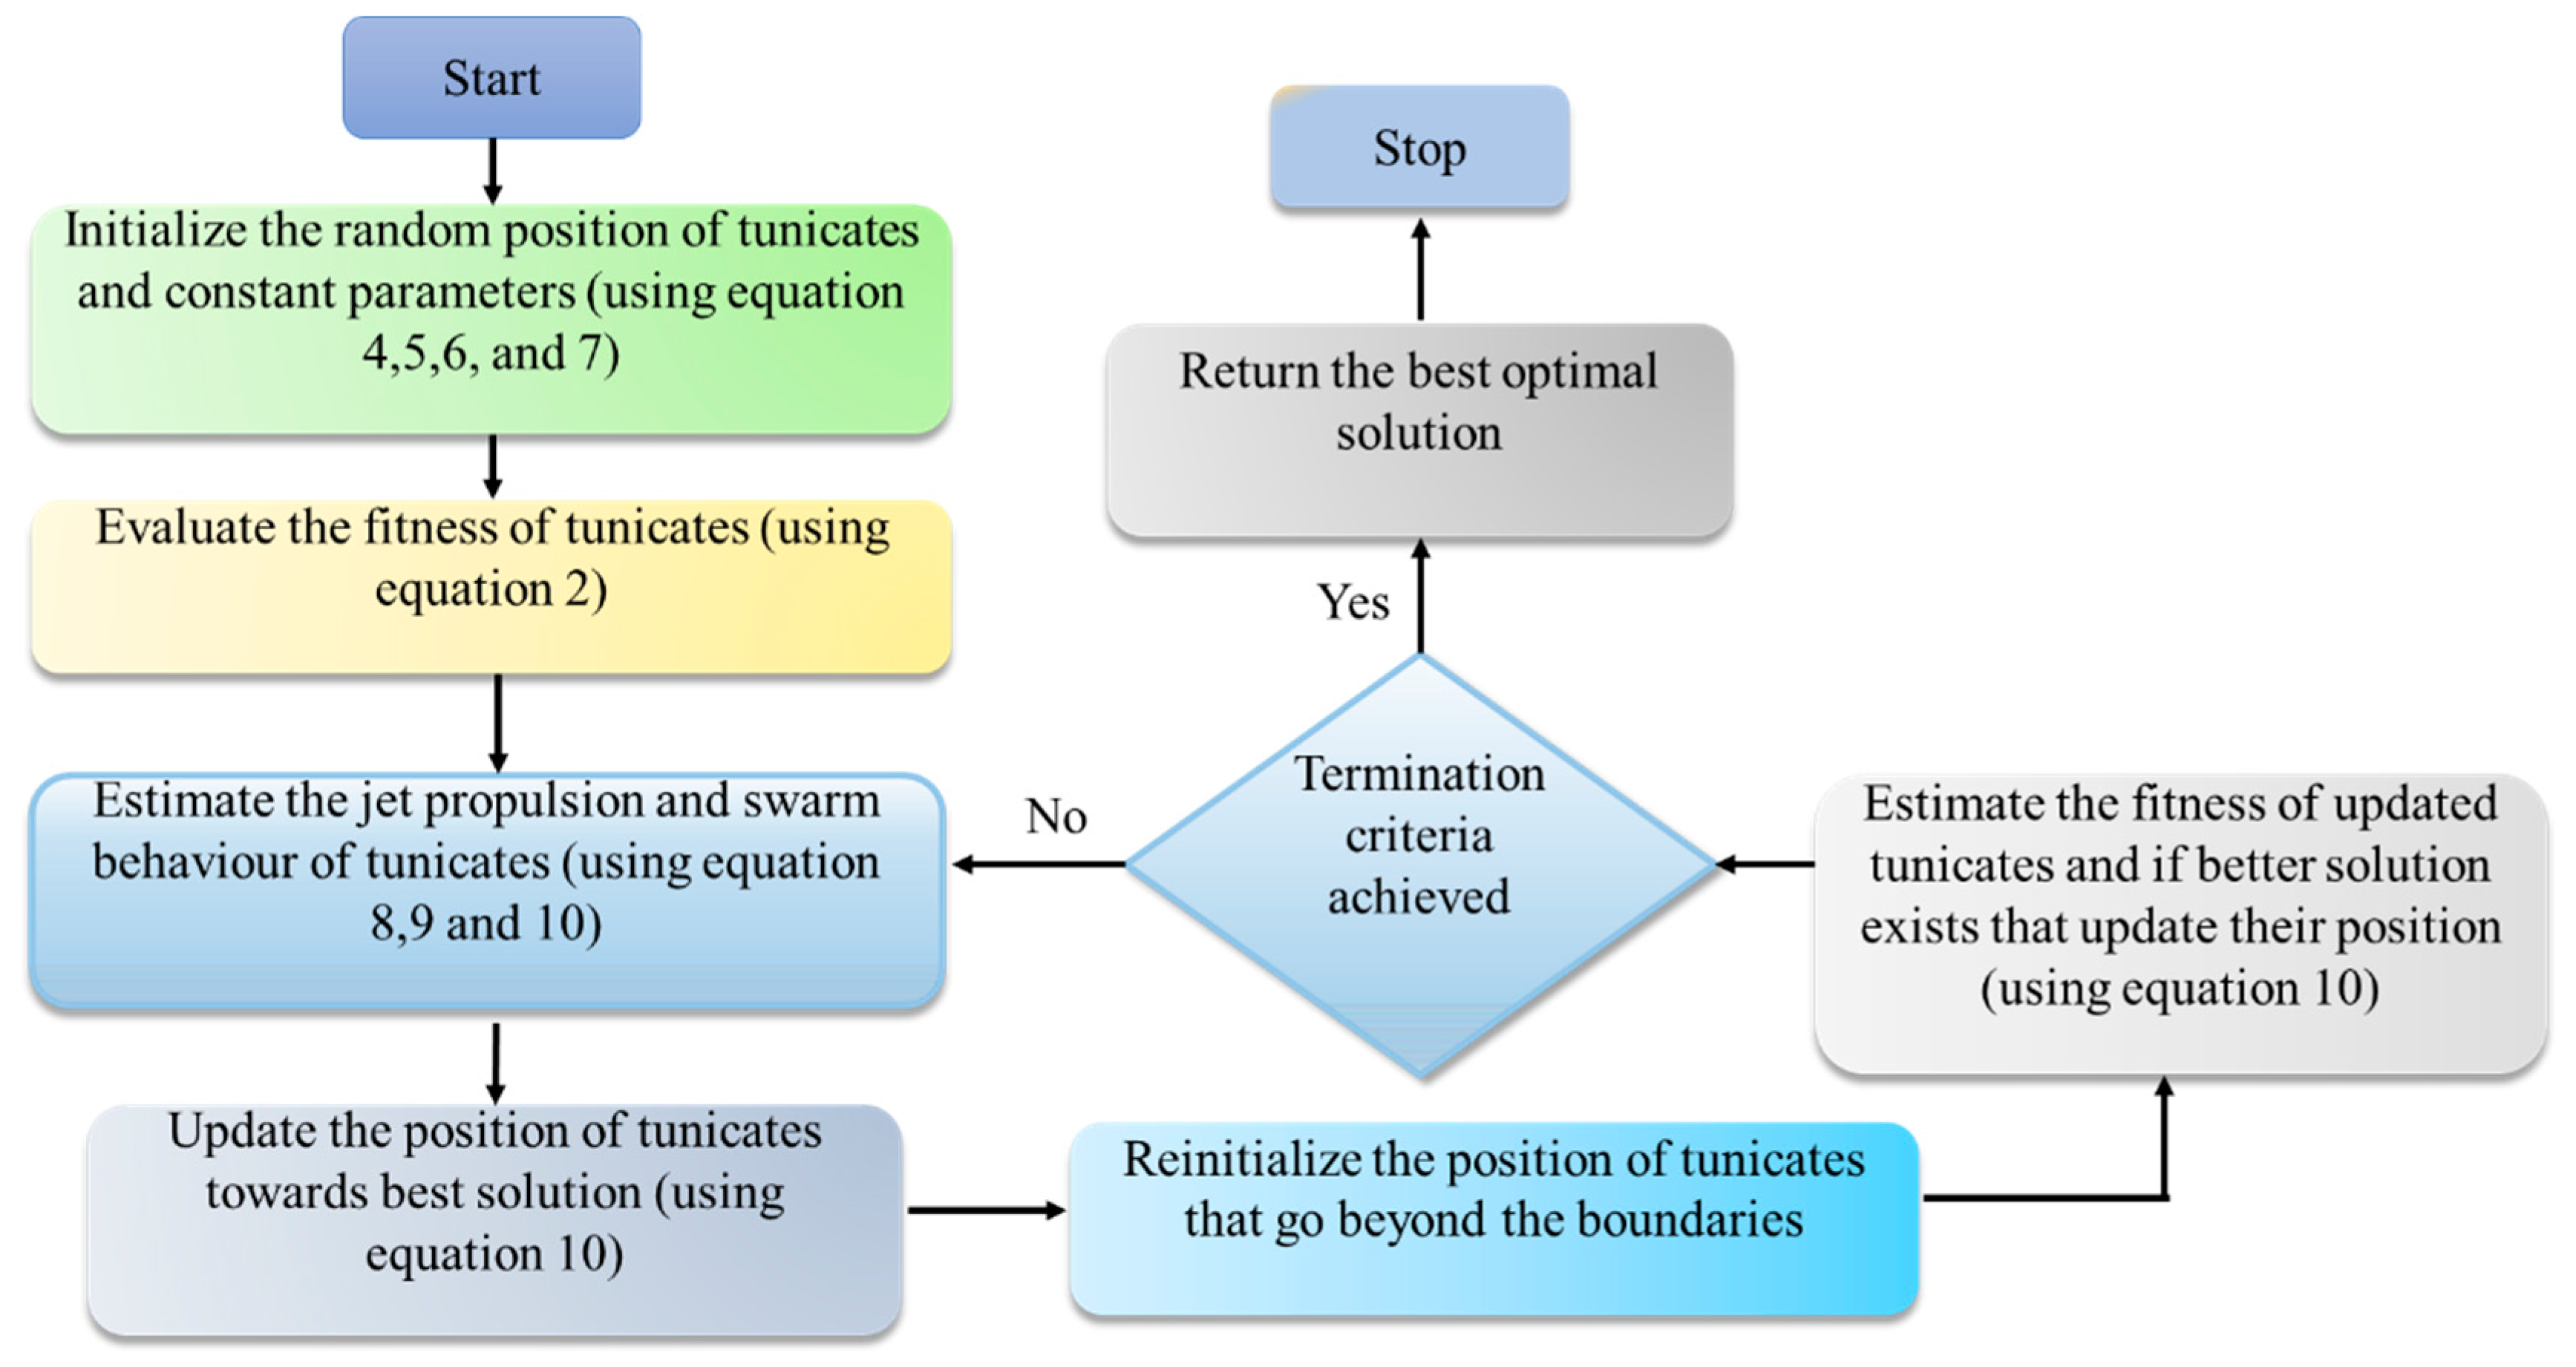
3.4. Implementation of TSA for Parameter Extraction

Step 1. Initialize the population of search agents of the fifth order dimension in the search space. The fifth order dimension represents the photovoltaic current (Ip), series resistance (Rs), shunt resistance (Rsh), diode saturation current (ISD), and diode ideality factor (a). The range of these parameters are [0–10, 0.001–2, 0–2000, 0–50, 0–100].
Step 2. Regulate the fitness of all agents in the search space using Equation (2).
Step 3. Update the position of the agents at every iteration using TSA. The algorithm is designed to work in the minimization mode; thus, the location of the particles that acquire minimum costs represents the optimized parameters of SDM with minimum RMSE.

4. Results and Discussion

We analyzed the feasibility of the TSA algorithm and evaluated it using mainly one polycrystalline PV module (Photowatt-PWP201) under standard temperature conditions (i.e., 1000 W/m2 at 30 °C). As a result, the retrieved PV module parameters were monitored and used to create simulated I-V data. The reliability of the WOAPSO is evaluated and compared with six metaheuristics algorithms, i.e., GSA [7], SCA [8], GWO [9], PSO [10], WOA [11], PSOGSA [12], as well as other algorithms existing in the literature. For the experiment, the sample size and the objective function evaluations are set between 30 and 50,000, respectively. Furthermore, a minimum of 30 separate runs are carried out to prevent contingency.
The efficiency of the proposed method is evaluated based on distinct empirical tools such as the internal absolute error (IAE), the Relative Error (RE), the precision of the curve fitting, and the global minimum convergence patterns. The experimental values of current and voltage are taken from [13] by using Photowatt-PWP201 (Photowatt, Bourgoin-Jallieu, France). The Photowatt-PWP201 PV module is composed of 36 polycrystalline cells arranged in a series to generate current-voltage data under standard temperature conditions. The data collection consists of a total of 23 for the PV module. For a reasonable comparison, the search ranges (i.e., upper and lower bound) for each parameter are tabulated in Table 1, which are the same as those being used by investigators in [13,14,15]. The TSA algorithm is implemented on the MATLAB 2018a (MathWorks, Mexico) platform with Intel ® core ™ i7-HQ CPU, 2.4 GHz, 16 GB RAM laptop.

4.1. TSA for Parameter Extraction of Photowatt-PWP201 PV Module

This section discusses the evaluation efficiency of the TSA algorithm. Parameters of the Photowatt-PWP201 PV module were estimated under standard temperature conditions by utilizing the SDM model. The optimal values of the five parameters (Ip, Isd, a, Rs, Rsh) for SDM of the solar PV module are presented in Table 2. The characteristics curves of current-voltage (I-V) and power-voltage (P-V) are redrawn by implementing the TSA algorithm under optimized parameters. Figure 3 demonstrates the estimated and experimental I-V and P-V characteristics curves. It can be observed that the estimated parameters show good agreement with the measured ones, which proves the efficient performance of the TSA.
Table 3 represents the Internal absolute error (IAE) between the estimated and experimental data sets. Every determined value of IAE (at 1000 W/m2 and 30 °C) is less than 0.0195, which indicates that the parameters optimized by the TSA are very precise. The error relating to the measurement results for each of the 23 pair points is determined by the IAE and Relative Error (RE). The IAE and RE values are calculated using Equations (11) and (12). The curve of IAE and RE between experimental and estimated values is shown in Figure 4.
IAE = | I m e a s u r e d I s i m u l a t e d |
RE = ( I m e a s u r e d I s i m u l a t e d ) I m e a s u r e d

4.2. Convergence Analysis

The convergence analysis was performed to examine the computational competence of the TSA. The convergence curves of the solar PV module are presented in Figure 5. It is depicted in Figure 5 that the TSA algorithm outperforms the GSA, PSOGSA, SCA, and WOA algorithms in terms of convergence speed and generates a precise solution for the identical number of function evaluations (i.e., 50,000).

4.3. Robustness and Statistics Analysis

This section presents the statistical evaluation based on mean, minimum, maximum, and standard deviation of the RMSE for all previously implemented methods and comparison concerning precision and consistency of the distinct algorithms in a total of thirty runs, as depicted in Table 4. The mean of the RMSE is calculated to evaluate the precision of the algorithms, and the standard deviation is calculated to evaluate the consistency of the parameter estimation methods.
In Table 4, it is depicted that the proposed TSA algorithm significantly outperforms the GSA, PSOGSA, SCA, and WOA algorithms for the solar PV module model. The statistical results presented in Table 4 indicate that TSA is the most accurate and reliable parameter optimization technique.

5. Discussion

The TSA algorithm is successfully developed and implemented for parameter extraction of the polycrystalline Photowatt-PWP201 PV module. The I-V and P-V curves obtained by the optimization process show excellent accord with the measured data. The IAE values (both current and power) validate the exactness of the optimized parameters. The statistical evaluation confirms that the standard deviation is very small, which confirms that the TSA is an accurate and useful parameter estimation technique. The average execution time of every algorithm on the Photowatt-PWP201 PV module is established and introduced in Figure 6. Compared to GSA, PSOGSA, SCA, and WOA, TSA requires a much lower time of about 11 s, while PSOGSA has the worst execution time of about 40 s. The Friedman ranking test results are shown in Figure 7. The best ranking is obtained by the TSA, followed by SCA, WOA, GSA, and PSOGSA.

6. Conclusions

In this research investigation, TSA was employed to estimate the Photowatt-PWP201 PV panel module parameters under standard temperature conditions. It should be noted the TSA technique is, for the first time, intended to reliably track the estimation of parameters for photovoltaic models. The observations based on the experimental findings are defined as follows:
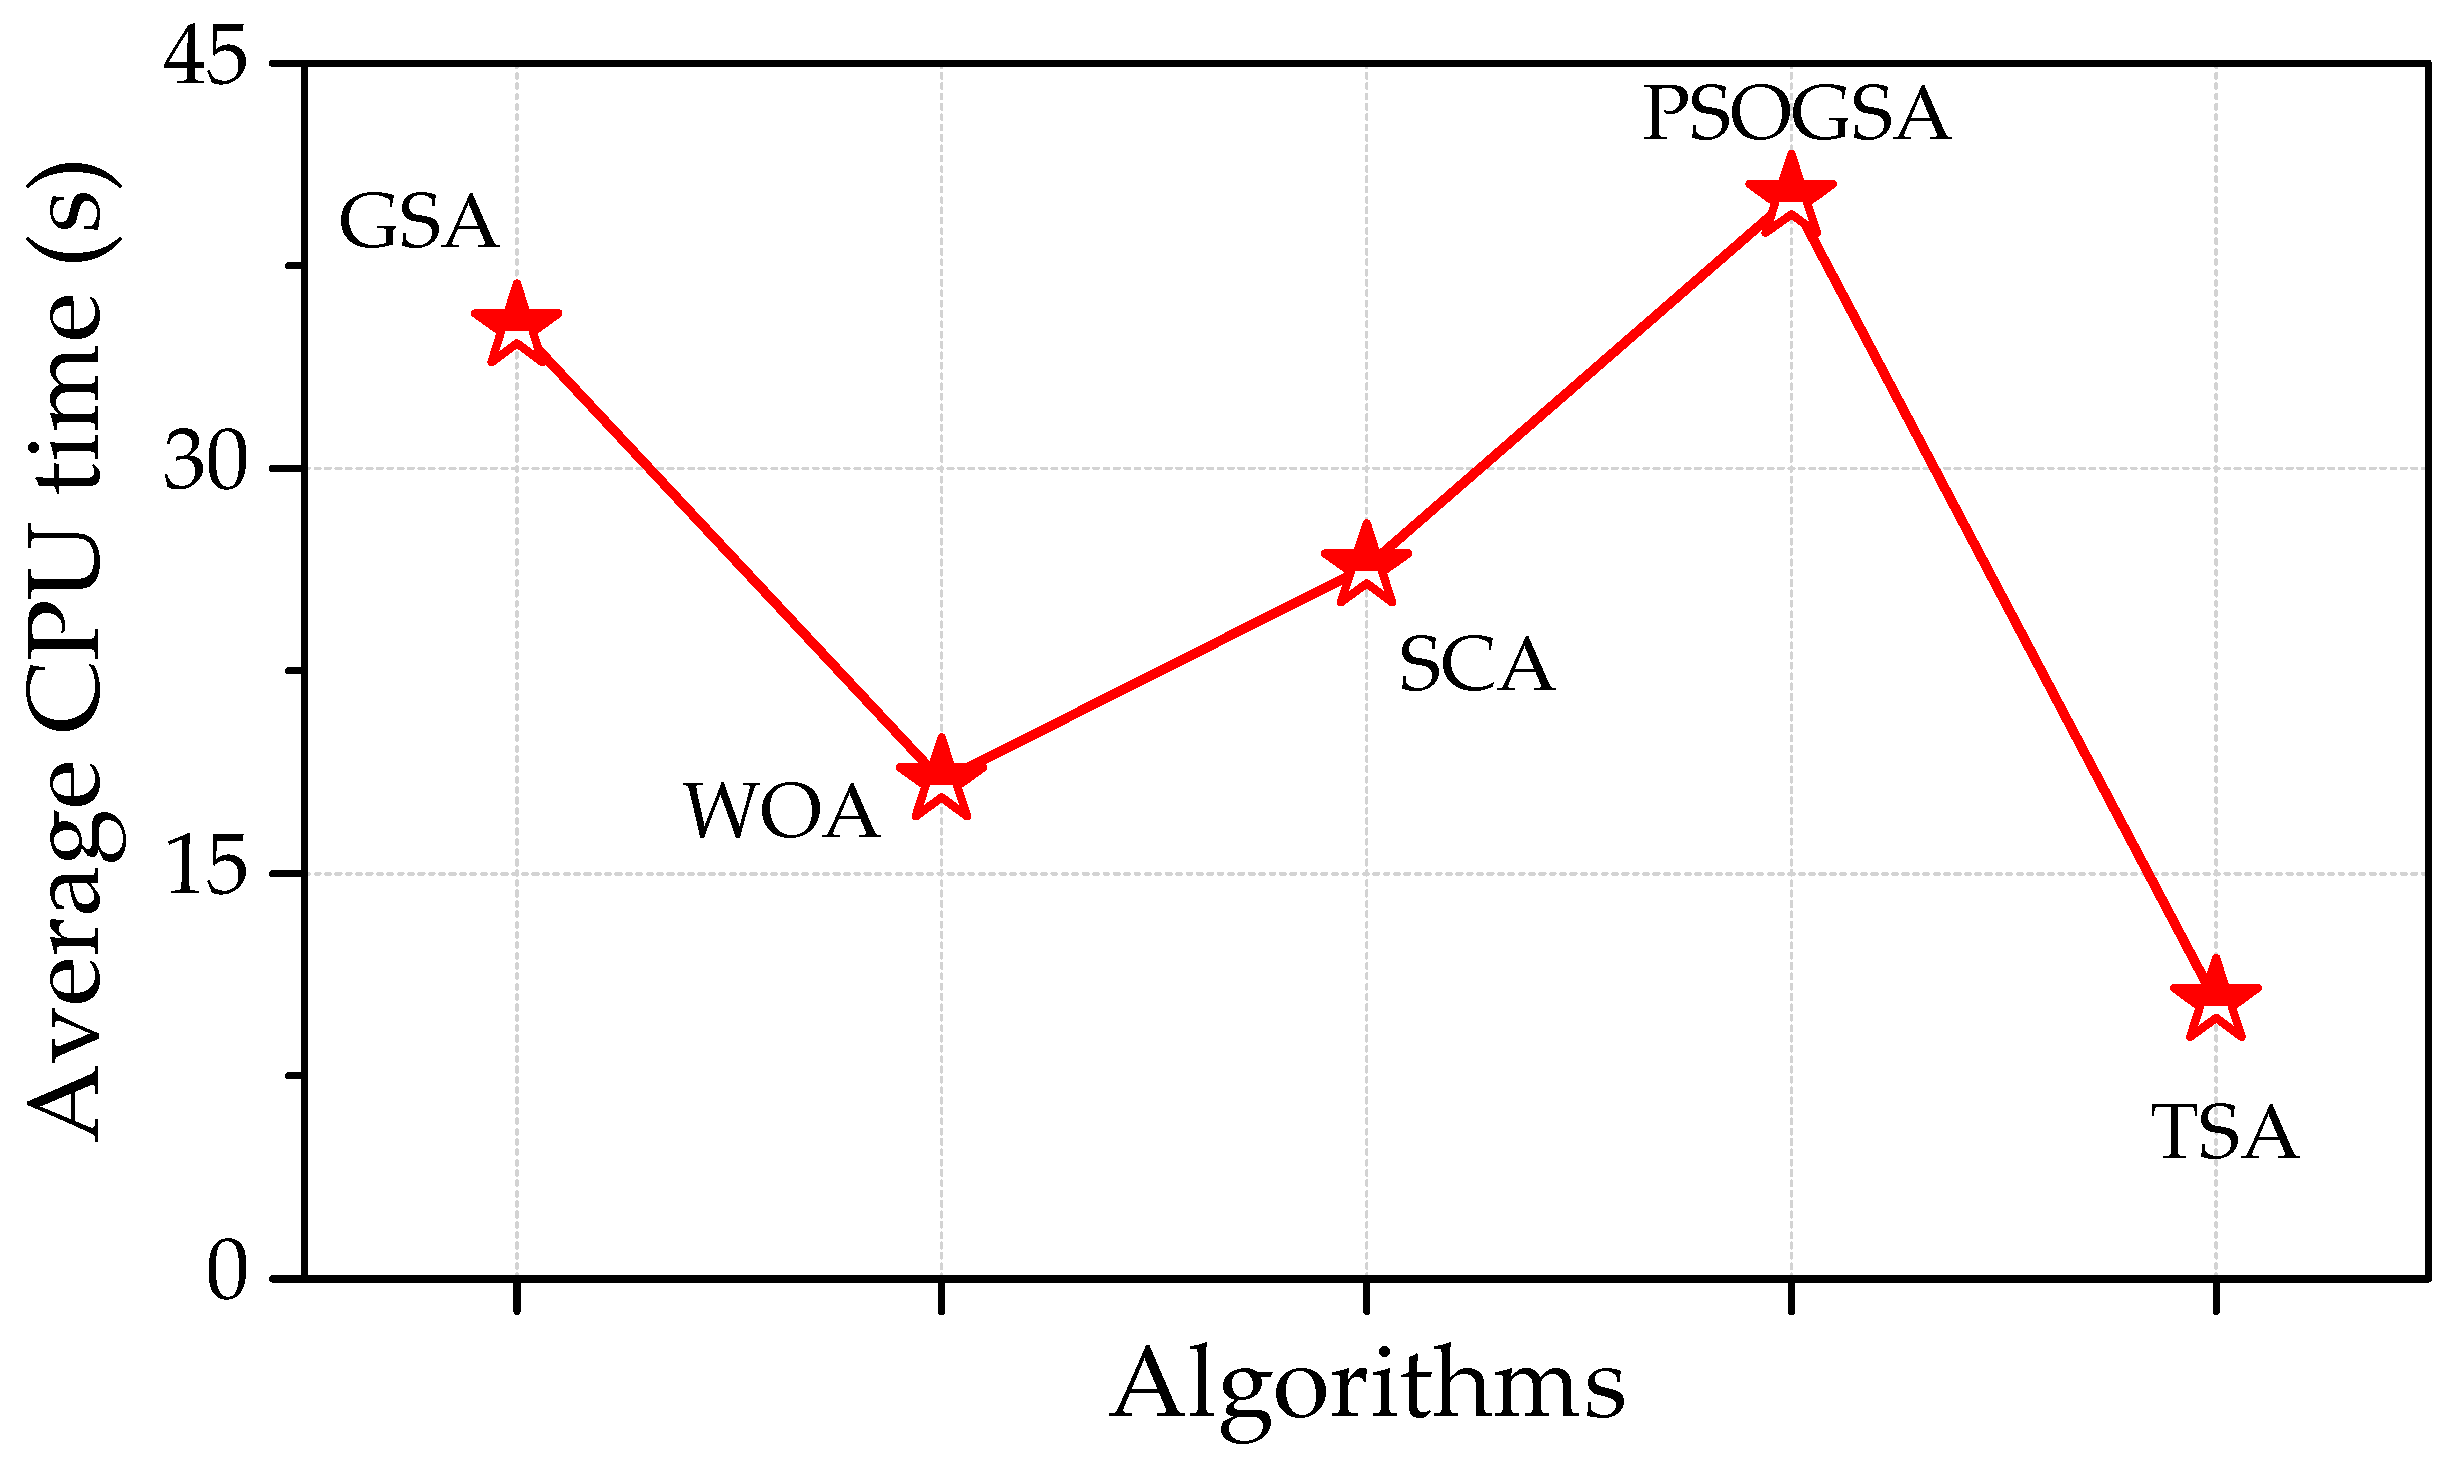
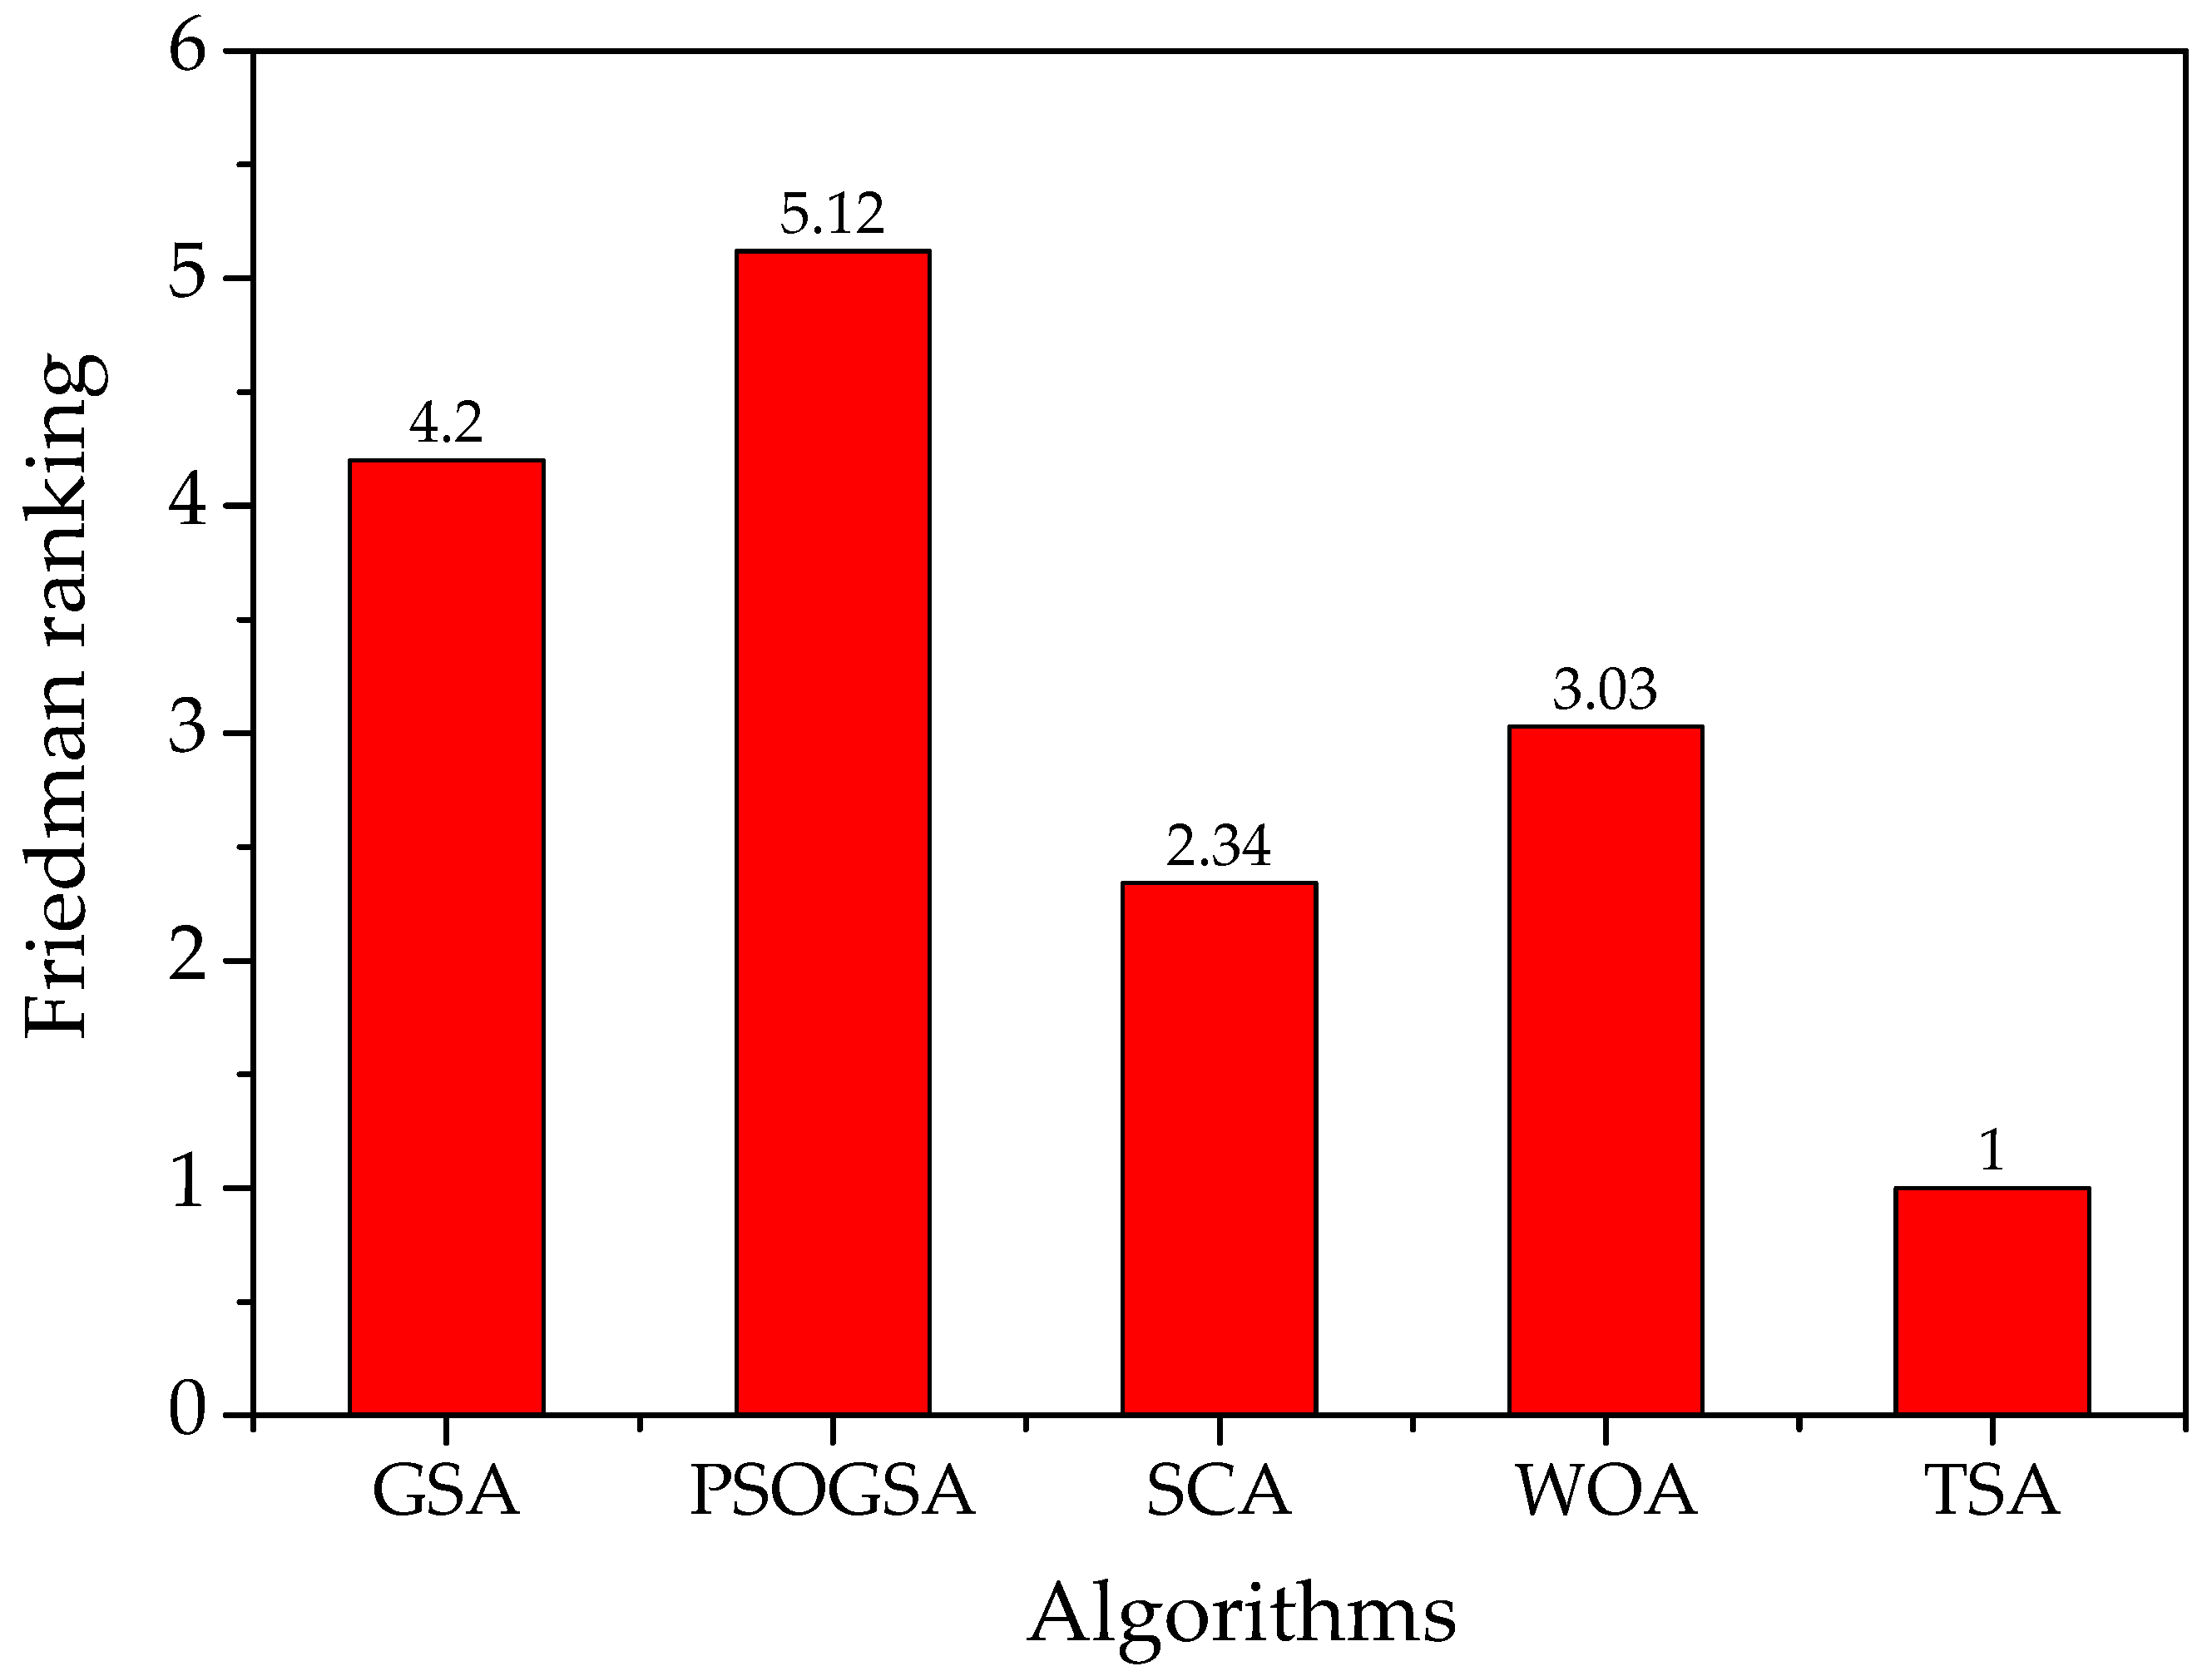
  • TSA is relatively accurate and reliable at delivering the solution in terms of the RMSE compared with other algorithms such as GSA, PSOGSA, SCA, and WOA.
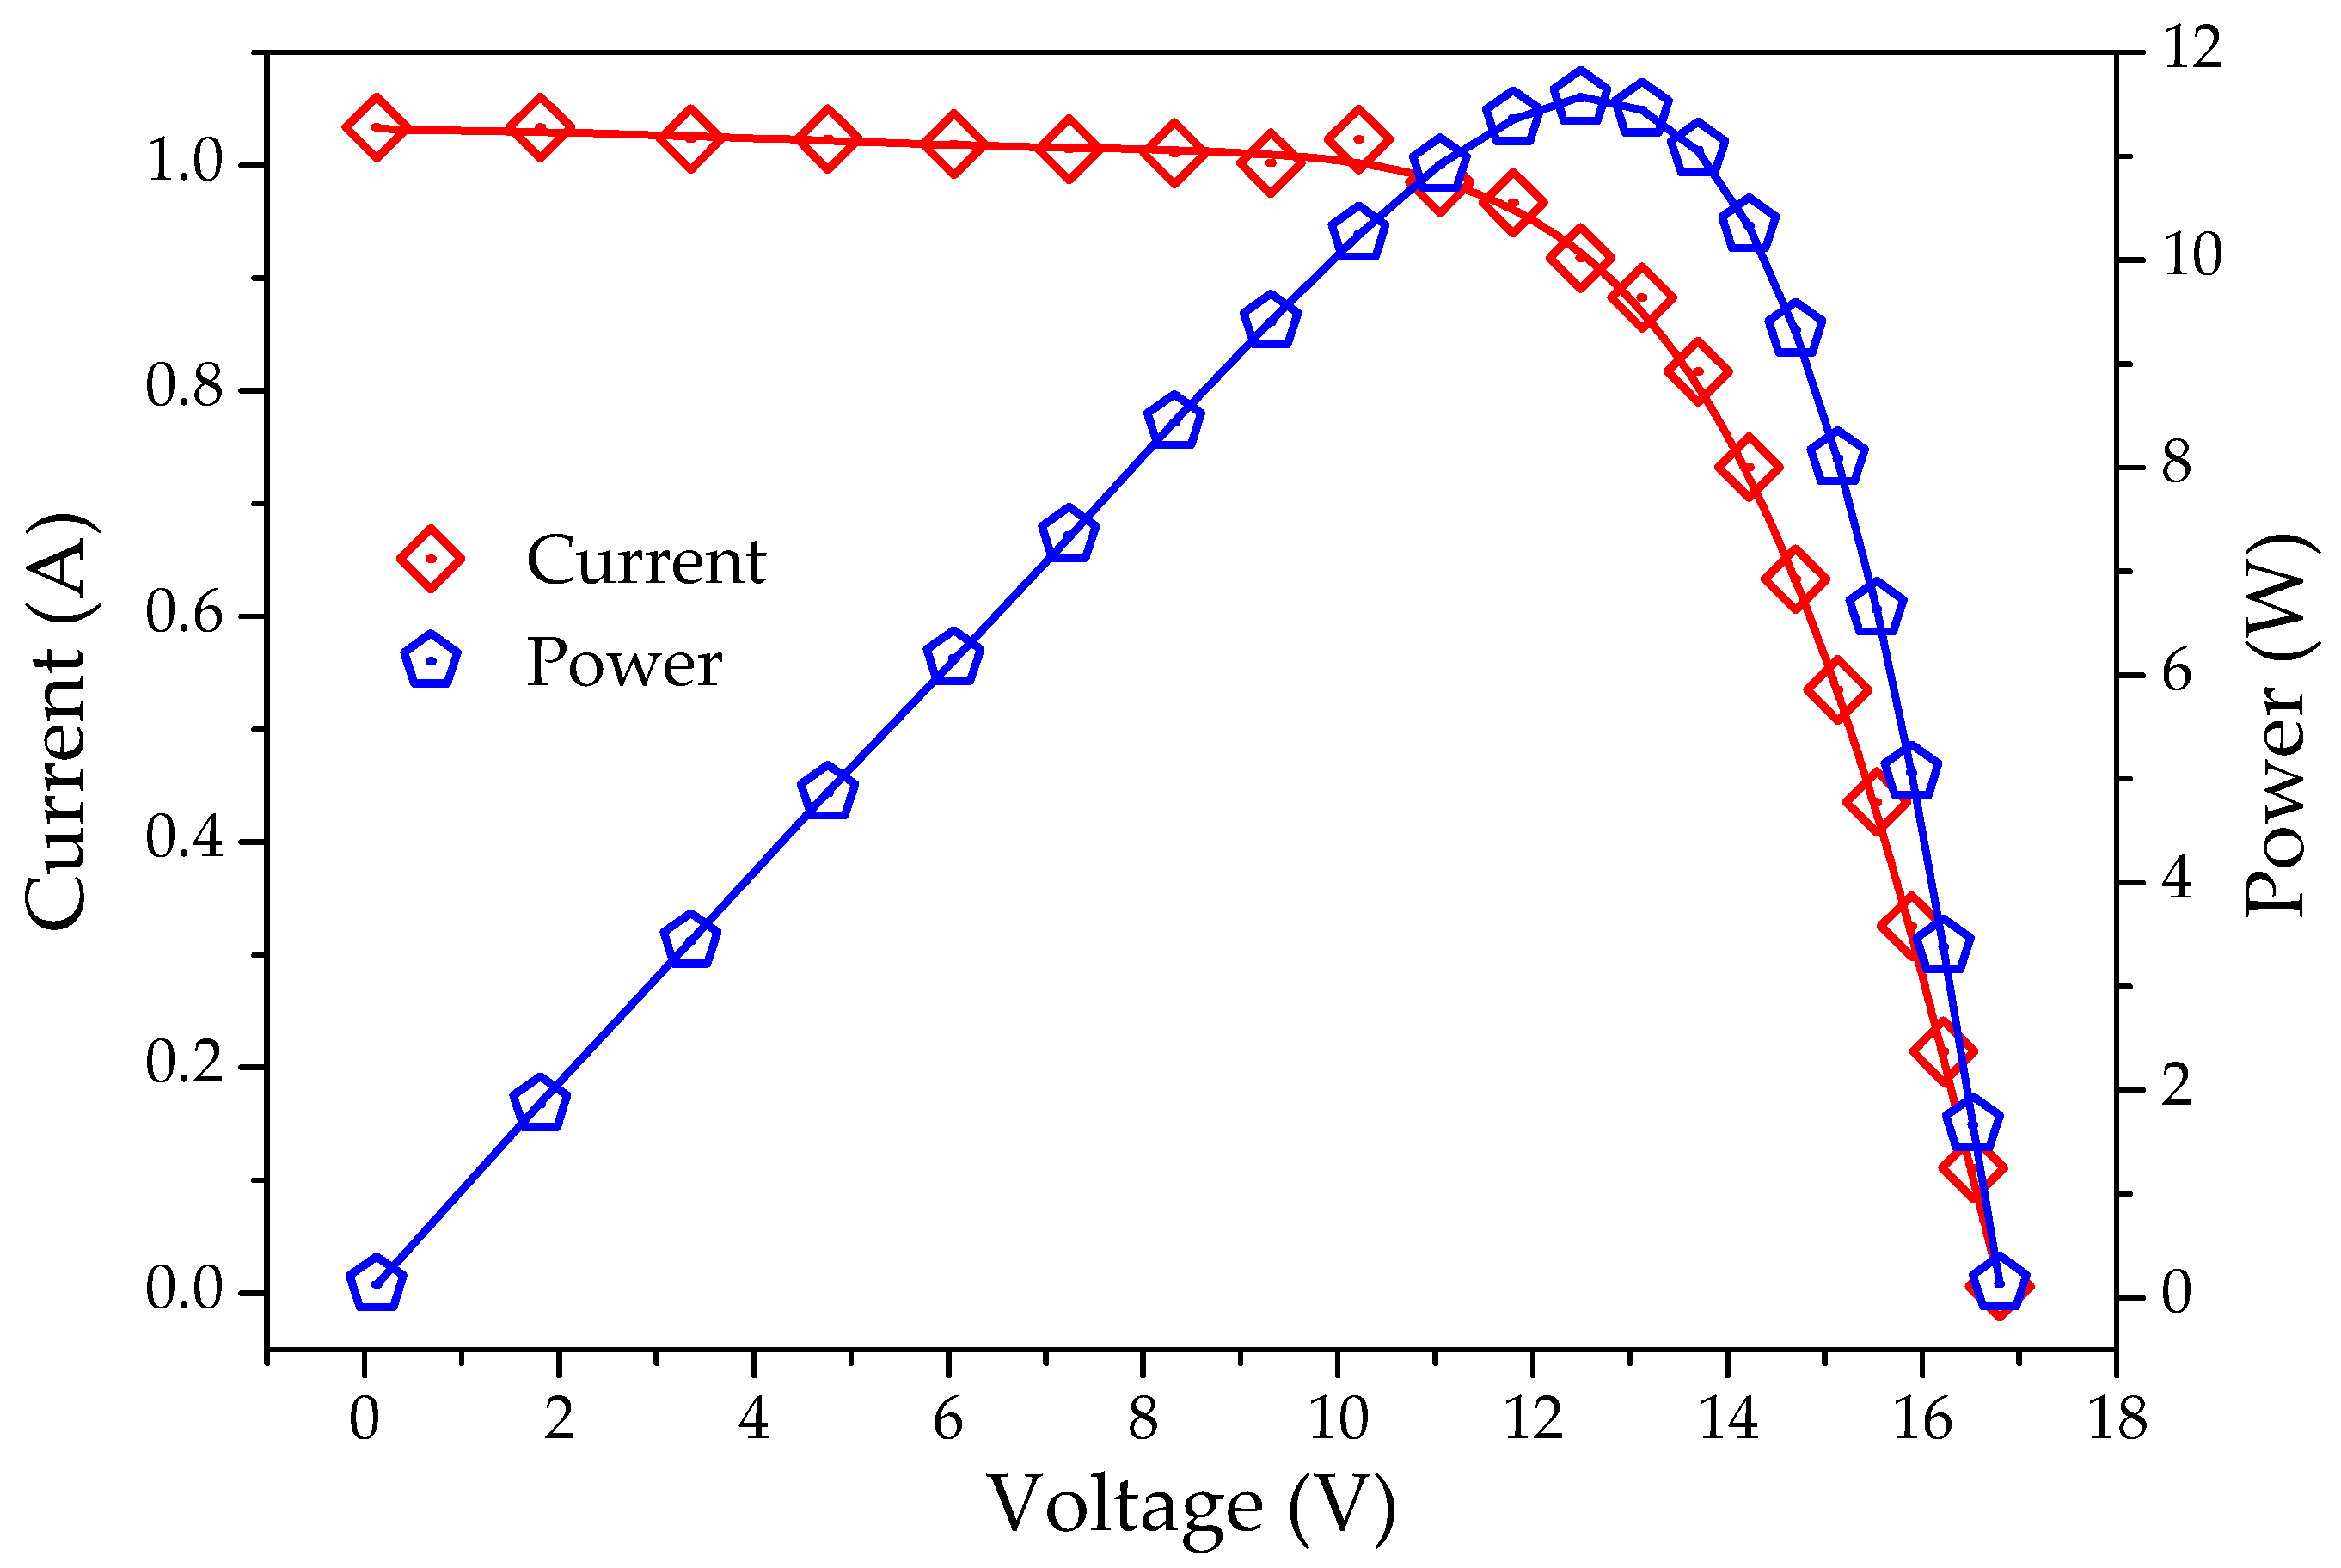
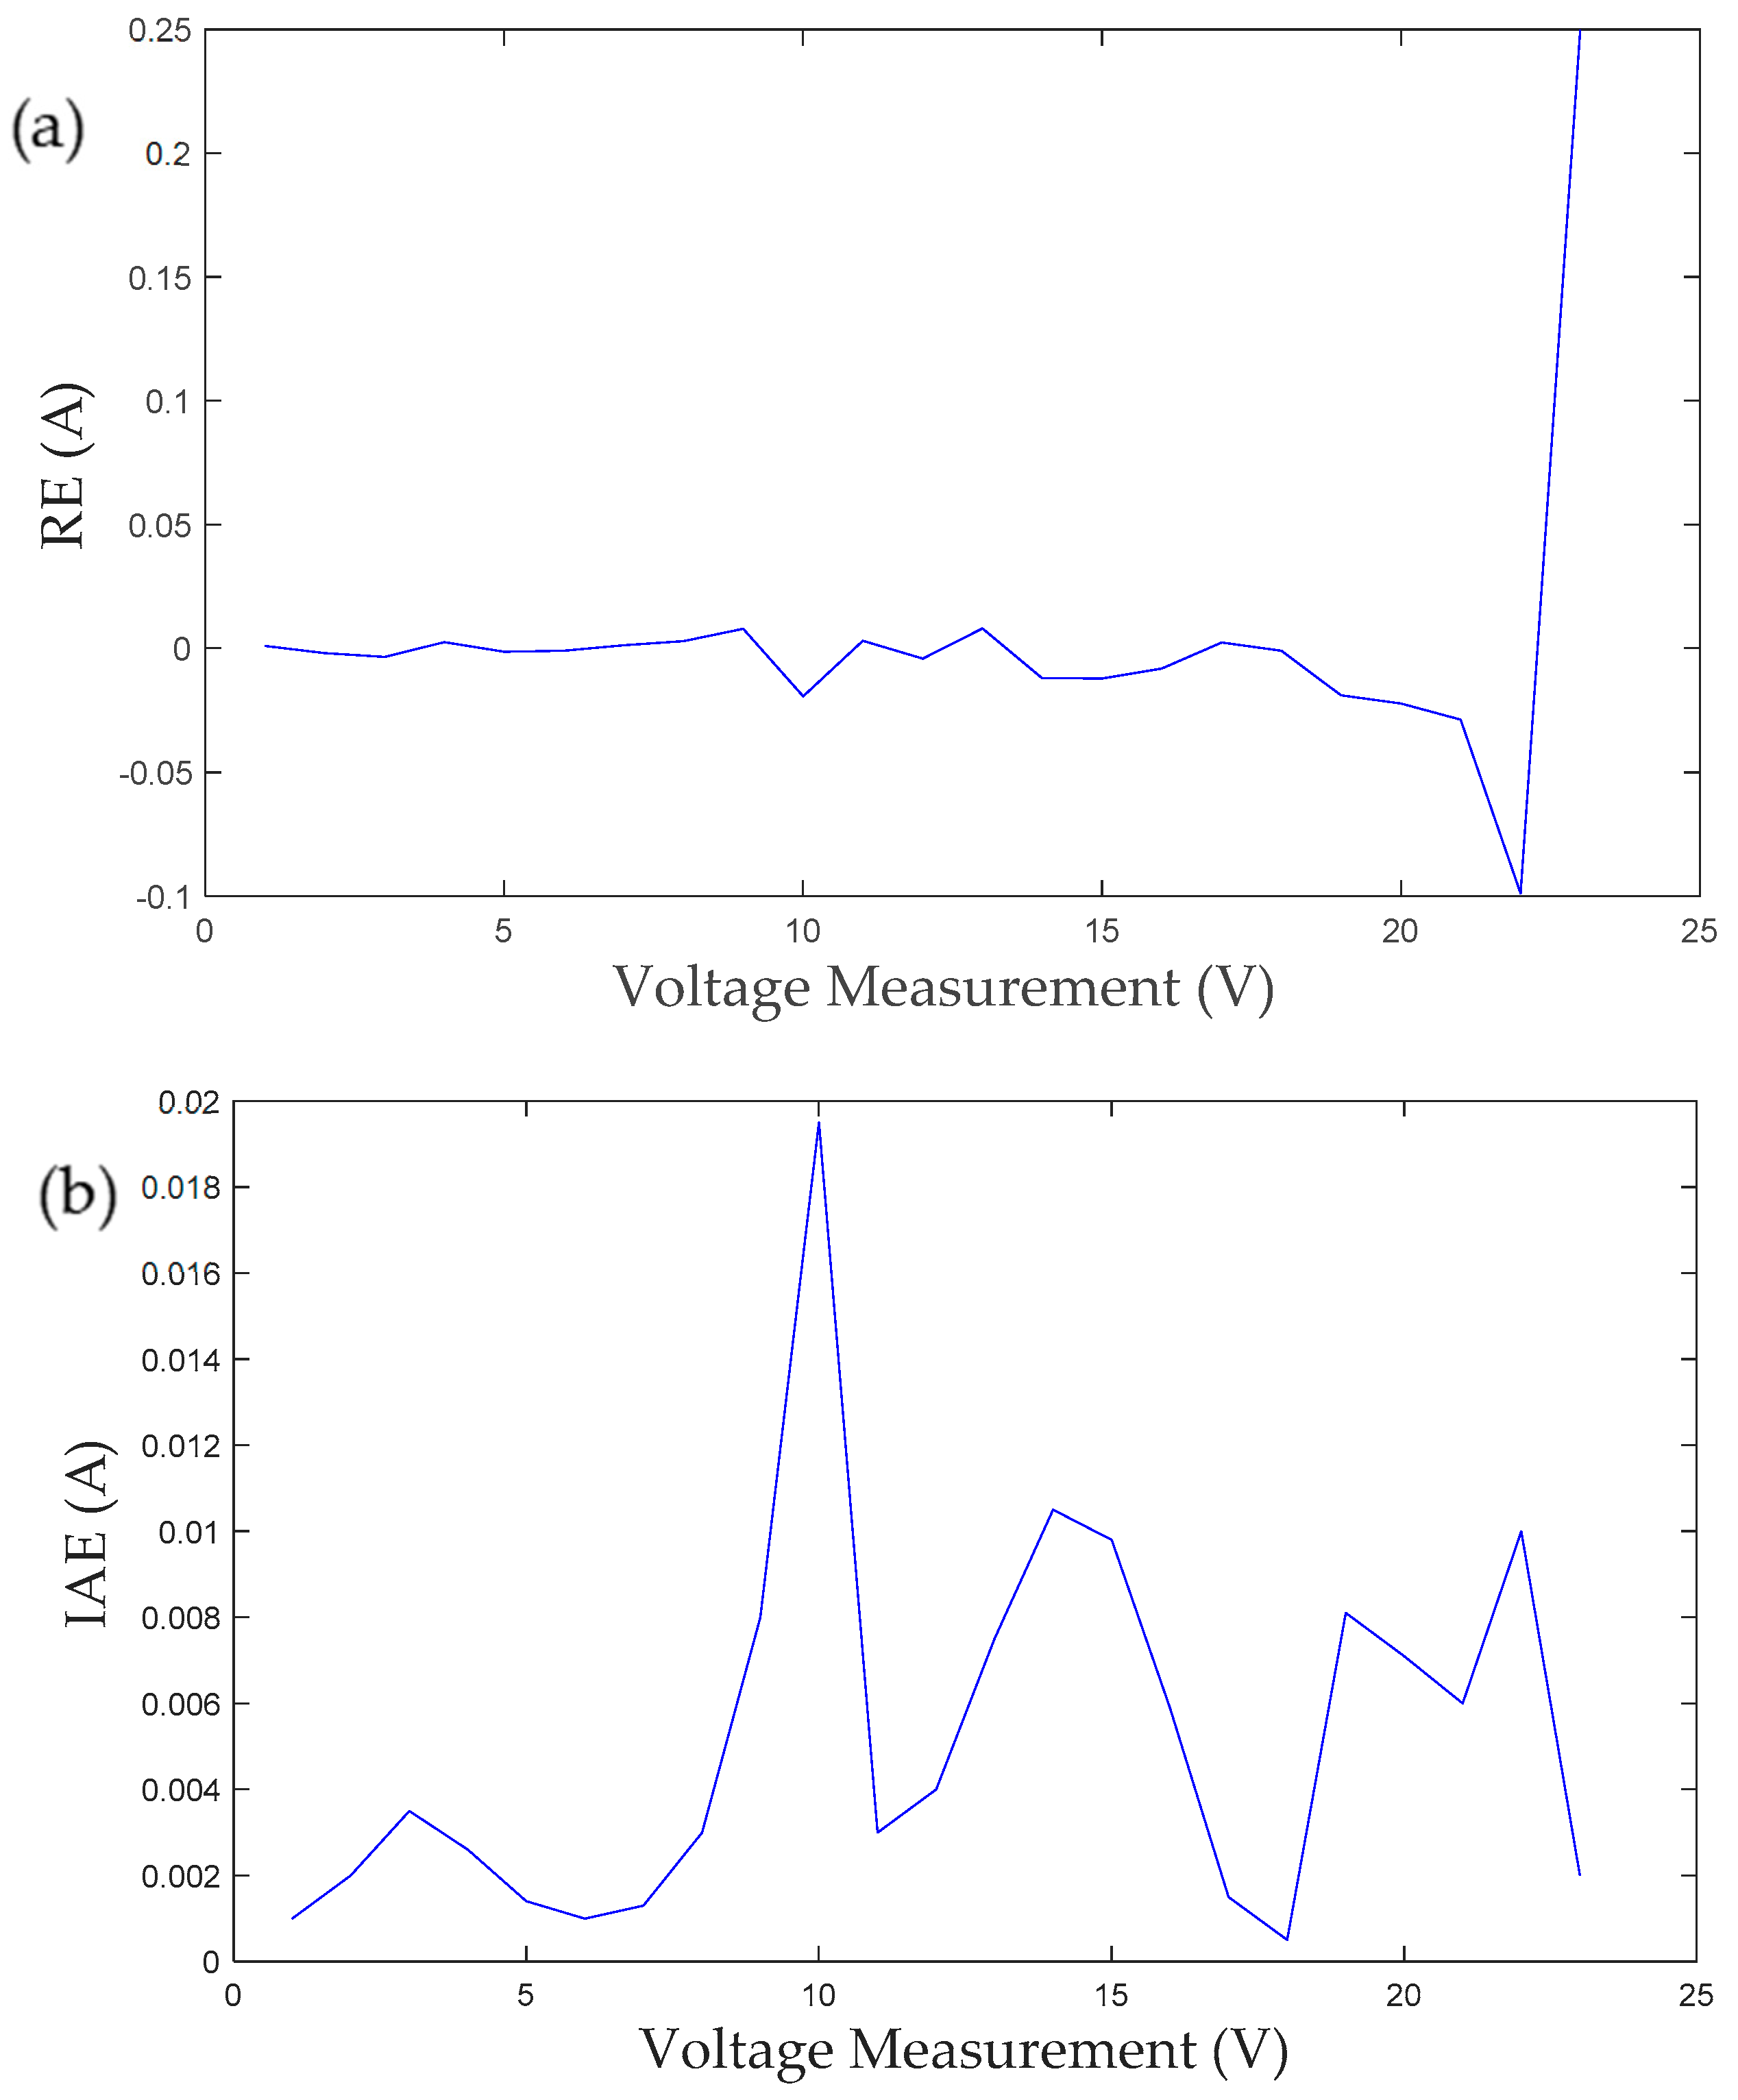
  • The I-V and P-V characteristic curves and IAE results indicate that TSA can generate the optimized value of the estimated parameters for all the solar PV cell models compared with other algorithms.
  • The statistical analysis depicts the robustness of the TSA technique in parameter estimation problems under standard operating conditions.
  • The convergence curves demonstrate that the TSA obtains the best estimated parameters in terms of RMSE (5.06 × 10⁻⁴).
  • From the above discussion, it can be concluded that the TSA is an effective and robust technique to estimate the unknown optimized parameters of the solar PV module model under standard operating conditions.

Author Contributions

Conceptualization: A.S. (Abhishek Sharma), and A.S. (Abhinav Sharma); methodology and formal analysis: A.S. (Abhishek Sharma) and V.J.; investigation, A.S. (Abhinav Sharma) and S.K.T.; writing—original draft preparation, A.S. (Abhishek Sharma) and A.D.; writing—review and editing, A.S. (Abhinav Sharma), A.D. and S.K.T.; supervision, V.J. and B.A.; fund acquisition: B.A. All authors have read and agreed to the published version of the manuscript.

Funding

This work was supported in part by the European Commission H2020 TWINNING JUMP2Excel (Joint Universal activities for Mediterranean PV integration Excellence) project under grant 810809.

Data Availability Statement

The data presented in this study are available on request from the corresponding author.

Acknowledgments

Authors are thankful to anonymous reviewers and editors for their suggestions.

Conflicts of Interest

The authors declare no conflict of interest.

Abbreviations and Symbols

The following abbreviations and nomenclature are used in this manuscript:
IpPhoto Diode Current
IsdReverse Saturation Current
RsSeries Resistance
RshShunt Resistance
ADiode Ideality Factor
RMSERoot Mean Square Error
PVPhotovoltaic
I-VCurrent-Voltage
P-VPower-Voltage
MPPTMaximum Power Point Tracking
VocOpen Circuit Voltage
ImppMaximum Power Point Current
IscShort Circuit Current
PSOParticle Swarm Optimization
WOAWhale Optimization Algorithm
SDMSingle diode Model
DDMDouble diode Model
IAEInternal Absolute Error
RERelative Error
GSAGravitational Search Algorithm
SCASine Cosine Algorithm
PSOGSAParticle Swarm Optimization Gravitational Search Algorithm

References

  1. Coello, C.; Lamont, G.; van Veldhuizen, D. Evolutionary Algorithms for Solving Multi-Objective Problems; Springer: New York, NY, USA, 2007. [Google Scholar]
  2. Khanna, V.; Das, B.K. A Method to Model the Maximum Power Output of Photovoltaic Modules Using Statistical Analysis and Matlab-Simulink Simulation; A Method to Model the Maximum Power Output of Photovoltaic Modules Using Statistical Analysis and Matlab-Simulink Simulation. 2018. Available online: http://www.academia.edu/download/59389096/a-method-to-model-the-maximum-power-output-of-simulation-IJERTV7IS05022020190525-102639-p9gz0d.pdf (accessed on 7 October 2020).
  3. Chen, X.; Yu, K.; Du, W.; Zhao, W.; Liu, G. Parameters identification of solar cell models using generalized oppositional teaching learning based optimization. Energy 2016, 99, 170–180. [Google Scholar] [CrossRef]
  4. KYu, K.; Liang, J.; Qu, B.; Chen, X.; Wang, H. Parameters identification of photovoltaic models using an improved JAYA optimization algorithm. Energy Convers. Manag. 2017, 150, 742–753. [Google Scholar] [CrossRef]
  5. Merchaoui, M.; Sakly, A.; Mimouni, M.F. Particle swarm optimisation with adaptive mutation strategy for photovoltaic solar cell/module parameter extraction. Energy Convers. Manag. 2018, 175, 151–163. [Google Scholar] [CrossRef]
  6. Kaur, S.; Awasthi, L.K.; Sangal, A.; Dhiman, G. Tunicate Swarm Algorithm: A new bio-inspired based metaheuristic paradigm for global optimization. Eng. Appl. Artif. Intell. 2020, 90. [Google Scholar] [CrossRef]
  7. Rashedi, E.; Nezamabadi-Pour, H.; Saryazdi, S. GSA: A Gravitational Search Algorithm. Inf. Sci. 2009, 179, 2232–2248. [Google Scholar] [CrossRef]
  8. Mirjalili, S. SCA: A Sine Cosine Algorithm for solving optimization problems. Knowl.-Based Syst. 2016, 96, 120–133. [Google Scholar] [CrossRef]
  9. Mirjalili, S.; Mirjalili, S.M.; Lewis, A. Grey Wolf Optimizer. Adv. Eng. Softw. 2014, 69, 46–61. [Google Scholar] [CrossRef] [Green Version]
  10. Kennedy, C. Review of Mid-to High-Temperature Solar Selective Absorber Materials. 2002. Available online: https://www.osti.gov/biblio/15000706 (accessed on 6 September 2020).
  11. Mirjalili, S.; Lewis, A. The Whale Optimization Algorithm. Adv. Eng. Softw. 2016, 95, 51–67. [Google Scholar] [CrossRef]
  12. Mirjalili, S. Hybrid Particle Swarm Optimization and Gravitational Search Algorithm for Multilayer Perceptron Learning. Ph.D. Thesis, Universiti Teknologi Malaysia, Skudai, Malaysia, 2011. [Google Scholar]
  13. AlHajri, M.; El-Naggar, K.; AlRashidi, M.; Al-Othman, A. Optimal extraction of solar cell parameters using pattern search. Renew. Energy 2012, 44, 238–245. [Google Scholar] [CrossRef]
  14. Gong, X.; Kulkarni, M. Design optimization of a large scale rooftop photovoltaic system. Sol. Energy 2005, 78, 362–374. [Google Scholar] [CrossRef]
  15. Chellaswamy, C.; Ramesh, R. Parameter extraction of solar cell models based on adaptive differential evolution algorithm. Renew. Energy 2016, 97, 823–837. [Google Scholar] [CrossRef]
  16. Bayoumi, A.; El-Sehiemy, R.; Mahmoud, K.; Lehtonen, M.; Darwish, M.M.F. Assessment of an Improved Three-Diode against Modified Two-Diode Patterns of MCS Solar Cells Associated with Soft Parameter Estimation Paradigms. Appl. Sci. 2021, 11, 1055. [Google Scholar] [CrossRef]
  17. Mughal, M.A.; Ma, Q.; Xiao, C. Photovoltaic Cell Parameter Estimation Using Hybrid Particle Swarm Optimization and Simulated Annealing. Energies 2017, 10, 1213. [Google Scholar] [CrossRef] [Green Version]
  18. Sharma, A.; Sharma, A.; Averbukh, M.; Jately, V.; Azzopardi, B. An Effective Method for Parameter Estimation of a Solar Cell. Electronics 2021, 10, 312. [Google Scholar] [CrossRef]
  19. Elazab, O.S.; Hasanien, H.M.; Alsaidan, I.; Abdelaziz, A.Y.; Muyeen, S.M. Parameter Estimation of Three Diode Photovoltaic Model Using Grasshopper Optimization Algorithm. Energies 2020, 13, 497. [Google Scholar] [CrossRef] [Green Version]
  20. Oliva, D.; Ewees, A.A.; Aziz, M.A.E.; Hassanien, A.E.; Peréz-Cisneros, M. A Chaotic Improved Artificial Bee Colony for Parameter Estimation of Photovoltaic Cells. Energies 2017, 10, 865. [Google Scholar] [CrossRef] [Green Version]
  21. Stornelli, V.; Muttillo, M.; de Rubeis, T.; Nardi, I. A New Simplified Five-Parameter Estimation Method for Single-Diode Model of Photovoltaic Panels. Energies 2019, 12, 4271. [Google Scholar] [CrossRef] [Green Version]
  22. Al-Taani, H.; Arabasi, S. Solar Irradiance Measurements Using Smart Devices: A Cost-Effective Technique for Estimation of Solar Irradiance for Sustainable Energy Systems. Sustainability 2018, 10, 508. [Google Scholar] [CrossRef] [Green Version]
  23. Park, C.-Y.; Hong, S.-H.; Lim, S.-C.; Song, B.-S.; Park, S.-W.; Huh, J.-H.; Kim, J.-C. Inverter Efficiency Analysis Model Based on Solar Power Estimation Using Solar Radiation. Processes 2020, 8, 1225. [Google Scholar] [CrossRef]
  24. Bocca, A.; Bergamasco, L.; Fasano, M.; Bottaccioli, L.; Chiavazzo, E.; Macii, A.; Asinari, P. Multiple-Regression Method for Fast Estimation of Solar Irradiation and Photovoltaic Energy Potentials over Europe and Africa. Energies 2018, 11, 3477. [Google Scholar] [CrossRef] [Green Version]
  25. Kiani, A.T.; Nadeem, M.F.; Ahmed, A.; Khan, I.; Elavarasan, R.M.; Das, N. Optimal PV Parameter Estimation via Double Exponential Function-Based Dynamic Inertia Weight Particle Swarm Optimization. Energies 2020, 13, 4037. [Google Scholar] [CrossRef]
  26. Ramadan, A.; Kamel, S.; Korashy, A.; Yu, J. Photovoltaic cells parameter estimation using an enhanced teaching–learning-based optimization algorithm. Iran. J. Sci. Technol. Trans. Electr. Eng. 2020, 44, 767–779. [Google Scholar] [CrossRef]
  27. Kiani, A.T.; Nadeem, M.F.; Ahmed, A.; Sajjad, I.A.; Raza, A.; Khan, I.A. Chaotic inertia weight particle swarm optimization (CIWPSO): An efficient technique for solar cell parameter estimation. In Proceedings of the 2020 3rd International Conference on Computing, Mathematics and Engineering Technologies (iCoMET), Sindh, Pakistan, 29–30 January 2020; pp. 1–6. [Google Scholar]
  28. Halko, S.; Halko, К. Research of electrical and physical characteristics of the solar panel on the basis of cogeneration photoelectric modules. Збірник наукових праць ΛΌГOΣ 2020, 2, 39–44. [Google Scholar] [CrossRef]
  29. El-Hameed, M.A.; Elkholy, M.M.; El-Fergany, A.A. Three-diode model for characterization of industrial solar generating units using Manta-rays foraging optimizer: Analysis and validations. Energy Convers. Manag. 2020, 219, 113048. [Google Scholar] [CrossRef]
  30. Abdulrazzaq, A.K.; Bognár, G.; Plesz, B. Evaluation of different methods for solar cells/modules parameters extraction. Sol. Energy 2020, 196, 183–195. [Google Scholar] [CrossRef]
  31. Babich, V.; Lobel, R.; Şafak, Y. Promoting Solar Panel Investments: Feed-in-Tariff vs. Tax-Rebate Policies. Manuf. Serv. Oper. Manag. 2020, 22, 1148–1164. [Google Scholar] [CrossRef]
Figure 1. Single diode model of photovoltaic panel module.
Electronics 10 00878 g001
Figure 2. Process flow diagram of the Tunicate swarm algorithm (TSA).
Electronics 10 00878 g002
Figure 3. Current-Voltage (I-V) and Power-Voltage (P-V) characteristics curve for estimated and experimental values for single-diode model of Photowatt-PWP201 PV Module. Symbols represent measured data, and optimized data are represented by solid lines.
Electronics 10 00878 g003
Figure 4. (a) Internal absolute error and (b) relative error curve between measured and estimated current for Photowatt-PWP201 PV Module.
Electronics 10 00878 g004
Figure 5. Convergence curve of TSA (Tunicate swarm algorithm) and the other four algorithms for single-diode model of Photowatt-PWP201 PV (Photovoltaic) Module.
Electronics 10 00878 g005
Figure 6. Comparison of the execution time of different metaheuristic algorithms.
Electronics 10 00878 g006
Figure 7. Ranking of TSA (Tunicate swarm algorithm) and other compared algorithms on Photowatt-PWP201 PV panel module according to the Friedman test.
Electronics 10 00878 g007
Table 1. Range of parameters for solar photovoltaic (PV) module.
ParametersPhotowatt-PWP201 PV Module
Lower BoundUpper Bound
Ip (A)010
Isd (µA)050
Rs (Ω)0.0012
Rsh (Ω)02000
a0100
Table 2. Comparison of TSA with other parameter estimation methods for Photowatt-PWP201 PV Module.
AlgorithmsIph (A)Rs (Ω)Rsh (Ω)Isd (µA)aRMSE
WOAPSO [18]1.50320.0213668.270.0241.5028.86 × 10−4
GSA0.027821201.0970.05058.45888.80 × 10−3
PSOGSA0.02180.64301100.4370.0179.78937.156 × 10−3
SCA1.00630.04961107.3990.0391.05321.28 × 10−2
WOA0.02640.0113588.50110.04241.44969.54 × 10−4
TSA0.02610.001720000.0531.47275.06 × 10−4
Table 3. The calculated current and absolute error results of TSA (Tunicate swarm algorithm) for solar PV (Photovoltaic) module.
ObservationsVL (V)IL (A)Isim (A)IAE (A)Pmeasured (W)Psimulted (W)IAE (W)
10.12461.03451.03350.0010.12880.12560.0032
20.12481.03151.03350.0020.12870.12260.0061
31.80931.031.03350.00351.86351.87650.013
43.35111.0261.02340.00263.43823.43540.0028
54.76221.0221.02340.00144.86694.87660.0097
66.05381.0181.0190.0016.16276.14560.0171
77.23641.01551.01420.00137.34857.32560.0229
88.31891.0141.0110.0038.43538.44530.01
99.30971.011.0020.0089.40279.41240.0097
1010.21631.00351.0230.019510.25210.2450.007
1111.04490.9880.9850.00310.912310.92340.0111
1211.80180.9630.9670.00411.365111.35540.0097
1312.49290.92550.9180.007511.562111.57220.0101
1413.12310.87250.8830.010511.449911.4450.0049
1513.69830.80750.81730.009811.061311.05210.0092
1614.22210.72650.73240.005910.332310.3210.0113
1714.69950.63450.6330.00159.32689.3130.0138
1815.13460.53450.5350.00058.08948.07540.014
1915.53110.42750.43560.00816.63956.63670.0028
2015.89290.31850.32560.00715.06185.05240.0094
2116.22290.20850.21450.0063.38243.37240.01
2216.52410.1010.1110.011.66891.65640.0125
2316.79870.0080.0060.0020.13430.13470.0004
Sum of IAE 0.0594 0.0927
Table 4. Statistical results of the root mean square error (RMSE) of different algorithms for Photowatt-PWP201 PV Modules.
Photowatt-PWP201 Module ModelAlgorithmRMSE
MinMeanMaxSD
GSA8.80 × 10−32.65 × 10−12.08 × 10−15.85 × 10⁻³
PSOGSA7.156 × 10−36.47 × 10-32.83 × 10−11.81 × 10⁻²
SCA1.28 × 10−22.26 × 10-16.35 × 10−11.78 × 10⁻²
WOA9.54 × 10−42.35 ×10-22.63 × 10−12.83 × 10⁻²
TSA5.06 × 10−41.45 × 10-32.34 × 10−21.25 × 10⁻³
Publisher’s Note: MDPI stays neutral with regard to jurisdictional claims in published maps and institutional affiliations.

