
A 30 μW Embedded Real-Time Cetacean Smart Detector

 ,
,  , ,
, ,
Abstract
1. Introduction
1.1. Sperm Whale Biosonar
1.2. Keys to Ultra-Low Power Monitoring System
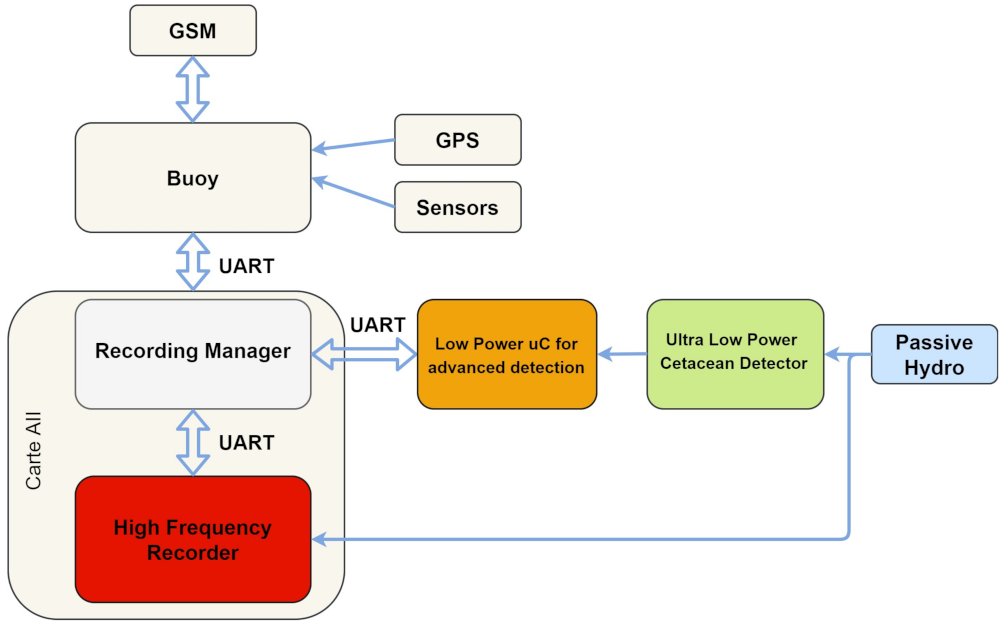
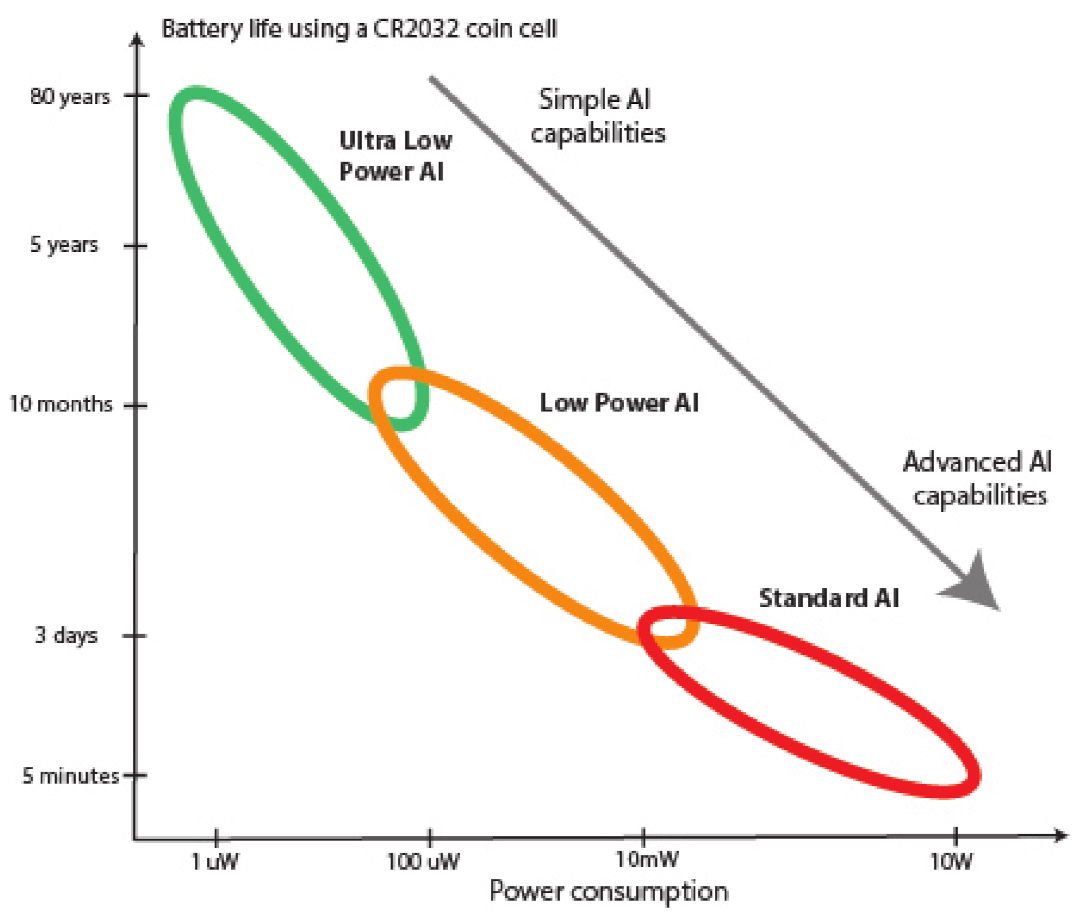
- First stage: an ultra-low power mixed-signal analog–digital acoustic wake-up system (green block in Figure 4): It processes high-frequency input signal using analog primitives, triggering an event when high energy pulses at specific frequencies occur. It is also robust to ambient sea noise, as the latter is measured using analog filters and a digital ultra-low-power processor working at low frequency. With a power consumption of 30 W, it can be classified as an ultra-low power AI circuit as described in Figure 5.It also enters the category of ultra-low power wake-up, among other existing ones presented in Table 1 and described here with their advantages and drawbacks. It is important to note that in this comparison, most of proposed wake-up are standard envelope detectors without smart features for improving their versatility and their detection capabilities such as:
- -
- Adapting to ambient noise for adjusting detection level automatically.
- -
- Classifying signals considering their spectrum.
- -
- Implementing temporal pattern detection for improving classification based on expert rules.
This comparison is ordered by the frequency capability of the detector, considering this has a strong impact on power consumption.One of the most interesting implementations is a low frequency (500 Hz) acoustic signal processor able to distinguish cars, trucks and generators noises for a power consumption equal to 12 nW [20]. This one is too limited in frequency for cetaceans and cannot detect mixed temporal and frequency patterns such as sperm whales clicks, but achieves a remarkable ultra-low-power consumption that can be considered to be a milestone for a further silicon implementation of our solution. Another wake-up detecting low seismic frequencies is proposed in [21], featuring a very low 40 nW power consumption but without classification capabilities and with a limited frequency range (40 to 100 Hz). Ref. [22] is also an energy efficient ( μW) envelope detector working at 1 kHz, but does not implement advanced AI features anymore. These first 3 implementations have a very low power consumption corresponding to limited operation frequencies, and cannot be used for cetacean detection because of that.Refs. [23,24] are implementations able to deal with sperm whales signal frequencies. They are energy efficient but focused on detection of given and fixed specific ultrasonic frequencies (41 kHz and 57 kHz respectively). Used for remote activation of devices, they cannot be used for pattern detection with temporal and frequency analysis. Refs. [25,26] have a wide input frequency range, but are based on digital or analog discrete circuits making their power consumption higher than previous implementations (34 W). However, they can be used for detecting an adjustable specific frequency in a narrow band, making them interesting for several applications, but cannot implement cetacean detection expert rules.Higher frequency wake-up are proposed for comparison purpose such as [27] working at 2 GHz: it is a radio frequency (RF) detector with a power consumption of 52 W. Ref. [28] presents an interesting optimized envelope detector for amplitude-modulated (AM) signal at 315 MHz. It uses an interesting technique of frequency shifting using passive components for reducing power consumption, but cannot implements AI detection rules.Finally, none of the solutions presented in Table 1 can be used for detecting cetaceans and more precisely sperm whales clicks: this is the topic of this paper and proposed solution is described extensively in Section 2, combining ultra-low-power analog features and digital processing computed using the sensor controller of a low-power system on chip (SoC). This allows to achieve low power detection of complex events based on their frequency and temporal attributes at a rather high frequency (20 kHz). - Second stage: a low-power microcontroller is implemented as a second stage detector (orange block in Figure 4), adding the ability to automatically tune the sensitivity of the first stage. It is implemented on a low-power microcontroller (ARM M4). Described in Section 3.3, one of its features is a state machine implementing expert rules: events generated by the ultra-low-power detector (first stage) are analyzed to avoid some false-positives and thus improving click detection reliability. Another option for this second stage could be to use an embedded shallow neural network such as in [29,30,31]. State machine analysis is performed only when events have been generated by the first stage, leading to a very low microcontroller activity (less than of the time). Consequently, average power consumption of this stage is lower than the first one, even if this instantaneous consumption is a M4 microcontroller one during the analysis. A second state machine, is implemented to dynamically tune click detection sensitivity of the first stage detector, according to current false-positive and true-positive rates observed. It is described extensively in Section 2.
- Third stage: a higher power 4-channels recorder (red block in Figure 4), able to compute deep-learning signal analysis, is triggered by the second stage. It allows recording several channels at a high sampling rate, but consumes a lot of energy (more than 1.2 W). It implements 24 bits analog–digital converter (ADC), 512 ksps temporal resolution, and channel synchronization, all of which are key to allow sound source classification and localization. This recorder is started only when clicks have been validated by the expert rule state machine, reducing drastically its average power consumption compared to an always-on recorder. Active less than of the time in real conditions (due to the sparsity of sperm whales), it extends the battery life of the recorder by a factor 2000, reducing its average power consumption to less than 1 mW. This allows an important battery and overall size reduction, easing its installation and maintenance while reducing its cost. This high-resolution recorder named Qualilife HighBlue [18] has been designed by SMIoT [32] but is not on the scope of this paper. It is used in Caribbean Marine Mammals Preservation Network (CARIMAM) project to monitor Caribbean underwater biodiversity at a large scale.
2. Ultra-Low Power Always-On Wake-Up Based on Acoustic Energy Analysis
2.1. System Architecture
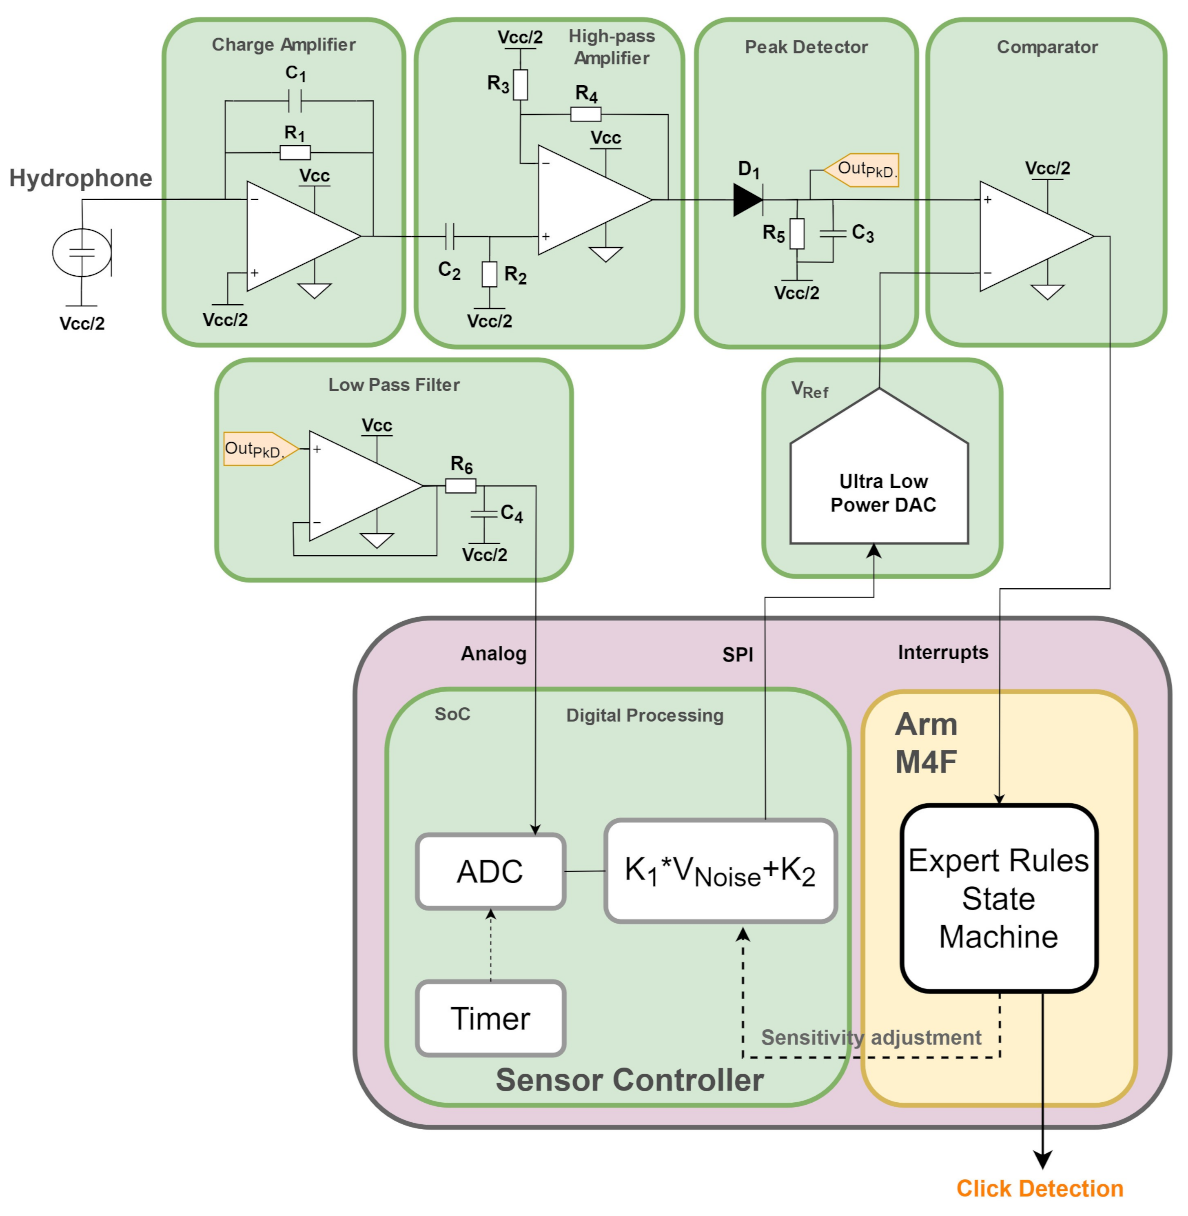
- Passive piezoelectric hydrophone with a measurement bandwidth of 50 kHz. This passive sensor has been chosen to minimize power consumption, compared to amplified ones.
- Charge amplifier to amplify the piezoelectric charge signal. Integrator with a high input impedance, it converts acoustic piezo sensor charge into voltage, multiplying it by the inverse of the capacitance in the feedback path as shown in Figure 9. Without considering the additional resistor, this leads to:Additional resistor forms a low-pass filter with to limit the frequency bandwidth of the hydrophone to 20 kHz, the maximum frequency present in sperm whales clicks. Power consumption of this block is: A.
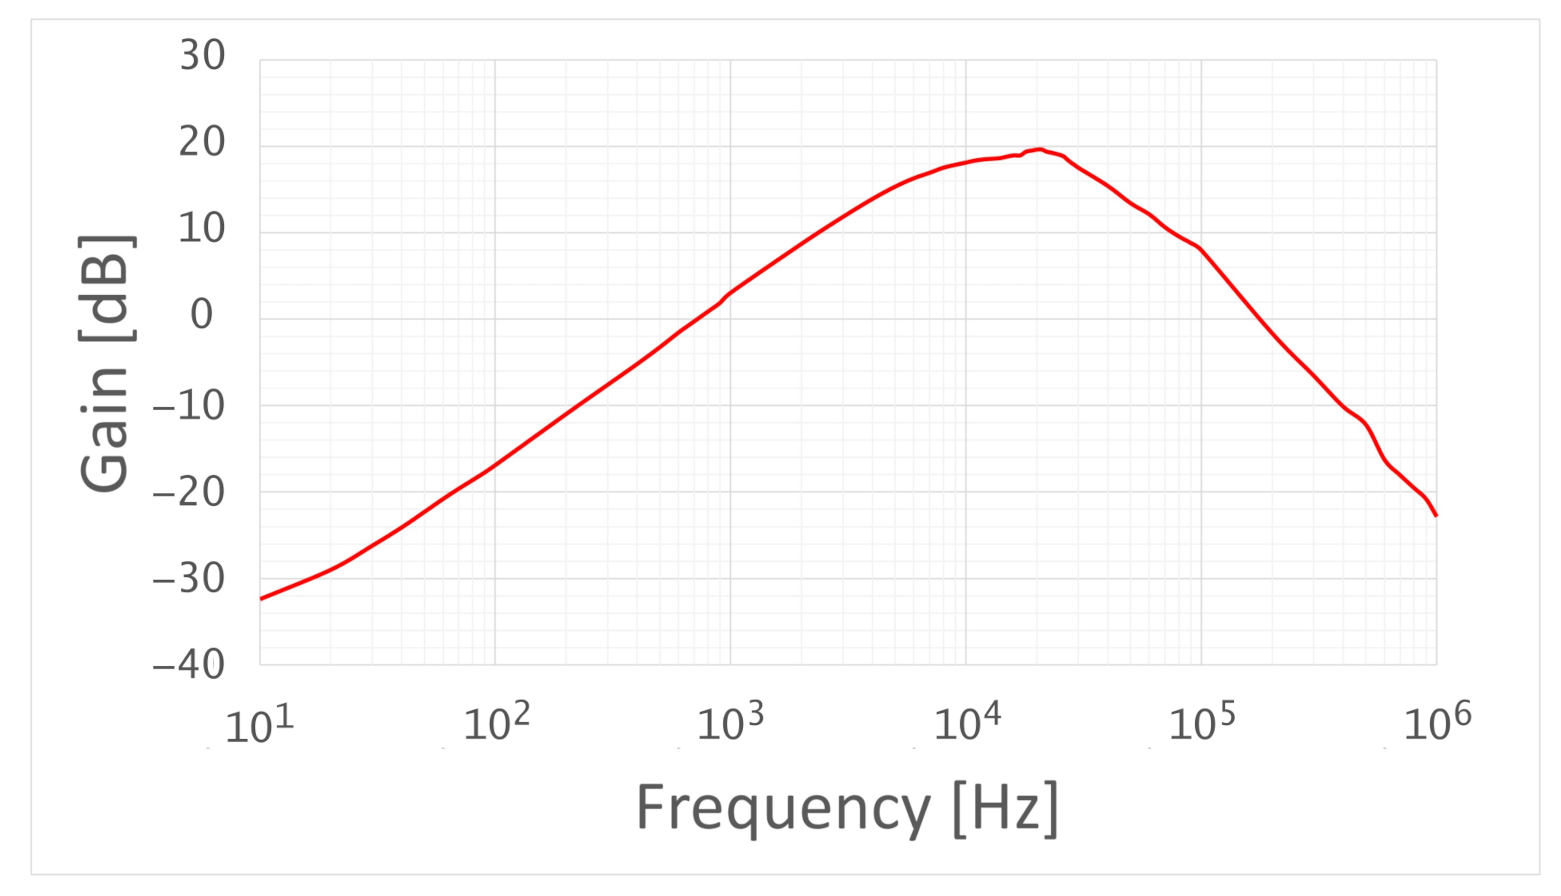
- High-pass amplifier: as sperm whales pulse frequencies spread from 8 to 20 kHz, a band-pass filter is used to focus only on relevant signal. This filter gain Bode diagram is presented in Figure 10. This band-pass filter is formed by the preceding low-pass filter and a high-pass amplifying filter cutting near 8 kHz. Amplification factor is 10. An ultra-low power op-amp (MAXIM MAX409A [35]) is used in this block, with a power consumption of 1 A for a gain bandwidth product equal to 150 kHz, allowing amplification by a factor 10 at 15 kHz.
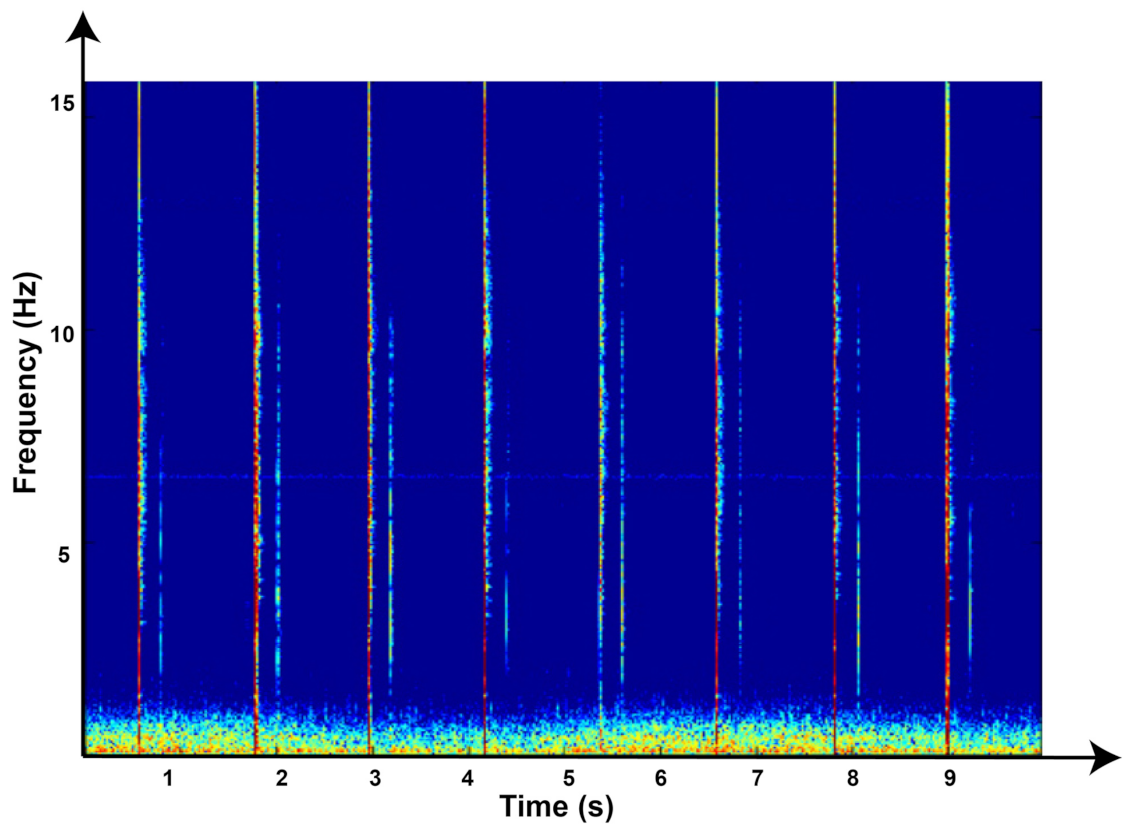
- Low-Pass Peak Detector: signal envelope is extracted using passive components: a diode [36] and a RC low-pass filter with a time constant equal to 10 ms. This peak detector gathers multiples click reverberations P0, P1 and P2 (Figure 2) of a cetacean click into one single detection as shown in Figure 11. Power consumption of this passive block is null.It is important to note that signal envelope is properly detected when input signal is increasing, but not when it is decreasing: output cannot decrease faster than the RC discharge. Thus, measuring output pulse time returns a result more related to pulse amplitude than to its duration. Improving this can be done by adding a reset circuit activated when input signal stays under a given threshold during a very short time. This have been considered in this work, but this circuit also add an additional power consumption that is not worthwhile. As explained in Section 3, it is useful to distinguish between cetacean clicks and periodic anthropogenic noise: sperm whales clicks are very short pulses (1 ms) separated by a long pulse interval (100 ms to 1 s) whereas common anthropogenic noises are mainly continuously repetitive ones (motor boats vibrations for example). In these conditions, adding a discharge with a duration of ms to the cetacean pulses does not affect the algorithm for detecting isolated pulses repeated with a long time interval. Thus, reset circuit is not necessary and has been removed.
- Low-pass filter for sea noise estimation: to avoid false-positives, average sea noise level must be estimated as a reference value for peak extraction. This is done using a low-pass filter with a cutoff frequency of Hz in output of the peak detector. When a stationary noise is present, output increases as it depends on the average of successive input signal amplitudes. In this way, a heavy swell or a motorboat cruising around the hydrophone will increase , whereas an isolated sperm whale click will not change the input average amplitude and therefore . Thus, this long period low-pass filter provides an estimate of the sea noise level in the frequency band of interest. To implement this block, a voltage follower (implemented using an operational amplifier LPV811 [37]) acting as a voltage buffer is added between the peak detector and the low-pass filter, consuming 600 nA.
- Comparator: this component is responsible for comparing the signal envelope (output of the peak detector) to a reference value proportional to the estimated average sea noise level. When the output of peak detector block is higher than the reference value, a detection event is generated, triggering an interrupt in the processing microcontroller. The power consumption of this ultra-low power analog comparator is 320 nA.
- Reference value generation: this feature is fundamental for the algorithm reliability. In a first approach, it seems evident to set . However, for a calm sea, this noise level will be very low, and possibly under the inner noise level of the hydrophone combined with its amplifying chain, leading to an important false-positive ratio detection. Thus, a constant must be added to ensure a reliable detection. This leads to Equation (1):where and are constants to be optimized according to AUC or specific functional points. Too small and generate false alarms as the reference level of the comparator is low, while high and constants result in a loss of smallest clicks of a distant sperm whale, as well as when the average sea noise level is important.Doing these adjustments using analog circuits (Figure 12) requires an adjustable constant generator, an adjustable amplifier and an adder. This solution has a power consumption of 58 A, mainly due to the use of digital potentiometers allowing up to 1 M resistances, such as AD5222 [38], consuming 40 A.Compared with other parts of the analog front-end, the comparator reference adjustment power consumption is too high and needs to be reduced. There is another way of proceeding, less power consuming and more versatile: using an ultra-low power digital processor used to acquire average sea noise level with an analog to digital converter (ADC) at a low sampling frequency rate. Then, computing is done digitally and converted into an analog value entering the comparator, using an ultra-low power Digital Analog Converter (DAC). These operations are implemented using an ultra-low power system on chip (CC2652 [39]) with a circuit dedicated to low frequency operations, named sensor controller. This circuit can be activated while the main processor is in sleep mode, leading to an ultra-low power consumption of 4 A for ADC conversion of average sea noise level at Hz. A LTC1662 [40] DAC is used to convert the reference value transmitted by the sensor controller in SPI to an analogical value. Corresponding power consumption is A, leading to an overall consumption of A.This shows that mixing analog and digital ultra-low-power techniques can be a power efficient way of processing an analog signal. It makes the most of using analog computations for high-frequency signal processing and digital computations for low frequency ones.It is important to note that in Equation (1), constants and are fixed hyper-parameters of the model that can be adjusted by grid search algorithms to maximize click detection accuracy as described in Section 2.2. However, depending on experimental conditions such as anthropogenic noise, sea noise evaluation can be biased, leading to false alarms. In this case, algorithm reliability can be improved by adjusting dynamically and to avoid false alarms. These adjustments are done using a state machine-based automatic gain control introduced in Section 3.
- Voltage regulator: a 3.3 V supply voltage value has been chosen. Powered by a single Li-Ion 3.7 V cell, a Microchip MCP1810 [41] linear voltage regulator is used, with a power consumption of 20 nA. Reducing the input voltage to 1.8 V would be a good option and will be done in a further work.
- Voltage reference: a single 3.3 V supply is used, requiring generation of a virtual 1.65 V ground voltage. This is done using a 1.65 V voltage divider followed by an analog buffer (using a LPV811 operational amplifier [37]) with a current consumption of A.
2.2. Results
3. Improving Click Detection Using Expert Bioacoustic Rules
3.1. Implementing Expert Rules in Ultra-Low Power Using State Machines
- Click duration: a cetacean click has a well-known shape [13], its main peak lasts between 50 s and 200 s and can be repeated a few times. This first expert rule is used to decide whether the received pulse fits this interval or not, corresponding to a high probability for the received signal to be a click.
- Interclick interval: time between two successive clicks is also well-defined ( [100 ms; 1 s]) [13] and can be used as a second expert rule to confirm if two successive clicks can be part of a click train or not. Process is iterated on each new click.
3.2. Automatic Gain Control
- If and , clicks are detected. In this situation, gain is well-tuned and is not adjusted.
- If , nothing is detected, neither clicks nor other signals. Sensitivity of detection can be increased by reducing simultaneously gain and , with a minimum value of . This reduces the reference voltage corresponding to the sea noise level (yellow line in Figure 11)
- If , false alarms are present, and gains and must be increased simultaneously to avoid detection of sea noise. This can happen when weather conditions are changing very quickly or boats are approaching.
3.3. Results
4. Conclusions
Author Contributions
Funding
Data Availability Statement
Acknowledgments
Conflicts of Interest
References
- Glotin, H.; Ricard, J.; Balestriero, R. Fast Chirplet Transform to Enhance CNN Machine Listening-Validation on Animal calls and Speech. arXiv 2016, arXiv:1611.08749. [Google Scholar]
- Goëau, H.; Glotin, H.; Vellinga, W.P.; Planqué, R.; Joly, A. LifeCLEF Bird Identification Task 2016: The arrival of Deep learning. In Proceedings of the CLEF: Conference and Labs of the Evaluation Forum, Évora, Portugal, 5–8 September 2016; pp. 440–449, Number 1609. [Google Scholar]
- Kobayashi, H.H.; Kudo, H.; Glotin, H.; Roger, V.; Poupard, M.; Shimotoku, D.; Fujiwara, A.; Nakamura, K.; Saito, K.; Sezaki, K. A Real-Time Streaming and Detection System for Bio-acoustic Ecological Studies after the Fukushima Accident. In Multimedia Tools and Applications for Environmental & Biodiversity Informatics; Springer: Cham, Switzerland, 2018; pp. 53–66. [Google Scholar]
- Weilgart, L. The impacts of anthropogenic ocean noise on cetaceans and implications for management. Can. J. Zool. 2007, 85, 1091–1116. [Google Scholar] [CrossRef]
- Panigada, S.; Pesante, G.; Zanardelli, M.; Capoulade, F.; Gannier, A.; Weinrich, M.T. Mediterranean fin whales at risk from fatal ship strikes. Mar. Pollut. Bull. 2006, 52, 1287–1298. [Google Scholar] [CrossRef] [PubMed]
- Pennino, M.; Pérez Roda, M.; Pierce, G.; Rotta, A. Effects of vessel traffic on relative abundance and behaviour of cetaceans: The case of the bottlenose dolphins in the Archipelago de La Maddalena, north-western Mediterranean sea. Hydrobiologia 2016, 776, 237–248. [Google Scholar] [CrossRef]
- Weilgart, L.; Whitehead, H. Group-Specific Dialects and Geographical Variation in Coda Repertoire in South Pacific Sperm Whales. Behav. Ecol. Sociobiol. 1997, 40, 277–285. [Google Scholar] [CrossRef]
- Giard, S.; Simard, Y.; Roy, N. Decadal passive acoustics time series of St. Lawrence estuary beluga. J. Acoust. Soc. Am. 2020, 147, 1874–1884. [Google Scholar] [CrossRef] [PubMed]
- Simard, Y.; Roy, N. Detection and localization of blue and fin whales from large-aperture autonomous hydrophone arrays: A case study from the St. Lawrence estuary. Can. Acoust. Acoust. Can. 2008, 36, 104–110. [Google Scholar]
- Patris, J.; Malige, F.; Glotin, H.; Asch, M.; Buchan, S.J. A standardized method of classifying pulsed sounds and its application to pulse rate measurement of blue whale southeast Pacific song units. J. Acoust. Soc. Am. 2019, 146, 2145–2154. [Google Scholar] [CrossRef] [PubMed]
- Malige, F.; Patris, J.; Buchan, S.J.; Stafford, K.M.; Shabangu, F.; Findlay, K.; Hucke-Gaete, R.; Neira, S.; Clark, C.W.; Glotin, H. Inter-annual decrease in pulse rate and peak frequency of Southeast Pacific blue whale song types. Sci. Rep. 2020, 10, 8121. [Google Scholar] [CrossRef] [PubMed]
- Madsen, P.T.; Payne, R.; Kristiansen, N.U.; Wahlberg, M.; Kerr, I.; Møhl, B. Sperm whale sound production studied with ultrasound time/depth-recording tags. J. Exp. Biol. 2002, 205, 1899–1906. [Google Scholar] [PubMed]
- Møhl, B.; Wahlberg, M.; Madsen, P.; Miller, L.; Surlykke, A. Sperm whale clicks: Directionality and source level revisited. J. Acoust. Soc. Am. 2000, 107, 638–648. [Google Scholar] [CrossRef] [PubMed]
- Giraudet, P.; Glotin, H. Real-time 3D tracking of whales by echo-robust precise TDOA estimates with a widely-spaced hydrophone array. Appl. Acoust. 2006, 67, 1106–1117. [Google Scholar] [CrossRef]
- Glotin, H.; Caudal, F.; Giraudet, P. Whales cocktail party: A real-time tracking of multiple whales. Int. J. Can. Acoust. 2008, 36, 7. [Google Scholar]
- Ferrari, M.; Glotin, H.; Marxer, R.; Asch, M. DOCC10: Open access dataset of marine mammal transient studies and end-to-end CNN classification. In Proceedings of the 2020 International Joint Conference on Neural Networks (IJCNN), Glasgow, UK, 19–24 July 2020. [Google Scholar]
- Poupard, M.; Ferrari, M.; Schluter, J.; Marxer, R.; Giraudet, P.; Barchasz, V.; Gies, V.; Pavan, G.; Glotin, H. Real-time Passive Acoustic 3D Tracking of Deep Diving Cetacean by Small Non-uniform Mobile Surface Antenna. In Proceedings of the IEEE International Conference on Acoustics, Speech and Signal Processing (ICASSP), Brighton, UK, 12–17 May 2019; pp. 8251–8255. [Google Scholar]
- Barchasz, V.; Gies, V.; Marzetti, S.; Glotin, H. A novel low-power high speed accurate and precise DAQ with embedded artificial intelligence for long term biodiversity survey. In Proceedings of the Acustica Symposium Conference, Lyon, France, 7–11 December 2020. [Google Scholar]
- Glotin, H.; Thellier, N.; Best, P.; Poupard, M.; Ferrari, M.; Viera, S.; Giés, V.; Oger, M.; Giraudet, P.; Mercier, M.; et al. Sphyrna-Odyssey 2019–2020, Rapport I: Découvertes Ethoacoustiques de Chasses Collaboratives de Cachalots en Abysse et Impacts en Mer du Confinement COVID-19. 2020; 197p. Available online: http://sabiod.org/pub/SO1.pdf (accessed on 25 March 2021).
- Jeong, S.; Chen, Y.; Jang, T.; Tsai, J.M.; Blaauw, D.; Kim, H.; Sylvester, D. Always-On 12-nW Acoustic Sensing and Object Recognition Microsystem for Unattended Ground Sensor Nodes. IEEE J. Solid State Circuits 2018, 53, 261–274. [Google Scholar] [CrossRef]
- Antao, U.; Choma, J.; Dibazar, A.; Berger, T. 40 nW subthreshold event detector chip for seismic sensors. In Proceedings of the 2015 IEEE International Symposium on Technologies for Homeland Security (HST), Waltham, MA, USA, 14–16 April 2015; pp. 1–6. [Google Scholar] [CrossRef]
- Abdalla, H.; Horiuchi, T.K. An analog VLSI low-power envelope periodicity detector. IEEE Trans. Circuits Syst. I Regul. Pap. 2005, 52, 1709–1720. [Google Scholar] [CrossRef]
- Fuketa, H.; O’uchi, S.; Matsukawa, T. A 0.3V 1-μW Super-Regenerative Ultrasound Wake-Up Receiver with Power Scalability. IEEE Trans. Circuits Syst. II Express Briefs 2017, 64, 1027–1031. [Google Scholar] [CrossRef]
- Rekhi, A.S.; Arbabian, A. Ultrasonic Wake-Up with Precharged Transducers. IEEE J. Solid State Circuits 2019, 54, 1475–1486. [Google Scholar] [CrossRef]
- Fourniol, M.; Gies, V.; Barchasz, V.; Kussener, E.; Barthelemy, H.; Vauché, R.; Glotin, H. Analog Ultra Low-Power Acoustic Wake-Up System Based on Frequency Detection. In Proceedings of the 2018 IEEE International Conference on Internet of Things and Intelligence System (IOTAIS), Bali, Indonesia, 1–3 November 2018; pp. 109–115. [Google Scholar] [CrossRef]
- Fourniol, M.; Gies, V.; Barchasz, V.; Kussener, E.; Barthelemy, H.; Vauché, R.; Glotin, H. Low-Power Wake-Up System based on Frequency Analysis for Environmental Internet of Things. In Proceedings of the 2018 14th IEEE/ASME International Conference on Mechatronic and Embedded Systems and Applications (MESA), Oulu, Finland, 2–4 July 2018; pp. 1–6. [Google Scholar]
- Pletcher, N.M.; Gambini, S.; Rabaey, J.M. A 2 GHz 52 uW Wake-Up Receiver with −72 dBm Sensitivity Using Uncertain-IF Architecture. In Proceedings of the 2008 IEEE International Solid-State Circuits Conference, San Francisco, CA, USA, 3–7 February 2008; pp. 524–633. [Google Scholar]
- Woias, P.; Heller, S.; Pelz, U. A highly sensitive and ultra-low-power wake-up receiver for energy-autonomous embedded systems. J. Phys. Conf. Ser. 2018, 1052, 012024. [Google Scholar] [CrossRef]
- Zuo, X.; Yaxian, L. Low power performance achievement in embedded system. In Proceedings of the 2011 2nd International Conference on Artificial Intelligence, Management Science and Electronic Commerce (AIMSEC), Deng Feng, China, 8–10 August 2011; pp. 4655–4658. [Google Scholar]
- Magno, M.; Cavigelli, L.; Mayer, P.; von Hagen, F.; Benini, L. FANNCortexM: An Open Source Toolkit for Deployment of Multi-layer Neural Networks on ARM Cortex-M Family Microcontrollers: Performance Analysis with Stress Detection. In Proceedings of the 2019 IEEE 5th World Forum on Internet of Things (WF-IoT), Limerick, Ireland, 15–18 April 2019; pp. 793–798. [Google Scholar]
- Marzetti, S.; Gies, V.; Barchasz, V.; Barthélemy, H.; Glotin, H.; Kussener, E.; Vauché, R. Embedded Learning for Smart Functional Electrical Stimulation. In Proceedings of the 2020 IEEE International Instrumentation and Measurement Technology Conference, Dubrovnik, Croatia, 25–28 May 2020. [Google Scholar]
- Gies, V.; Barchasz, V.; Glotin, H. SMIOT: Scientific Microsystems for the Internet of Things, Technological Platform. Available online: http://www.smiot.fr (accessed on 25 March 2021).
- Glotin, H.; Giraudet, P.; Ricard, J.; Malige, F.; Patris, P.; Roger, V.; Prévot, J.M.; Poupard, M.; Philippe, O.; Cosentino, P. Projet VAMOS: Visées Aeriennes de Mammifères marins Jointes aux Obervations Acoustiques Sous-Marines de la Bouée BOMBYX et Antares: Nouveaux Modèles en Suivis et lois Allométriques du Physeter macrocephalus, Ziphius Cavirostris et Autres CéTacés; Technical Report; The University of Toulon: Toulon, France, 2017; Available online: http://sabiod.org/pub/PELAGOS_VAMOS.pdf (accessed on 25 March 2021).
- Badami, K.M.H.; Lauwereins, S.; Meert, W.; Verhelst, M. A 90 nm CMOS, 6 μW Power-Proportional Acoustic Sensing Frontend for Voice Activity Detection. IEEE J. Solid State Circuits 2016, 51, 291–302. [Google Scholar] [CrossRef]
- Maxim. MAX409: 1.2 uA Max, Single/Dual/Quad, Single-Supply Op Amps; Rev. 4. Available online: https://datasheets.maximintegrated.com/en/ds/MAX406-MAX419.pdf (accessed on 25 March 2021).
- Diodes Incorporated. SD103AW: Schottky Barrier Diode; Rev. 25. Available online: https://www.diodes.com/assets/Datasheets/ds11013.pdf (accessed on 25 March 2021).
- Texas Instruments. LPV811: Precision 425 nA Nanopower Operational Amplifiers; Rev. 2016. Available online: https://www.ti.com/product/LPV811 (accessed on 25 March 2021).
- Analog Devices. AD5222: Increment/Decrement Dual Digital Potentiometer; Rev. 0. Available online: https://www.analog.com/media/en/technical-documentation/data-sheets/AD5222.pdf (accessed on 25 March 2021).
- Texas Instruments. CC2652R: SimpleLink™ Multiprotocol 2.4 GHz Wireless MCU; Rev. 04/2020. Available online: https://www.ti.com/product/CC2652R (accessed on 25 March 2021).
- Linear Technology. LTC1662: Ultralow Power, Dual 10-Bit DAC in MSOP; Rev. A. Available online: https://www.analog.com/media/en/technical-documentation/data-sheets/1662fa.pdf (accessed on 25 March 2021).
- Texas Instruments. MCP1810: Ultra-Low Quiescent Current LDO Regulator; Rev. 2018. Available online: http://ww1.microchip.com/downloads/en/DeviceDoc/20005623B.pdf (accessed on 25 March 2021).
- ST. TS881: Rail-To-Rail 0.9 V Nanopower Comparator; Rev. 2. Available online: https://www.st.com/en/amplifiers-and-comparators/ts881.html (accessed on 25 March 2021).
- Best, P.; Marzetti, S.; Poupard, M.; Ferrari, M.; Paris, S.; Marxer, R.; Philippe, O.; Gies, V.; Barchasz, V.; Glotin, H. Stereo to five-channels bombyx sonobuoys from four years cetacean monitoring to real-time whale-ship anti-collision system. In Proceedings of the Acustica Symposium Conference, Lyon, France, 7–11 December 2020. [Google Scholar]


| Application | Frequency (Hz) | Ref. | Power Consump. (μW) | Year | Noise Immunity | Embedded AI |
|---|---|---|---|---|---|---|
| Seismic detection | [21] | 2015 | No | No | ||
| Acoustic sensing and classification | [20] | 2018 | No | Yes | ||
| Envelope detector wake-up | [22] | 1.8 | 2005 | No | No | |
| Voice activity detector wake-up | [34] | 6.0 | 2016 | No | No | |
| Cetacean click detector | This paper | 2021 | Yes | Yes | ||
| Ultrasonic envelope detector wake-up | [23] | 1.0 | 2017 | No | No | |
| Ultrasonic wake-up | [24] | 2019 | No | No | ||
| Adjustable frequency detector wake-up | [25] | 2018 | No | No | ||
| AM signal detector wake-up | [28] | 7.4 | 2018 | No | No | |
| UHF signal detector wake-up | [27] | 2008 | No | No |
| Circuit | Current (A) | Picture Board | Schematic | Associated Datasheet |
|---|---|---|---|---|
| High-pass Amplifier |  |  | MAX409 [35] | |
| Peak Detector | – |  |  | SD103AW [36] |
| Sea noise Low frequency Low-pass Filter |  |  | LPV811 [37] | |
| DAC |  |  | LTC1662 [40] | |
| Comparator |  |  | TS881 [42] | |
| Voltage regulator |  |  | MCP1810 [41] | |
| 1.65V voltage reference |  |  | LPV811 [37] | |
| Sensor Controller using a 10 Hz timer |  |  | CC2652 [39] | |
| Complete ultra-low power hardware | 12.5 |
Publisher’s Note: MDPI stays neutral with regard to jurisdictional claims in published maps and institutional affiliations. |
© 2021 by the authors. Licensee MDPI, Basel, Switzerland. This article is an open access article distributed under the terms and conditions of the Creative Commons Attribution (CC BY) license (https://creativecommons.org/licenses/by/4.0/).
Share and Cite
Marzetti, S.; Gies, V.; Best, P.; Barchasz, V.; Paris, S.; Barthélémy, H.; Glotin, H. A 30 μW Embedded Real-Time Cetacean Smart Detector. Electronics 2021, 10, 819. https://doi.org/10.3390/electronics10070819
Marzetti S, Gies V, Best P, Barchasz V, Paris S, Barthélémy H, Glotin H. A 30 μW Embedded Real-Time Cetacean Smart Detector. Electronics. 2021; 10(7):819. https://doi.org/10.3390/electronics10070819
Chicago/Turabian StyleMarzetti, Sebastián, Valentin Gies, Paul Best, Valentin Barchasz, Sébastien Paris, Hervé Barthélémy, and Hervé Glotin. 2021. "A 30 μW Embedded Real-Time Cetacean Smart Detector" Electronics 10, no. 7: 819. https://doi.org/10.3390/electronics10070819
APA StyleMarzetti, S., Gies, V., Best, P., Barchasz, V., Paris, S., Barthélémy, H., & Glotin, H. (2021). A 30 μW Embedded Real-Time Cetacean Smart Detector. Electronics, 10(7), 819. https://doi.org/10.3390/electronics10070819