Article

Improving Energy Efficiency of Irrigation Wells by Using an IoT-Based Platform

by
Juan A. López-Morales
1,*,
Juan A. Martínez
2 and
Antonio F. Skarmeta
1
1
Department of Information and Communications Engineering, Computer Science Faculty, University of Murcia, 30100 Murcia, Spain
2
Odin Solutions S.L, Polígono Industrial Oeste C/ Perú, 5, 3°, Oficina 12, Alcantarilla, 30820 Murcia, Spain
*
Author to whom correspondence should be addressed.
Electronics 2021, 10(3), 250; https://doi.org/10.3390/electronics10030250
Submission received: 10 December 2020 / Revised: 6 January 2021 / Accepted: 20 January 2021 / Published: 22 January 2021
(This article belongs to the Collection Electronics for Agriculture)

Abstract

:
The irrigation sector has undergone a remarkable transformation in recent decades due to the application of pressurized water distribution technologies, improving the management of limited water resources. As a result of this transformation, irrigation has become, together with agricultural machinery, the primary consumer of energy within the agri-food sector. Furthermore, the energy cost of operating pumping equipment during a farming season represents 30–40% of the crop’s total cost. For this reason, one of the most interesting challenges in this scope is that of improving energy efficiency and reducing economic costs so that productive work become more and more competitive. Energy audit makes possible to determine the efficiency of installations, and enables to determine energy saving protocols (requirements), for this reason the aim of this article is to carry out these by using IoT-based systems. The proposed system improves decision-making on agricultural pumping management by classifying wells’ efficiency and integrating the data sets that determine their efficiency into a single information model. The system monitors energy efficiency according to different parameters such as: infrastructure, energy consumption, electric rates, manometric height or type of installation, making it possible to enhance each pumping operation’s decisions. This solution has been deployed in an irrigation community in southeast Spain whose results have warned about the lack of efficiency in two of its wells: in one of them it is proposed that they be replaced, due to the high cost of pumping water, and in the other, hydraulic mechanisms are implemented to improve the water-energy binomial.

1. Introduction

The agricultural sector is characterized by being an energy balance enterprise. The difference between the cost of the energy consumed from the electrical grid and the one provided by nature (sun, rain, soil) must be less than the potential economic benefits obtained by crop yields. Agriculture optimization is achieved when this occurs. Diminished natural resources (soil, water, energy, clean air) and the increased demand for farm products require the optimization of the natural resources from the agricultural sector [1].
Agriculture accounts for 70% of total freshwater withdrawals in the world, which makes it one of the sectors with the highest water consumption. The water sector has excellent potential to generate innovative products and services because its importance lies in its ability to help address challenges related to water resource management: water scarcity, energy efficiency, climate change, recovery/treatment of wastewater, etc. [2].
One of the critical features in agriculture is the use of groundwater, mainly in arid and semi-arid climates, and the energy consumption needed for its extraction. The filtered and pressurized water is distributed through the network of pipes to the hydrants located in the plots. Consequently, the energy consumed in the process of extracting and distributing the water throughout the farm represents a significant portion of the energy bill farmers need to come up against. Optimization of this operation will guarantee the economic sustainability of irrigation societies [3]. Therefore, any savings measure implemented generates a reduction in energy consumption, an improvement in pump performance and a better adaptation of pump power according to load variation.
The efficiency measures applied in water management help reduce energy consumption and the economic costs generated in obtaining water resources; simultaneously, it will motivate farmers to invest in systems based on new technologies allowing them to improve their farms’ performance. Therefore, it is essential to adopt systems capable of maximizing resources’ performance and helping farmers transform the management of their farms digitally to improve their management systems [4].
The use of new technologies in agriculture permits us to be more efficient and precise in the management of the different inputs (water, energy or consumption) and consequently achieve a more significant economic return, in addition to mitigating agricultural and environmental risks [5]. The development of new management platforms allows us to analyze the operation of the facilities that support irrigation as a productive system and thus adopt more efficient strategies.
Fundamental to this transformation are the Internet of Things (IoT) enabled systems, which collect real-time data on crops and facilities that are part of the farms. The use of IoT has shifted the traditional paradigm for accessing and managing sensors and actuators by making every smart object accessible through the Internet, integrating real information and knowledge into the digital world [6].
Even though this is an activity with great potential for savings, it is unusual to discover technological solutions to improve the agricultural sector’s water-energy binomial. Consequently, one of the primary objectives of this document was to unify a single platform, together with an information model, all the data sets that play an essential role in managing and distributing water in irrigation facilities. The priority aim was to specify a system to improve how pumping stations’ daily efficiency is verified as a preliminary stage to carrying out an energy audit of the farm. In addition, the emphasis is placed on the definition of visual indicators, based on previously defined limits and pumping efficiency to help improve the installation energy management.
In the following sections, we first describe works related to the object of the platform, pumping efficiency in irrigation wells. Next, we show a system to help improve decision making about the efficiency of agricultural pumping, integrating for it an information model in a platform based on IoT. Finally, we detail the experience obtained in an irrigation community and the conclusions drawn from that experience.

2. Related Work

This work is based on two well-differentiated research fields in the agricultural sector, the management of energy data and indicators and the integration of these into IoT-based platforms that allow improved decision-making. For this reason, this section provides an overview of these fields of action.

2.1. Efficient Energy Management in Pumping

One of the biggest problems we face is the waste of energy in water pumps. Technicians in charge of their management still use traditional, manual or empirical techniques, gradually generating unwanted power and money losses. The water and energy consumption required to distribute water can be minimized through careful planning and implementation of irrigation efficiency measures. There are several determining factors in the savings potential. Some are easy to visualize, such as power, annual operating hours and age, but others are not as obvious as efficiency or performance.
Different works give us guidelines to improve this energy efficiency. The work proposed by Quintilliani et al. [7] is based on the activation/deactivation of each pump, based on the determination of the electrical time slots with the lowest tariff cost. Using traditional optimization algorithms inspired by nature and based on multi-population, such as the Genetic Algorithm, Ant Colony Optimization and Particle Swarm Optimization, proposed by Turci et al. [8], the aim was to determine the best programming mechanism for pumping stations. In addition, evolutionary multi-target algorithms are a useful tool for solving multi-target optimization problems, such as the one presented by Makaremi et al. [9] through the functions: energy cost and the number of pump switches. To solve the problem, it uses the Non-Domain Classification Genetic Algorithm (NSGA-II) coupled with the EPANET (software for the analysis of water distribution systems) hydraulic simulation model.
In addition, there are works like the one presented by Salomons and Housh [10] that offer a practical methodology of optimization for the control in a real-time compatible with local control schemes. They use an optimization procedure (Flow Allocation Algorithm) that reduces both energy consumption and the cost of operation. The former is achieved by selecting the most efficient pump combinations, while the latter is achieved by optimizing pump operation according to the electricity tariff periods.
Energy audits on farms show the potential for savings. Within this line, focused on promoting innovative and demonstration projects in terms of energy-saving and efficiency in the sector, we highlight the work of Tarjuelo et al. [11]. There are also works such as Mardani et al. [12] that carry out a bibliographic review of the different data analysis models applied to the development of energy efficiency problems.

2.2. Use of IOT-Based Solutions for Water Management

The use of IoT-based systems allows real-time management of services such as water management for irrigation based on a multi-intelligent control system as proposed by Hadipour et al. [13]. Following this same line of combining wireless sensor networks with IoT, García et al. [14] review the works that allow sustainable management of irrigation according to all the characteristic parameters of irrigation (climate, water and soil).
Water quality monitoring measures water bodies’ physicochemical parameters in real-time to determine their quality status and provide early warnings. Liu et al. [15] have developed a model that predicts drinking water for six months using a Long Short Term Memory (LSTM) network based on deep learning. Similarly, Li et al. [16] developed a system to collect water quality data, process it and analyze it in real-time, using two-way wireless communication between mobile sensor nodes analysis stations.
Zamora et al. [17] show a flexible platform to meet the needs of soil-less cultivation in fully recirculating greenhouses using slightly saline water. It is based on low-cost interchangeable hardware and supported by a three-tier open-source software platform at the local, edge and cloud levels. Muñoz et al. [18] present a cloud-based solution to the problem of greenhouse crop production. The services available in the proposed IoT-based system are historical/real-time data, weather forecasts, a model to improve tomato production and its associated irrigation plan.
The document proposed by Franco et al. [19] illustrates the development of a system for monitoring the germination of Ocimum Basilicum seeds using image processing and fuzzy logic techniques; the system is based on the Cloudino-IoT and FIWARE platforms as an alternative to real-time monitoring. Another platform that uses FIWARE is the one promoted by Kamienski et al. [20] for the efficient management of the irrigation water but making emphasis on the protection of the system against DoS attacks.

How IOT Helps in Efficiency Management

The use of data-based technologies is advancing rapidly with the development of IoT. These technological advancements are going to become an essential part of the future of agriculture by improving efficiency and production in the sector [21,22], as well as being necessary incorporation in all productive sectors. In the case of energy management, the digitalization of the ecosystem through IoT improves the visibility of the assets, the optimal control of consumption, eliminates the waste of energy and will allow generating economic savings.
Several works address energy management in various fields of action, using IoT:
  • Energy management in buildings: Terroso-Saenz et al. [23] show us a platform that applies data mining techniques, focusing mainly on consumption prediction and pattern discovery or fault tolerance to change behaviors, and thus have the potential to reduce energy consumption.
  • Water supply: Luna et al. [24] present a hybrid method to improve the energy efficiency of a water supply system. The application of a genetic algorithm to improve the water pumping program provides two solutions: one focused on minimizing the cost/energy related to the use of pumps, and another focused on the same objective but keeping the water storage in the tanks within safer and optimized levels.
  • Smart cities: the work developed by Brundu et al. [25] propose a distributed IoT platform capable of gathering, processing and analyzing energy consumption data and structural characteristics of systems and buildings in a district, integrating different data sources, historical data collection and real-time data from heterogeneous IoT devices.
  • Manufacturing: Wang et al. [26] develop a method of energy efficiency for manufacturing companies with high energy consumption. Here, IoT technologies are applied to detect raw production data in real-time, including energy consumption data and resource status data. This uses multi-level event modeling and complex event processing to produce key energy performance indicators that extend production performance indicators into the realm of energy efficiency.

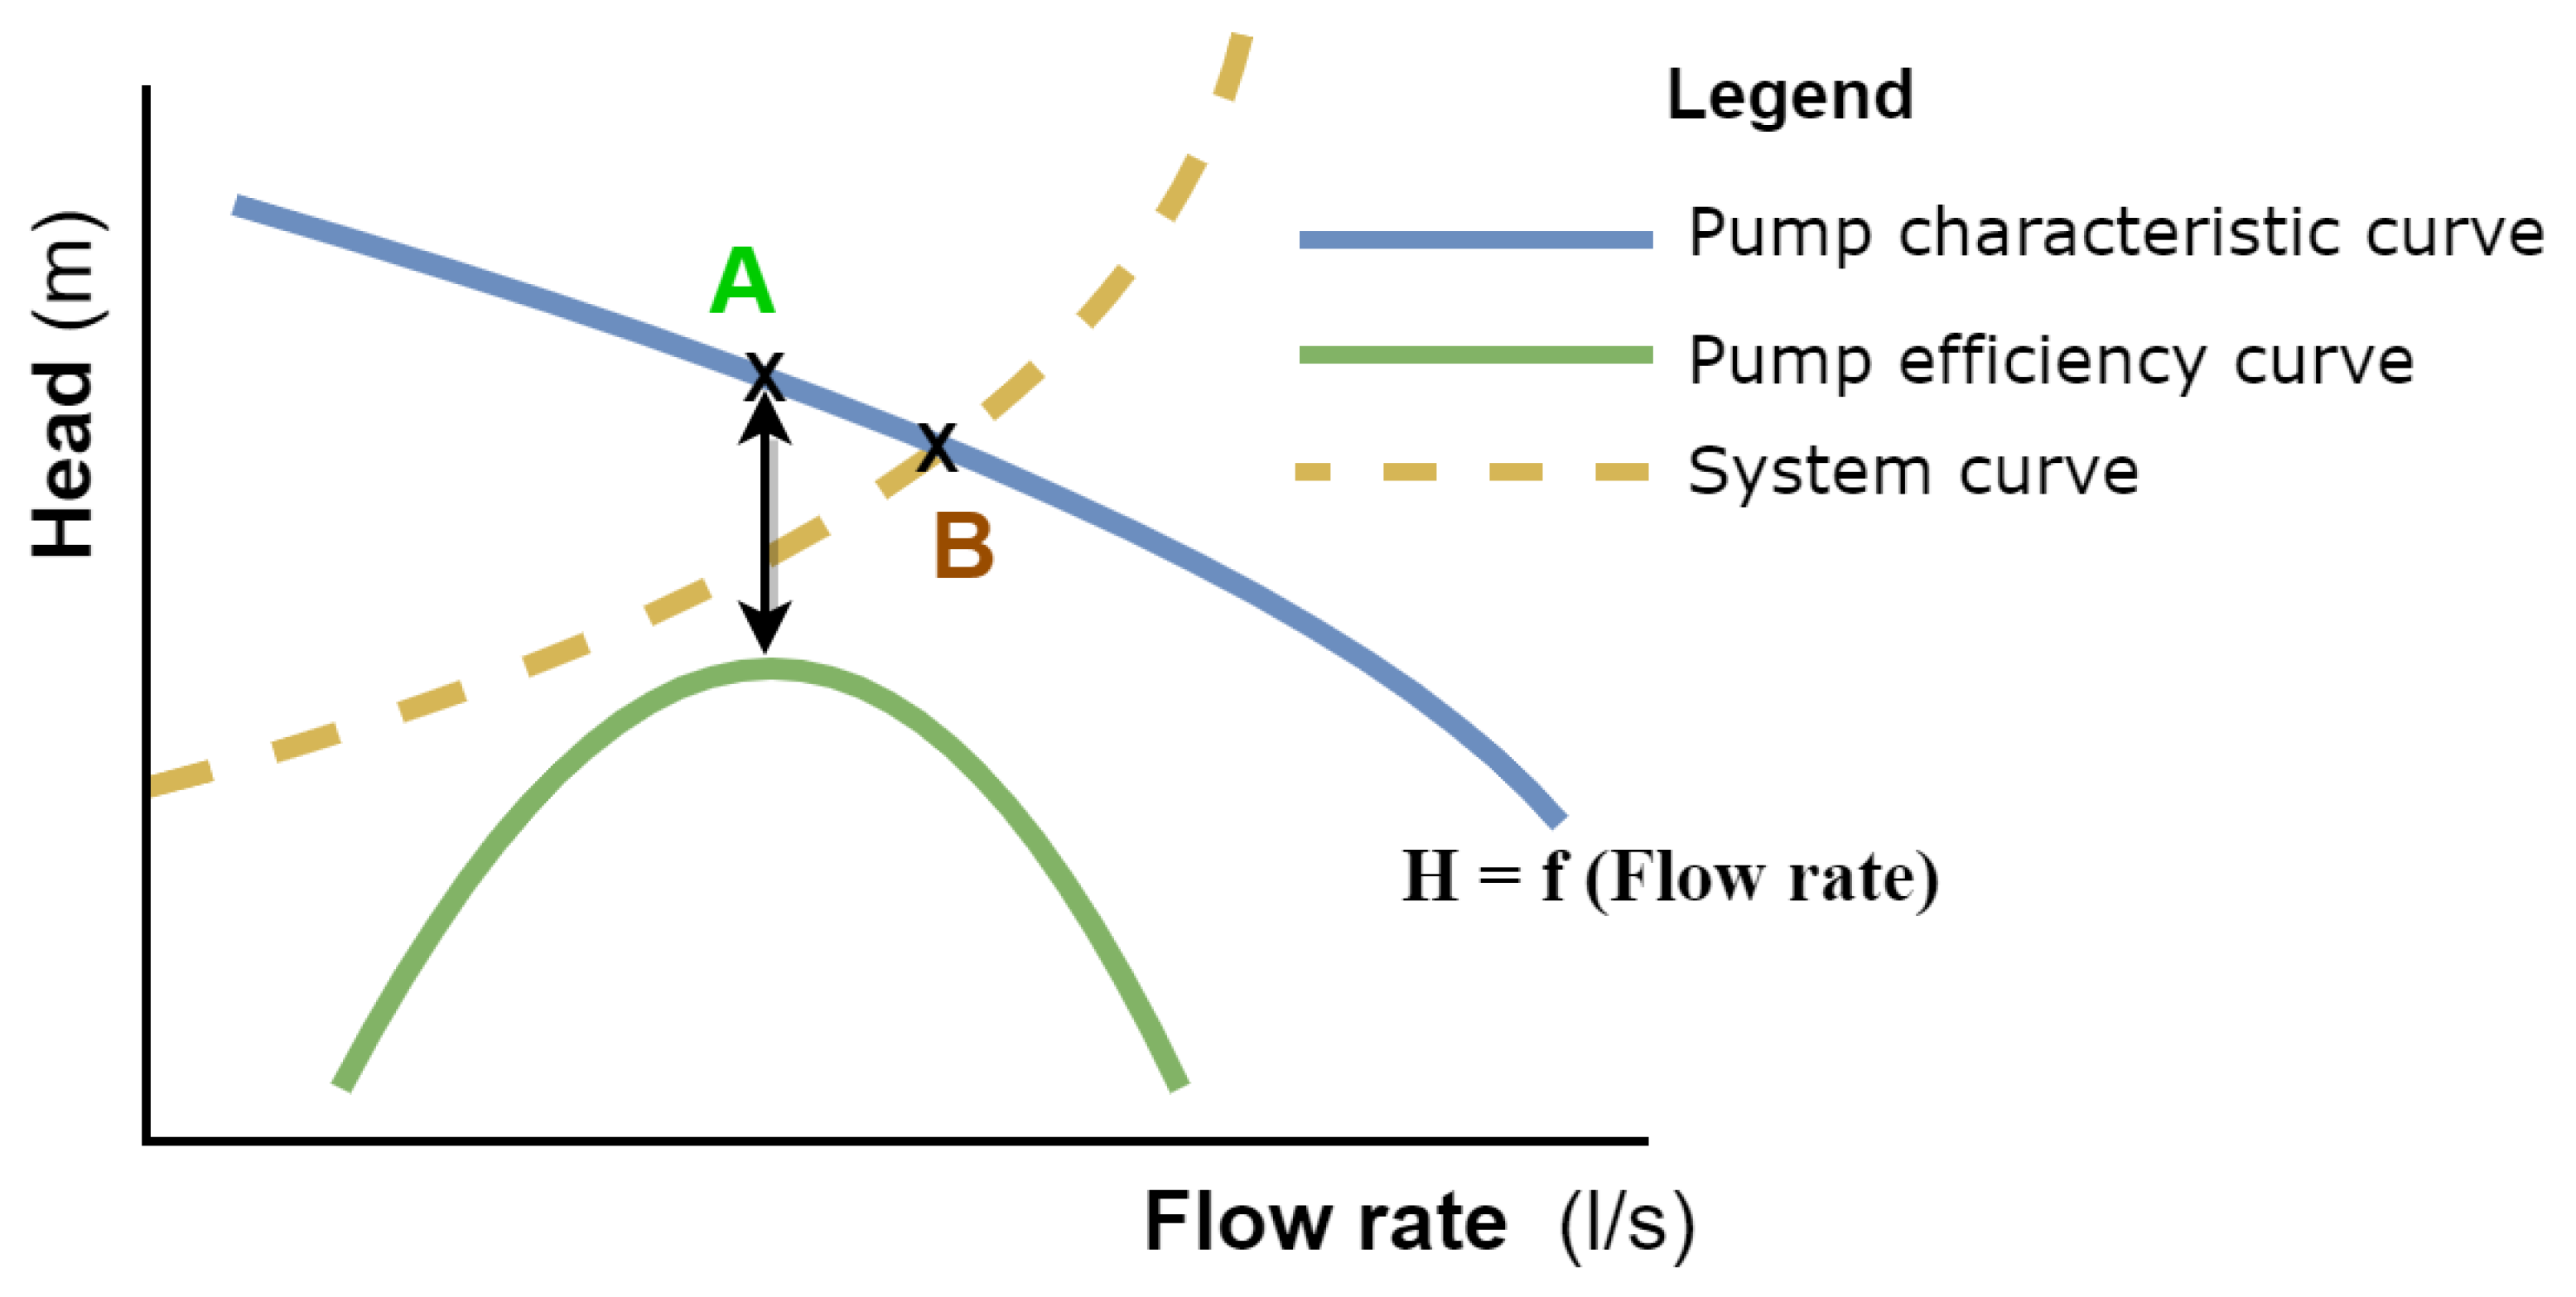
2.3. Analysis of Pump Performance (Energy Perspective)

The application of energy efficiency mechanisms through the use of indicators significantly reduces the operating costs of pumps which are responsible for driving out groundwater in irrigation facilities [27]. Energy consumption can be reduced by reducing the flow through the pump, reducing the pressure drop in the piping system or getting the pump to operate near the optimal range of the performance curve, this last point is the main subject of this work.
Figure 1 shows the curves that define the behavior of a pump:
  • The characteristic curve describes the pump’s behavior as a function of the head (energy per unit mass that the pump can supply to the fluid) and the flow (quantity of liquid that passes through a section in a given period). The pump manufacturer provides this curve.
  • The optimal pump efficiency curve.
  • The system curve represents the flow rate at which our pump is working.
Two working points must be taken into account in pumping systems: the maximum performance point (A) based on the pump’s characteristics and the working point or flow rate provided by the pump (B). The aim is to get points A and B as close as possible to increase the pumping efficiency. Thus, for a certain number of revolutions, the pump’s characteristic curve relates the head, efficiency and power to the flow it has pumped [28]. Therefore, water consumption is directly proportional to energy consumption, and less energy is consumed for the same flow, the more efficient our system will be.
Energy indicators are an essential tool in the energy audits of irrigation installations. These indicators relate energy consumption and economic or productive activity. Thanks to these indicators, it is possible to evaluate and visualize the evolution of different aspects of the installation, in such a simple way (graph) can detect a likely tendency of equipment. To implement the indicators, you can follow the indications proposed by the Institute for Energy Diversification and Saving for the audit of irrigation communities [29]. Another work to consider is the one proposed by Abadia et al. [30] to define mechanisms that help generate energy audits in a pumping network.
An irrigation installation is made up of a network of pumping stations. The energy efficiency of the pumping i (EEP i ) is determined by relating absorbed power (N a ) representing the average active power obtained with the network analyzer during the measurement period and supplied power (N s ) representing the average theoretical power that the pumping supplies at each moment.
Monitoring the indicator will help the facility manager and the company in charge of pump maintenance to carry out predictive pre-maintenance to prevent future inefficiencies and determine what actions to take to improve pumping.
The use of indicators, such as the one proposed, together with the help of data extracted from the facilities and the electricity tariffs allow the adoption of corrective measures that do not require investment costs:
  • Shifting consumption to cheaper hours (an action that does not save energy but does reduce costs) thanks to the integration of electricity tariffs into the system.
  • The valves’ regulation to adapt the operating point of a pump to the maximum performance regime thanks to the monitoring of the EEP indicator and the elements that are part of a well.
  • The sectorization or modification of it when the water distribution network is already monitored, and only the appropriate ones need to be opened and closed.
Other measures to be determined by the technicians of the irrigation community, together with the company providing the pumps, may require economic investments:
  • Installation of new equipment such as frequency converters due to sub-optimal pump performance.
  • Replacement or modification of existing ones because they have completed their range of working hours and are out of range.
  • Installation of pipe sections or valves to be divided into sectors when low-pressure values are observed.
In general, the measures allow essential improvements in efficiency that translate into energy savings and, consequently, economic savings that make the investment pay for itself quickly.

3. Proposed Solution

The decision-making system in agriculture is a resource designed to face complex problems such as the efficient pumping of irrigation or the necessary flow for each of the crop stages. Therefore, to solve the sector’s issues and to improve decision-making, a system capable of integrating the different sets of data that are part of the problem must be developed, together with a decision support system. The solution presents a decision support system focused on the improvement of the pumps in the water distribution systems of the farms. Thanks to this, it is possible to increase the energy efficiency of the pumps and to improve the predictive maintenance of the installations, which translates into energy savings and cost reduction. This way, we increase profitability and decrease effort, because all our decisions are based on precision, and we will not invest more time, effort or energy resources than needed. The mechanism chosen to achieve this goal is an IoT-based platform that integrates the different sets of data required to achieve this end.
Our proposal provides a holistic data management and analysis solution to improve the energy efficiency, following an open approach by relying on the FIWARE initiative [31]. In this sense, this work includes explicit features such as outlier detection to facilitate the deployment of data extraction and analysis mechanisms on the stored data.
Two features support the choice of FIWARE: first, all the orchestration of the platform is done through RESTful APIs, which facilitates its expansion; and second, the definition of an information model according to the Next Generation Service Interfaces (NGSI) [32], or Next Generation Service Interfaces with Linked Data (NGSI-LD) [33] standard allows to obtain a homogeneous view of the related data in the field of work, the key to exploiting the potential of heterogeneous data collection. What we propose here is not only a data container but a complete and flexible tool that serves to improve decision-making regarding the performance and efficiency of the pumping network. In addition, it will anticipate the predictive maintenance of each pump.

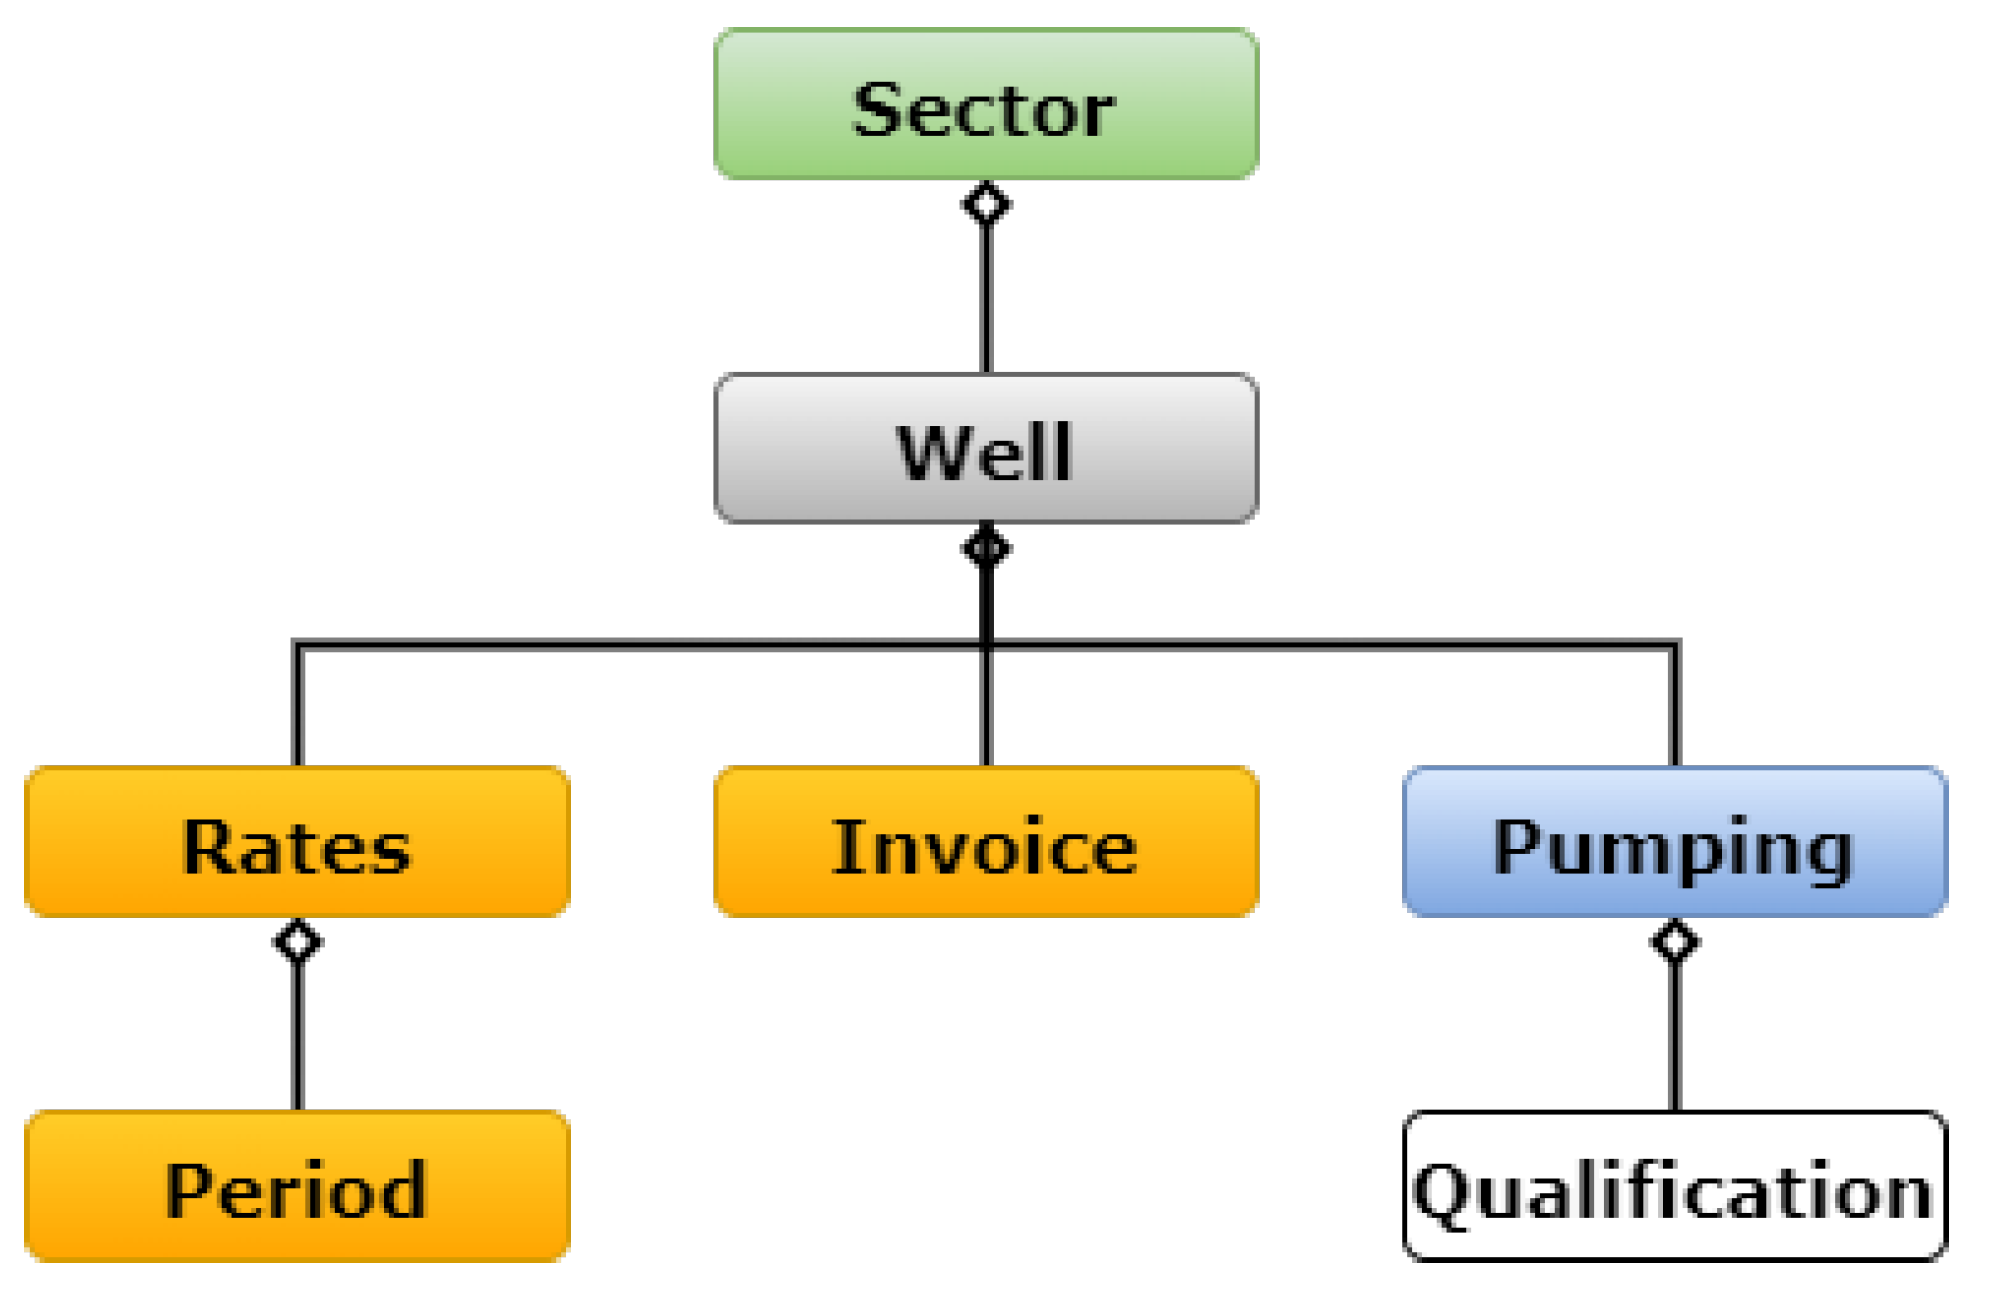
3.1. Modeling for Efficient Use of Irrigation Pumps

Farming is an activity that seeks to move away from historically family-run farms from the past and move forward to become a data-driven business. Thus, today’s farmers and agri-food managers must manage different and heterogeneous sources of information. Consequently, some of the essential agricultural equipment now include technology to collect, store, share and analyze large and diverse amounts of data.
One of the first steps should be to define a common data model compatible with the NGSI-LD information model commonly accepted in the FIWARE ecosystem, which facilitates the interconnection with other models, services and users. This information model follows an entity-attribute approach in which entities represent real or virtual elements of interest. Integrating the energy management systems is to unify the different data sources in a common information model that allows the visualization of all the information in a single control center. The data model shown in Figure 2 extends the model published by López et al. [34].
Specifically, the sectors (Sector) shown in Figure 2 are the different groupings of irrigated plots into which a farm (AgriExploitation entity from the previous work) is divided to manage irrigation.
The data model focuses on the management of pumping in water user associations, which are usually made up of a set of irrigation sectors to improve water distribution, Sector. In turn, each sector is generally associated with irrigation well, Well. The information on the wells is marked by three pillars, which allow them to be defined univocally:
  • Pumps, represented by Pumping, defines the characteristic parameters recorded by the pump: pressure, motor temperature or head. Furthermore, based on the data obtained, we can obtain the pump’s energy efficiency and classify the irrigation pump according to its efficiency through the entity Qualification.
  • Electric Rates, represented by Rates, tells us the type of rate associated with each pump. Each rate has an associated number of periods, Period, where the associated rate period is defined for each month and the total number of hours of the day. The price of the hours is variable and is defined by the associated operator a few days before.
  • Invoices, represented by Invoice are the invoices provided by the energy supplier. They must show the average price, both fixed and variable, for each of the tariff bands associated with the well, as well as the consumption generated in kW.

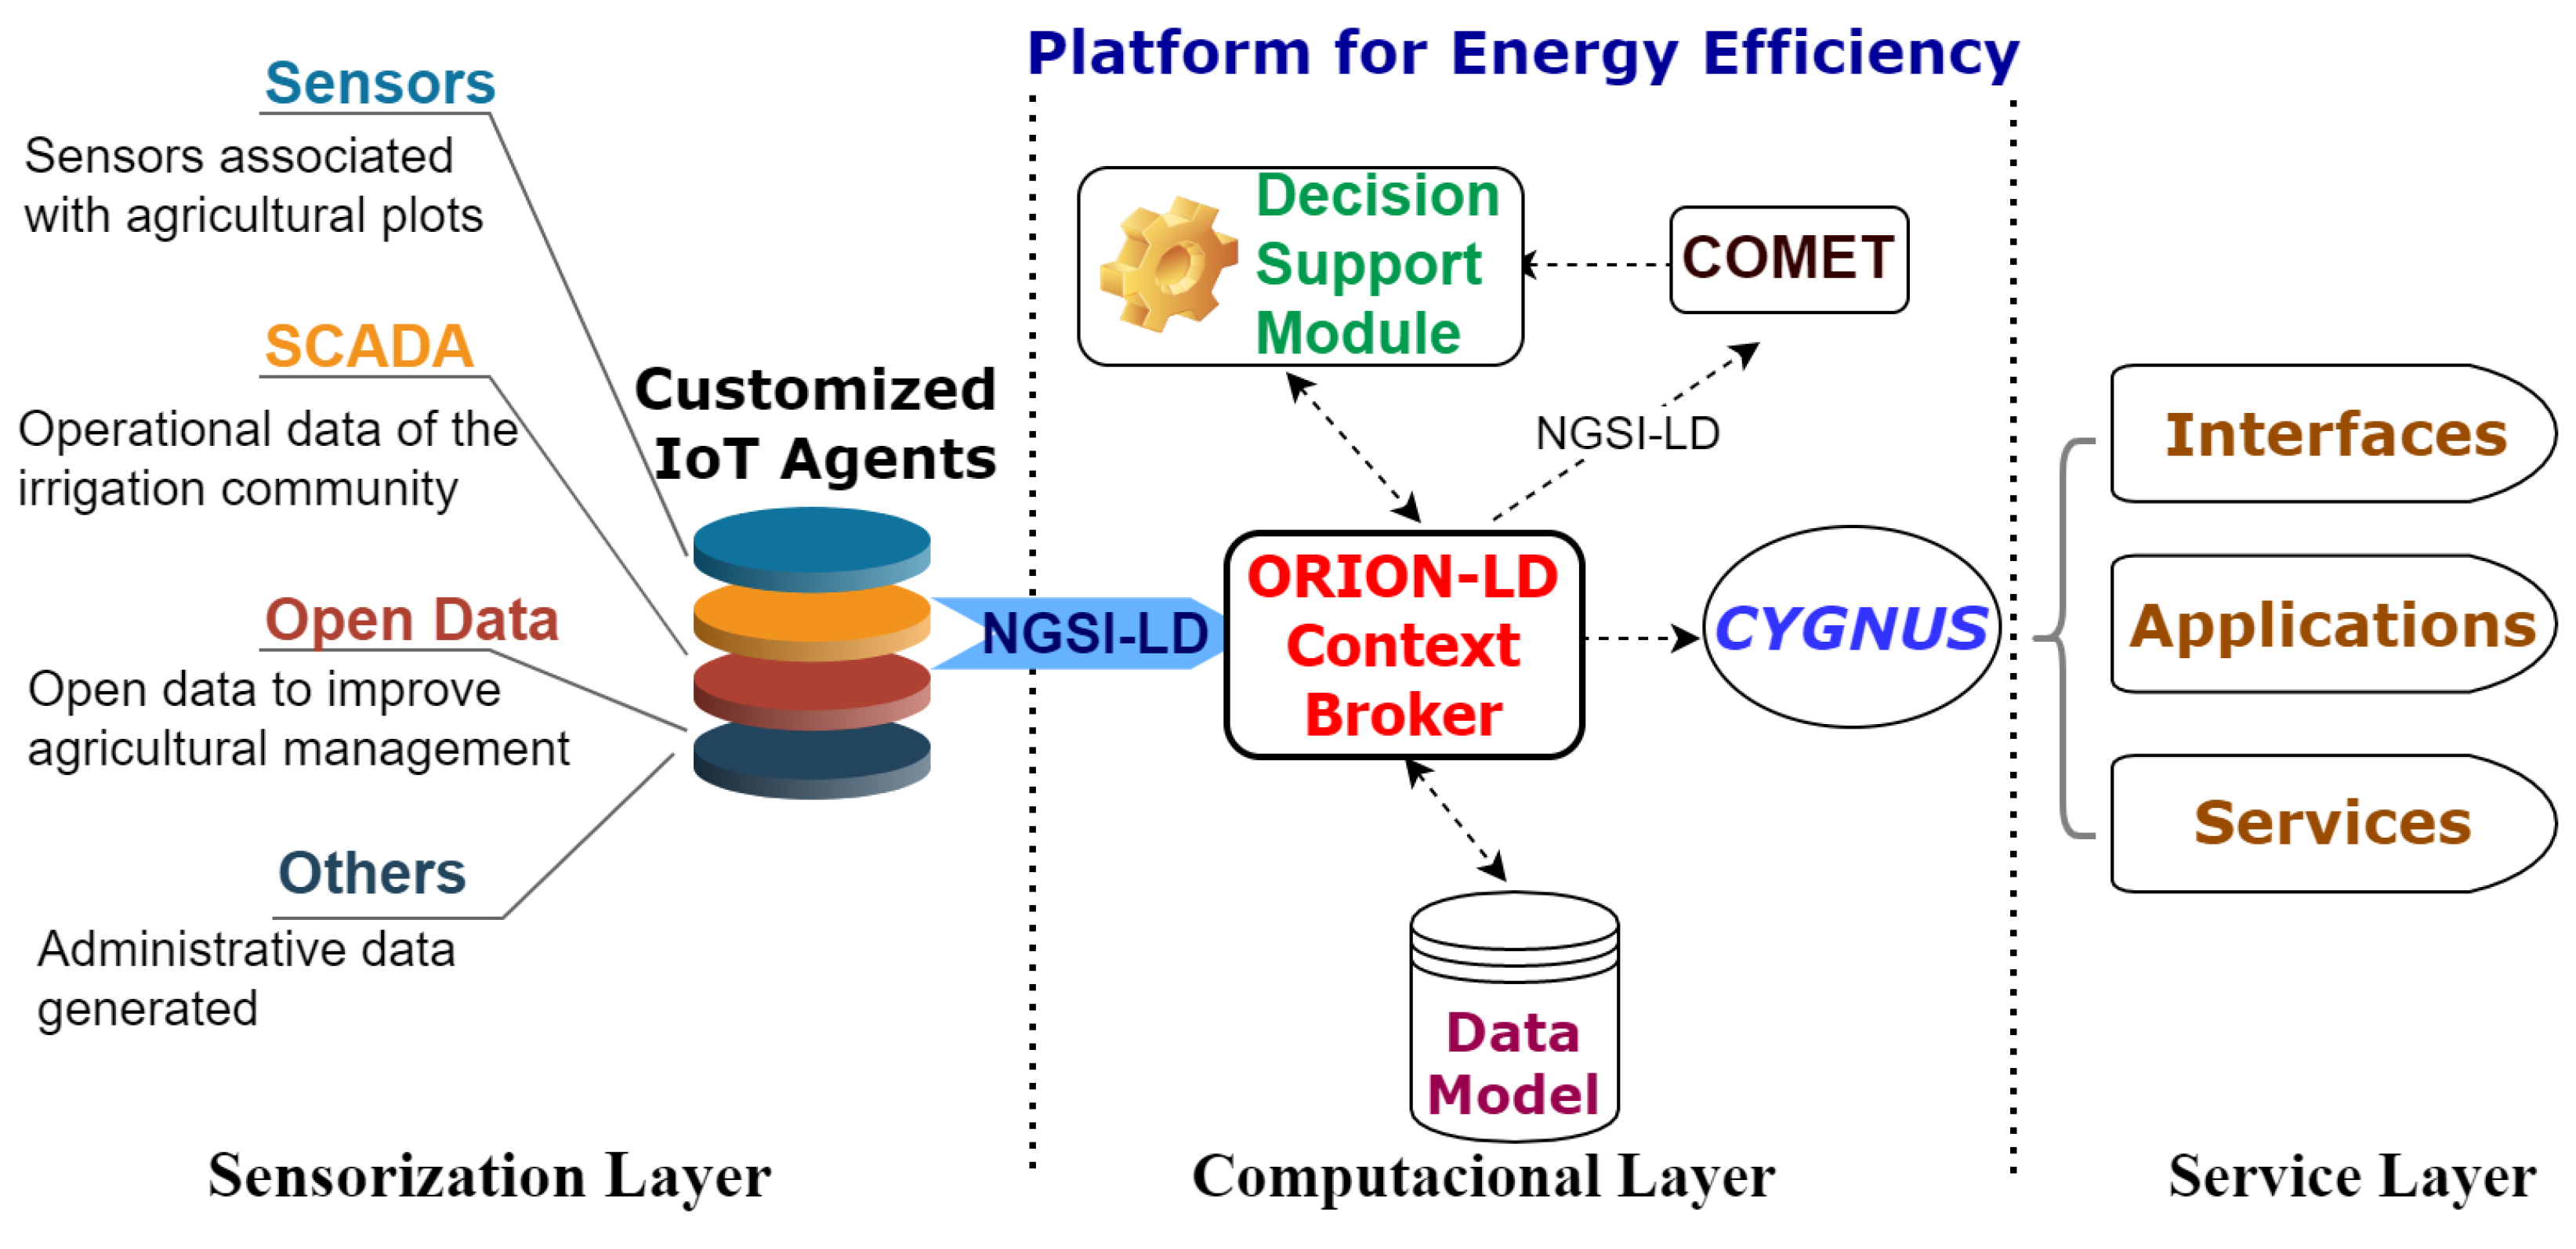
3.2. Platform Architecture

Figure 3 shows the layered architecture proposed to improve irrigation wells’ energy efficiency in an intelligent agricultural environment. The architecture integrates from the deployment of sensors and monitoring of data extraction techniques to the intelligent processing of information. These layers are based on open and standard initiatives such as those provided by the FIWARE Community.
The first layer Sensorization comprises sensors (e.g., water quality sensor, depth level sensor or temperature sensor) and actuators (e.g., the light controller and the wells commissioning controller) to provide consumption data. The sensors are responsible for monitoring the infrastructure, which is part of the irrigation installation, and the pumps’ operating status. These devices use different communication technologies to transmit information to each of the IoT agents that are in charge of translating known, open and light protocols such as Message Queuing Telemetry Transport (MQTT) or Lightweight M2M—also allowing the possibility of integrating new data sources through the use of customized agents. These agents act as an intermediary with the next layer and transform the information to allow the devices to interact with the platform through NGSI-LD.
The second layer Computacional is in charge of storing, computing and analyzing the data to generate the necessary indicators to calculate each well’s energy efficiency. It is composed of modules that work together to manage massive amounts of data and make them available to the upper layer. The NGSI-LD interface is used to send data updates and receive notifications about changes. This platform’s core is the Context Broker; in our case, we use the ORION-LD implementation. It is an information broker that exposes an NGSI-LD-based HTTP REST API for both registration and querying, as well as a subscription/notification approach. This enabler stores the entity’s instances in an information model that allows the unification of data structures through standards and ensures the necessary generality for subsequent extensibility. Through the NGSI-LD update operation, the IoT agents in the sensorization layer update the entity attributes in real-time with the new device readings. The COMET enabler is then used to support historical series data, it adheres to the same information model, so it does not require any other data harmonization process. It incorporates an ad hoc API to retrieve historical data along with simple aggregation functions. Finally, the decision support module is responsible for validating and generating information that helps improve well management.
The last layer Service is based on communication and is designed to facilitate decentralized groups’ decision-making: technicians from the farm, companies responsible for maintaining the wells or the community members themselves. The system allows exchanging information through a mobile application and a web-based management platform, using a REST API. According to the criteria defined in the previous phase, users are notified on their mobile phones based on their access level. According to the alert generated, they can act on the devices.
  • Generating visualizations and stacked graphs allowing predictive control of pumping.
  • Developing control parameters using actionable information or defining intelligent strategies for the use of electric rates.
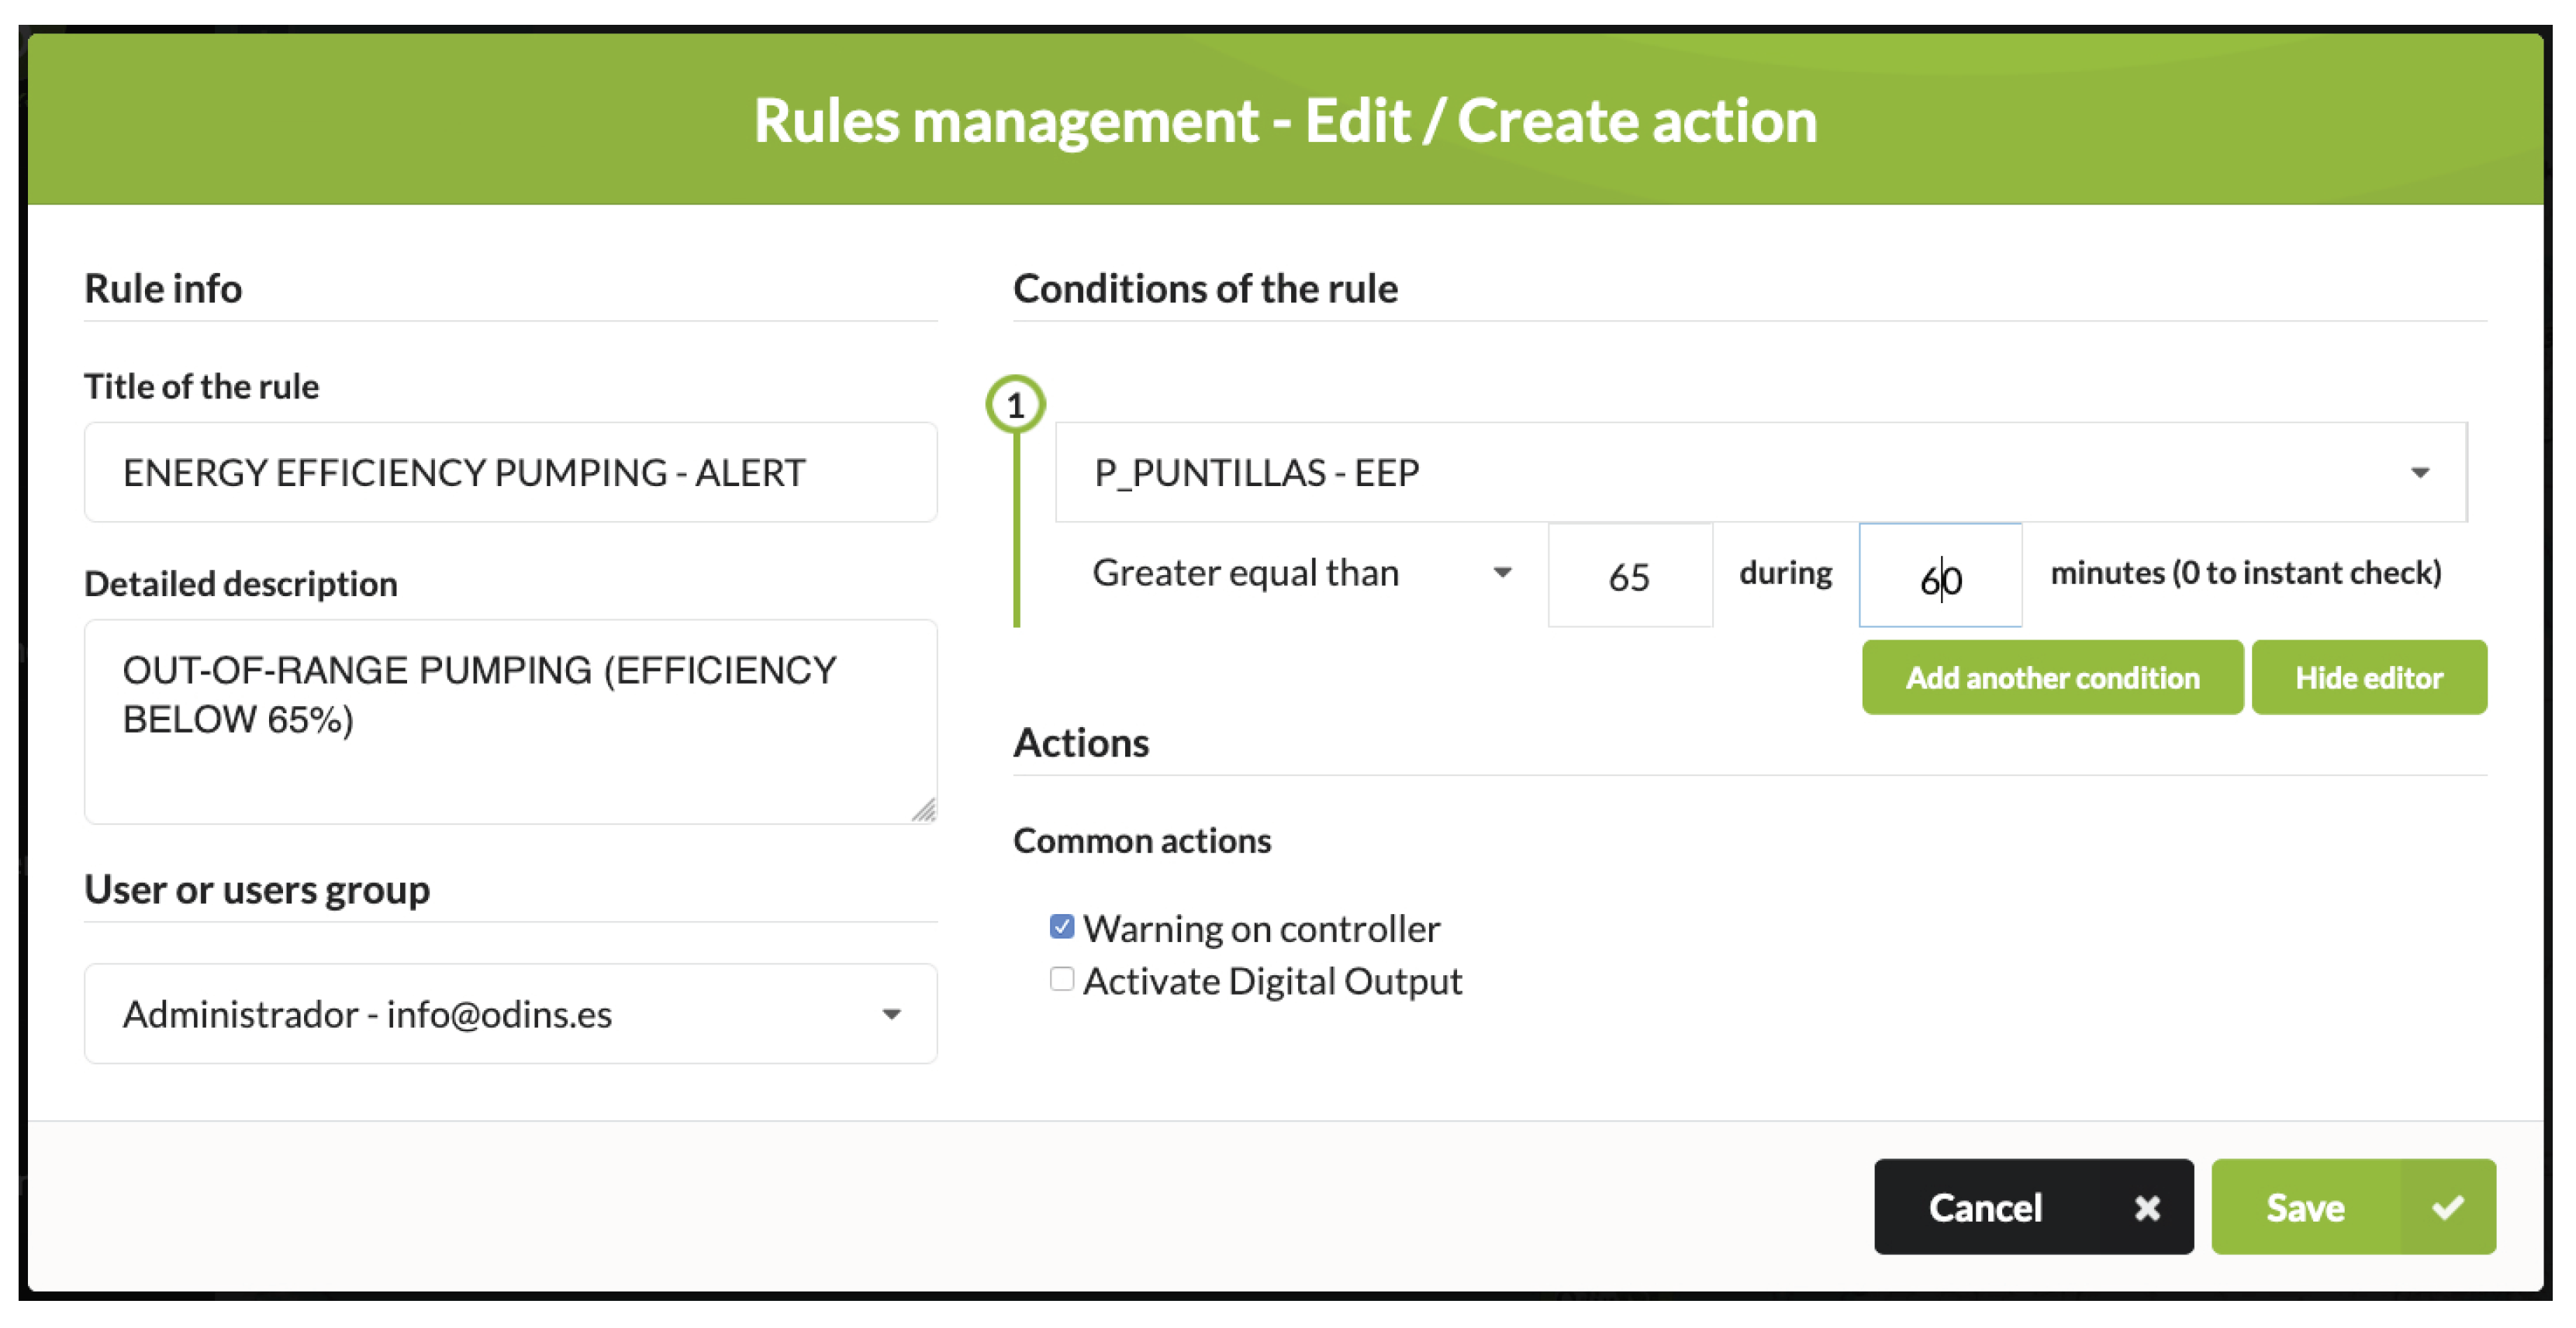
  • Transmitting the generated control parameters to the actuators or generating alerts based on the calculated indicators.
Some services in the service layer obtain the information provided by Context Broker through the NGSI-LD API, through their subscription-based connectors, or the FIWARE CYGNUS module. This connector allows for subscription-based data export to a wide variety of services. Thanks to its use, the information is consulted or notified to the superior modules responsible for exploiting the different types of data.
Therefore, the assets, mainly, the wells are regulated according to the control parameters to improve their energy and operational efficiency. This layer is also open to integration with other platforms, and that data can be processed and managed by third party services under the open interfaces offered.

3.3. Decision-Making Support

The decision support systems use the knowledge generated by a computer program, which guides the user to make decisions about a field of action [35,36]. In our case, the efficiency of pumping is usually verified by specialized technicians, but sometimes it is necessary to transfer this information to other people. To habilitate this interaction, we need to enable mechanisms, which guide non-specialists and impose a high degree of consistency to the evaluation process.
Decision-making is based on experience and knowledge from a variety of sources such as:
  • Technical guides of the pump performance curves and technical data of the wells’ infrastructures.
  • Audits or energy studies carried out previously.
  • Expert experience in energy and hydraulic management
  • Data on the evolution of the energy market and its tariffs.
  • Values in real-time of the sensors located in the facilities.
  • Experiences and data from other farms and other professional institutions related to the energy or hydraulic environment.
A decision support system is intended to convert all the disparate data collected into information to make the best decisions. Below are the phases used to improve decision-making on pumping:
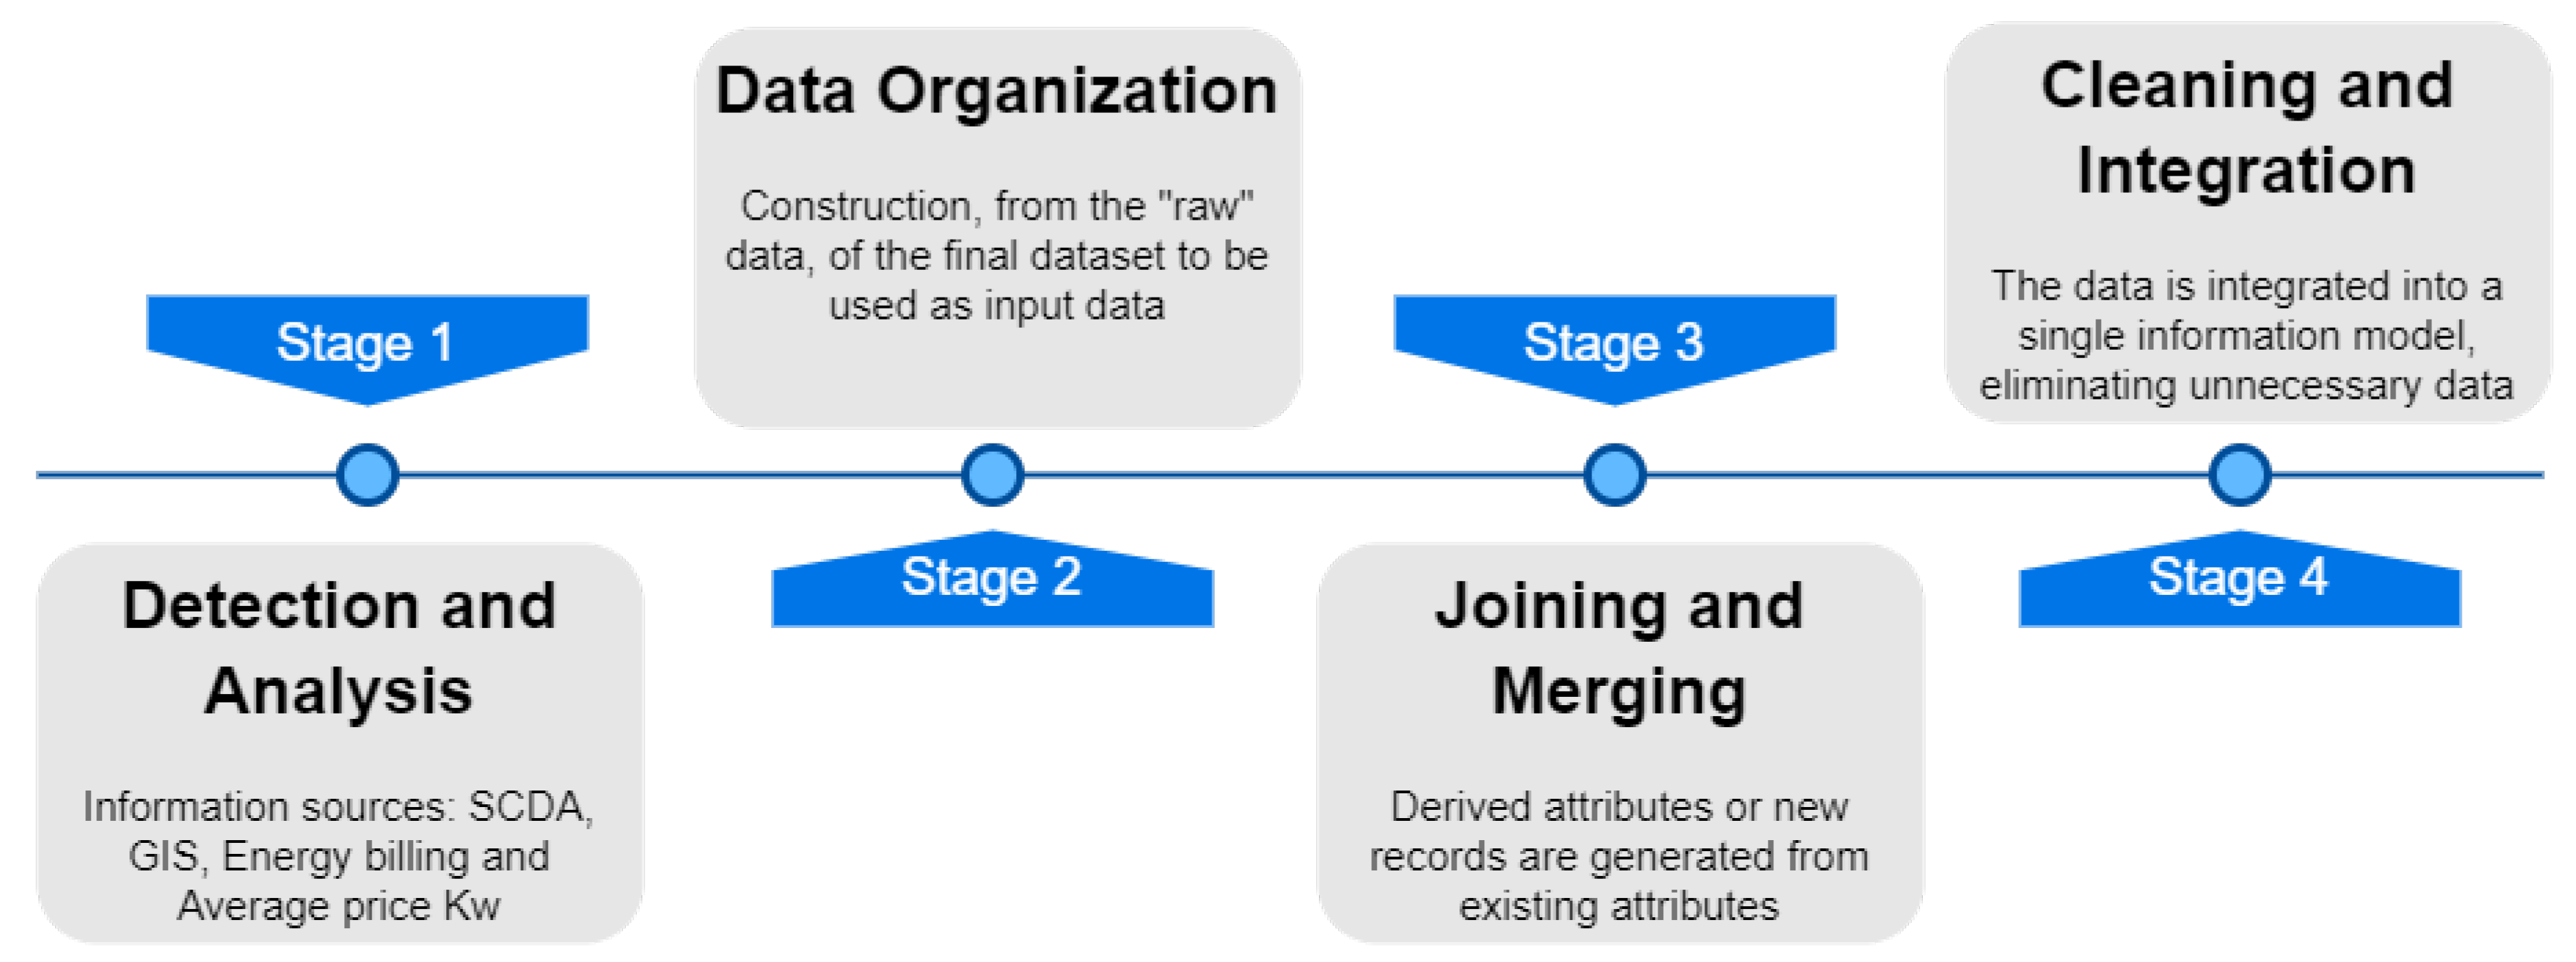
  • Contrasting Analysis Phase: In this phase, all the data sets, internal or external, are collected to improve the decision-making on the pumping efficiency; in each of the time series of the different variables, we can find gaps or wrong data. This failure in the data can be produced by defective sensors or by failure in the communications. These missing values affect the performance of the system and must be addressed accordingly. The detection of the anomalous data occurs because the system detects that its value is not within the thresholds previously defined for each of the variables that form part of the system. At this time, the value is replaced or eliminated. In this work, the missing values are replaced by their appropriate values using a linear regression technique and use the annotations made manually by the guards responsible for the installations. Once the data have been pre-processed, they are incorporated into an information model, which allows the interoperability of the proposed solution to be increased. Therefore, the information, when interacting with each other, is not only connected but understood.
  • Efficiency Forecasting Phase: This phase is responsible for generating exhaustive information on the daily evolution of the irrigation wells’ performance, based on each well’s characterization, energy consumption and the average water flow obtained from each pumping. The EEP of each pumping is calculated, and the next day’s value is predicted, based on the programming of each well and the accumulated history. The wells’ optimal efficiency thresholds are defined, as well as the measures to be adopted and the periodicity of the generation of the alerts. At the same time, it is verified which day and at what time each pumping will start to determine that the most economical tariff section has been chosen. If this is not the case, a section with a better electricity tariff is recommended.
The suggested platform gathers the base knowledge needed to monitor pumping efficiency. It is presented to the user through a user-friendly computer system to develop comprehensive and interactive decision support for monitoring the energy efficiency of irrigation pumps. The platform will allow farm managers to make their own decisions to improve the wells’ performance and at the same time obtain a reduction of the energy bill, which will allow optimal agricultural production on a sustainable basis.
Using experiences from other agricultural years, together with the real-time information provided by the platform, it becomes possible to predict the evolution of pumping efficiency and prevent future hydraulic problems. Consequently, it is possible to establish alternatives in using the rates assigned to each well and improve the pumping’s maintenance, to develop an adequate balance between financial results, energy costs and pumping performance.

4. Use Case and Experiment Results
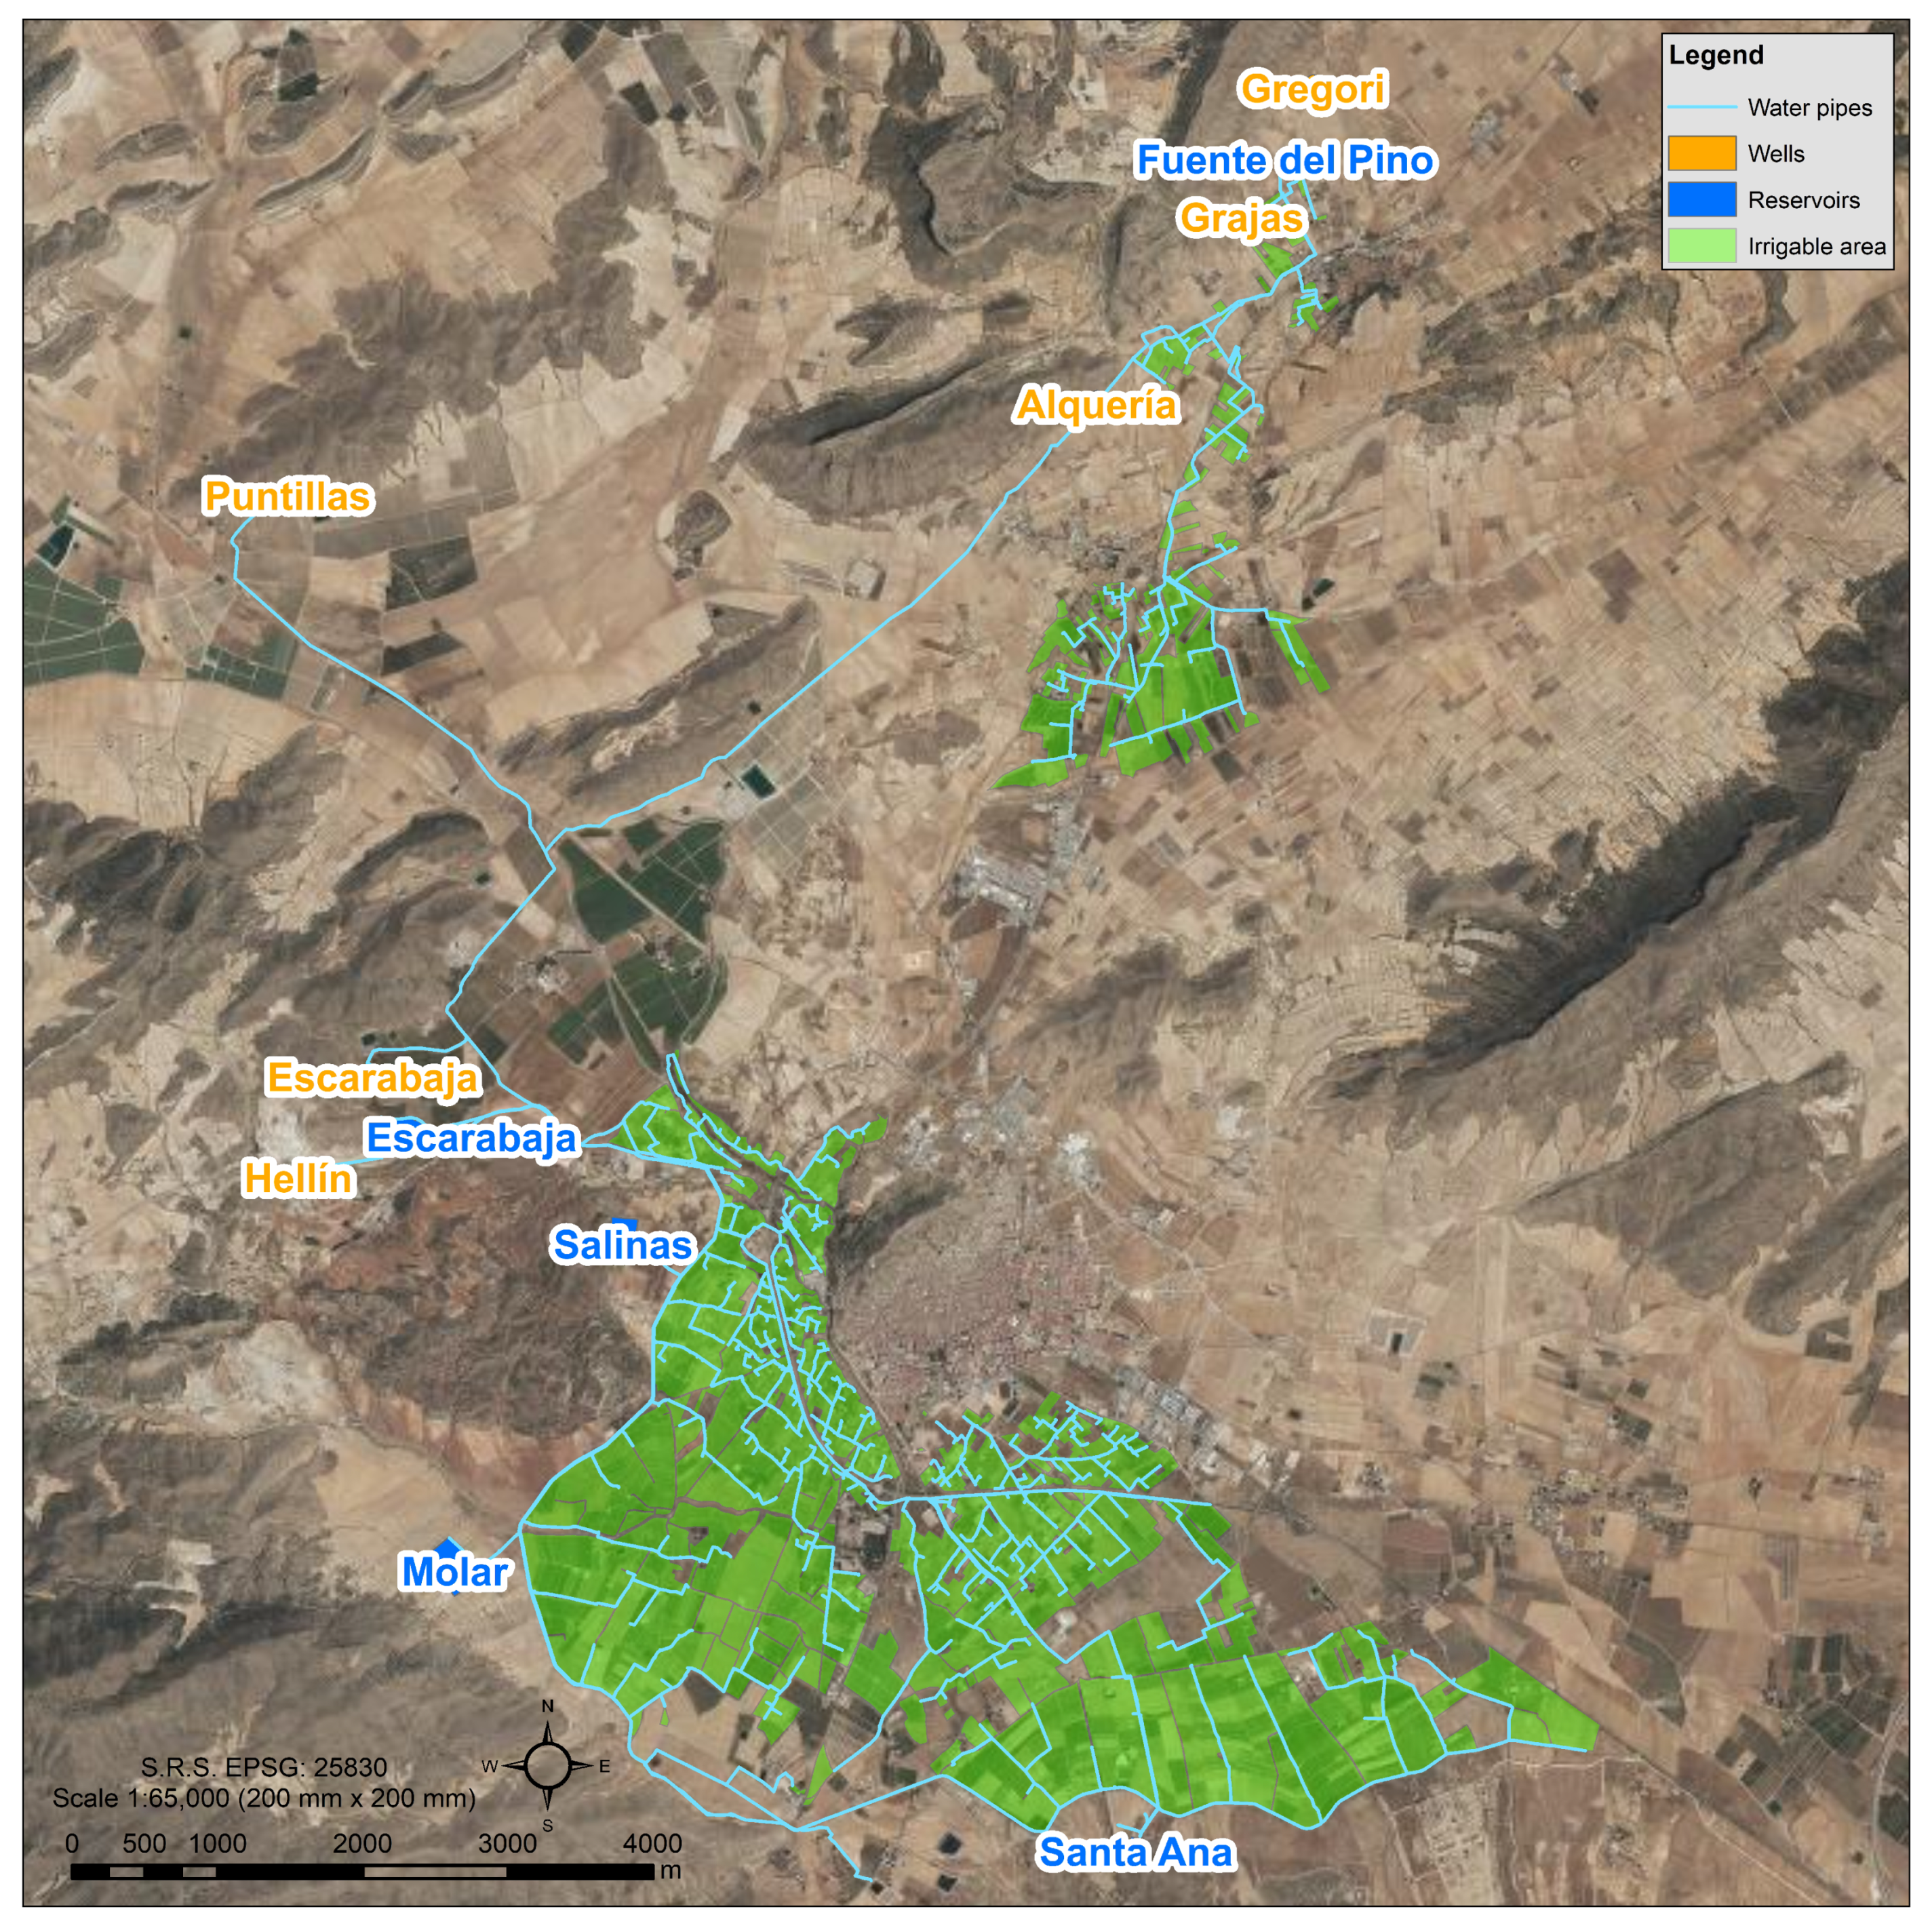
An irrigation community is an association of co-owners of public water benefit, previously granted, and landowners who have been given the use for joint irrigation and independent exploitation of their plots.
The irrigation community where the deployment has been carried out has allowed the evaluation of the platform’s functionalities to estimate the energy efficiency of the pumping network in irrigation installation, through the integration of heterogeneous data sets and the definition of efficiency indicators.

4.1. Scenario

The irrigating community of Miraflores located in the municipality of Jumilla (Murcia), with an area close to 1330 hectares and 967 members are part of it. It is a municipality characterized by the absence of water because it has been excluded from the water supplies of the Tajo-Segura Aqueduct. Due to the lack of water, the water for irrigation comes from wells, and by concessions of reclaimed water from a local treatment plant, with a total number of 4000 m 3 /ha/year. The community has six sectors, each of them has automated pumping station, controlled by a programmable automaton, and a hydraulic network with pressure. There are approximately 3980 hydrants and a regulation ponds. The irrigation period covers the entire year, and the irrigation system is on-demand. In Figure 4, you can see the boundaries and plots of the community, along with the infrastructure for irrigation, more representative and that they have facilities whose characteristics must be known to calculate variables, such as manometric height, required to obtain EEP: reservoirs, wells and water pipes.

4.2. Equipment and Implementation

It should be noted that the Miraflores Irrigation Community carried out the additional sensorization required outside the scope of this work, so the fact that the platform was able to integrate data from other services or sensors was already proof of its validity. The cost of implementing the platform has been reduced due to the Open Source feature of the platform. This first year of use has been at zero cost, but it is estimated that the annual maintenance cost of the platform will be close to 3000 € for the following years. The platform was installed in a cloud server with CentOS 8 as an operating system, 16 GB RAM and 500 GB hard disk. Good performance is obtained, but given the architecture’s flexibility, more resources can be added by modifying the virtual images.
Once the different modules that make up the platform have been configured, the entities are defined in the Broker to generate subscriptions to these entities. The Broker manages the subscriptions to the creation or modification of entities. All these changes are stored in a non-relational database (MongoDB) based on JavaScript Object Notation for Linked Data (JSON-LD) [37] objects, allowing quick and flexible access to information. In addition, the model is instantiated, through NGSI-LD, to characterize the irrigation wells.

4.3. Data Description

A study of the variables related to the management of the irrigation wells’ energy efficiency is carried out during the period from 2016 to 2018 to be used as a starting point for looking at the control of the Community and its most representative parameters: the evolution of consumption in kWh of the irrigation community, total water extractions, the average flows and the economic cost of pumping (annual turnover and per m 3 ), values that can be observed in the Table 1. In this table, we can see that every year there is lower consumption of kWh, extracting less water but at a higher cost. Still, the economic cost of pumping water for irrigation is more significant, so it is necessary to define mechanisms that improve the efficiency of pumping.
After analyzing the data, it is discovered that sets of data must be integrated into the platform to evaluate the wells’ energy behavior: morphology and infrastructure of the community, energy consumption and historical data of average flows of pumping. The process carried out to integrate the different data sets needed to model pumping efficiency is shown in Figure 5.
In the first phase (Detection and Analysis), the objective is to get hold of the data (or, first of all, the possibility of accessing them) that, previously, have been identified as crucial resources for the realization of the work, in our case: data from the supervisory control and data acquisition (SCADA), spatial data and data concerning energy consumption. Characterization of the data sets, their locations and the methods used to get them is made from each of them. In Table 2, the different data sets used are shown.
In the second phase (Data Organization), a general characterization of the data obtained has been made: its format, quantity (number of records and fields) and any other characteristics discovered in this first overview. This characterization serves to evaluate whether the data obtained satisfies the relevant requirements in this respect identified in the previous phase. After having characterized the data sets, we have got the characteristics of the hydraulic infrastructures of the community from the data registered by the AutoCAD system and by external cartographic services (Cadastre and Segura Hydrographic Confederation) that allow the definition of the irrigable area with its corresponding plots and the different facilities that are part of the community: reservoirs, wells, filters, hydrants and water pipes. In addition, to obtain the pumps’ energy consumption, the data will be obtained from the SCADA system. Specifically, the electrical variables have been analyzed: voltage, intensity and power of each pump; and the hydraulic variables: pressure in the inlet manifold, pressure in the outlet manifold, depth of pumping and flow supplied.
In the third phase (Joining and Merging), decisions are made on which data to use using criteria related to relevance to objectives, data quality or technical constraints to “raise” the level of data quality required by the analysis techniques. This phase includes the insertion of appropriate default values or the use of modeling to estimate missing values. To carry out this task, the thresholds that each value must have been defined beforehand with the irrigation community’s technicians. As a result that pump data from the SCADA are processed every 30 min, and to avoid incorrect values, rules are defined to avoid anomalous data:
  • The data of the day will not be taken into account when carrying out maintenance or repairs
  • If there is a 30% failure in the readings during a day, discard the day, but if it is an irrigation programming, discard it if it exceeds 10% of the operating hours.
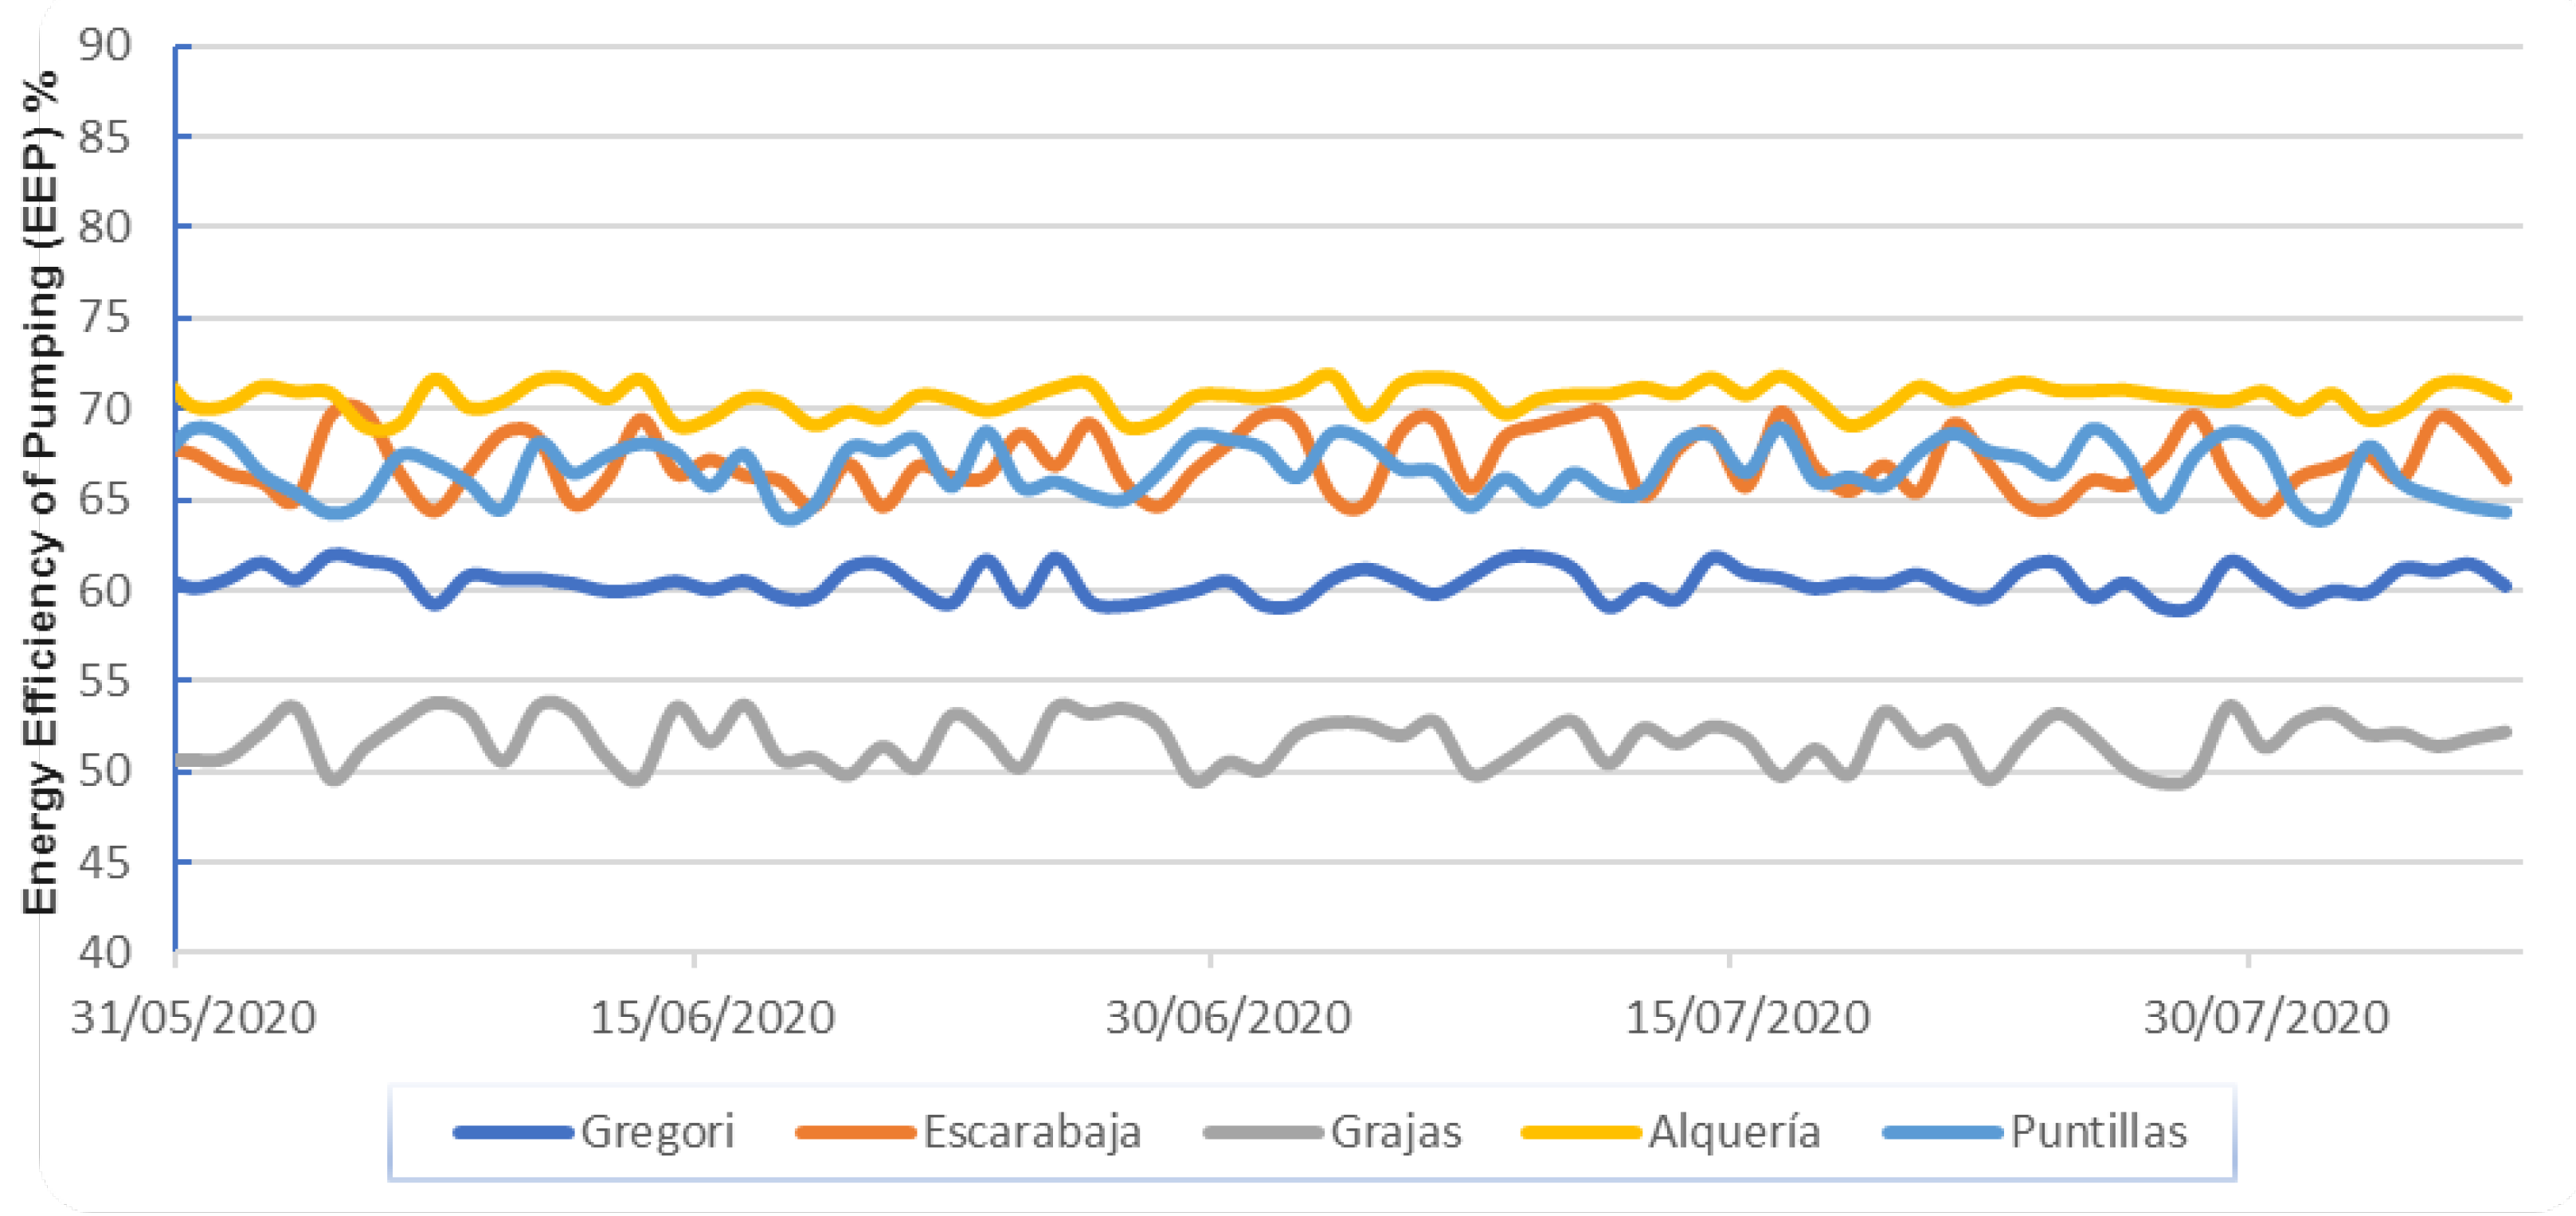
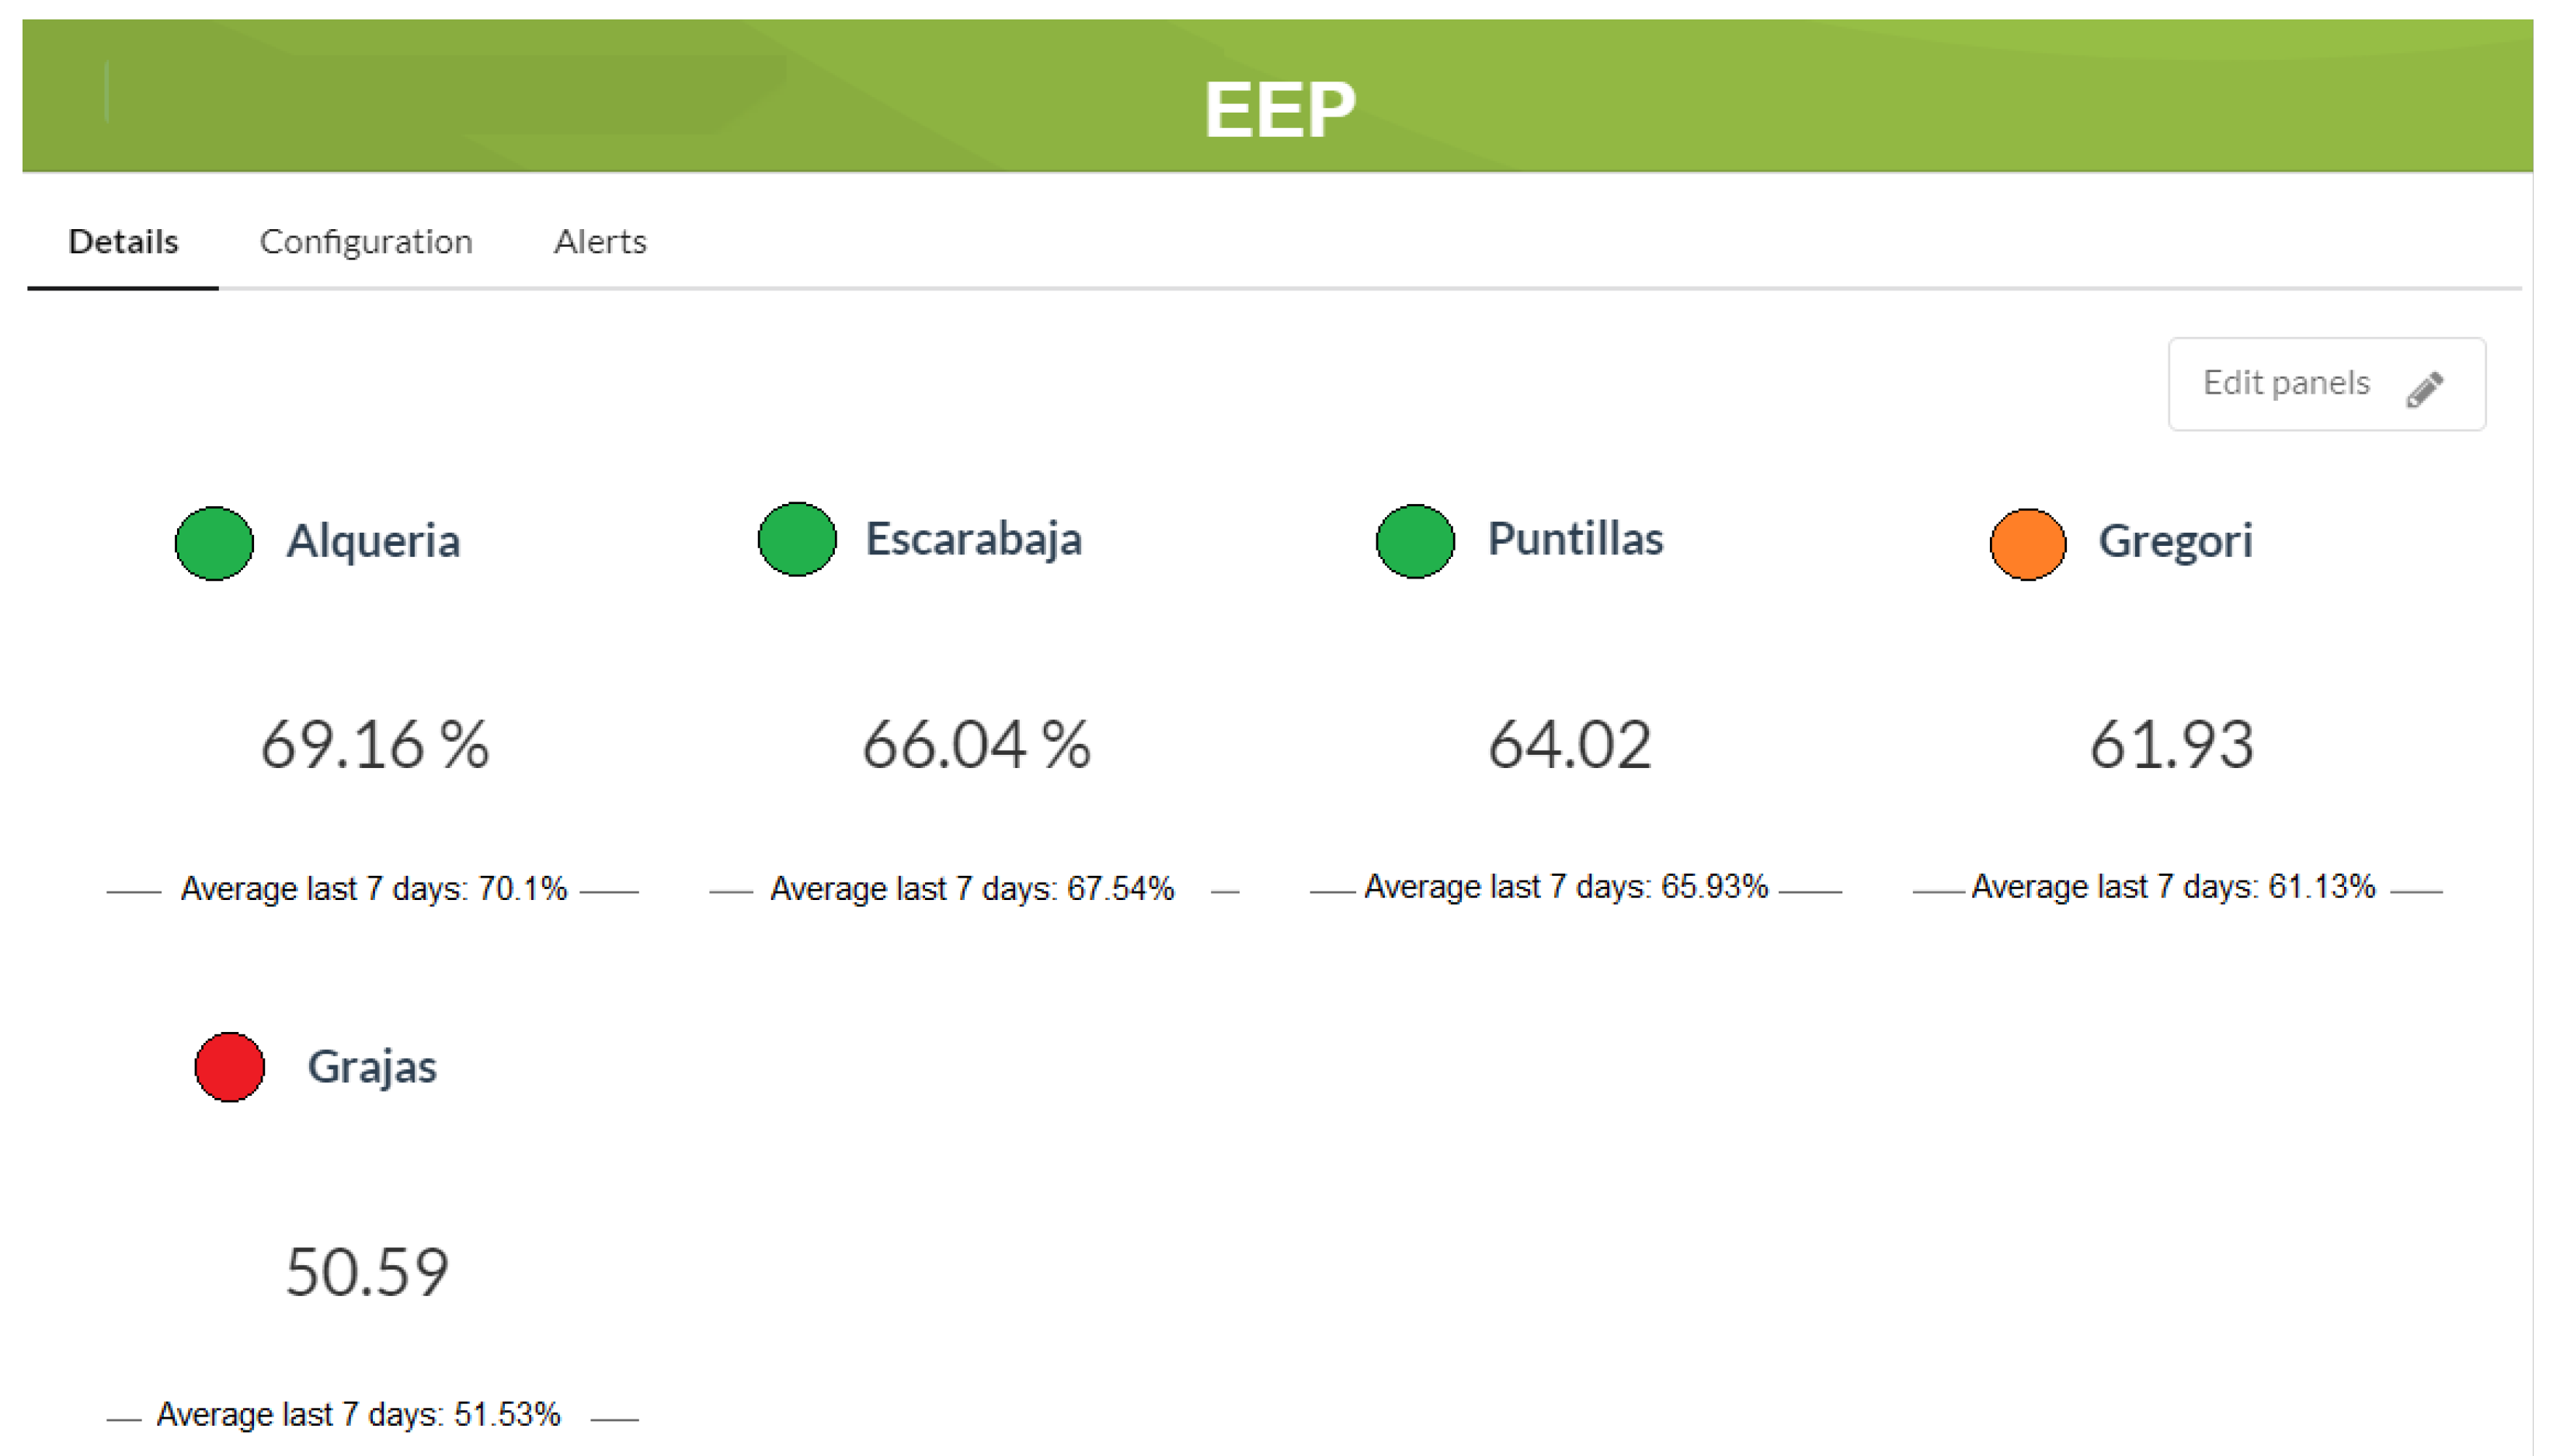
The rules are defined based on the history of erroneous events detected and the solutions taken, in the face of such errors, by the technician responsible for the irrigation community.
It was also possible to obtain the wells’ technical characteristics, which, together with the rest of the data, allow a reasonably accurate approximation of specific energy consumption in real-time. With these data, it was possible to define the EEP indicator to analyze and see the evolution of the wells’ efficiency flows and, therefore, their energy performance.
The last stage (Cleaning and Integration) focuses on combining the data sets that are scattered across different sources (energy bills and electricity tariffs), making aggregations that summarize the information in various records, and removing the data that generate “noise” due to the failure of data reception. All the data are also integrated into a single information model by making syntactic modifications to the data without altering its meaning.
After integrating the data sets, the optimal working thresholds of the wells are defined (with the collaboration of the responsible technicians), based on the calculated EEP indicator: Optimal (greater than 70%), Normal (between 60% and 70%) and Out of range (below 60%). After establishing the efficiency thresholds, rules are defined to warn of abnormal performance. If a well falls below 45% during the day, a warning is generated, and the pump is stopped. Figure 6 shows how the alerts are created; in this case, it is activated when the pumping efficiency indicator is below 65%, for 60 min (so that technicians can be alerted in time to take preventive measures).

4.4. Results

The results obtained are based on the need, on the part of the irrigation community, to create a system that was capable of determining the efficiency of each pumping and thus not having to stop the operation of a pump to determine possible failures.
The platform has enabled improved support for decision making by the managers of the irrigation community due to two factors:
*
The system uses heterogeneous data from IoT sensors, control systems and electricity tariffs and integrates them into a single data model.
*
The system performs data analysis, generates alerts and predicts pumping energy efficiency through indicators.
From the control and supervision of its five agricultural pumps studied, different results have been obtained. One fact to bear in mind when considering the wells’ performance is that the more significant the difference in height at which the pumping is carried out, the lower the flow rate will be due to the increase in the water column’s meters that the pump must overcome. On the contrary, the more similar the suction and expulsion points are in terms of height, the greater the flow obtained, as in the Alquerías well. In Figure 7, we can see the evolution of the daily performance of the pumps m 3 /kW/h or (benefit obtained/effort used), observing anomalies in two pumps, based on the EEP indicator: Grajas whose values are below the minimum recommended, and Gregori which tends to have values close to 60% indicating that their performance tends to decrease. These values indicate the need to assess the reasons for this fall in order to avoid raising the cost of water extraction.
One of the functionalities best valued by the technicians has been the visualization in one single place of the efficiency of the previous day’s pumping and the average of the last seven days, as can be seen in Figure 8, which makes them predict future behavior.
As for the cost of water extraction based on the energy bill generated by each well, the diagram in Figure 9 shows the average monthly price for extraction per m 3 of water. During the last agricultural campaign, and thanks to the system’s data, we observe that the average cost of pumping water is 0.87 €/m 3 /month. This value is high due to the extra cost produced in two wells, Grajas and Gregori with an estimated cost of 1.17 €/m 3 /month and 1.03 €/m 3 /month. This average cost can be reduced by around 23%. During the months of highest water consumption, corrective measures are taken once critical values generated by the monitoring and integrating the different inputs that define the pumping efficiency are alerted.
Given the high cost of water extraction and the loss of efficiency of the pumping over time, and based on the results obtained by monitoring data provided by the platform, the community must take two specific measures: replace the pumping equipment in one of the wells, install a frequency converter in another or vary the pumping’s working height.
As a result of the system’s measures, savings of around 43,500 € have been achieved in energy billing and will be considered for future decisions regarding the pumping system improvement. The measures implemented that have enabled these improvements are:
  • All the information is integrated into a single platform, which avoids consulting the information in multiple solutions.
  • The daily calculation of the EEP indicator is integrated to monitor the pumping efficiency, which, together with monitoring other variables (pressures, motor temperature or flow rates), allows us to anticipate decreases in performance.
  • For the following days, electricity rate are consulted to advise the lowest timetable to avoid higher consumption.
  • Reports on the wells’ efficiency are sent to the companies in charge of their maintenance, for improving the planned revisions and avoiding unnecessary visits. With this measure, the community is in talks with the companies to reduce the annual cost of maintenance or improve their services.
According to results obtained and to savings in energy consumption, an estimate of the cost and benefits of the project are shown in Table 3. Only the first year would have implementation costs; the following years would have to add the cost of system maintenance and replacement or commissioning of new sensors. Savings on energy bills are based on the result of the first year of project. For the remaining years we estimate a reduction of the benefits close to 30%, since every year the pumping system will be more efficient. It can be seen that the system is almost fully amortized in the second year.
The integration of the efficiency indicator and the monitoring of the information in a single platform allow the irrigation community, owner of the wells, to improve their energy consumption in real-time and with a more efficient response.

5. Conclusions and Future Work

The extraction and pumping of groundwater for irrigation generate high energy consumption. Therefore, the analysis of the operating parameters that are part of these facilities and their monitoring is necessary to achieve optimal performance and energy efficiency levels. In this work, we have proposed a decision support system based on IoT that allows the simple integration of heterogeneous data sources, using an information model, to aid and improve the decision-making process on the efficiency of pumping in an irrigation community. It will enable increasing interoperability in communication between IoT devices and controllers and the different services that administer them based on open interfaces. In this way, it is possible to improve the agricultural sector techniques to increase irrigation pumping efficiency and obtain higher economic, environmental and social yields sustainably. In addition, due to its interoperable nature, the platform can be combined with other systems to expand its services range.
At the technological level, homogenization of the operation of agricultural exploitation systems has been achieved. Through the use of communications and data transmission standards, the integration of heterogeneous data sources at the IoT level using custom agents or even the definition of information models to harmonize data relating to irrigation wells that did not have any linkage. The integration of the data in the proposed information model has allowed homogenizing the results in a standard format and showing the model’s versatility for the pre-processing or grouping of the data.
In the agricultural field, it has been possible to establish a preventive alert system that allows determining the performance of each one of the pumps: optimal, improvable or out of range. It will enable us to estimate the energy consumption generated according to each of the pumps’ working hours and, besides, improve the disclosure of IoT into the agricultural sector to encourage its digital transformation. The fact that it is possible to consult the electricity tariffs before starting a pump has made it possible to avoid high energy consumption as the system has prevented the pump from starting and has generated a warning indicating the optimum time for starting the well. As a result of the supervision and control of the drive’s efficiency during the period corresponding to 2019, the estimated savings reached 43,500 € in energy billing, saving close to 10% concerning the previous campaign.
The community leaders believe that by giving access (in consultation mode) to the platform to the technicians in charge of the pumps’ maintenance to avoid unnecessary revisions and are committed to improving the calculation of energy efficiency to meet their customers’ needs. Thanks to the alert system generated at the infrastructure maintenance level, the companies in charge of pump maintenance have real-time access to each well’s performance. Due to this monitoring, they can evaluate the efficiency as if they were “in situ”, improve predictive maintenance and anticipate possible efficiency losses, which would mean economic savings for the irrigation community.
After evaluating the system, it is considered that the proposed modeling can be improved by adding the water flow from the wells to the communal farmers’ plots. It adds controls on the water quality in the pumping station filtrations to ensure that the water that reaches the hydrants meets each crop’s necessary biophysical conditions and the farmers’ needs.

Author Contributions

Conceptualization, J.A.L.-M., J.A.M. and A.F.S.; methodology, J.A.L.-M. and J.A.M.; software, J.A.L.-M. and J.A.M.; validation, J.A.L.-M. and J.A.M.; formal analysis, J.A.L.-M.; investigation, J.A.L.-M.; resources, J.A.L.-M.; data curation, J.A.L.-M. and J.A.M.; writing—original draft preparation, J.A.L.-M.; writing—review and editing, J.A.L.-M., J.A.M. and A.F.S.; visualization, J.A.L.-M.; supervision, J.A.L.-M., J.A.M. and A.F.S.; project administration, J.A.L.-M., J.A.M. and A.F.S.; funding acquisition, A.F.S. All authors have read and agreed to the published version of the manuscript.

Funding

This work has been funded by the European Union’s Horizon 2020 Research and Innovation program through the DEMETER project (contract: 857202), by the “Efficient use and management of conventional and non-conventional water resources through smart technologies applied to improve the quality and safety of Mediterranean agriculture in semi-arid areas” WATERMED 4.0 (Reference Number: 2018-SECTION1-W3), by the Autonomous Community of the Region of Murcia and the European Regional Development Fund (FEDER/ERDF) through REUSAGUA project (ref. 2I16SAE00165) under the RIS3MUR programme, and by the European Regional Development Fund (ERDF) through project FEDER 14-20-25 “Impulso a la economía circular en la agricultura y la gestión del agua mediante el uso avanzado de nuevas tecnologías-iagua”.

Acknowledgments

J.A. López-Morales would like to thank members of Odin Solutions and Miraflores Irrigation Community, especially Francisco Laguna, for their great inspiration, kindness and the help and support received. We also thank Juan de Dios of the company Juan Azcue S.L. for his patience in transmitting his technical knowledge.

Conflicts of Interest

The authors declare no conflict of interest.

References

  1. Garcia, D.J.; You, F. The water-energy-food nexus and process systems engineering: A new focus. Comput. Chem. Eng. 2016, 91, 49–67. [Google Scholar] [CrossRef]
  2. Singh, A. Poor quality water utilization for agricultural production: An environmental perspective. Land Use Policy 2015, 43, 259–262. [Google Scholar] [CrossRef]
  3. Martinho, V.J.P.D. Energy consumption across European Union farms: Efficiency in terms of farming output and utilized agricultural area. Energy 2016, 103, 543–556. [Google Scholar] [CrossRef]
  4. Kosior, K. Digital transformation in the agri-food sector–opportunities and challenges. Roczniki 2018. [Google Scholar] [CrossRef]
  5. Walter, A.; Finger, R.; Huber, R.; Buchmann, N. Opinion: Smart farming is key to developing sustainable agriculture. Proc. Natl. Acad. Sci. USA 2017, 114. [Google Scholar] [CrossRef] [Green Version]
  6. Ciruela-Lorenzo, A.M.; Aguila-Obra, D.; Rosa, A.; Padilla-Meléndez, A.; Plaza-Angulo, J.J. Digitalization of Agri-cooperatives in the Smart Agriculture Context. Proposal of a Digital Diagnosis Tool. Sustainability 2020, 12, 1325. [Google Scholar] [CrossRef] [Green Version]
  7. Quintiliani, C.; Creaco, E. Using additional time slots for improving pump control optimization based on trigger levels. Water Resour. Manag. 2019, 33, 3175–3186. [Google Scholar] [CrossRef]
  8. Turci, L.D.O.; Wang, J.; Brahmia, I. Adaptive and improved multi-population based nature-inspired optimization algorithms for water pump station scheduling. Water Resour. Manag. 2020, 34, 2869–2885. [Google Scholar] [CrossRef]
  9. Makaremi, Y.; Haghighi, A.; Ghafouri, H.R. Optimization of pump scheduling program in water supply systems using a self-adaptive NSGA-II; a review of theory to real application. Water Resour. Manag. 2017, 31, 1283–1304. [Google Scholar] [CrossRef]
  10. Salomons, E.; Housh, M. Practical real-time optimization for energy efficient water distribution systems operation. J. Clean. Prod. 2020, 275, 124148. [Google Scholar] [CrossRef]
  11. Tarjuelo, J.M.; Rodriguez-Diaz, J.A.; Abadía, R.; Camacho, E.; Rocamora, C.; Moreno, M.A. Efficient water and energy use in irrigation modernization: Lessons from Spanish case studies. Agric. Water Manag. 2015, 162, 67–77. [Google Scholar] [CrossRef]
  12. Mardani, A.; Zavadskas, E.K.; Streimikiene, D.; Jusoh, A.; Khoshnoudi, M. A comprehensive review of data envelopment analysis (DEA) approach in energy efficiency. Renew. Sustain. Energy Rev. 2017, 70, 1298–1322. [Google Scholar] [CrossRef]
  13. Hadipour, M.; Derakhshandeh, J.F.; Shiran, M.A. An experimental setup of multi-intelligent control system (MICS) of water management using the Internet of Things (IoT). ISA Trans. 2020, 96, 309–326. [Google Scholar] [CrossRef] [PubMed]
  14. García, L.; Parra, L.; Jimenez, J.M.; Lloret, J.; Lorenz, P. IoT-Based Smart Irrigation Systems: An Overview on the Recent Trends on Sensors and IoT Systems for Irrigation in Precision Agriculture. Sensors 2020, 20, 1042. [Google Scholar] [CrossRef] [PubMed] [Green Version]
  15. Liu, P.; Wang, J.; Sangaiah, A.K.; Xie, Y.; Yin, X. Analysis and prediction of water quality using LSTM deep neural networks in IoT environment. Sustainability 2019, 11, 2058. [Google Scholar] [CrossRef] [Green Version]
  16. Li, T.; Xia, M.; Chen, J.; Zhao, Y.; De Silva, C. Automated water quality survey and evaluation using an IoT platform with mobile sensor nodes. Sensors 2017, 17, 1735. [Google Scholar] [CrossRef]
  17. Zamora-Izquierdo, M.A.; Santa, J.; Martínez, J.A.; Martínez, V.; Skarmeta, A.F. Smart farming IoT platform based on edge and cloud computing. Biosyst. Eng. 2019, 177, 4–17. [Google Scholar] [CrossRef]
  18. Muñoz, M.; Guzmán, J.; Sánchez, J.; Rodríguez, F.; Torres, M.; Berenguel, M. A New IoT-based Platform for Greenhouse Crop Production. IEEE Internet Things J. 2020. [Google Scholar] [CrossRef]
  19. Franco, J.D.; Ramirez-delReal, T.A.; Villanueva, D.; Gárate-García, A.; Armenta-Medina, D. Monitoring of Ocimum basilicum seeds growth with image processing and fuzzy logic techniques based on Cloudino-IoT and FIWARE platforms. Comput. Electron. Agric. 2020, 173, 105389. [Google Scholar] [CrossRef]
  20. Kamienski, C.; Soininen, J.P.; Taumberger, M.; Dantas, R.; Toscano, A.; Salmon Cinotti, T.; Filev Maia, R.; Torre Neto, A. Smart water management platform: Iot-based precision irrigation for agriculture. Sensors 2019, 19, 276. [Google Scholar] [CrossRef] [Green Version]
  21. Brewster, C.; Roussaki, I.; Kalatzis, N.; Doolin, K.; Ellis, K. IoT in Agriculture:Designing a Europe-Wide Large-Scale Pilot. IEEE Commun. Mag. 2017, 55, 26–33. [Google Scholar] [CrossRef]
  22. Shrouf, F.; Miragliotta, G. Energy management based on Internet of Things: Practices and framework for adoption in production management. J. Clean. Prod. 2015, 100, 235–246. [Google Scholar] [CrossRef]
  23. Terroso-Saenz, F.; González-Vidal, A.; Ramallo-González, A.P.; Skarmeta, A.F. An open IoT platform for the management and analysis of energy data. Future Gener. Comput. Syst. 2019, 92, 1066–1079. [Google Scholar] [CrossRef]
  24. Luna, T.; Ribau, J.; Figueiredo, D.; Alves, R. Improving energy efficiency in water supply systems with pump scheduling optimization. J. Clean. Prod. 2019, 213, 342–356. [Google Scholar] [CrossRef]
  25. Brundu, F.G.; Patti, E.; Osello, A.; Del Giudice, M.; Rapetti, N.; Krylovskiy, A.; Jahn, M.; Verda, V.; Guelpa, E.; Rietto, L.; et al. IoT software infrastructure for energy management and simulation in smart cities. IEEE Trans. Ind. Inform. 2016, 13, 832–840. [Google Scholar] [CrossRef]
  26. Wang, W.; Yang, H.; Zhang, Y.; Xu, J. IoT-enabled real-time energy efficiency optimisation method for energy-intensive manufacturing enterprises. Int. J. Comput. Integr. Manuf. 2018, 31, 362–379. [Google Scholar] [CrossRef]
  27. Pelli, T.; Hitz, H. Energy indicators and savings in water supply. J. Am. Water Work. Assoc. 2000, 92, 55–62. [Google Scholar] [CrossRef]
  28. Moreno, M.; Córcoles, J.; Moraleda, D.; Martinez, A.; Tarjuelo, J. Optimization of underground water pumping. J. Irrig. Drain. Eng. 2010, 136, 414–420. [Google Scholar] [CrossRef]
  29. Abadía, R.; Rocamora, C.; Ruiz, A. Protocolo de auditoría energética en comunidades de regantes. Instituto para Diversificación y Ahorro de la Energía, IDAE. Ser. Divulg. Ahorr. Y Efic. Energética En Agric. 2008, 10. Available online: https://www.idae.es/file/10565/download?token=ml5HNpfM (accessed on 8 September 2020).
  30. Abadia, R.; Rocamora, C.; Ruiz, A.; Puerto, H. Energy efficiency in irrigation distribution networks I: Theory. Biosyst. Eng. 2008, 101, 21–27. [Google Scholar] [CrossRef]
  31. FIWARE Foundation, e.V. FIWARE Open Source Platform for the Smart Digital Future. Available online: http://www.fiware.org/ (accessed on 24 September 2020).
  32. SpecWorks, O. NGSI 9/10 Information Model. 2019. Available online: http://www.openmobilealliance.org/release/NGSI/ (accessed on 31 July 2020).
  33. ETSI. Context Information Management (CIM); NGSI-LD API. Available online: https://www.etsi.org/deliver/etsi_gs/CIM/001_099/009/01.01.01_60/gs_CIM009v010101p.pdf (accessed on 28 September 2020).
  34. López-Morales, J.A.; Martínez, J.A.; Skarmeta, A.F. Digital Transformation of Agriculture through the Use of an Interoperable Platform. Sensors 2020, 20, 1153. [Google Scholar] [CrossRef] [PubMed] [Green Version]
  35. Pick, R.A. Benefits of decision support systems. In Handbook on Decision Support Systems 1; Springer: Berlin/Heidelberg, Germany, 2008; pp. 719–730. [Google Scholar]
  36. Beynon, M.; Rasmequan, S.; Russ, S. A new paradigm for computer-based decision support. Decis. Support Syst. 2002, 33, 127–142. [Google Scholar] [CrossRef]
  37. Kellogg, G.; Champin, P.; Longley, D. JSON-LD 1.1–a JSON-Based Serialization for Linked Data; Technical Report; W3C.2019. Available online: https://hal.archives-ouvertes.fr/hal-02141614v2/document (accessed on 2 October 2020).
  38. Region, T.P.M.; IMIDA. Weather Report of the Last Recorded Hourly Data. Available online: https://datosabiertos.regiondemurcia.es/imida/catalogo/medio-ambiente/informe-meteorologico-del-ultimo-dato-horario-registrado (accessed on 1 October 2020).
  39. Iberdrola. Access to Customers. Available online: https://www.iberdrola.es/webclifr/#/login (accessed on 3 October 2020).
  40. OMIE. Section Day-Ahead Market. Day-Ahead Market Hourly Prices in Spain. Available online: https://www.omie.es/en/file-access-list?parents (accessed on 3 October 2020).
Figure 1. Representative curves that define the operation of a pump.
Electronics 10 00250 g001
Figure 2. Data model associated with efficient pump management.
Electronics 10 00250 g002
Figure 3. General vision of the proposed architecture.
Electronics 10 00250 g003
Figure 4. Geographical distribution of the irrigation community and water facilities.
Electronics 10 00250 g004
Figure 5. Stages followed in the integration of the data in the information model.
Electronics 10 00250 g005
Figure 6. Creation of rules to alert when wells begin to be out of range.
Electronics 10 00250 g006
Figure 7. Evolution of efficiency during the months of most significant water demand.
Electronics 10 00250 g007
Figure 8. Display of the previous day’s pumping efficiency and the average of the last seven days.
Electronics 10 00250 g008
Figure 9. Monthly economic cost for water extraction per m 3 .
Electronics 10 00250 g009
Table 1. Total values generated in previous years.
YearConsumptionExtractionFlowCost
kWhm 3 m 3 /s€ m 3 /year
20163,933,5763,934,227312393,5120.1001
20173,680,9213,561,273342421,6440.1184
20183,596,8333,027,871323455,2900.1504
Table 2. Different data sets integrated in the platform.
DatasetTypeSource
SCADAcsv fileCommunity’s own
AutoCADdgw fileCommunity’s own
GISGeodatabaseExternal company
Wheather StationsOpen DataIMIDA [38]
Water analysisExcel fileCEBAS
Electricity market operatorFTPIberdrola [39]
Electricity company billsExcel fileOMIE [40]
Table 3. Relationship between implementation cost and energy savings estimated for five years.
Year 1Year 2Year 3Year 4Year 5Total
Implementation costs39,000 €----39,000 €
Maintenance costs-5000 €6000 €6000 €6000 €23,000 €
Reduction in energy bills-43,500 €35,235 €32,190 €28,275 €139,200 €
Estimated benefit−39,000 €38,500 €29,235 €26,190 €22,275 €77,200 €
Estimated accumulated benefit−39,000 €−500 €28,735 €54,925 €77,200 €
Publisher’s Note: MDPI stays neutral with regard to jurisdictional claims in published maps and institutional affiliations.

