Article

Automatic Interior Design in Augmented Reality Based on Hierarchical Tree of Procedural Rules

by
Peter Kán
1,2,*,
Andrija Kurtic
3,
Mohamed Radwan
1,3 and
Jorge M. Loáiciga Rodríguez
3
1
Institute of Visual Computing and Human-Centered Technology, TU Wien, 1040 Vienna, Austria
2
Department of Computer Science, Aarhus University, 8000 Aarhus, Denmark
3
COZYO, 1030 Vienna, Austria
*
Author to whom correspondence should be addressed.
Electronics 2021, 10(3), 245; https://doi.org/10.3390/electronics10030245
Submission received: 16 December 2020 / Revised: 8 January 2021 / Accepted: 14 January 2021 / Published: 21 January 2021
(This article belongs to the Special Issue Recent Advances in Virtual Reality and Augmented Reality)

Abstract

:
Augmented reality has a high potential in interior design due to its capability of visualizing numerous prospective designs directly in a target room. In this paper, we present our research on utilization of augmented reality for interactive and personalized furnishing. We propose a new algorithm for automated interior design which generates sensible and personalized furniture configurations. This algorithm is combined with mobile augmented reality system to provide a user with an interactive interior design try-out tool. Personalized design is achieved via a recommender system which uses user preferences and room data as input. We conducted three user studies to explore different aspects of our research. The first study investigated the user preference between augmented reality and on-screen visualization for interactive interior design. In the second user study, we studied the user preference between our algorithm for automated interior design and optimization-based algorithm. Finally, the third study evaluated the probability of sensible design generation by the compared algorithms. The main outcome of our research suggests that augmented reality is viable technology for interactive home furnishing.

1. Introduction

Home furnishing with new furniture is often a challenging task due to several pitfalls between selection of furniture in a shop and its composition in a target room. One of these pitfalls is the lack of imagination in relation to the target room and to other furniture when an item is seen in the shop. Another problem in home furnishing is to ensure that selected furniture has correct dimensions for the target room. Additionally, once the furniture is purchased, a home owner may want to try multiple spatial configurations in the target room which is physically demanding and time-consuming. These problems can be addressed by utilizing augmented reality (AR) technology. AR allows visualizing the desired furniture directly at home with correct dimensions. Therefore, AR supports imagination and aids size measurements in the real space. The remaining problem in home furnishing in AR is the missing advice about furniture composition and its spatial configuration. In an ideal case, the user’s flat may be empty, but the complexity is significantly increased if the user has some furniture items he might want to keep and just add a couple of new ones.
Professional interior design for home furnishing is an expensive and time-consuming process. Due to this problem, numerous homes are designed by the owners themselves without the professional interior design insight. We address this problem by mobile interior design system which provides users with automatically generated interior design configurations, tailored to personal user preferences. Additionally, our system uses AR visualization to enable try-out of new furniture directly in the target room. Users can then manually tweak the proposed position of items and delete or exchange the unwanted ones.
Previous research demonstrated the successful utilization of AR for interior design tasks [1,2]. However, these methods did not provide a personalized design and they utilized optimization-based approaches which are prone to generation of unlivable furniture configurations in some cases. In contrast to that, our algorithm is based on hierarchical tree of procedural rules which generates sensible design with high probability. Moreover, our recommender service selects furniture based on user preferences leading to a personalized design.
The methods for automated generation of furniture configurations may produce interior designs which contain objects of different styles and colors that may not fit together. We address this problem by utilizing automatic style classification based on deep learning and by applying a color consistency metric to improve the fit of recommended objects. Moreover, we propose to use the analysis of user’s room to improve the personalization and style match with existing real furniture.
Our algorithm for automated interior design operates in the hierarchical space of procedural rules. The hierarchy of rules reflects the hierarchy of objects’ spatial relationships in a given room. The variability of designs is achieved via multiple possible branches of execution in the hierarchical tree. We address the problem of sensible design generation by maintaining parent–child relationships in spatial and angular domains. These parent–child relationships are created between the objects generated by the pair of parent–child rules in our execution tree. The interior design guidelines, utilized by previous research [3,4], are in our case directly encoded into the placement rules which can be designed and maintained by interior designers.
The main goal of our research was to study various methods and techniques to find the most favorable ones for automated interior design at home. Therefore, we conducted three user studies to address different aspects of interior design assistance system: (1) visualization, (2) design preference, and (3) design sensibility. In the first aspect, we studied mobile visualization using AR and traditional on-screen visualization of furniture configurations. Our results suggest that AR visualization is the preferred method for displaying furniture configurations at home. In the second aspect, we focused on the user preference of interior designs generated by our method and optimization-based method [5]. We selected optimization-based method due to its capability of generating rich and diverse design configurations. Results diverged in this study and showed strong user preference for optimization-based method in one scene and similar preference for both methods in another scene. Finally, the third studied aspect was design sensibility (i.e., the rate of producing sensible furniture layouts). In this third study, we measured the probability of generating a sensible design for each of the compared algorithms. Our algorithm achieved four times higher probability of generating sensible design than the compared optimization-based method. The findings from our studies can be used as guidelines for future research and development of AR for interior design.
The main contributions of this paper can be summarized as follows.
  • Novel algorithm for automatic interior design based on hierarchical tree of procedural rules.
  • A system for interactive interior design in AR.
  • Personalized objects selection utilizing recommender service.
  • User studies addressing various aspects of interior design assistance technology.
This paper is organized as follows. Section 2 discusses the previous work in the areas of automated furniture arrangement and AR interior design. Section 3 presents our algorithms for automated interior design, personalized recommendation, and room analysis. The application of these algorithms into AR scenario is then described in Section 4. We conducted the study which investigates the usability of AR technology for interior design. This study is described in Section 5. Additionally, we evaluated our system in terms of user preference and sensibility of generated designs in a user study and an expert study. The results of this evaluation can be found in Section 6 and Section 7. Section 8 discusses the main findings of our research and Section 9 concludes the paper.

2. Related Work

Existing state-of-the-art methods for automatic interior design can be broadly categorized into three groups: procedural design methods, optimization-based methods, and data-driven approaches.

2.1. Procedural Design Methods

Procedural approaches create scenes incrementally by applying a set of predefined design rules. Usually these approaches are fast and interactive. However, sometimes the complexity of the placement rules, or the required user interaction, necessitates an offline generation. Xu et al. [6] define proximity, physical, and semantic rules to create large complex scenes. Akazawa et al. [7] apply the contact constraint—each object has to touch another object—in addition to no-overlapping and group placement rules. Germer and Schwarz [8] represent objects as agents, such that each agent searches for a parent object, then orients and aligns itself with respect to it. This method is capable of creating large 3D indoor scenes by generating only the rooms in the vicinity of the navigating user. In the method of Chojnaki [9], scenes are generated through a series of adding and merging nodes, improved with low-cost operations (shift and wall magnetism). Then, the proposed scenes are evaluated with a scoring function. Tutenel et al. [10] place one object at a time using a solver based on placement rules.
Our method also utilizes procedural generation of objects while our rules are organized in a hierarchical tree which mimics the hierarchy in spatial arrangement of objects. This tree can be easily modified by artists. Moreover, we utilize recommender service and automatic room analysis to provide a user with automated and personalized selection of furniture items for a design.

2.2. Optimization Methods

The furniture of a scene can be arranged by minimizing a cost function which is based on ergonomics, aesthetics, or other terms. To overcome the high computational complexity of the problem, some methods use samplers to generate candidate layouts [3,11] and others use genetic algorithms [4,12,13]. Akase and Okada [12] minimize the cost using evolutionary computation, where each generation is evaluated by the user, until the user is satisfied. The approach of Sanchez et al. [13] also uses a genetic algorithm to solve a system of complex set of constraints. The genetic algorithm, used in the method of Kán and Kaufmann [4], optimizes a cost function that mimics the principles used in professional interior design practice. Yu et al. [14] optimize the cost function by simulated annealing using a Metropolis-Hastings state search step. Merrell et al. [3] present an interactive design system in which the user moves furniture pieces and the system suggests different layouts based on these movements. The suggestions are sampled by a Markov chain Monte Carlo sampler from a density function defined on a set of design guidelines, constrained by the user movements. A Markov chain Monte Carlo sampler is also used by Yeh et al. [11] to generate layouts from spaces with varying dimensionality. In their method, the number of objects does not need to be set in advance. The disadvantage of optimization based methods is their high computational cost. Moreover, these methods can finish in a local minimum of cost function and therefore cannot guarantee the sensibility of design.

2.3. Data Driven Methods

Instead of hard-coded rules or constraints, a group of algorithms learn from pre-designed scenes. Fisher et al. [15] train a probabilistic model on a set of user designed scenes to synthesize new arrangements of clusters of objects. Guerrero et al. [16] convert the example scenes into feature vectors, encoding geometric relationships between objects, to train their model. Zhao et al. [17] introduce the space coverage feature to encode the geometry of the open space around objects. Recent approaches model user activities (how users alter the scenes). For instance, Fisher et al. [18] extend their previous approach [15] to model activity, resulting in fewer relations and higher level semantics. Furthermore, Ma et al. [19] progressively generate scenes through a series of insert and relocate operations, based on actions sampled from an action graph. Fu et al. proposed an algorithm for scene synthesis based on activity-associated object relation graphs [20]. Their method uses labeled human positions and directions in the dataset of floor plans to detect the activity relations between objects. It requires room shape and user-specified object categories as the input. An interior scene synthesis method based on deep learning was presented by Wang et al. [21]. The authors used deep convolutional network to predict spatial probability distribution for each type of object from the top-down view of the room. Deep learning was also utilized for indoor scene generation by Li et al. [22] who used variational recursive autoencoders and by Ritchie et al. [23] who used deep convolutional generative models.

2.4. Interior Design in AR

Automatic interior design in augmented reality has also been studied in previous research where virtual furniture is inserted in real rooms, mixed with real furniture. Tang et al. [1] detect the supporting planes in the room using a depth camera, to help the user realize how an inserted virtual object fits in the real environment. They also propose an optimization based solution to arrange furniture objects on these planes. Gal et al. [24] present a framework for generating object layouts in AR that considers scene consistency (between components and the real room) along with self-consistency (between components), in order to map the virtual elements into the real environment. The SnapToReality techniques of Nuernberger et al. [25] align virtual objects to the real environment using extracted 3D edge and planar surface constraints. Techniques for automatic placement of 3D models in AR with relation to real objects were presented by Breen et al. [26]. Finally, several other methods focused on interior design in AR with manual composition of furniture into the real room [2,27,28]. In contrast to previous research, our proposed system enables fast and reliable generation of interior design into AR scene to speed up the process of room furnishing.

3. Automatic Interior Design

Explaining our system from the user perspective, it can be seen as a mobile AR application where a user is guided through a process of selecting multiple images to collect input data such as style/object/color preference and choosing room type. A user then enters the AR camera screen where she scans the room and adds the room edges with the help of the underlying AR framework (Section 4). Then, the first interior design is automatically generated and it appears in AR view of the user. User can modify this design according to her needs by moving/exchanging the furniture or by requesting a completely new design. From the system perspective, apart from the collection of the manual user preference data, we collect the room data asynchronously in form of images and we send it to our room analysis service (Section 3.3). The schematic diagram of our system can be seen in Figure 1.
The core of our system for automatic interior design is based on a hierarchical execution of procedural rules for object positioning (Section 3.1). To achieve variability of generated designs the execution tree has multiple paths to leaves (i.e., there may exist multiple children rules for a given rule and they can be either executed concurrently or individually). Our algorithm for furniture arrangement is further described in Section 3.1. Additionally, the personalized selection of furniture objects is achieved by using the recommender service. We also use room analysis based on deep learning to identify existing style and colors of the room. This information, together with the user design preferences, is utilized in the recommender service to suggest furniture items individually for different users. The automated furniture generation is running on a server while the AR visualization is utilized in a client application. We deploy the server part on Amazon servers to achieve high scalability in relation to the number of users.

3.1. Hierarchical Tree of Procedural Rules

Our algorithm for automated furniture layout calculates the spatial relations of objects by executing the procedural rules in a hierarchical order. These rules are stored in a database and can be easily extended or altered by designers to achieve new furniture configurations. The properties of our placement rules are depicted in Table 1.
At the beginning of design generation, the system selects all rules with no parent which belong to the given room. One or more of these rules are executed by selecting and positioning furniture in the room. The selection of the furniture is done by request to our recommender service. The positioning is then done according to the positioning properties of the selected rule (Table 1). After execution of specific rule, the algorithm finds children rules of this rule and continues in the execution tree until it reaches its leaves. During the furniture positioning we create spatial relationships between parent and children objects (i.e., the objects generated by parent rule and children rules). The example of our hierarchical procedural tree can be seen in Figure 2.

Concurrency and Avoidance Groups

In order to preserve a high degree of freedom for interior designers, we propose a strategy for executing multiple rules concurrently or for avoiding concurrent execution. This strategy uses the concept of concurrency and avoidance groups. These are the groups which can group the rules for concurrent execution or for avoidance of concurrent execution. There can be numerous concurrency and avoidance groups created in our system to achieve concurrent execution on different levels of the tree. Concurrent execution in our method is driven by three main principles: The first principle of this strategy is that if multiple rules on the same level in the tree (and with the same parent) are not in concurrency group they cannot be executed together. The second principle is that if multiple rules are in the same concurrency group, they can be executed together (e.g., the plant on the one side of drawer and a coffee table on the other side) unless they are in the same avoidance group. The third principle of this strategy is using avoidance groups to avoid the concurrent execution of rules even if they are in the same concurrency group. The reason of adding this third principle is to avoid excessive generation of concurrency groups. To explain this more in detail we consider an example of a bed in a bedroom. This bed can have night tables, carpet, cabinet, and other objects as its children. To generalize, we consider a bed having n concurrent rules as its children. Now, we add a rule for positioning a sofa near the bed. This sofa however cannot coexist with the night tables because it is taking the same place as one of them would take. However, the sofa can coexist with all other children. Using solely concurrency groups such a relation would require adding new concurrency group with n objects. Therefore, adding m new objects which cannot coexist with single other object would require to create n m new relations. This case is depicted in Figure 2.
To address this problem of exponentially growing relations of objects, we introduce the concept of avoidance groups. An avoidance group contains objects which are already in a concurrency group but cannot coexist with each other. Nevertheless, they can coexist with all other objects from concurrency groups. Now, the cost of adding a new object which cannot coexist with another object from concurrency group is only constant. With the concept of avoidance groups we can easily create new rules placing furniture on the same place as others without the excessive growing of the number of concurrency groups.

3.2. Personalized Recommender

The problem of diverging furniture styles and personalization for specific user in a design is addressed via a recommender service. Every time a new furniture piece is required for placement by hierarchical procedural rules, the recommender service is called. This service is selecting furniture objects according to the style of already positioned items, preference of the users, and the overall style of a user’s room (Section 3.3).
The style-related matching of furniture items is based on two main principles: (1) style category and (2) color palette. We used eight categories of styles, and we developed a deep learning-based classifier to identify these categories from images of products or rooms. More details about style classification are provided in Section 3.3. Multiple categories can be assigned to each furniture piece. Categories are then used as a filter during selection of additional objects. Only the objects which belong to one of the target categories can be recommended. For this purpose 3D objects in our database have manually labeled categories. For color consistency a color palette is extracted from the image by the methods proposed in previous research [4,29,30]. We use palettes consisting of three colors each. The colors are represented in CIELab color space. As a result, a color palette can be described by a vector of nine real numbers.
In order to prioritize the matching colors of furniture objects, the recommender calculates score for each available object which passed the style and category filter. The score s is calculated based on Euclidean distance between palette of main object p m in a room and a palette of a new candidate object p n :
s = e ( | p m p n | )
Additionally, scores are normalized by dividing by the sum of all scores for selected products. Finally, the products are recommended stochastically with a probability proportional to the normalized scores of products.
Our recommender service also takes into account personal preferences of users, which are initially registered through an on-boarding wizard screen full of room design pictures tagged with a style name. In this wizard screen, a user can select all those room designs which he/she likes. These data are then stored in a database where they can be later accessed by the recommender service and then used as a filter for potential products similarly to the furniture cross-style filtering for matching with other objects. The styles data for the wizard screen were annotated by interior designers.

3.3. Room Analysis

In addition to personalized recommendation and consistent styles of objects in a design, we aimed at matching the new generated design with existing furniture and colors in a target room. For this purpose, our application collects images of the target room at start time of a design session and streams them to a server where they are analyzed by our room analyzer service. The result of this analysis is then included in the final recommendation by concatenating user-preferred styles from wizard with classified styles from room analyzer. The room analysis is done asynchronously so the user has a seamless experience. The core of the room analysis service is composed of three modules: (1) a deep learning style classifier to recognize style of existing room design, (2) a color palette extractor implemented by k-means clustering, and (3) an object instance segmentation by deep learning model.
For the style classifier, we put in practice the concept of transfer learning [31] to retrain three start-of-the-art deep learning image classifiers on a dataset of 19771 manually tagged images of room designs. Specifically, we considered the following network architectures: VGGNET-16 [32], ResNet-50 [33], and Inception-V3 [34], the latter being superior not only in terms of accuracy, with 5.6% top-5 error in ImageNet Large Scale Visual Recognition Challenge (ILSVRC) 2012 [35] and about 1.7% top-5 error in our dataset, but also in performance [36]. Classifiers were trained to recognize eight distinct interior design styles: Contemporary, eclectic, glam, industrial, mid-century, minimalist, Scandinavian, and transitional.
To achieve object instance segmentation, we leveraged region-based convolutional network with object mask prediction (MASK-RCNN) [37], pretrained on dataset of common objects in context (COCO) [38]. We utilized transfer learning to extend the model detection capabilities with additional decoration items like curtains, lamps, carpets, pillows, and picture frames. In total, 2300 new images were manually tagged and added to the COCO dataset.
The location of known objects in the scene can be used to combine existing furniture objects with new design pieces. In combination with device tracking, new objects can be correctly registered in 3D and seamlessly visualized in AR. In order to address the complex issue of combining existing real furniture objects with new virtual design pieces mentioned previously, we have limited this functionality to be only enabled if the underlying ARKit framework was able to detect horizontal planes. We then match these planes with the detected object types in 2D space. These data can then serve to position new generated virtual objects in relation to the existing real furniture (e.g., a virtual vase on top of a real table).

4. Augmented Reality

Our system provides a user with an augmented reality visualization which allows one to explore the generated furniture design directly in the target room with live scale. We use ARKit tracking to track the pose of a mobile device in real space. The system first detects the ground plane and the user then indicates the position of the main wall in space. Potentially, the user can also indicate the depth of the room (3rd dimension) by marking the opposite corner of the room in AR view. We only used rectangular rooms in our experiments. After the furniture configuration is generated by the server (Figure 1), the 3D models are positioned in 3D space based on this generated configuration. The 3D models are downloaded on-demand from the server.
In addition to AR, our system also allows non-AR visualization on the screen of mobile device. In this case the furniture is positioned in 3D template room. We conducted a user study which compares the user preferences between AR and non-AR visualization of interior design (Section 5).
Our AR application runs on mobile devices which support ARKit framework. We used iPhone 6S during our experiments and user studies. The server part of our system is deployed on Amazon servers. In this configuration, the average duration of interior design generation is 3.87 s.

5. User Study of AR Visualization

Research and development of augmented reality in interior design can strongly benefit from knowledge of user perception in this field. Therefore, we conducted a user study to investigate if users prefer augmented reality for visualization of furniture compositions during interactive furnishing or not. We compared the user preferences between AR visualization and non-AR visualization. The non-AR visualization used 3D template room on the screen of mobile device to show the generated interior designs. In this template room (non-AR condition), a generated interior design was rendered from camera position fixed at human height, looking at the main wall. Users could not interact with the camera view but they could move furniture objects or request generation of new design, similarly as in the AR visualization. The main hypotheses in this study were the following.
H1: 
Augmented reality visualization is more preferred for interactive furnishing than non-AR visualization.
H2: 
Augmented reality is judged by the users as more useful than non-AR visualization.

5.1. Design and Methods

A within-group design was used to compare user preferences and usability between our two conditions: AR visualization and non-AR visualization (Figure 3). The order of visualization modes was alternated between the subsequent users. Users experimented with both visualizations, and we used two quantitative metrics to evaluate their perception:
  • In the first metric, we used a subjective, two-alternative, forced-choice preference approach similar to the work in [39]. The users were asked which of the two visualization modes (AR/non-AR) would they prefer for interactive furnishing of their home. The answers to this question were analyzed by Chi-square nonparametric analysis in order to investigate the hypothesis H1.
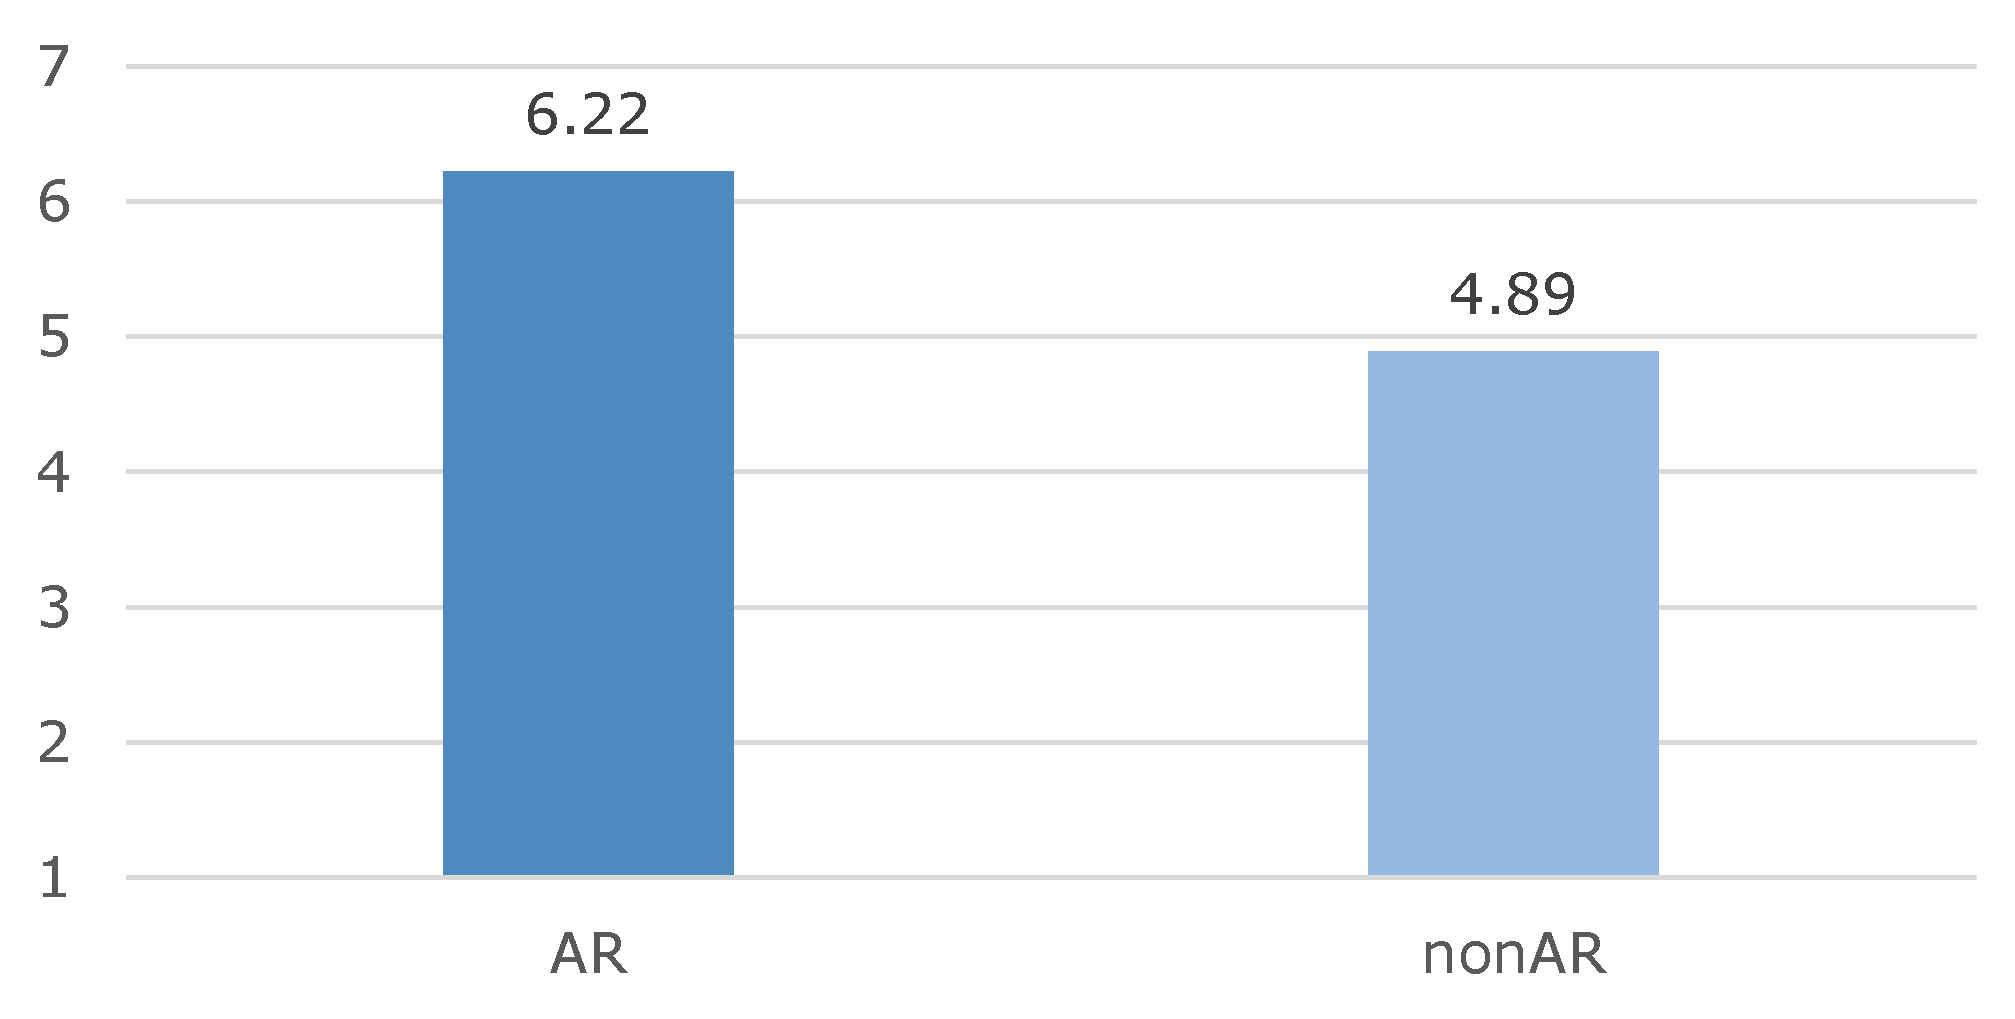
  • In second metric, the users were asked to rate the usefulness of each visualization for interior design at home on a scale from 1 to 7, where 1 means that visualization is not useful at all and 7 means that it is very useful for interior design. These answers were later analyzed by Wilcoxon signed-rank test. This subjectively reported usefulness was used to study the hypothesis H2.
Each of the visualizations was used to interactively furnish two rooms by the user: living room and bedroom. The experiment was conducted on two places: The first one was empty laboratory where new furniture was positioned in AR as into a new yet unfurnished room. The second place was a single room in a house with already existing furniture. In this case the AR visualization superimposed 3D furniture models over the real furniture. At the end of the study, we included an open question for qualitative analysis. In this question, we asked users to explain the choice of their preference of visualization mode. The user from our user study, using AR visualization, can be seen in Figure 4.

5.2. Procedure

The experiment was conducted in the form of interactive try-out of both studied visualization modes by each participant. At the beginning, each participant was informed about the study and the procedure. Each user was asked to fill in the consent form and demography questionnaire. The participant then used our interior design system on a mobile phone to furnish both rooms (living room and bedroom) with the first visualization mode. The users could interact with the application as long as needed to explore the visualization mode and its potential for furnishing. After the first condition, the user was asked to answer the usability question. Then, the second visualization mode was tried by the participant to again furnish both target rooms. When finished, the user again answered the usability question about the second visualization mode. Finally, the user was asked to select the preferred visualization mode for interactive furnishing and to explain this preference in an open question.

5.3. Results

Eighteen users participated in our study (12 females and 6 males in the age from 23 to 60 years, M = 36.1, SD = 11.1). Nine participants finished the study in the empty laboratory and 9 in the furnished room of the house. None of the participants had professional experiences in interior design.
In our first metric, forced-choice preference, we used Chi-square analysis to assess statistical significance. The frequencies of user preferences between two visualization modes and the results of Chi-square analysis are shown in Figure 5. Chi-square analysis indicates significance of user preferences towards AR. This result supports our hypothesis H1.
Additionally, we investigated if the preference frequencies vary in relation to gender and to the location of the study (furnished or unfurnished room). In gender-related analysis, we can see that AR was preferred by 100% of males and by 75% of females. For both genders Chi-square analysis indicates statistical significance of the AR preference. In room-related analysis, the AR condition was preferred by 89% participants from laboratory and by 78% participants from furnished home. In both cases, the result was statistically significant towards AR preference.
The result of our second metric, the paired comparison of usefulness ratings, indicates that AR visualization is considered more useful by the users than nonAR visualization. Wilcoxon test indicates statistical significance of this result (Z = −2.57, p = 0.01). Mean values of usefulness ratings are shown in Figure 6. This result supports our hypothesis H2.
In addition to investigation of our research hypotheses, we aimed at qualitative analysis of user preferences to discover new findings in relation to perception of AR interior design. For this purpose, we asked users to explain their preference of visualization mode in an open question. To analyze the answers to this question, we collected the main codes from responses in an open coding [40] and we calculated the frequency of occurrence for each of them. This frequency corresponds to the number of users who mentioned the code in their answers. The codes in our analysis represents the preference reasons of users. The results of the qualitative analysis can be seen in Table 2. The preference reasons are ordered from the most frequent one to the least frequent one. Note that the last two reasons in Table 2 are negative about AR. All other comments are positive towards AR interior design.

6. Design Preference Study

6.1. Design and Methods

In order to assess the quality of interior designs generated by our algorithm, we compared them to the results of recent optimization-based method for automated interior design [5] in a second user study. This user study was conducted online via web questionnaire. The questionnaire contained four questions, each comparing two images of interior designs (Figure 7). One of these two interior images was generated by our method, and the other one by the compared optimization-based method (only sensible results of generation were used). Fifty-four furniture objects were used by both algorithms to furnish the target rooms. The order of images was randomized. Two of the comparisons were done for a living room scene and the other two for a bedroom scene. We used subjective, two-alternative, forced-choice preference approach to measure the preference frequencies between two compared methods. The users were asked to select their preference of interior design among the two presented images for each question. The preference answers were used to study the following hypothesis.
H3: 
The resulting interior designs of our algorithm, based on hierarchical procedural rules, are more preferred by users than the interior designs generated by the compared optimization-based method.

6.2. Results

Fifty-two users, in age from 19 to 54 years (M = 34.0, SD = 8.7), participated in our preference study (25 males, 27 females). We used Chi-square nonparametric analysis to assess the statistical significance from frequencies of user preferences. The Chi-square analysis in one-dimension was used for each room separately. Each room contained 104 preference answers, thus the frequencies of preferences were compared to an expected 52/52 result. The Chi-square values were computed and tested for significance. The results of this analysis and measured frequencies of user preferences are shown in Figure 8. For the living room scene, our method achieved higher preference than the optimization-based method. Chi-square analysis suggest that this difference of preferences is not statistically significant. In the bedroom scene, the optimization-based method significantly outperformed our method in terms of user preferences. The possible reasons of this diversity between rooms and possible sources of bias are discussed in Section 8. As our method achieved slightly higher preference for one of the two scenes we may consider it capable of achieving similar quality of interior design than compared method for some types of scenes. However, our hypothesis H3 was not supported by the results.
We also investigated the differences of preference frequencies between male and female participants. This investigation draws interesting findings about gender-dependent differences of design preferences. The results (Figure 9) suggest that males have stronger preferences towards the results of optimization-based method. Chi-square analysis reports statistical significance of the design preference of males (p < 0.001). On the other hand, the responses of females show only very minor difference of preference frequencies between two compared methods (p = 0.56).

7. Design Sensibility Study

7.1. Design and Methods

In our third study, we investigated the capability of our furniture arrangement algorithm to generate sensible furniture layouts. We also compared the sensibility results with the optimization-based method [5]. While an algorithm can generate very good design in one of several runs, it might not guarantee the generation of sensible design in all subsequent executions. Our third study was focused exactly on the capability of an algorithm to always generate a good design (i.e., the probability of a generated design being sensible). This investigation was done via expert study. In order to assess the capability of generating sensible layouts we used each algorithm to generate 30 designs in a row for two target rooms. Having two algorithms and two rooms therefore leads to the total number of 120 images which represent the results from subsequent design generations of both algorithms. These 120 images were then showed to the group of five professional interior designers. Each designer had a task to assess the sensibility of furniture layout in each image. We can judge the furniture layout as sensible if it is functional and appropriate for activities in this room. Interior designers had a binary option (yes/no) of answer to judge if each layout was sensible or not. After the design assessment by professionals, we counted the number of layouts marked as sensible for each algorithm across all designers. Then, we divided this number by the total number of judgments (designers * number of images per algorithm). The resulting number indicates the probability of generating a sensible furniture layout (Figure 10).

7.2. Results

The results in Figure 10 suggest that our algorithm outperforms the compared algorithm by having a fourfold greater sensibility score. On average, our algorithm achieved 76% chance of generating a sensible layout while the compared algorithm achieved only 19.7%.
While the results of compared optimization algorithm was rated better in the user preference study, our algorithm outperformed the optimization in terms of probability of generating a sensible result. The resulting designs in the user preference study contained only selected sensible layouts generated by both algorithms. On the other hand, the design sensibility study was investigating the capability of each algorithm to generate sensible design on each execution. As our method achieved higher probability of generating sensible design, it is more suitable for real-time design generation for the user than the compared optimization approach.

8. Discussion

The results of our AR visualization study support our hypotheses H1 and H2 that AR visualization is more preferred by users and more useful for interactive interior design task. There were minor differences between preferences of males and females and between furnished and unfurnished rooms. However, in all cases AR was preferred significantly higher than non-AR. Additionally, our qualitative analysis revealed important reasons for user preference of specific visualization for interactive room furnishing (Table 2). This analysis suggests that AR is preferred because it offers broader possibilities for imagination, real walking, perception of space, and direct visualization in the target room. Additionally, an interesting observation from open question was that several users would like to use both visualizations: First, furnish the room in non-AR and then try this design in AR in their own apartment. According to the users, the most valuable benefit of AR visualization was the help with imagination of specific design in their room in terms of dimensional and aesthetic fit.
The second user study, comparing user preferences of our algorithm (procedural) and optimization-based algorithm, showed very diverse results for two room types. In the living room, our method achieved higher preference, while in the bedroom optimization-based algorithm achieved significantly higher preference. We hypothesize that this diversity of results may be caused by configuration of algorithms by distinct set of rules/capabilities. For example, the optimization-based method was able to position multiple cabinets in the bedroom, while the rule for cabinet placement was missing in the rule set of our algorithm. During configuration, we tried to develop as similar conditions as possible for both algorithms for comparison; however, some minor differences could bias the study. Nevertheless, as our algorithm succeeded in one of the two tested rooms we can consider it comparable to the optimization-based method for certain types of rooms. Additionally, we plan to conduct future user studies to deeper investigate the capabilities of both methods and their combination. Finally, we observed interesting gender-related differences in the answers of preference study. As indicated in Figure 9, males have significant preference towards the results of optimization-based method while females liked both methods with very similar frequency. This gender-related difference of design preference is an important finding which can support future research in this direction. In summary, the results of our user preference study suggest that both compared methods are preferred in certain types of scenes while interior design preference also depends on the gender of a user and type of a designed room.
The results of our expert study about furniture layout sensibility suggest that procedural methods can generate sensible designs with higher rate than optimization-based methods. Our method achieved the probability of generating a sensible layout 76%, while the compared algorithm achieved only 19.7%. This result indicates that our method is suitable for interactive furniture design in home environment.

Limitations

Despite the high reliability of our method, indicated in the expert study, procedural furniture arrangement has several limitations. One of them is the limited adaptability of procedural methods to various and non-standard room shapes. In case of special room shapes and dimensions, optimization-based methods can better utilize the space in these rooms. On the other hand, our method suits better for the most common cases of standard rectangular rooms. Additionally, optimization-based methods typically achieve higher diversity of all possible generated designs for a given room. Our method is constrained by the predefined generative rules. Nevertheless, this constraint also makes it more reliable.

9. Conclusions

In this paper, we have presented a novel system for interior design in augmented reality. A new algorithm for automated furniture arrangement based on hierarchical tree of procedural rules was presented and integrated into our interior design system. The combination of automatic interior design suggestions together with AR visualization provides a powerful tool for aiding home furnishing. Additionally, our system provides personalized design recommendations of furniture in the generated interior design. The results of our evaluation suggest that our algorithm for furniture arrangement achieves comparable results to the optimization-based method in user preferences for certain types of a room and it outperforms the compared method in terms of probability of sensible layout generation. Finally, we investigated the preferences of AR utilization for interior design in a user study. The results of this study provide useful guidelines for future research and development of augmented reality for interior design.

Author Contributions

Conceptualization, P.K. and A.K.; methodology, P.K., A.K., M.R. and J.M.L.R.; software, P.K., A.K., M.R. and J.M.L.R.; investigation, P.K.; writing—original draft preparation, P.K., A.K., M.R. and J.M.L.R.; project administration, A.K. All authors have read and agreed to the published version of the manuscript.

Funding

This work was supported in part by a national innovation grant FFG-Basisprogramm, number 24085828. The publication was funded by Open Access Funding by TU Wien.

Institutional Review Board Statement

The presented research was conducted according to the code of ethics of TU Wien.

Informed Consent Statement

Informed consent was obtained from all subjects involved in the AR visualization study.

Data Availability Statement

Data of our study is available upon request.

Acknowledgments

We thank Rhina Portillo, Matthias Urschler, and Michela Massignan for their help with organization of the studies and recruiting professional designers. We are also grateful to Charles Dietz for the development of recommender service and to Michael Horvath for providing support with development and deployment of the application. We thank Hannes Kaufmann for providing us with lab spaces for conducting the user study.

Conflicts of Interest

The authors declare no conflict of interest.

References

  1. Tang, J.; Lau, W.; Chan, K.; To, K. AR Interior Designer: Automatic Furniture Arrangement using Spatial and Functional Relationships. In Proceedings of the International Conference on Virtual Systems & Multimedia (VSMM), Hong Kong, China, 9–12 December 2014; pp. 345–352. [Google Scholar]
  2. Lee, C.; Kang, J.; Wünsche, B.; Amor, R. MyInterior: AR Supporting Interior Design. In Proceedings of the CIB W78 2013, Beijing, China, 19–12 October 2013; pp. 1–10. [Google Scholar]
  3. Merrell, P.; Schkufza, E.; Li, Z.; Agrawala, M.; Koltun, V. Interactive Furniture Layout Using Interior Design Guidelines. ACM Trans. Graph. 2011, 30, 87:1–87:10. [Google Scholar] [CrossRef]
  4. Kán, P.; Kaufmann, H. Automated Interior Design Using a Genetic Algorithm. In Proceedings of the VRST 2017, Gothenburg, Sweden, 8–10 November 2017; pp. 1–10. [Google Scholar]
  5. Kán, P.; Kaufmann, H. Automatic Furniture Arrangement Using Greedy Cost Minimization. In Proceedings of the IEEE Conference on Virtual Reality and 3D User Interfaces (IEEE VR), Reutlingen, Germany, 18–22 March 2018; pp. 491–498. [Google Scholar]
  6. Xu, K.; Stewart, A.J.; Fiume, E. Constraint-Based Automatic Placement for Scene Composition. Graph. Interfaces 2002, 2, 25–34. [Google Scholar]
  7. Akazawa, Y.; Okada, Y.; Niijima, K. Automatic 3D scene generation based on contact constraints. In Proceedings of the 3IA 2005 International Conference on Computer Graphics and Artificial Intelligence, Limoges, France, 11–12 May 2005; pp. 593–598. [Google Scholar]
  8. Germer, T.; Schwarz, M. Procedural Arrangement of Furniture for Real-Time Walkthroughs. Comp. Graph. Forum 2009, 28, 2068–2078. [Google Scholar] [CrossRef]
  9. Chojnacki, S. Scoring Functions for Automatic Arrangement of Business Interiors. In SIGGRAPH Asia 2012 Technical Briefs (SA ’12); ACM: New York, NY, USA, 2012; pp. 27:1–27:4. [Google Scholar]
  10. Tutenel, T.; Bidarra, R.; Smelik, R.M.; Kraker, K.J.d. Rule-based layout solving and its application to procedural interior generation. In Proceedings of the CASA’09 Workshop on 3D Advanced Media in Gaming and Simulation, Amsterdam, The Netherlands, 16 June 2009; pp. 15–24. [Google Scholar]
  11. Yeh, Y.T.; Yang, L.; Watson, M.; Goodman, N.D.; Hanrahan, P. Synthesizing Open Worlds with Constraints Using Locally Annealed Reversible Jump MCMC. ACM Trans. Graph. 2012, 31, 56:1–56:11. [Google Scholar] [CrossRef]
  12. Akase, R.; Okada, Y. Automatic 3D Furniture Layout Based on Interactive Evolutionary Computation. In Proceedings of the 2013 Seventh International Conference on Complex, Intelligent, and Software Intensive Systems, Taichung, Taiwan, 3–5 July 2013; pp. 726–731. [Google Scholar]
  13. Sanchez, S.; Le Roux, O.; Luga, H.; Gaildrat, V. Constraint-Based 3D-Object Layout using a Genetic Algorithm. In Proceedings of the 3IA 2003 International Conference on Computer Graphics and Artificial Intelligence, Limoges, France, 14–15 May 2003. [Google Scholar]
  14. Yu, L.F.; Yeung, S.K.; Tang, C.K.; Terzopoulos, D.; Chan, T.F.; Osher, S.J. Make It Home: Automatic Optimization of Furniture Arrangement. ACM Trans. Graph. 2011, 30, 86:1–86:12. [Google Scholar] [CrossRef]
  15. Fisher, M.; Ritchie, D.; Savva, M.; Funkhouser, T.; Hanrahan, P. Example-based Synthesis of 3D Object Arrangements. ACM Trans. Graph. 2012, 31, 135:1–135:11. [Google Scholar] [CrossRef]
  16. Guerrero, P.; Jeschke, S.; Wimmer, M.; Wonka, P. Learning Shape Placements by Example. ACM Trans. Graph. 2015, 34, 1–13. [Google Scholar] [CrossRef] [Green Version]
  17. Zhao, X.; Hu, R.; Guerrero, P.; Mitra, N.; Komura, T. Relationship Templates for Creating Scene Variations. ACM Trans. Graph. 2016, 35, 207:1–207:13. [Google Scholar] [CrossRef] [Green Version]
  18. Fisher, M.; Savva, M.; Li, Y.; Hanrahan, P.; Nießner, M. Activity-centric Scene Synthesis for Functional 3D Scene Modeling. ACM Trans. Graph. 2015, 34, 179:1–179:13. [Google Scholar] [CrossRef]
  19. Ma, R.; Li, H.; Zou, C.; Liao, Z.; Tong, X.; Zhang, H. Action-driven 3D Indoor Scene Evolution. ACM Trans. Graph. 2016, 35, 1–13. [Google Scholar] [CrossRef]
  20. Fu, Q.; Chen, X.; Wang, X.; Wen, S.; Zhou, B.; Fu, H. Adaptive Synthesis of Indoor Scenes via Activity-Associated Object Relation Graphs. ACM Trans. Graph. 2017, 36. [Google Scholar] [CrossRef]
  21. Wang, K.; Savva, M.; Chang, A.X.; Ritchie, D. Deep Convolutional Priors for Indoor Scene Synthesis. ACM Trans. Graph. 2018, 37. [Google Scholar] [CrossRef]
  22. Li, M.; Patil, A.G.; Xu, K.; Chaudhuri, S.; Khan, O.; Shamir, A.; Tu, C.; Chen, B.; Cohen-Or, D.; Zhang, H. GRAINS: Generative Recursive Autoencoders for INdoor Scenes. ACM Trans. Graph. 2019, 38. [Google Scholar] [CrossRef]
  23. Ritchie, D.; Wang, K.; Lin, Y. Fast and Flexible Indoor Scene Synthesis via Deep Convolutional Generative Models. In Proceedings of the 2019 IEEE/CVF Conference on Computer Vision and Pattern Recognition (CVPR), Long Beach, CA, USA, 15–21 June 2019; pp. 6175–6183. [Google Scholar] [CrossRef] [Green Version]
  24. Gal, R.; Shapira, L.; Ofek, E.; Kohli, P. FLARE: Fast layout for augmented reality applications. In Proceedings of the 2014 IEEE International Symposium on Mixed and Augmented Reality (ISMAR), Munich, Germany, 10–12 September 2014; pp. 207–212. [Google Scholar]
  25. Nuernberger, B.; Ofek, E.; Benko, H.; Wilson, A.D. SnapToReality: Aligning Augmented Reality to the Real World. In Proceedings of the 2016 CHI Conference on Human Factors in Computing Systems, San Jose, CA, USA, 7–12 May 2016; pp. 1233–1244. [Google Scholar]
  26. Breen, D.E.; Whitaker, R.T.; Rose, E.; Tuceryan, M. Interactive Occlusion and Automatic Object Placement for Augmented Reality. Comput. Graph. Forum 1996, 15, 11–22. [Google Scholar] [CrossRef]
  27. Siltanen, S.; Woodward, C. Augmented Interiors with Digital Camera Images. In Proceedings of the 7th Australasian User Interface Conference (AUIC ’06), Hobart, Australia, 16–19 January 2006; Volume 50, pp. 33–36. [Google Scholar]
  28. Phan, V.T.; Choo, S.Y. Interior Design in Augmented Reality Environment. Int. J. Comput. Appl. 2010, 5, 16–21. [Google Scholar] [CrossRef]
  29. O’Donovan, P.; Agarwala, A.; Hertzmann, A. Color Compatibility from Large Datasets. In ACM SIGGRAPH 2011 Papers; ACM: New York, NY, USA, 2011; pp. 63:1–63:12. [Google Scholar]
  30. Chen, K.; Xu, K.; Yu, Y.; Wang, T.Y.; Hu, S.M. Magic Decorator: Automatic Material Suggestion for Indoor Digital Scenes. ACM Trans. Graph. 2015, 34, 232:1–232:11. [Google Scholar] [CrossRef]
  31. Pratt, L.Y.; Mostow, J.; Kamm, C.A. Direct transfer of learned information among neural networks. In Proceedings of the Ninth National Conference on Artificial Intelligence (AAAI-91), Anaheim, CA, USA, 14–19 July 1991; pp. 584–589. [Google Scholar]
  32. Simonyan, K.; Zisserman, A. Very Deep Convolutional Networks for Large-Scale Image Recognition. arXiv 2014, arXiv:abs/1409.1556. [Google Scholar]
  33. He, K.; Zhang, X.; Ren, S.; Sun, J. Deep Residual Learning for Image Recognition. In Proceedings of the IEEE Conference on Computer Vision and Pattern Recognition (CVPR), Las Vegas, NV, USA, 27–30 June 2016; pp. 770–778. [Google Scholar]
  34. Szegedy, C.; Vanhoucke, V.; Ioffe, S.; Shlens, J.; Wojna, Z. Rethinking the Inception Architecture for Computer Vision. In Proceedings of the IEEE Conference on Computer Vision and Pattern Recognition (CVPR), Las Vegas, NV, USA, 27–30 June 2016; pp. 2818–2826. [Google Scholar]
  35. Russakovsky, O.; Deng, J.; Su, H.; Krause, J.; Satheesh, S.; Ma, S.; Huang, Z.; Karpathy, A.; Khosla, A.; Bernstein, M.S.; et al. ImageNet Large Scale Visual Recognition Challenge. Int. J. Comput. Vision 2015, 115, 211–252. [Google Scholar] [CrossRef] [Green Version]
  36. Canziani, A.; Paszke, A.; Culurciello, E. An Analysis of Deep Neural Network Models for Practical Applications. arXiv 2016, arXiv:abs/1605.07678. [Google Scholar]
  37. He, K.; Gkioxari, G.; Dollár, P.; Girshick, R.B. Mask R-CNN. In Proceedings of the IEEE International Conference on Computer Vision (ICCV), Honolulu, HI, USA, 21–26 July 2017; pp. 2961–2969. [Google Scholar]
  38. Lin, T.; Maire, M.; Belongie, S.J.; Bourdev, L.D.; Girshick, R.B.; Hays, J.; Perona, P.; Ramanan, D.; Dollár, P.; Zitnick, C.L. Microsoft COCO: Common Objects in Context. In Proceedings of the European Conference on Computer Vision(ECCV 2014), Zurich, Switzerland, 6–12 September 2014; pp. 740–755. [Google Scholar]
  39. Jimenez, J.; Sundstedt, V.; Gutierrez, D. Screen-space Perceptual Rendering of Human Skin. ACM Trans. Appl. Percept. 2009, 6, 1–15. [Google Scholar] [CrossRef]
  40. Corbin, J.; Strauss, A. Basics of Qualitative Research: Techniques and Procedures for Developing Grounded Theory; Sage Publications: Thousand Oaks, CA, USA, 2014. [Google Scholar]
Figure 1. Schematic diagram of our system for interior design in augmented reality (AR). The server generates interior design for the user with the help of the recommender and room analysis services. This design is then visualized in AR in the client application. We use the database of procedural rules for layout generation and database of furniture data for personalized recommendation. Pictures of real scene, captured by a mobile device, are analyzed in our room analysis service to identify styles and colors of the room and aid the recommendation. We utilized Representational State Transfer (REST) architecture to design the services of our system and communication between them.
Electronics 10 00245 g001
Figure 2. Hierarchical tree of procedural rules. The rules on the third level of the tree belong all to one concurrency group. However, the red rules cannot coexist together; therefore, they are also in an avoidance group. The red rules can still be executed concurrently with all green rules.
Electronics 10 00245 g002
Figure 3. Two visualization modes in our interior design system: (left) Augmented reality visualization and (right) non-AR visualization in template 3D room.
Electronics 10 00245 g003
Figure 4. (Left) Augmented reality visualization in our system for automated interior design. (Right) A user exploring an interior design space on a mobile device using AR. Markers on the floor were used only to provide additional features for ARKit tracking.
Electronics 10 00245 g004
Figure 5. Frequencies of user preferences for two compared visualization modes AR and non-AR. Right side shows the results of Chi-square analysis. The results indicate that the measured preference of AR is statistically significant.
Electronics 10 00245 g005
Figure 6. Mean values of usefulness of each visualization mode for interior design at home. Standard deviation is 0.97 for AR and 1.59 for non-AR visualization.
Electronics 10 00245 g006
Figure 7. Automatically generated interior designs from our design preference study. Left column shows designs generated by our method while right column shows designs generated by compared optimization approach [5]. Interior designs were generated for two room types: living room and bedroom. In addition to these images, the users in our study saw an additional image per each furnished room, rendered from the opposite corner. This second image was used to provide a user with better overview and spatial understanding of the generated layout. Here, the second image is omitted for clarity.
Electronics 10 00245 g007
Figure 8. Frequencies of user preferences in our study. All displayed conditions show the preferences among answers of 52 participants (104 answers per room). The results of the Chi-square analysis are indicated on the right side. Values in boldface indicate significant difference (level of significance = 0.05).
Electronics 10 00245 g008
Figure 9. Frequencies of user preferences categorized by gender.
Electronics 10 00245 g009
Figure 10. Results of our design sensibility study. The results indicate the probability of each algorithm to generate sensible furniture layout. Our algorithm achieves higher sensibility score in both rooms.
Electronics 10 00245 g010
Table 1. Properties of our procedural rules.
PropertyDescription
ParentRuleRule which is the parent of the current rule. This link to parent creates the hierarchy in the execution tree. If the rule has no parent its parent is the room itself.
CategoryCategory of objects which is positioned by current rule
RoomType of room in which the rule can be applied
CountNumber of objects to be positioned by current rule
PositionRelative position of object with respect to parent object. The possible values are: Front, back, side, left, right, top, bottom, ceiling, and random.
SideAlignmentThe alignment of placed object on the contact side of its parent. The possible values are Front, center, back, top, bottom, left, right, even (for multiple objects), and random.
DistanceDistance from the border of the current object to the border of the parent.
RotationRelative rotation with respect to parent object. Possible values are Front, back, alignToFront, and alignToBack.
WallSnapBoolean value which decides whether or not the object should be snapped to the wall along the object’s back vector.
AngularOffsetAdditional rotation to the perpendicular rotations given in the Rotation property
ProbabilityProbability of execution for the current rule
NoCollisionBoolean value which indicates if collision with other objects should be calculated and avoided.
Table 2. Qualitative analysis of user preferences. Codes were collected from users’ preference explanations (preference reasons). Frequency indicates the number of users who mentioned given code. The preference reasons are ordered according the frequency of occurrence.
CodePreference ReasonFrequency
ImaginationAR supports imagination6
Real walkingAR allows walking in a room6
Spatial awarenessAR supports perception of space5
Own apartmentAR allows to see furniture in my own apartment4
Real feelingAR provides real feeling3
Multiple visualizationsBoth visualizations are needed3
View anglesAR offers more view angles than non-AR2
More funAR is more fun1
Field of viewAR has limited field of view1
Usefulnessnon-AR was more useful1
Publisher’s Note: MDPI stays neutral with regard to jurisdictional claims in published maps and institutional affiliations.

