
An Alignment-Free Sensing Module for Noninvasive Radial Artery Blood Pressure Measurement


Abstract
:1. Introduction
2. Device Development
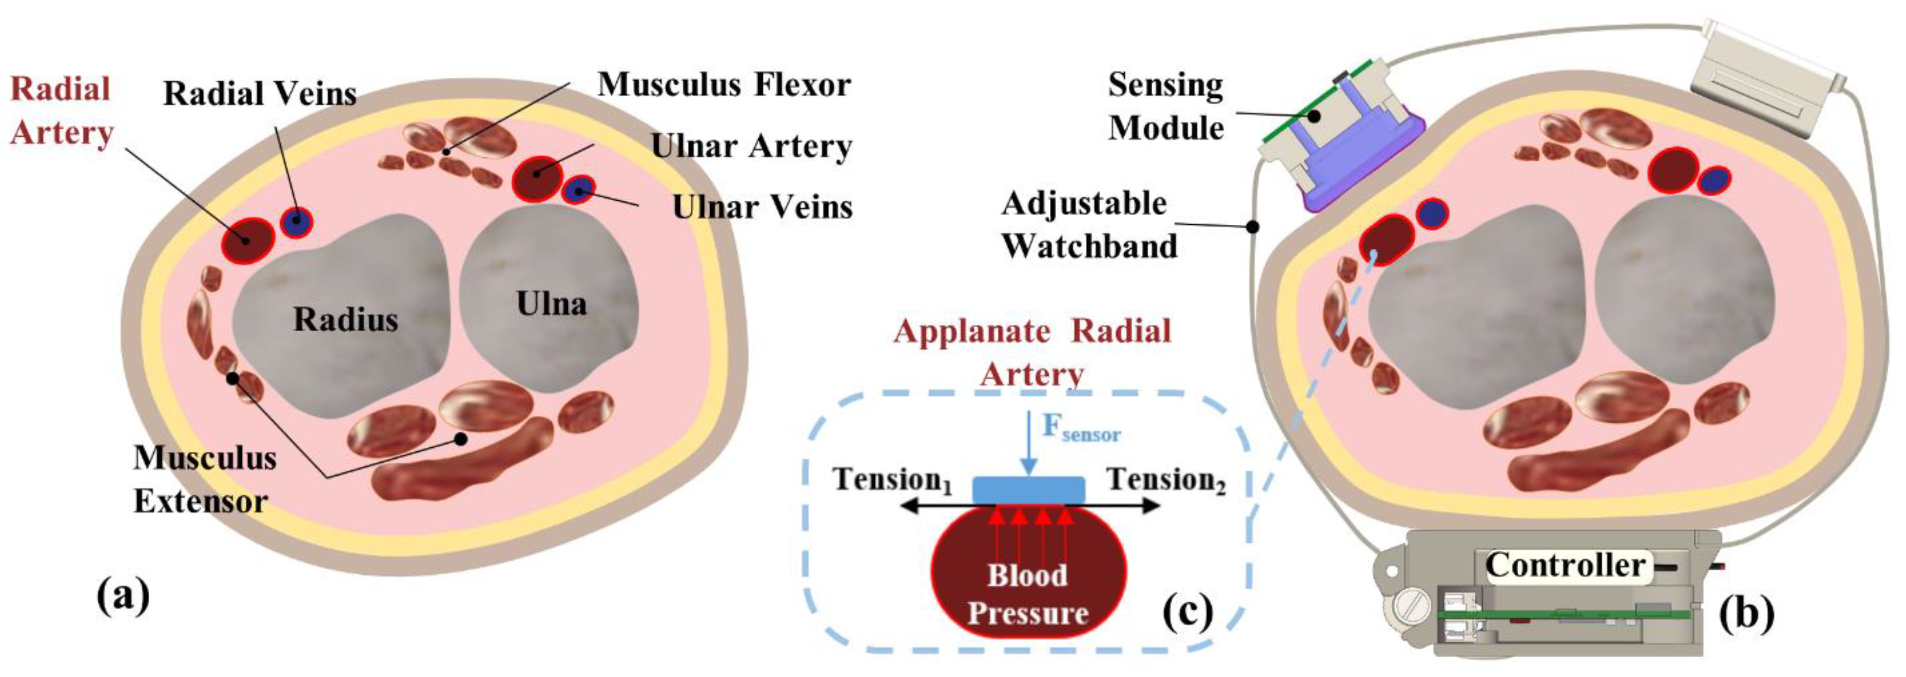
2.1. Theory
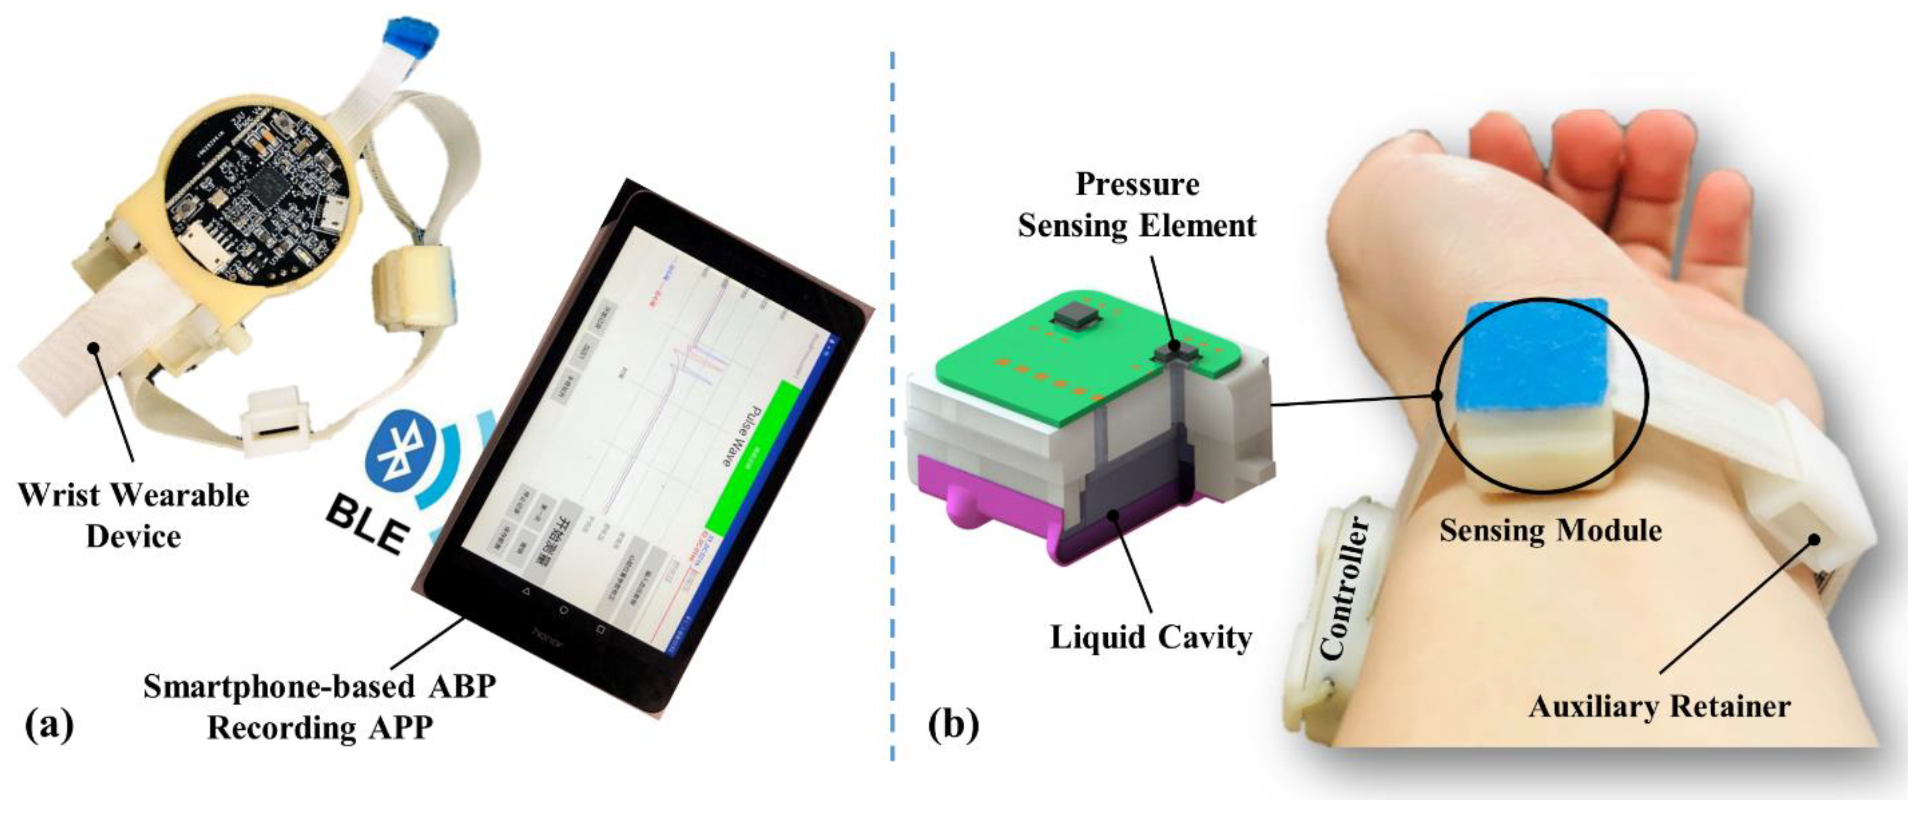
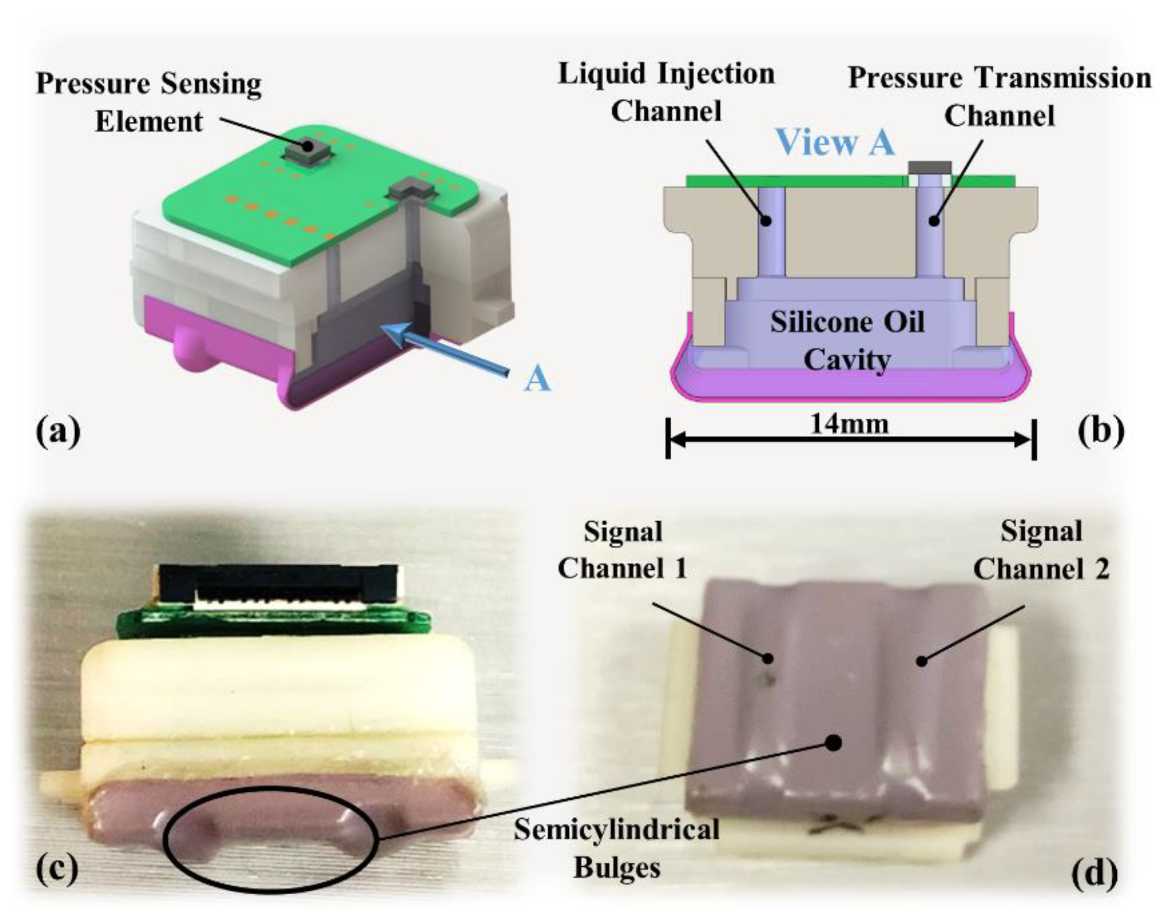
2.2. Sensing Module Design
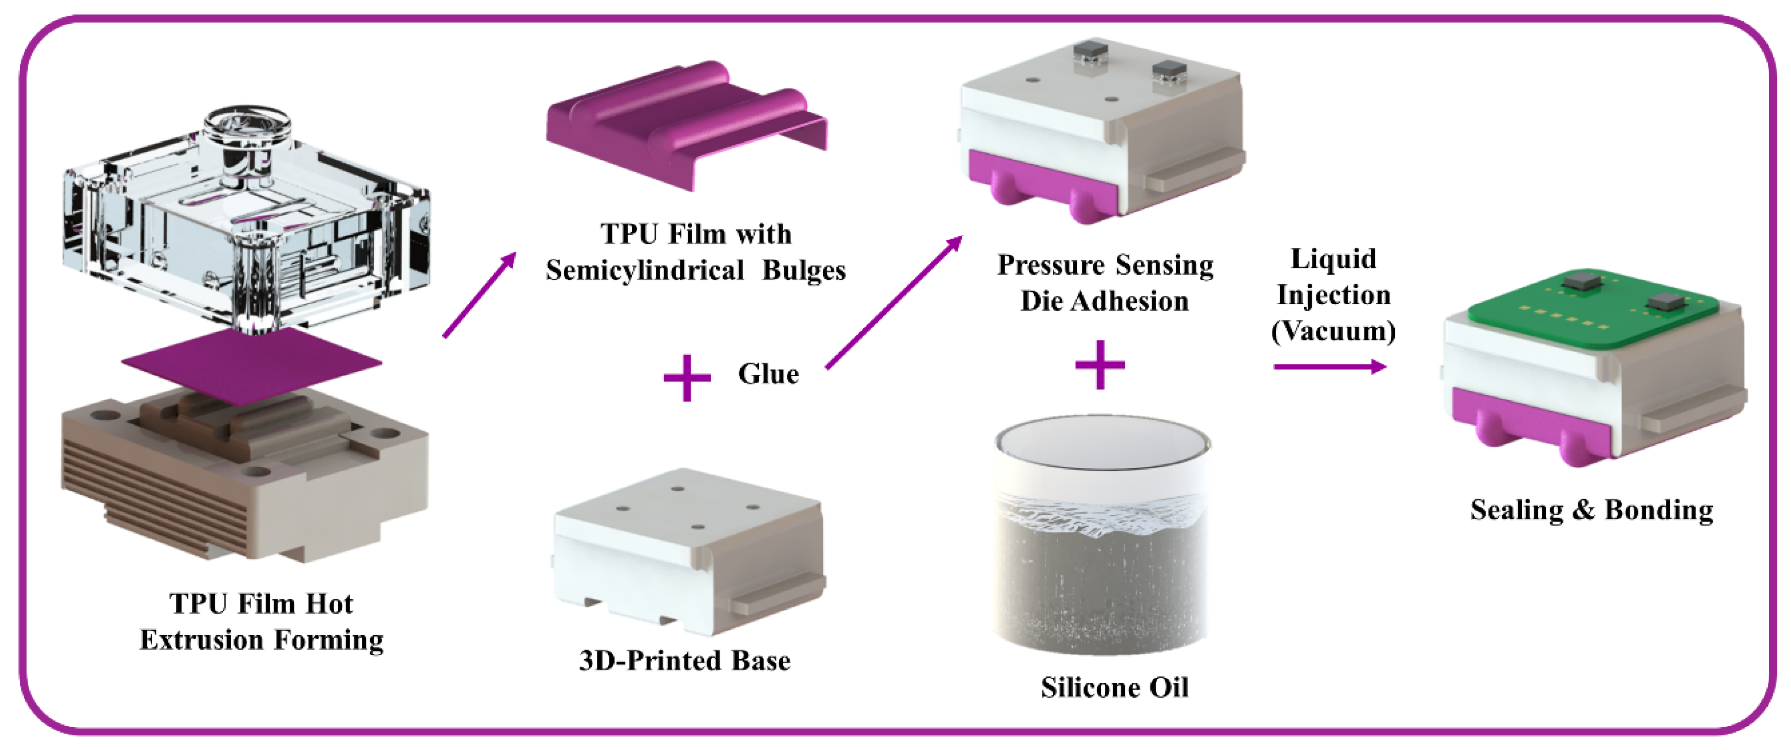
2.3. Fabrication
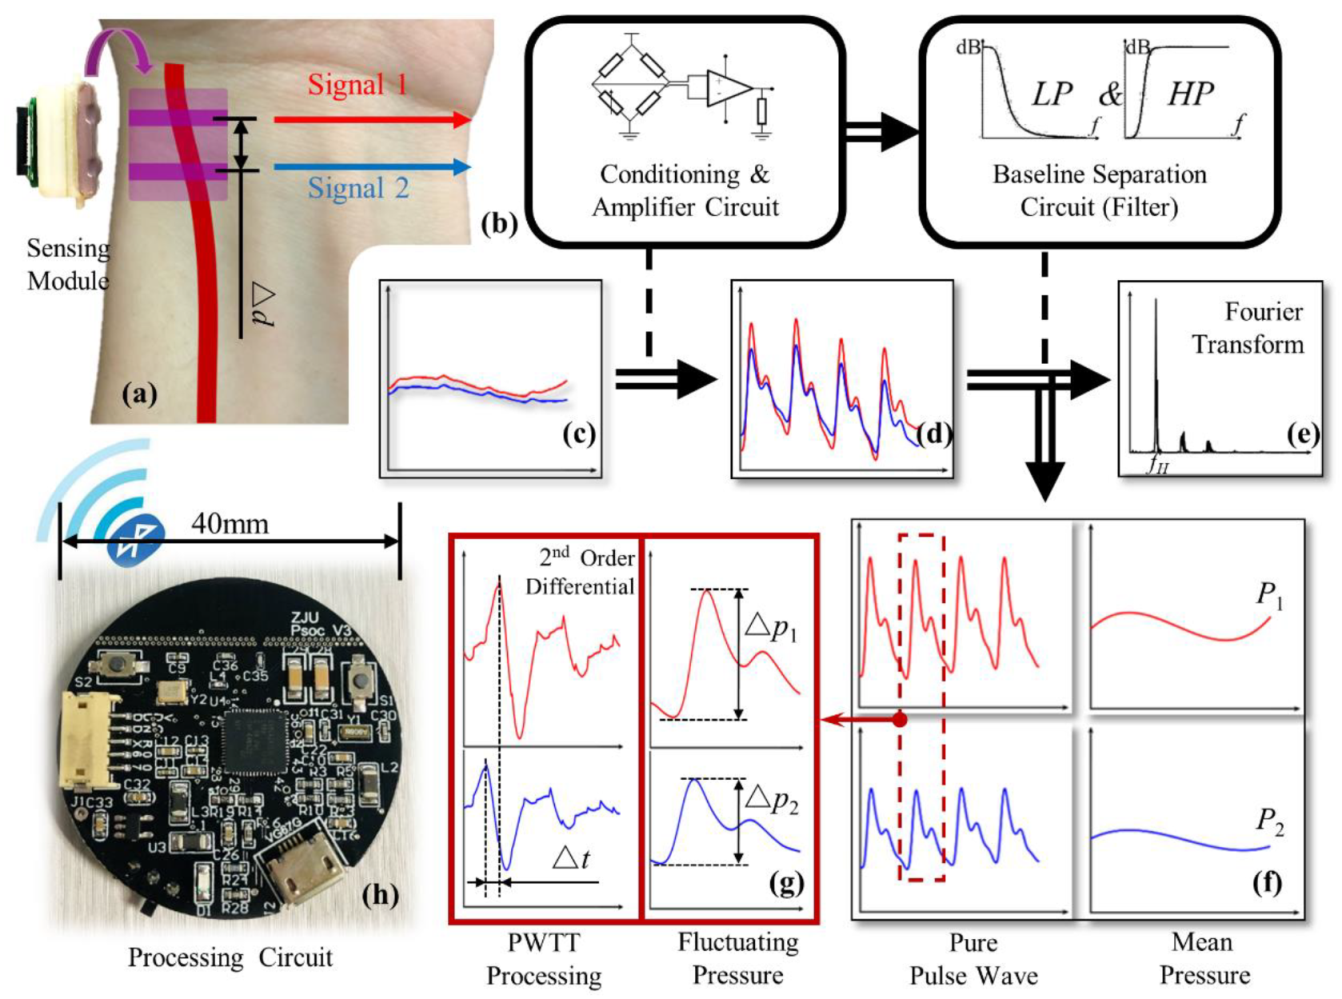
2.4. Signal Process
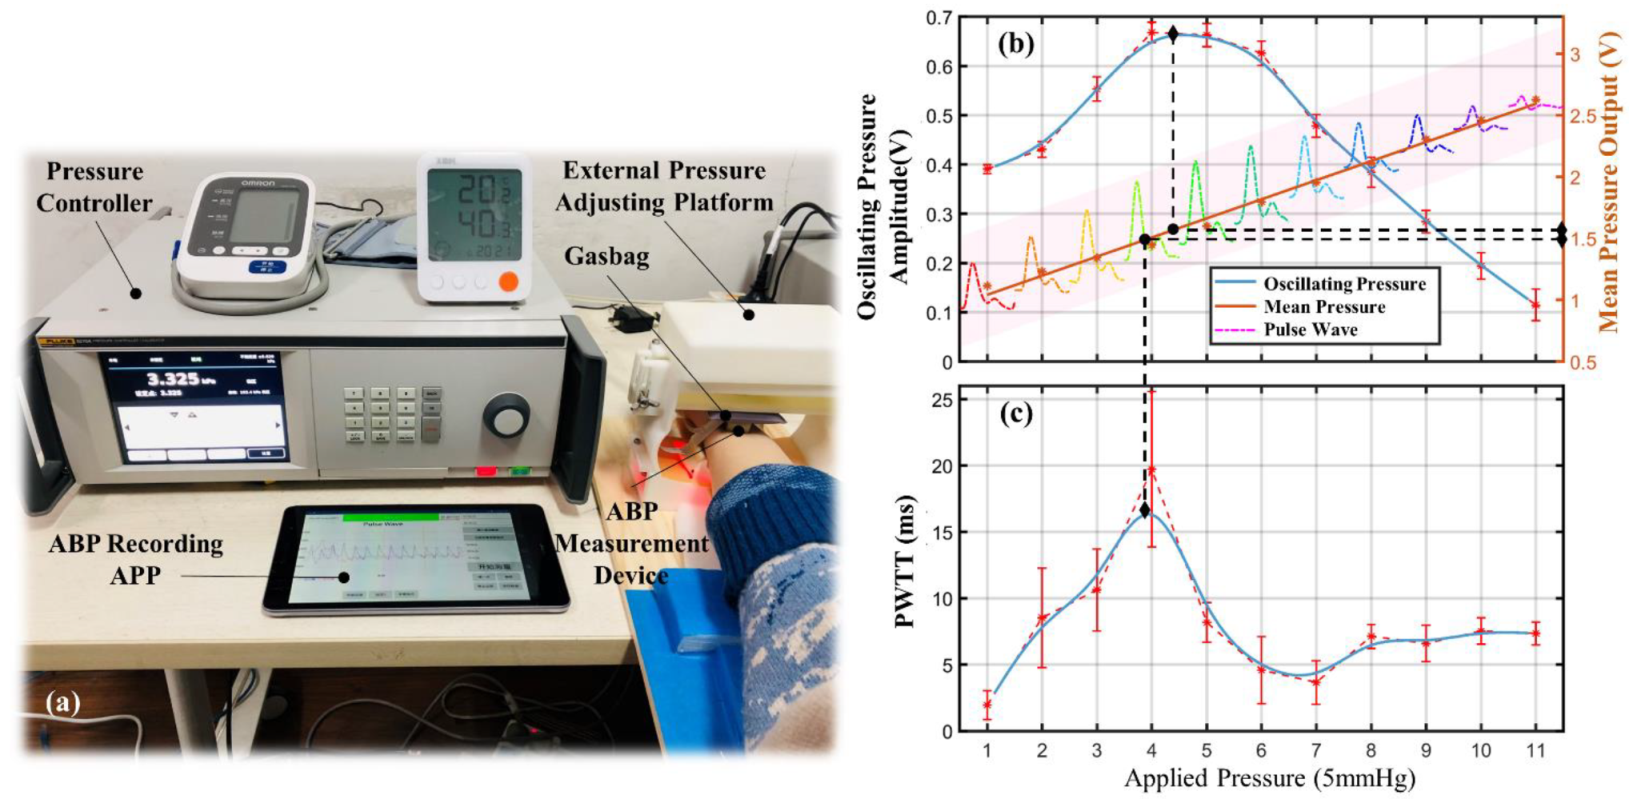
3. Experiment and Discussion
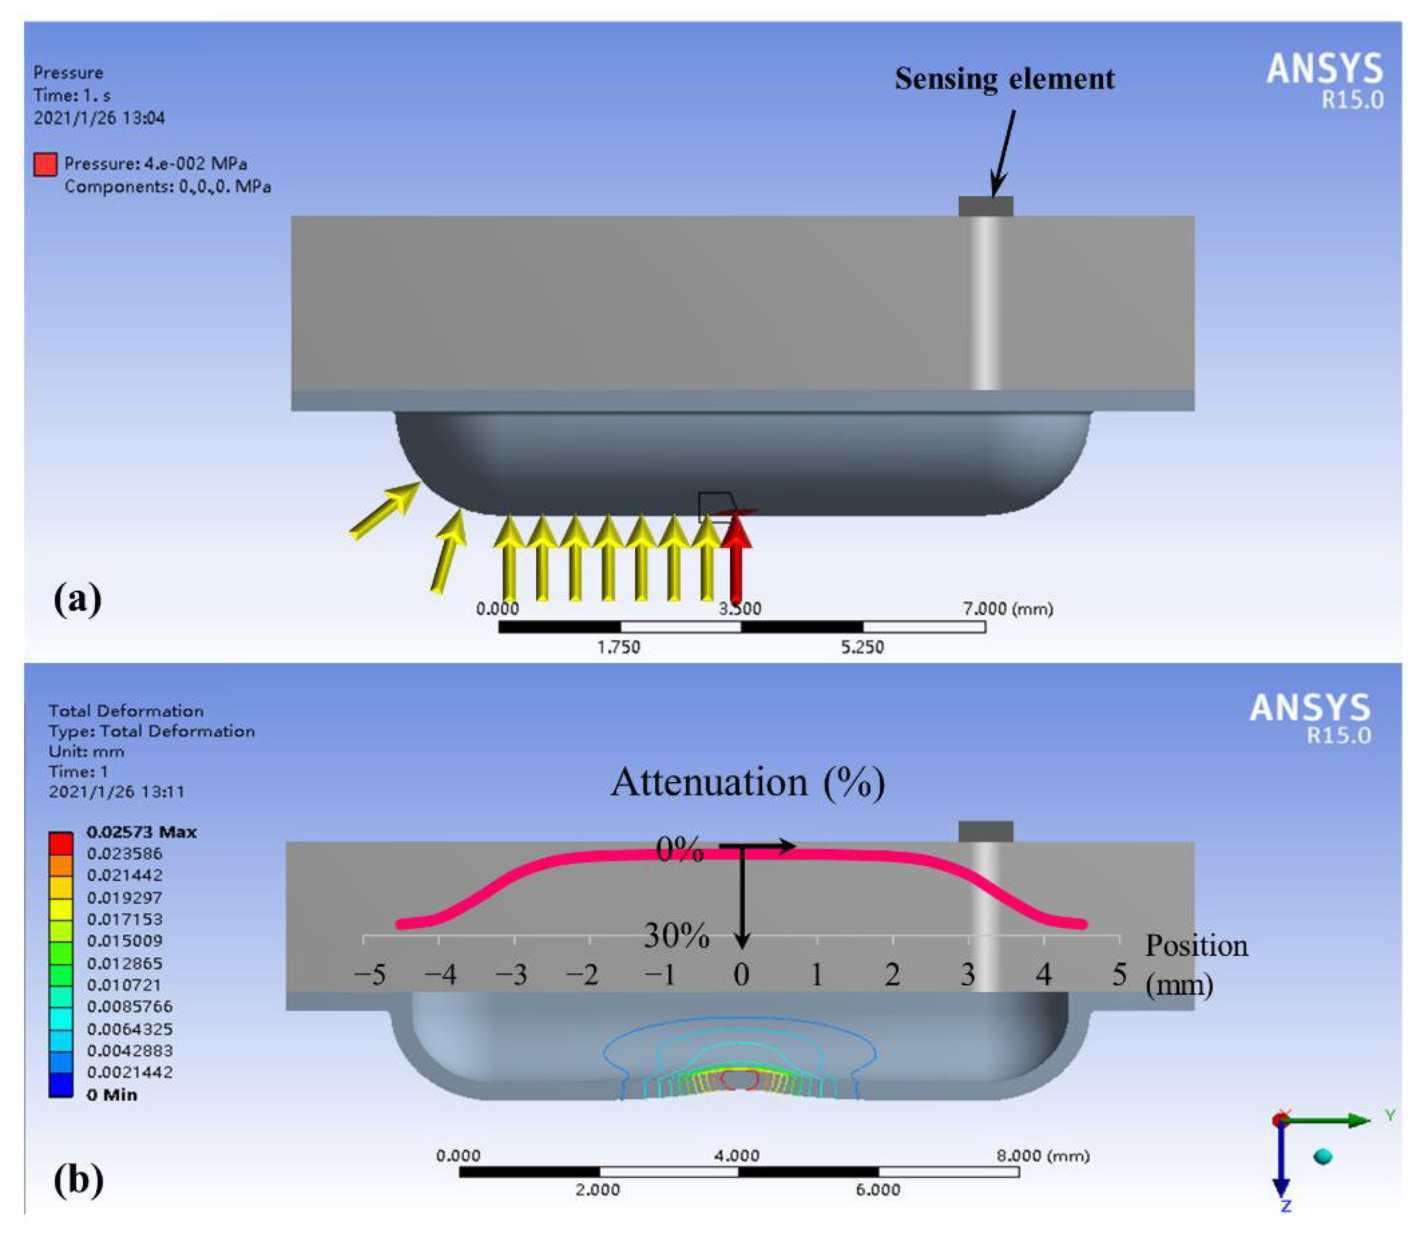
3.1. Simulation Results on Static Load
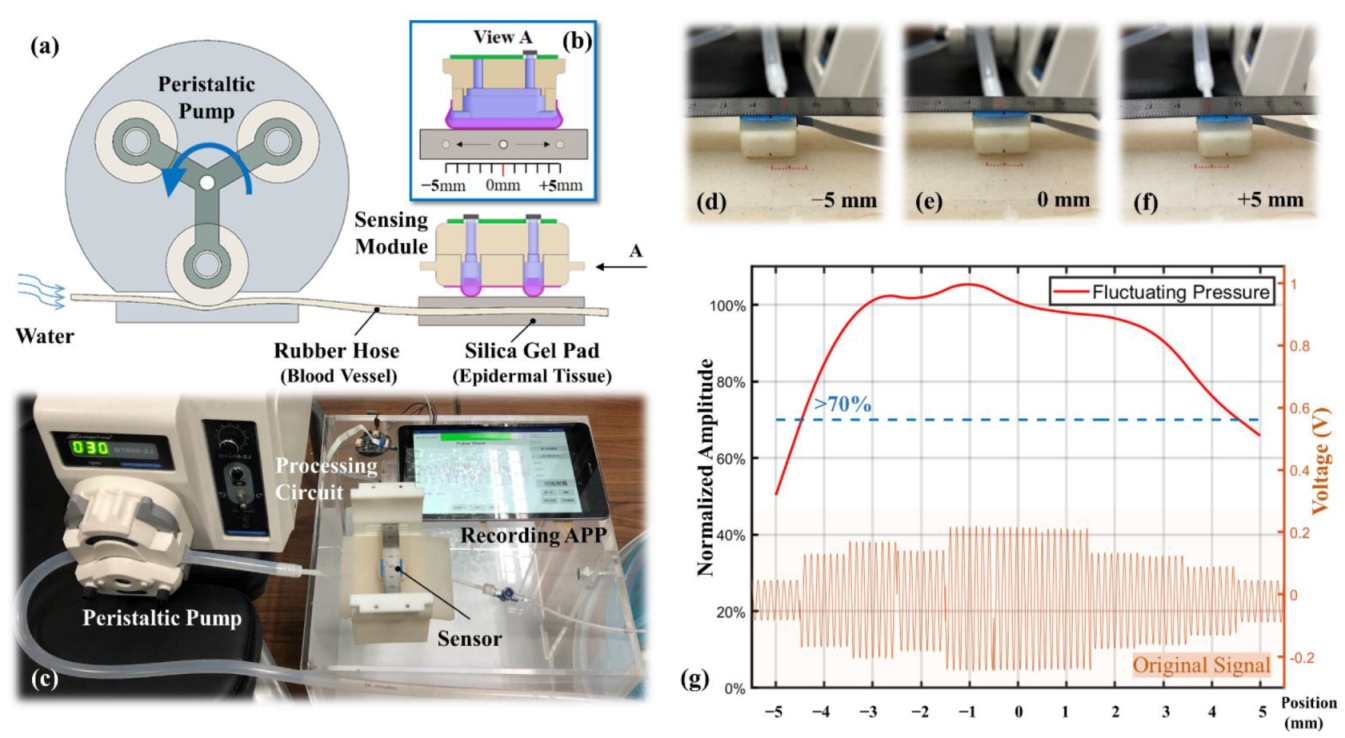
3.2. Location Robustness on Dynamic Stimulation
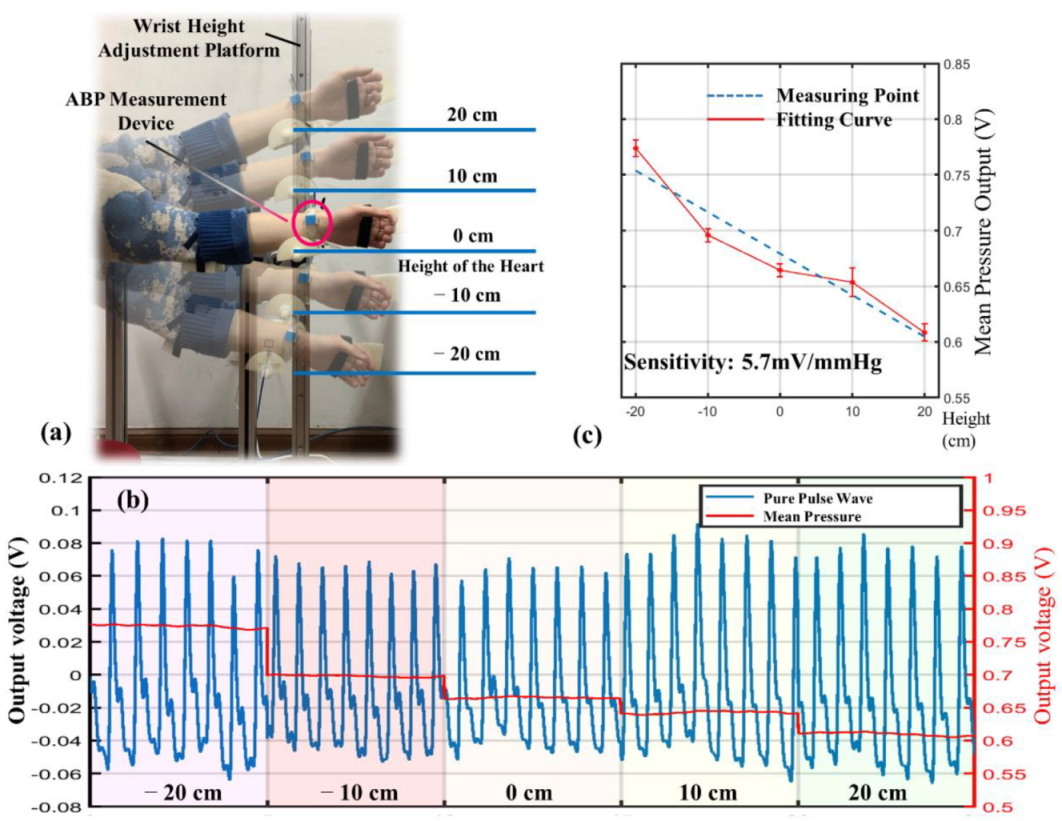
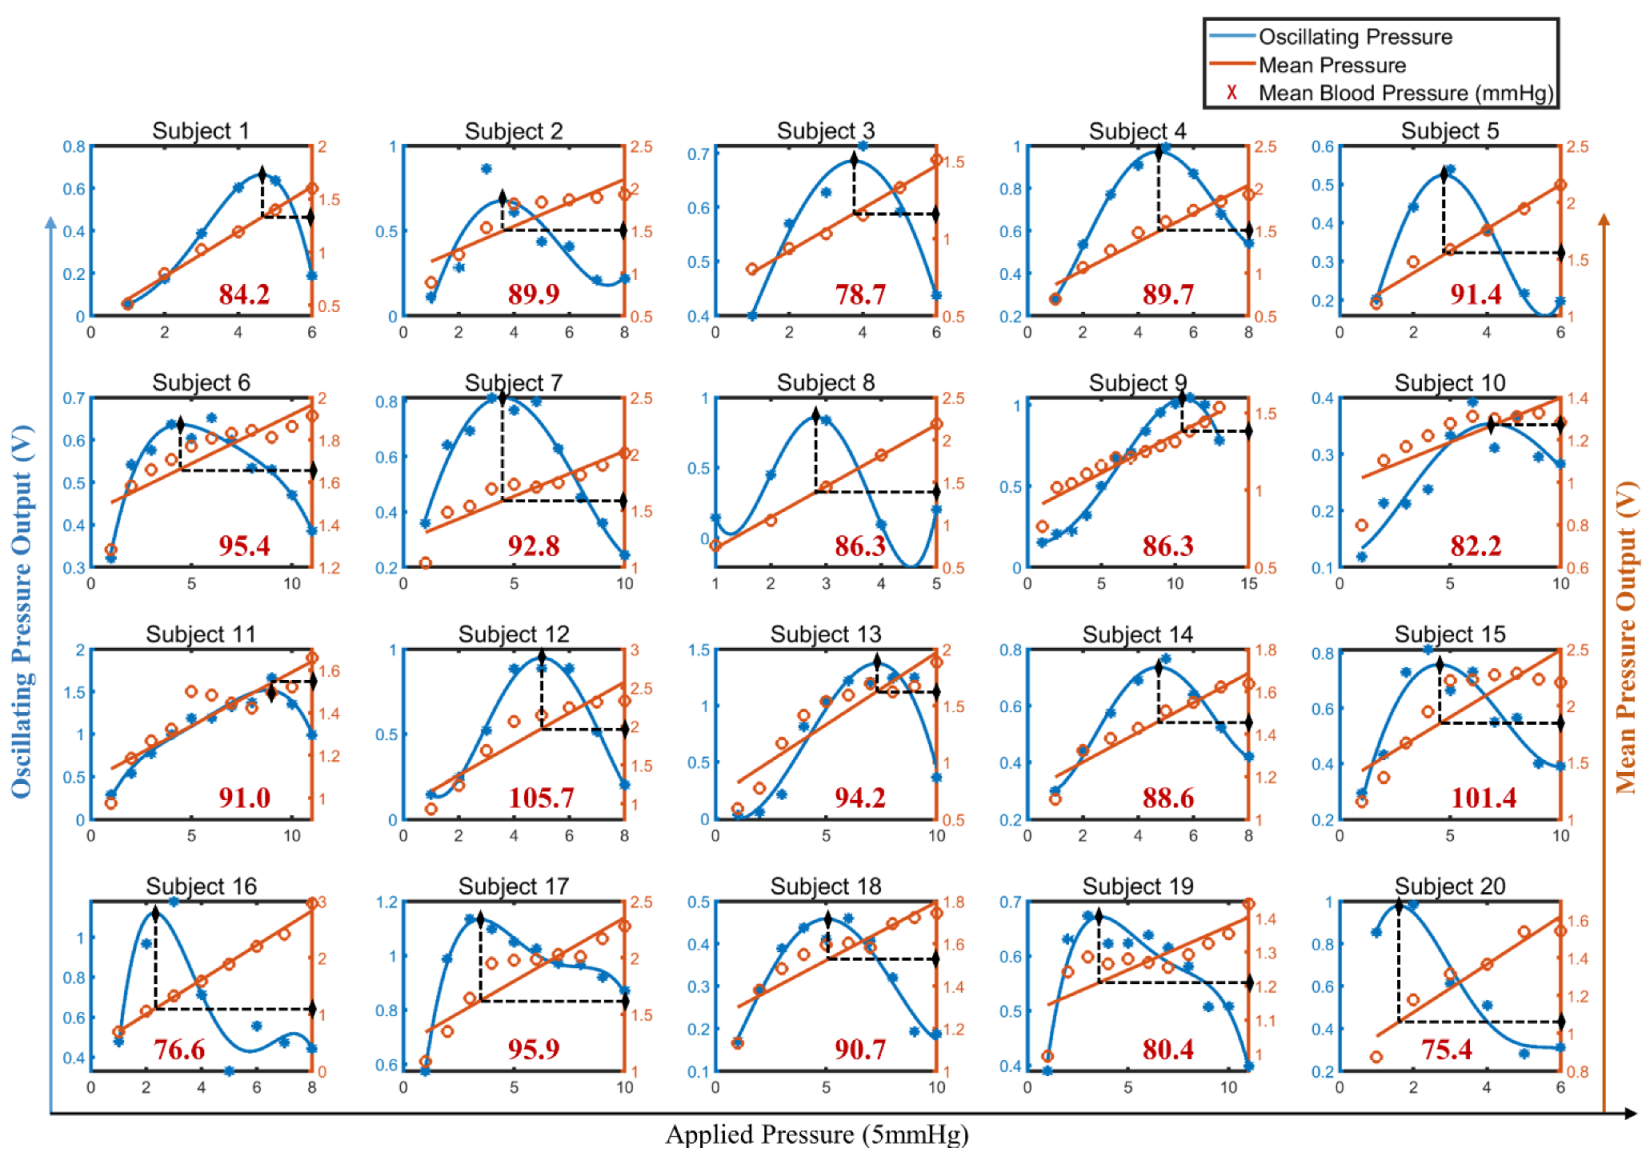
3.3. Individualized Calibration
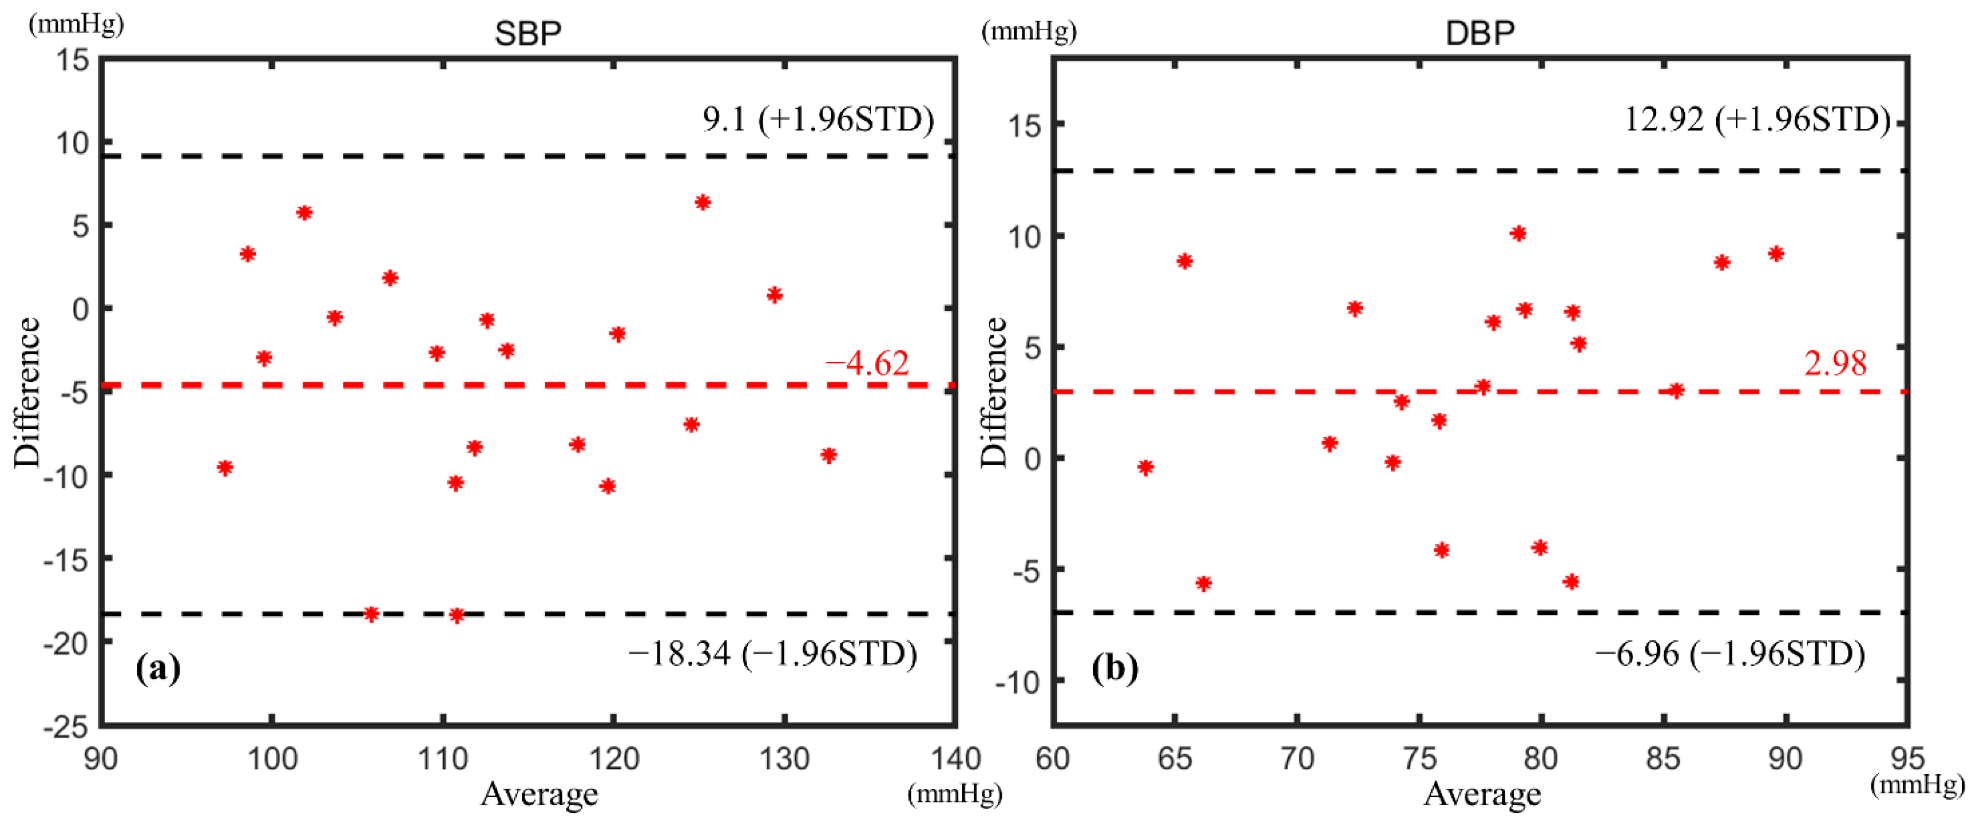
3.4. BP Calibration
4. Conclusions
Author Contributions
Funding
Institutional Review Board Statement
Informed Consent Statement
Acknowledgments
Conflicts of Interest
References
- Kannel, W.B.; Mcgee, D.L. Kannel WB and McGee DL. Diabetes and cardiovascular disease: The Framingham study. J. Am. Med. Assoc. 1979, 241, 2035–2038. [Google Scholar] [CrossRef]
- Ma, L.Y.; Chen, W.W.; Gao, R.L.; Liu, L.S.; Zhu, M.L.; Wang, Y.J.; Wu, Z.S.; Li, H.J.; Gu, D.F.; Yang, Y.J.; et al. China cardiovascular diseases report 2018: An updated summary. J. Geriatr. Cardiol. 2020, 17, 1–8. [Google Scholar] [CrossRef]
- Roth, G.A.; Mensah, G.A.; Johnson, C.O.; Addolorato, G.; Ammirati, E.; Baddour, L.M.; Barengo, N.C.; Beaton, A.Z.; Benjamin, E.J.; Benziger, C.P.; et al. Global Burden of Cardiovascular Diseases and Risk Factors, 1990–2019. J. Am. Coll. Cardiol. 2020, 25, 2982–3021. [Google Scholar] [CrossRef]
- de Menezes, S.T.; Giatti, L.; Brant, L.C.; Griep, R.H.; Schmidt, M.I.; Duncan, B.B.; Suemoto, C.K.; Ribeiro, A.L.; Barreto, S.M. Hypertension, Prehypertension, and Hypertension Control: Association With De-cline in Cognitive Performance in the ELSA-Brasil Cohort. Hypertension 2020, 77, 80. [Google Scholar] [CrossRef]
- Turner, J.R.; Viera, A.J.; Shimbo, D. Ambulatory Blood Pressure Monitoring in Clinical Practice: A Review. Am. J. Med. 2014, 128, 14–20. [Google Scholar] [CrossRef] [Green Version]
- Rastegar, S.; GholamHosseini, H.; Lowe, A. Non-invasive continuous blood pressure monitoring systems: Current and proposed technology issues and challenges. Phys. Eng. Sci. Med. 2019, 43, 11–28. [Google Scholar] [CrossRef]
- Singh, P.; Choudhury, M.I.; Roy, S.; Prasad, A. Computational Study to Investigate Effect of Tonometer Geometry and Pa-tient-Specific Variability on Radial Artery Tonometry. J. Biomech. 2017, 58, 105–113. [Google Scholar] [CrossRef]
- Kachuee, M.; Kiani, M.M.; Mohammadzade, H.; Shabany, M. Cuffless Blood Pressure Estimation Algorithms for Continuous Health-Care Monitoring. IEEE Trans. Biomed. Eng. 2016, 64, 859–869. [Google Scholar] [CrossRef]
- Poon, C.C.Y.; Zhang, Y.-T.; Liu, Y. Modeling of Pulse Transit Time under the Effects of Hydrostatic Pressure for Cuffless Blood Pressure Measurements. In Proceedings of the 2006 3rd IEEE/EMBS International Summer School on Medical Devices and Biosensors, Cambridge, MA, USA, 4–6 September 2006; Volume 36, pp. 65–68. [Google Scholar] [CrossRef]
- Ram, M.R.; Madhav, K.V.; Krishna, E.H.; Komalla, N.R.; Reddy, K.A. On the performance of AS-LMS based adaptive filter for reduction of mo-tion artifacts from PPG signals. In Proceedings of the 2011 IEEE International Instrumentation and Measurement Technology Conference, Hangzhou, China, 10–12 May 2011; pp. 1–4. [Google Scholar]
- Ram, M.R.; Madhav, K.V.; Krishna, E.H.; Komalla, A.R.; Reddy, K.A. A Novel Approach for Motion Artifact Reduction in PPG Signals Based on AS-LMS Adaptive Filter. IEEE Trans. Instrum. Meas. 2011, 61, 1445–1457. [Google Scholar] [CrossRef]
- Kurylyak, Y.; Lamonaca, F.; Grimaldi, D. A Neural Network-based method for continuous blood pressure estimation from a PPG signal. In Proceedings of the 2013 IEEE International Instrumentation and Measurement Technology Conference (I2MTC), Minneapolis, MN, USA, 6–9 May 2013; pp. 280–283. [Google Scholar]
- He, R.; Huang, Z.P.; Ji, L.Y.; Wu, J.K.; Li, H.; Zhang, Z.Q. Beat-to-beat ambulatory blood pressure estimation based on random forest. In Proceedings of the IEEE International Conference on Wearable & Implantable Body Sensor Networks, Chicago, IL, USA, 19–22 May 2019; pp. 194–198. [Google Scholar]
- Miao, F.; Fu, N.; Zhang, Y.; Ding, X.-R.; Hong, X.; He, Q.; Li, Y. A Novel Continuous Blood Pressure Estimation Approach Based on Data Mining Techniques. IEEE J. Biomed. Health Inform. 2017, 21, 1730–1740. [Google Scholar] [CrossRef]
- Heikenfeld, J.; Jajack, A.; Rogers, J.; Gutruf, P.; Tian, L.; Pan, T.; Li, R.; Khine, M.; Kim, J.; Wang, K. Wearable sensors: Modalities, challenges, and prospects. Lab. Chip. 2018, 18, 217–248. [Google Scholar] [CrossRef] [Green Version]
- Fan, X.; Huang, Y.; Ding, X.; Luo, N.; Li, C.; Zhao, N.; Chen, S.-C. Alignment-Free Liquid-Capsule Pressure Sensor for Cardiovascular Monitoring. Adv. Funct. Mater. 2018, 28, 45. [Google Scholar] [CrossRef]
- Wang, C.; Li, X.; Hu, H.; Zhang, L.; Huang, Z.; Lin, M.; Zhang, Z.; Yin, Z.; Huang, B.; Gong, H.; et al. Monitoring of the central blood pressure waveform via a conformal ultrasonic device. Nat. Biomed. Eng. 2018, 2, 687–695. [Google Scholar] [CrossRef]
- Chandrasekhar, A.; Kim, C.S.; Naji, M.; Natarajan, K.; Hahn, J.O.; Mukkamala, R. Smartphone-based blood pressure monitoring via the oscillometric fin-ger-pressing method. Sci. Transl. Med. 2018, 10, eaap8674. [Google Scholar] [CrossRef] [Green Version]
- Pressman, G.L.; Newgard, P.M. A Transducer for the Continuous External Measurement of Arterial Blood Pressure. IRE Trans. Bio-Med. Electron. 1963, 10, 73–81. [Google Scholar] [CrossRef]
- Ni, M. The Yellow Emperor’s Classic of Medicine: A New Translation of the Neijing Suwen With Commentary; Shambhala: London, UK, 1995. [Google Scholar]
- Buxi, D.; Redoute, J.-M.; Yuce, M. A survey on signals and systems in ambulatory blood pressure monitoring using pulse transit time. Physiol. Meas. 2015, 36, R1–R26. [Google Scholar] [CrossRef]
- Hsu, Y.; Young, D.J. Skin-Coupled Personal Wearable Ambulatory Pulse Wave Velocity Monitoring System Using Micro-electromechanical Sensors. Sens. J. IEEE 2014, 14, 3490–3497. [Google Scholar] [CrossRef]
- Liu, W.; Gu, C.; Zeng, R.; Yu, P.; Fu, X. A Novel Inverse Solution of Contact Force Based on a Sparse Tactile Sensor Array. Sensors 2018, 18, 351. [Google Scholar] [CrossRef] [Green Version]
- Woo, S.H.; Choi, Y.Y.; Kim, D.J.; Bien, F.; Kim, J.J. Tissue-Informative Mechanism for Wearable Non-invasive Continuous Blood Pressure Monitoring. Sci. Rep. 2014, 4, 6618. [Google Scholar] [CrossRef] [Green Version]
- Shaltis, P.; Reisner, A.; Asada, H. A hydrostatic pressure approach to cuffless blood pressure monitoring. In Proceedings of the 26th Annual International Conference of the IEEE Engineering in Medicine and Biology Society, Berlin, Germany, 1 September 2004. [Google Scholar] [CrossRef] [Green Version]
- Soh, K.-S.; Lee, M.-H.; Yoon, Y.-Z. Pulse type classification by varying contact pressure. IEEE Eng. Med. Biol. Mag. 2000, 19, 106–110. [Google Scholar] [CrossRef]
- Zheng, D.; Allen, J.; Murray, A. Effect of external cuff pressure on arterial compliance. Comput. Cardiol. 2005, 2005, 315–318. [Google Scholar] [CrossRef] [Green Version]
- IEEE Standard Association. IEEE Standard for Wearable Cuffless Blood Pressure Measuring Devices; IEEE: Manhattan, NY, USA, 2014; pp. 1–32. [Google Scholar]
- Stergiou, G.S.; Palatini, P.; Asmar, R.; Ioannidis, J.P.; Kollias, A.; Lacy, P.; McManus, R.J.; Myers, M.G.; Parati, G.; Shennan, A.; et al. Recommendations and Practical Guidance for performing and reporting validation studies according to the Universal Standard for the validation of blood pressure measuring devices by the Association for the Advancement of Medical Instrumentation/European Society of Hypertension/International Organization for Standardization (AAMI/ESH/ISO). J. Hypertens. 2019, 37, 459–466. [Google Scholar] [CrossRef] [Green Version]


| Subject | SBP | DBP | Gender | Age | Weight |
|---|---|---|---|---|---|
| (mmHg) | (kg) | ||||
| 1 | 120 | 73 | Male | 23 | 64 |
| 2 | 116 | 75 | Male | 22 | 57 |
| 3 | 115 | 61 | Male | 22 | 65 |
| 4 | 125 | 85 | Male | 21 | 76 |
| 5 | 116 | 74 | Male | 22 | 75 |
| 6 | 113 | 84 | Male | 22 | 72 |
| 7 | 122 | 76 | Male | 22 | 50 |
| 8 | 111 | 69 | Female | 22 | 62 |
| 9 | 115 | 78 | Male | 24 | 60 |
| 10 | 102 | 75 | Female | 22 | 46 |
| 11 | 122 | 74 | Male | 22 | 100 |
| 12 | 129 | 85 | Male | 23 | 61 |
| 13 | 137 | 84 | Male | 22 | 70 |
| 14 | 106 | 76 | Male | 23 | 70 |
| 15 | 128 | 83 | Male | 23 | 70 |
| 16 | 99 | 69 | Male | 22 | 65 |
| 17 | 121 | 78 | Male | 23 | 79 |
| 18 | 104 | 79 | Male | 23 | 78 |
| 19 | 101 | 71 | Male | 23 | 69 |
| 20 | 97 | 64 | Male | 23 | 70 |
Publisher’s Note: MDPI stays neutral with regard to jurisdictional claims in published maps and institutional affiliations. |
© 2021 by the authors. Licensee MDPI, Basel, Switzerland. This article is an open access article distributed under the terms and conditions of the Creative Commons Attribution (CC BY) license (https://creativecommons.org/licenses/by/4.0/).
Share and Cite
Zhan, B.; Yang, C.; Xie, F.; Hu, L.; Liu, W.; Fu, X. An Alignment-Free Sensing Module for Noninvasive Radial Artery Blood Pressure Measurement. Electronics 2021, 10, 2896. https://doi.org/10.3390/electronics10232896
Zhan B, Yang C, Xie F, Hu L, Liu W, Fu X. An Alignment-Free Sensing Module for Noninvasive Radial Artery Blood Pressure Measurement. Electronics. 2021; 10(23):2896. https://doi.org/10.3390/electronics10232896
Chicago/Turabian StyleZhan, Binpeng, Chao Yang, Fuyuan Xie, Liang Hu, Weiting Liu, and Xin Fu. 2021. "An Alignment-Free Sensing Module for Noninvasive Radial Artery Blood Pressure Measurement" Electronics 10, no. 23: 2896. https://doi.org/10.3390/electronics10232896
APA StyleZhan, B., Yang, C., Xie, F., Hu, L., Liu, W., & Fu, X. (2021). An Alignment-Free Sensing Module for Noninvasive Radial Artery Blood Pressure Measurement. Electronics, 10(23), 2896. https://doi.org/10.3390/electronics10232896