1. Introduction
One of the advantages of non-insulation (NI) high-temperature superconducting (HTS) coils is the capability to operate under the fault (typically overcurrent and hot-spot quench) conditions with a much lower risk of burnout [
1]. The high stability against fault conditions [
2,
3] puts NI coils forward as a promising option for the large-scale application of DC high-temperature superconducting magnets, such as in maglev trains [
4], motors [
5,
6], TOKAMAK systems [
7], and high-field NMR [
8]. Overcurrent conditions with an operating current higher than the critical current sometimes occur and play an important role in achieving a maximum field and in the elimination of screening currents [
7].
Several studies have focused on the performance of NI–HTS coils operating under overcurrent conditions. Experimentally, a saturation of the magnetic field was observed in various overcurrent tests [
7,
9,
10,
11], and burnout [
11] of both the innermost and outermost turns close to the electrodes occurred [
12]. Similar phenomena were also observed during overcurrent tests of HTS coils with turn-to-turn metal insulation [
13,
14]. Numerically, the partial element equivalent circuit (PEEC) [
15] or equivalent circuit grid (ECG) [
16], coupled with a thermal model, which was proposed to numerically analyze the behaviors of NI coils during overcurrent conditions, suggested that a considerable amount of Joule heat is generated near the outer electrode, initiating the quench propagation and ascribing the magnetic field saturation to a local decrease in critical current [
17]. Overcurrent test results in [
18,
19] also demonstrate the capability of NI coils to operate steadily in the saturated phase without leading to thermally induced degradation.
To further investigate the evolution of current distributions, understand the more quantitative characteristics during the transition to the magnetic-field saturation phase, and clarify the potential risks of NI coils during overcurrent excitation, this study adopted an equivalent circuit grid model [
15,
16,
17] coupled with a magnetic field the
E–
J power law of superconductors, calculated by the method mentioned in [
20], to realize a real-time circuit-field simulation. In addition, a double pancake NI test coil was wound and charged with exquisite excitation procedures to validate the model. The responses of both the magnetic field and coil voltage were recorded and compared with the numerical results. The main contributions of this paper are as follows: (1) Detailed current distributions inside the coil during overcurrent charging are presented and discussed. Potential quenching risks were found to be at the innermost and outermost turn near the electrodes, as well as at the pancake-to-pancake connection part. (2) Magnetic field saturation, which is a unique phenomenon in non-insulation superconducting coils during overcurrent charging, was studied in detail and first quantitatively defined by a new concept “converged load factor”. Its relationship with turn-to-turn resistivity was revealed.
2. Model Description
2.1. Double-Pancake ECG Model
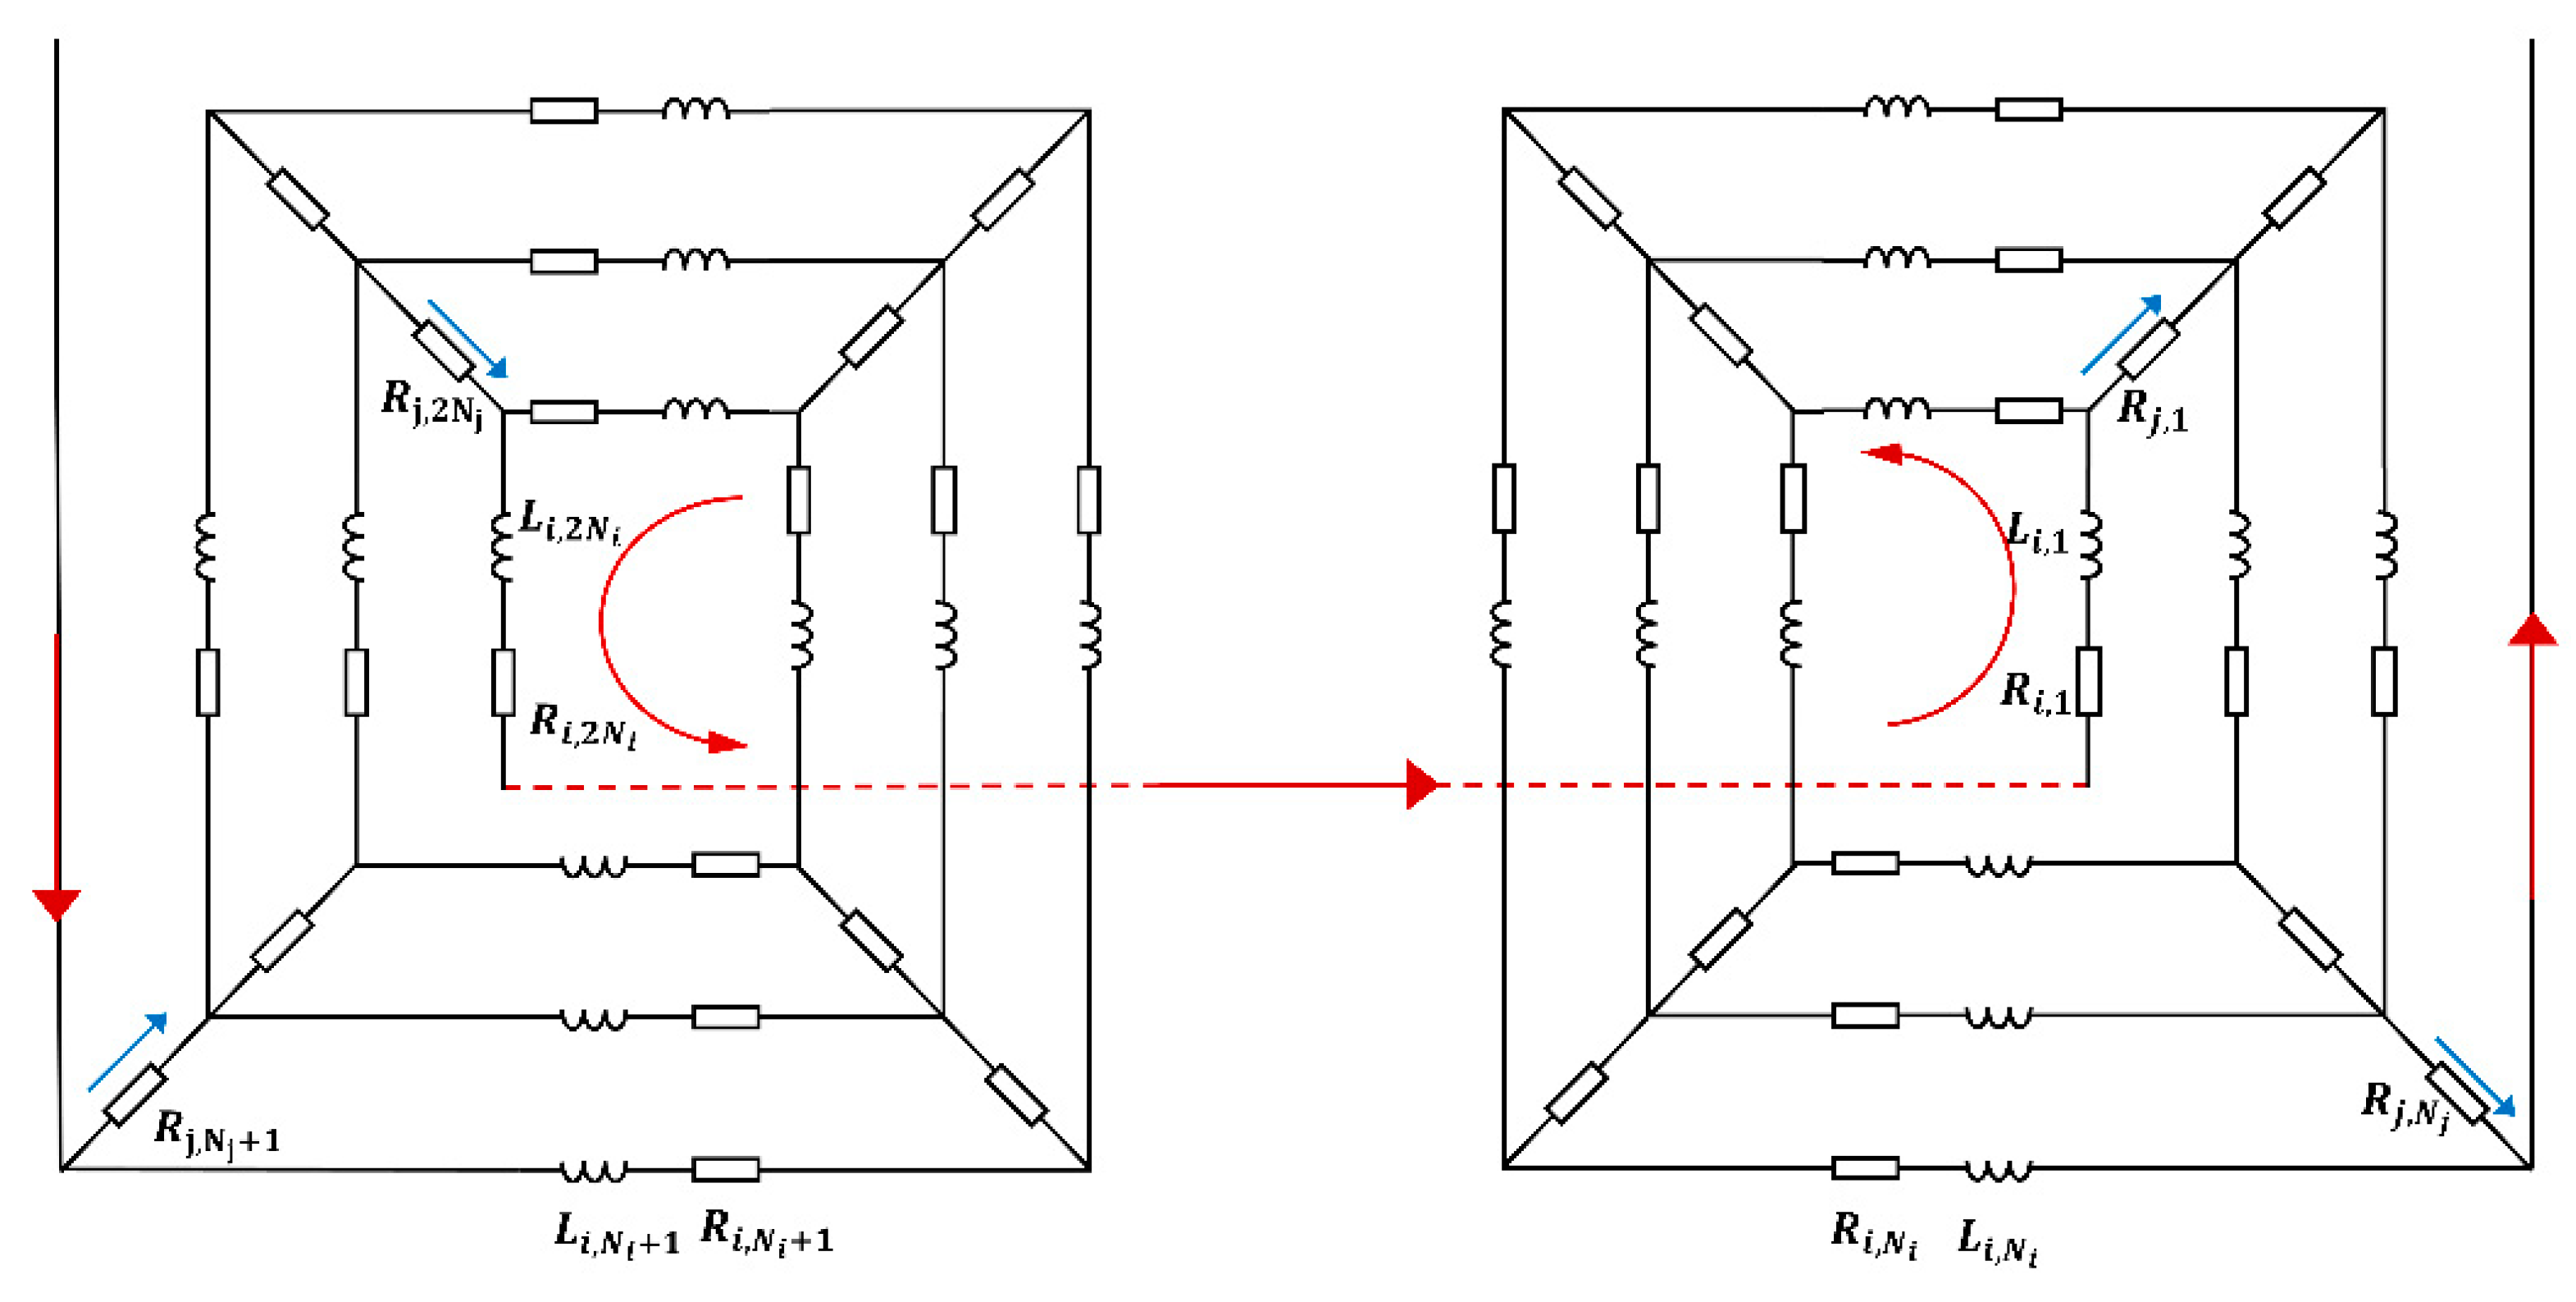
The ECG model [
16] in
Figure 1 was adopted to calculate the distributions of both the spiral and radial currents of a NI–DP coil. The number of total turns in one pancake was defined as
Nt. Each turn was equally divided into
Ne arc elements. The total number of spiral and radial elements for one pancake was defined as
Ni =
Nt ×
Ne and
Nj = (
Nt − 1) ×
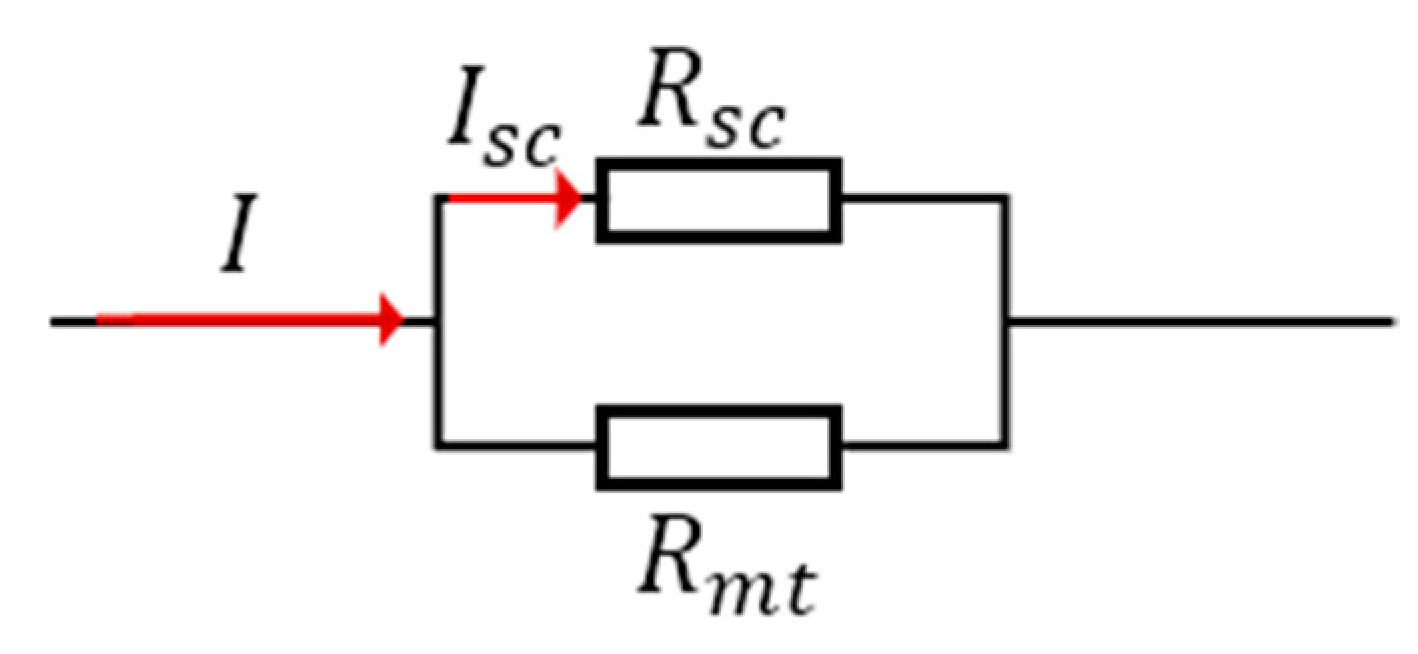
Ne, respectively. Each spiral element consists of its own inductance, its mutual inductance with the other elements, and spiral resistance. The
k-th spiral resistance
Ri,k is composed of the resistance of the HTS layer
Rsc and that of the other metal layers
Rmt, as illustrated in
Figure 2.
Rj,k represents the
k-th radial resistance.
Considering that a DP coil is wound spirally with a single tape, the upper pancake is reflectional rather than translationally symmetric [
21] with respect to the lower pancake, which should be considered when numbering spiral elements and calculating the mutual inductance between an arc element of the upper pancake and one of the lower pancakes.
The relationship between the spiral and radial currents of the DP ECG model can be obtained according to Kirchhoff’s law at each circuit node. The governing equations are the following Equation (1):
where
Ik,
Jk, and
Iop denote the current in the
k-th spiral element, radial element, and power supply, respectively.
The governing equations of each circuit loop derived from Kirchhoff’s voltage law are the following Equation (2):
where
Uk denotes the voltage drop along the
k-th spiral element, consisting of both the inductive and resistive voltages, as shown by the following Equation (3):
where
Mk,m represents the self-inductance of the
k-th spiral element if
k =
m and the mutual inductance between the
k-th and
m-th spiral elements if
k ≠
m. The self-inductance and mutual inductance are calculated by integrating Neumann’s formula [
22,
23].
Equations (1)–(3) can be expressed in a matrix form (Equation (4)):
where
I = [I1 I2 … I2Ni]T and
J =
[J1 J2 … J2Nj]T.
For the aforementioned ECG model [
16],
A1 is always a non-singular square matrix, and consequently, unlike the previously proposed method [
16], the radial current vector
J is selected as the state variable, and the spiral current vector
I can be derived, as shown by Equation (5).
To solve the system of ordinary differential Equation (4), iterative methods including the Runge–Kutta fourth-order method were adopted, and the calculation and post-processing were conducted in MATLAB R2021b. The geometry of the coil in profiles of current distribution [
24,
25] in the radial direction was enlarged for better illustration.
2.2. Coupling of Magnetic Fields and the DP ECG Model
To calculate the field-dependent critical current effectively, a two-dimensional axisymmetric model mentioned in [
20] was used as Equation (6).
The magnetic vector potentials
can be calculated by integrating the current density multiplied by an integral kernel [
20]. Numerically, only two linear transformations are needed to obtain the parallel component
Bpar and perpendicular component
Bper of the magnetic field by multiplying the current density with two pre-calculated constant matrices. Therefore, the coupling of the magnetic field and the DP ECG model can be performed within several milliseconds. The calculated parallel and perpendicular components of the magnetic field
Bpar and
Bper are used to calculate the field-dependent critical current by Equation (7) [
26,
27]:
where
Ic0 = 167 A,
k = 0.518,
α = 0.74, and
Bc = 106 mT. The parameters are obtained by fitting the above elliptical function [
26,
27] with the measured data of a short sample under an external parallel and perpendicular magnetic field.
The high nonlinearity of the
E–
J power law causes the resistance of spiral elements to change drastically with respect to the ratio of
I/Ic. The following model [
28] shown by
Figure 2 and Equation (8), consisting of two parallel resistances, is used to calculate the overall resistance of spiral elements based on the rule of mixtures [
29]. The
n-value was set to be 21.
where
l denotes the length of a spiral element. Once the field-dependent critical current
Ic is obtained from Equation (7), the nonlinear Equation (8) can be solved by iterative methods such as Newton’s method to obtain
Isc (the current in the HTS layer), and the overall resistance
Ri can be calculated by Equation (9).
In terms of overcurrent excitation, the presented model focused on the field–circuit coupling and real-time update of the spiral resistance with time-varying conditions of currents and magnetic fields.
The high nonlinearity of the E–J power law also makes the system of the odes in Equation (4) difficult to converge, particularly when local I/Ic is approximately 1. It is recommended that the larger the I/Ic ratio, the smaller the time step that should be used to obtain converged solutions.
3. Experimental Setup and Procedure
3.1. Experimental Setup
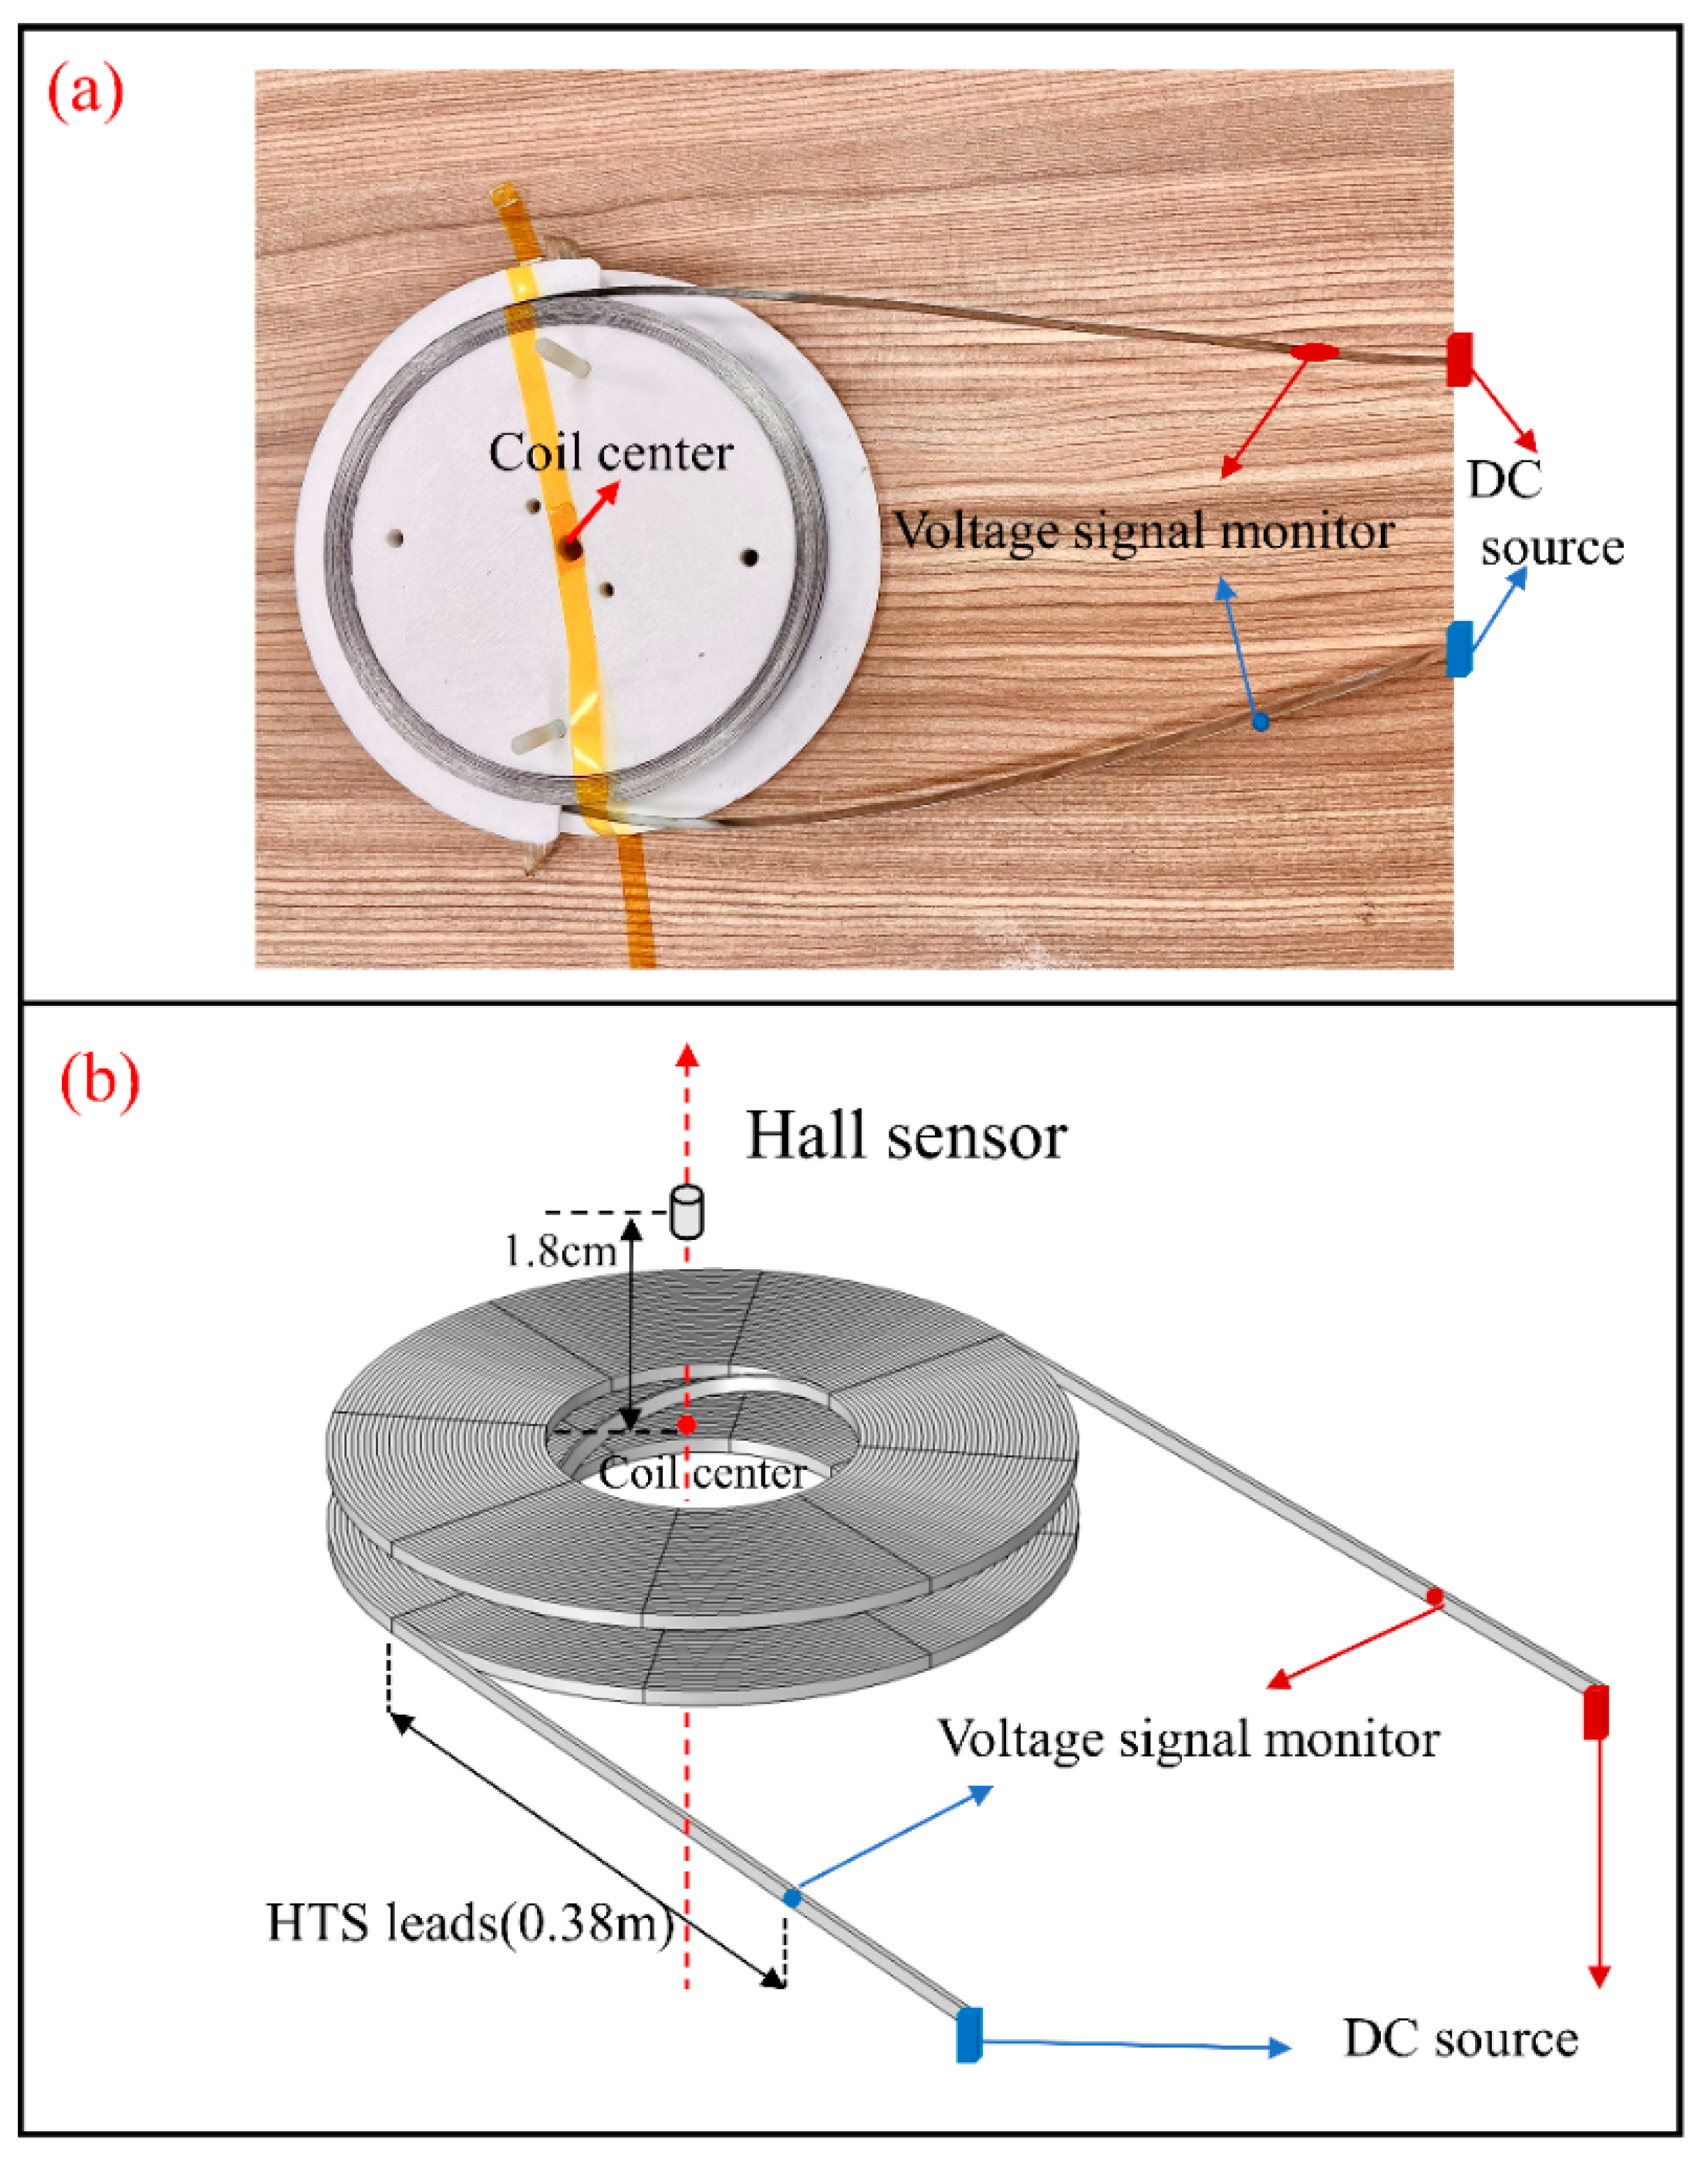
The experimental DP coil was wound with a single piece of GdBCO tape, and the specifications of the tape and coil are listed in
Table 1.
The measured critical current of the coil was 114.6 A at 77 K according to the 1 μV/cm criterion. A Hall sensor was fixed at 1.8 cm above the center of the DP coil along the
z-axis, as illustrated in
Figure 3.
Notably, there was a 0.38 m long tape extending from the outermost turn of each pancake to attach to the DC source, preventing the heat generated in the copper terminals from affecting the coil, and the voltage drop along the HTS leads should be considered, particularly in overcurrent situations.
3.2. Experimental Procedure
The step-rising excitation method was adopted to measure the stabilized magnetic flux density and voltage signal of the DP coil operating at currents of different amplitudes.
First, the DP coil was excited to 10 A, and when the voltage and magnetic field signals were stabilized, the power supply current increased by 10 A at a rate of 0.278 A/s. When the voltage was no longer stabilized at approximately 0 V, which indicated a clear index loss occurring along the spiral HTS layer, the power supply current increased by 5 A instead until it reached 150 A. Thereafter, the power supply current started to decrease at 5705 s from 150 to 0 A at a rate of 1 A/s. When the coil was completely demagnetized, normal charge (50.1 A) and sudden discharge tests (from 6400 to 7200 s) were conducted to confirm whether the coil was degraded under the previous overcurrent test. Finally, after confirming that the coil was normal, overcurrent excitation (120.3 A) and sudden discharge tests (from 7200 to 8000 s) were performed to cross-validate the performance of the coil under overcurrent conditions, with the test performed from 0 to 6400 s. The key time points and corresponding power supply currents are listed in
Table 2.
4. Results and Verification of Numerical Model
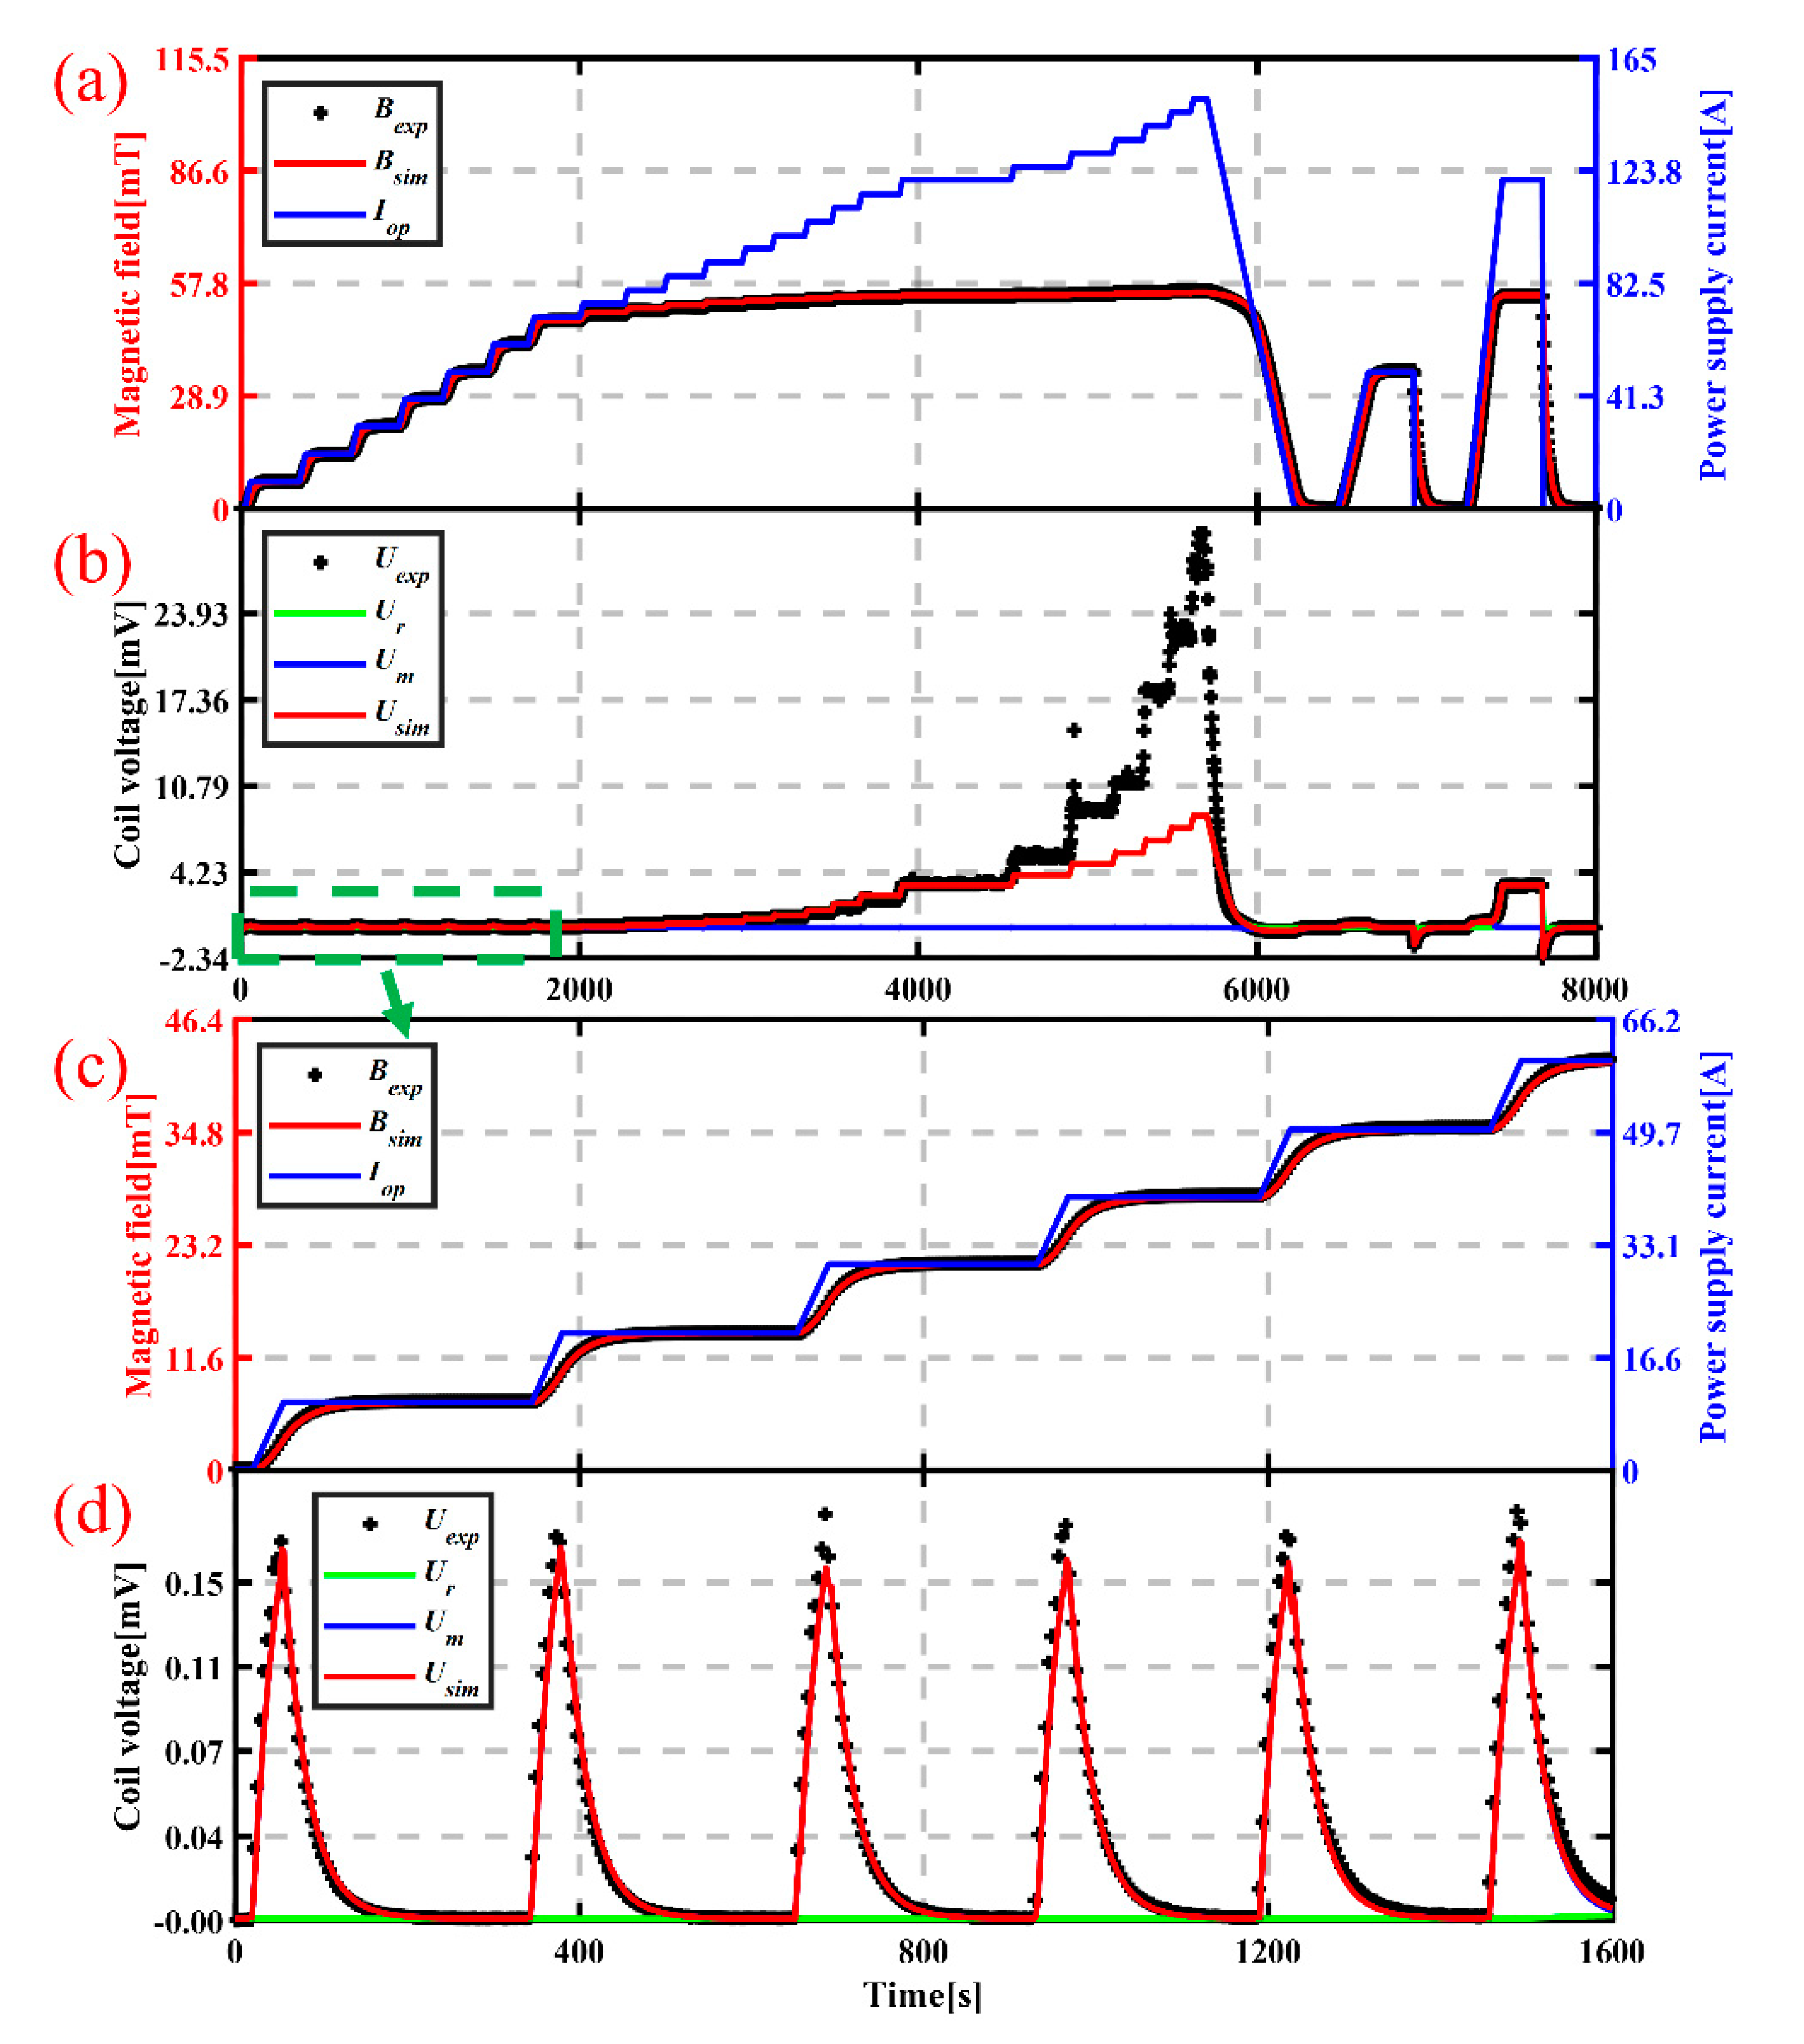
The experimental data and the numerical results are shown and compared in
Figure 4, where
Bexp,
Bsim,
Iop,
Uexp, and
Usim denote the experimental magnetic field flux density, simulated magnetic field flux density, current of power supply, experimental coil voltage, and simulated coil voltage, respectively.
Usim denotes the sum of the voltage drops of each spiral element in the DP–ECG model as defined in Equation (10).
4.1. Behavior of Magnetic Flux Density during the Overcurrent Charging Process
In terms of the magnetic field, the calculated results are consistent with the experimental results, as shown in
Figure 4.
From 0 to 2000 s, the NI–DP coil was charged to 10.0, 20.2, 30.3, 40.2, 50.1, 60.2, and 70.1 A, and at every stage, the DC source was maintained for a few seconds to record the stabilized magnetic field flux density and voltage signals. The ratio of the stabilized center magnetic field flux density to the power supply current remained at approximately 0.7 mT/A, which can be described as the linear increase process [
17,
19]. The voltage’s responses to the increase in the operating current by 10 A at a rate of 0.278 A/s were almost identical, and the terminal voltage dropped to nearly zero when the operating current stabilized at each stage. It is clear that the current only flowed along the spiral HTS layer path and the resistance of the HTS layer was almost null when the steady operating current was far below the critical current.
As shown in
Figure 4, starting from 2000 s, the power supply current increased from 70.1 A, with an amplitude of 5 A each time at a rate of 0.278 A/s. The magnetic field flux density no longer corresponded linearly to the stabilized operating current but reached a plateau. The maximum center magnetic field flux density that the NI–DP coil could generate was approximately 55 mT, and the average current flowing along the spiral path was 78.6 A, which was estimated by the magnet constant 0.7 mT/A. The overloaded input current flowed along the radial path [
30], which provided no significant contribution to the magnetic field but resulted in a terminal voltage rise and Joule heat.
It was observed that the Joule heat led to no irreversible quenching during the entire test, mainly attributed to the equivalent contact resistivity, which was found to be as low as 6.47 μΩ·cm2, and the small amount of generated heat could be dissipated quickly in an LN2 bath.
The NI–DP coil exhibited great stability during the overcurrent test from 0 to 6400 s. The subsequent normal charge and sudden discharge test from 6400 to 7200 s indicated that the coil was not degraded during the previous overcurrent test, as the DP coil maintained the same capability of generating a saturated magnetic field and the coil voltage dropped to nearly zero with the power supply current stabilized at 50.1 A, which was much lower than the critical current of the coil.
The final test from 7200 to 8000 s exhibited similar performance to the NI–DP coil in an overcurrent state, and the maximum center magnetic field flux density stabilized at approximately 55 mT, which was consistent with the previous test from 0 to 6400 s. The overloaded current caused the terminal voltage to stabilize at 3.3 mV, as the power supply current remained at 120.3 A.
4.2. Voltage Drop in HTS Leads
As shown in
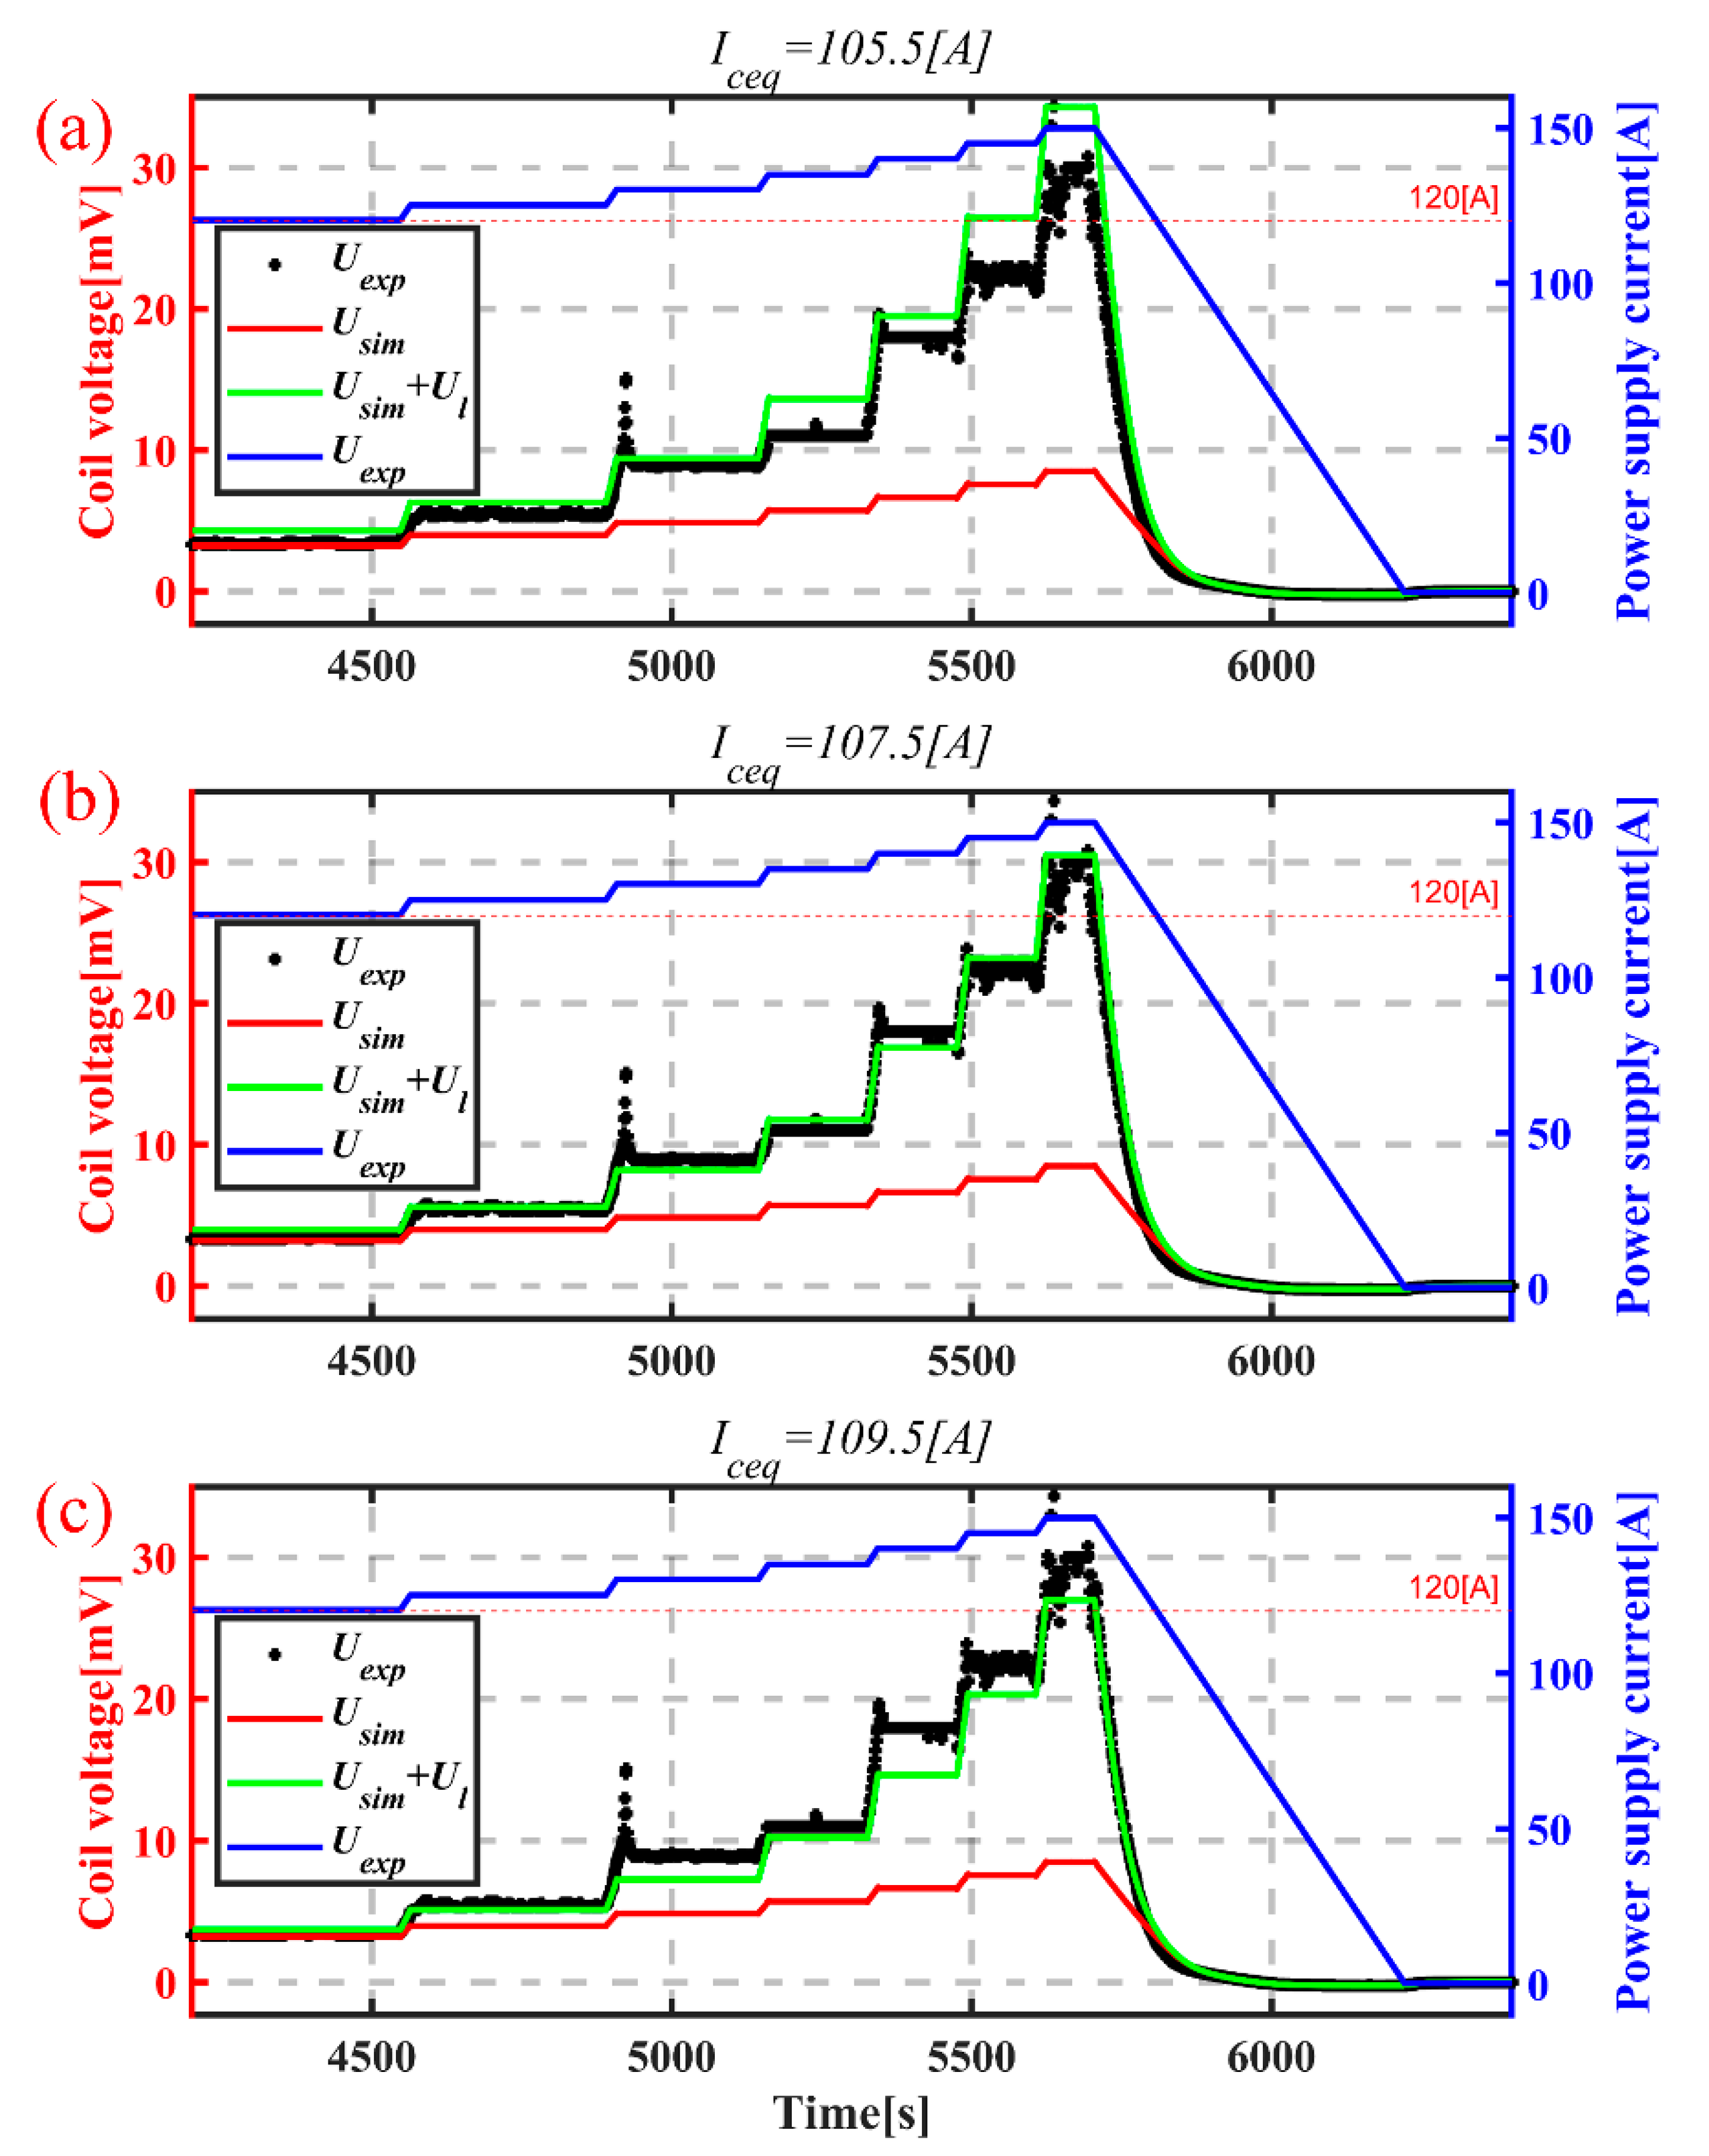
Figure 4, the simulated magnetic field exhibited acceptable consistency with experimental results throughout the entire test process, whereas the calculated coil voltage exhibited a clear inconsistency from 4564 to 5800 s, during which the magnetic field remained saturated and relatively stable even as the power supply current increased further, but the coil voltage increased more dramatically, compared with the calculated results.
The main discrepancy in the terminal voltage from 4564 to 5800 s occurred when the power supply current exceeds 120.3 A, while there were no marked fluctuations in the magnetic field. The extra voltage drop could be attributed to the HTS leads extending from the outermost turn of each pancake, as depicted in
Figure 3, because the operating current flowing in the HTS leads was as large as the power supply current and had no significant contribution to the magnetic field but was capable of generating a considerable voltage drop along the voltage measuring path.
The model depicted in
Figure 2 was used to numerically verify the presented ratiocination. The extra voltage drop along the HTS leads
Ul can be estimated using the following Equation (11):
where
lds denotes the length of a single HTS lead, which is 0.38 m, and
E0 is the critical electric field (1 µV/cm and n = 21).
As the magnetic field remained almost stable from 4564 to 5800 s, it is reasonable to adopt a time-independent and approximated critical current of the entire HTS leads, denoted as
Iceq.
Isc(
t) is the current flowing along the HTS layer of the leads with respect to
Iop(
t), which can be calculated by solving the non-linear Equation (8).
Figure 5 shows that with
Iceq equal to 107.5 A, the extra voltage can be explained.
5. Transient Behavior during Overcurrent Charging
Both the magnetic field and coil voltage results exhibited good consistency with the experimental results from our analysis. Thus, this model can be used to investigate the mechanism of the transition from the normal charging condition to the overcurrent charging condition of the magnetic field and the detailed current distributions inside the coil.
5.1. Analysis of the Transition Process to Saturation of Magnetic Field
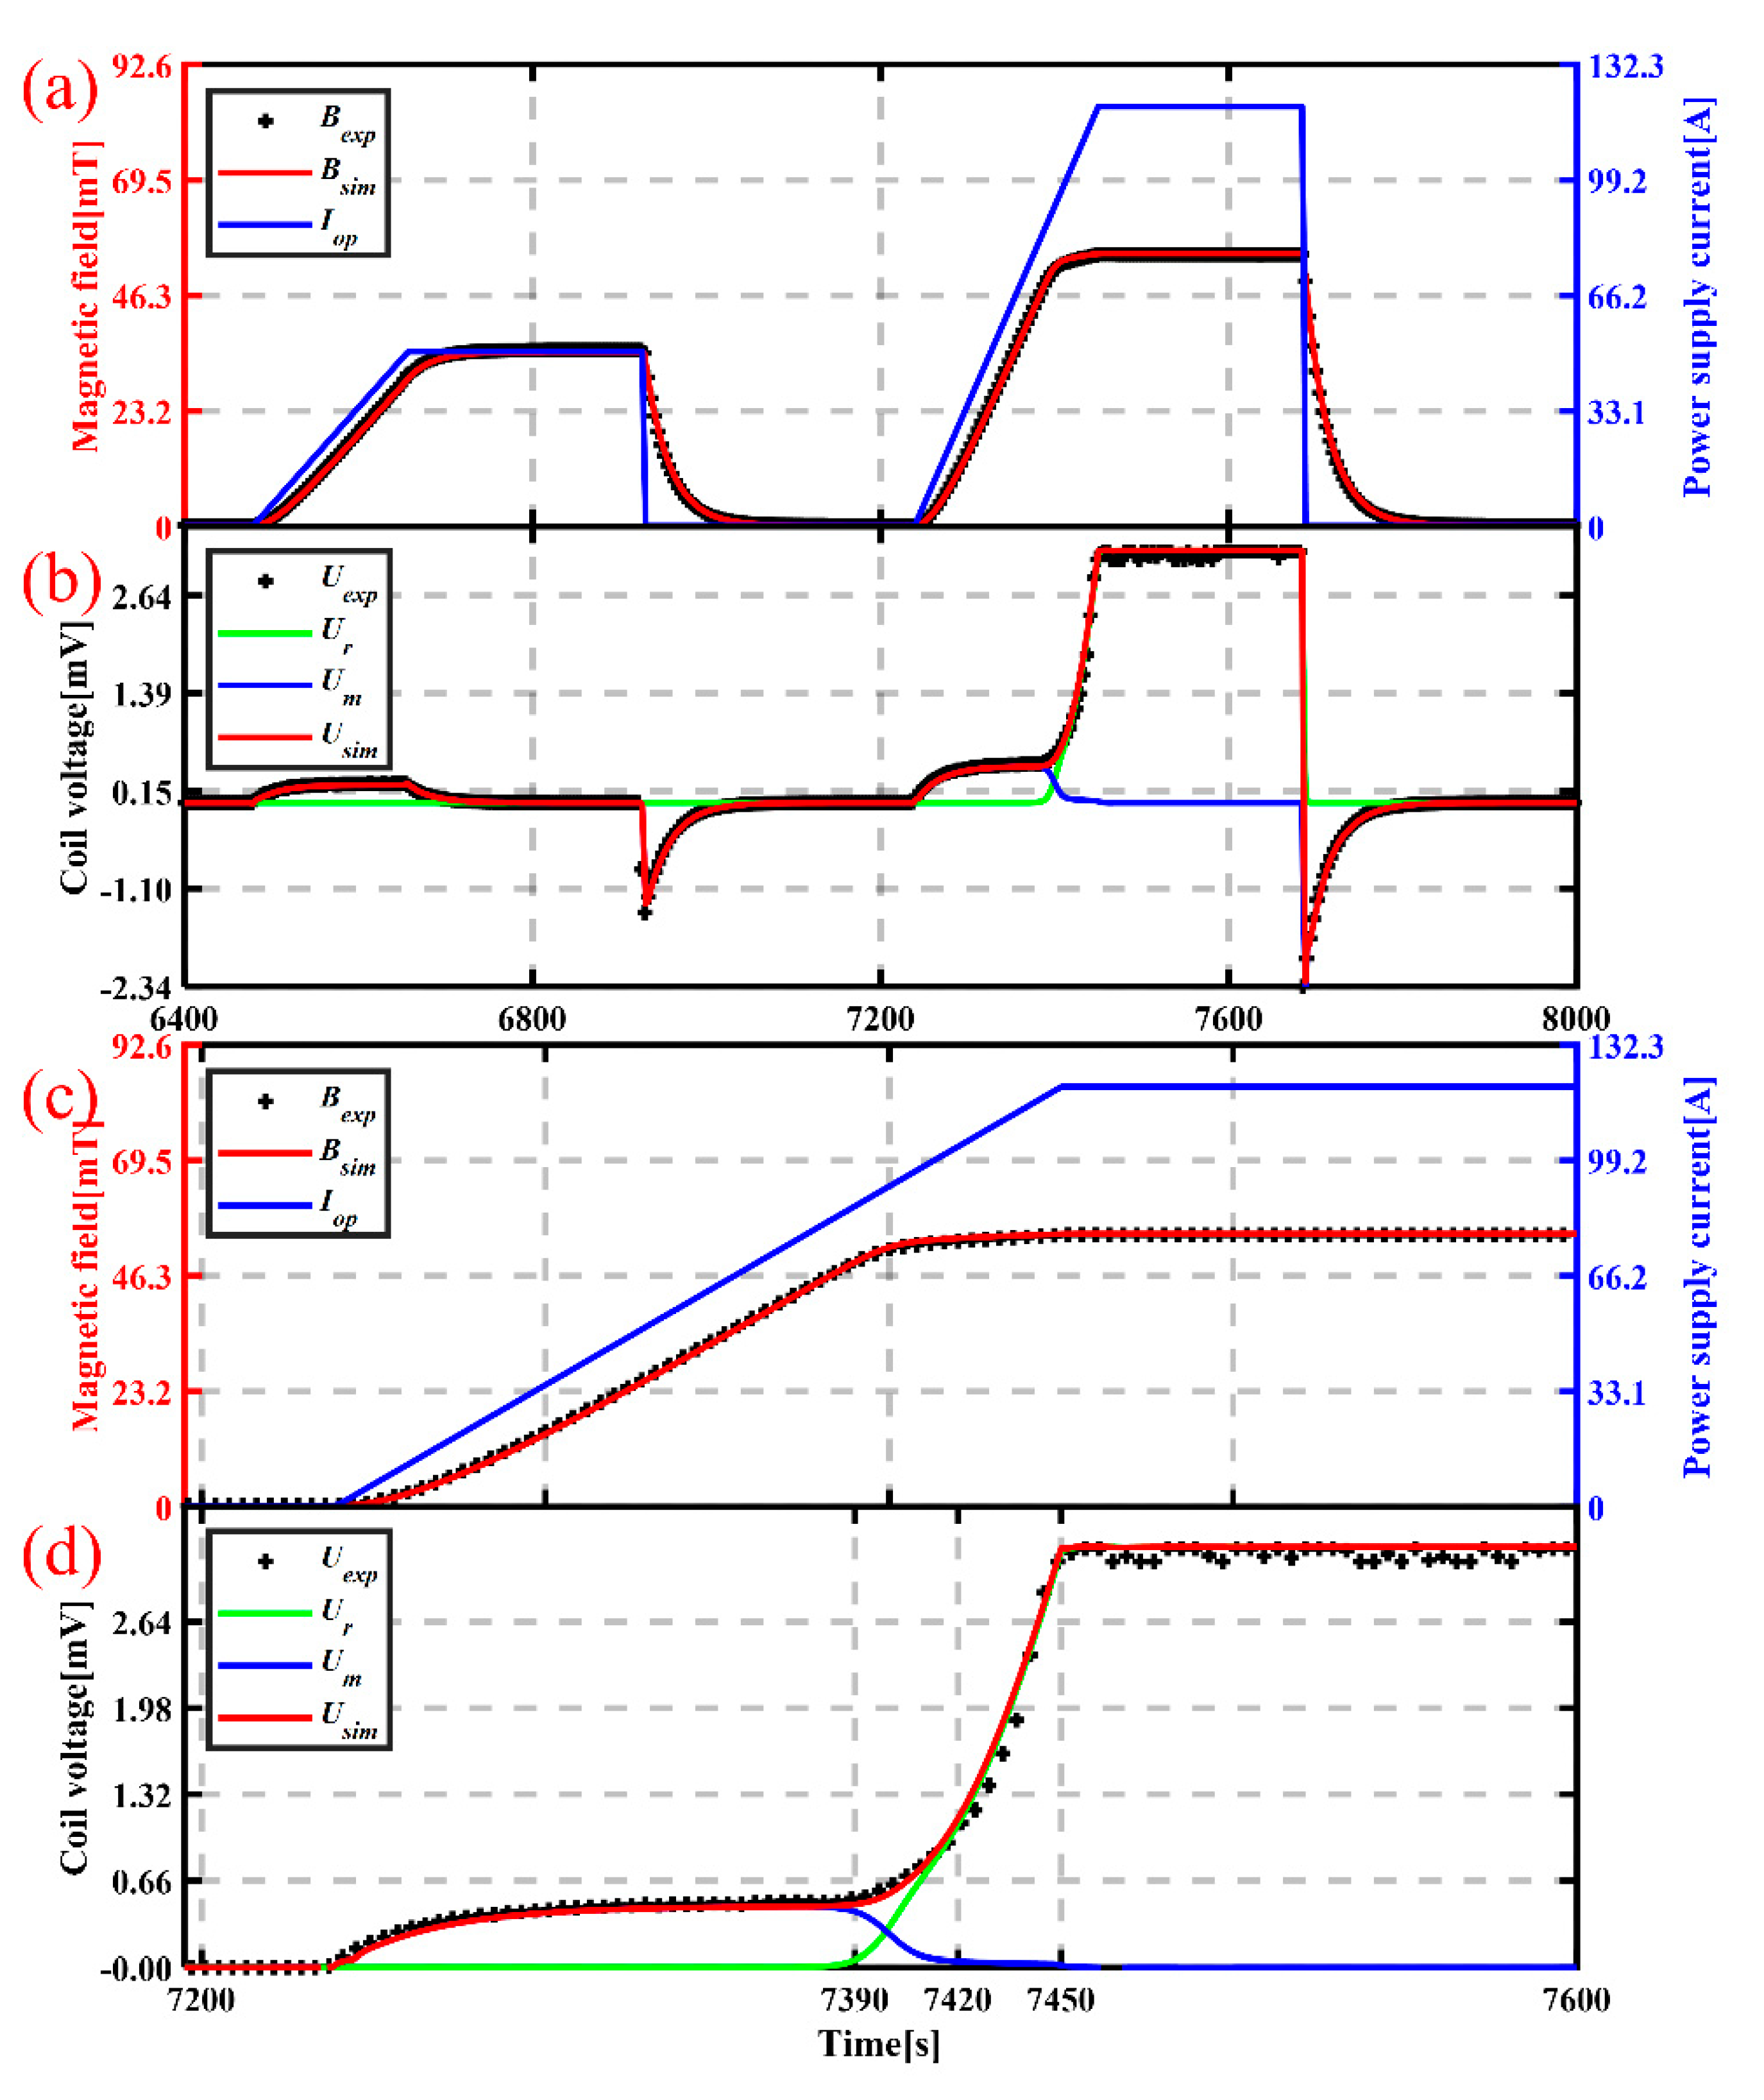
The experimental and computed results in
Figure 6a from 6400 to 8000 s were selected to compare the difference in the performance of the NI–DP coil between normal excitation and overcurrent excitation. The term
Usim is decomposed into the resistive component
Ur and inductive component
Um, which are calculated using Equations (12) and (13), respectively.
As shown in
Figure 6a, the resistive voltage
Ur was nearly zero before the power supply current exceeded 86.14 A at 7390 s for the first time and during the sudden discharge process. At 7390 s, as shown in
Figure 6b, U
r started increasing rapidly, and the magnetic field began to saturate, whereas
Um decreased gradually to zero at 7420 s, even with a ramped-up power supply.
Thus, from the perspective of voltage signals, the simulated results suggested that as the spiral current increased, the increased index resistance of the spiral path, in turn, drove the ascending rate of the spiral current down, which was reflected in the decreasing inductive voltage and, consequently, the saturation of the magnetic field (from 7390 to 7420 s).
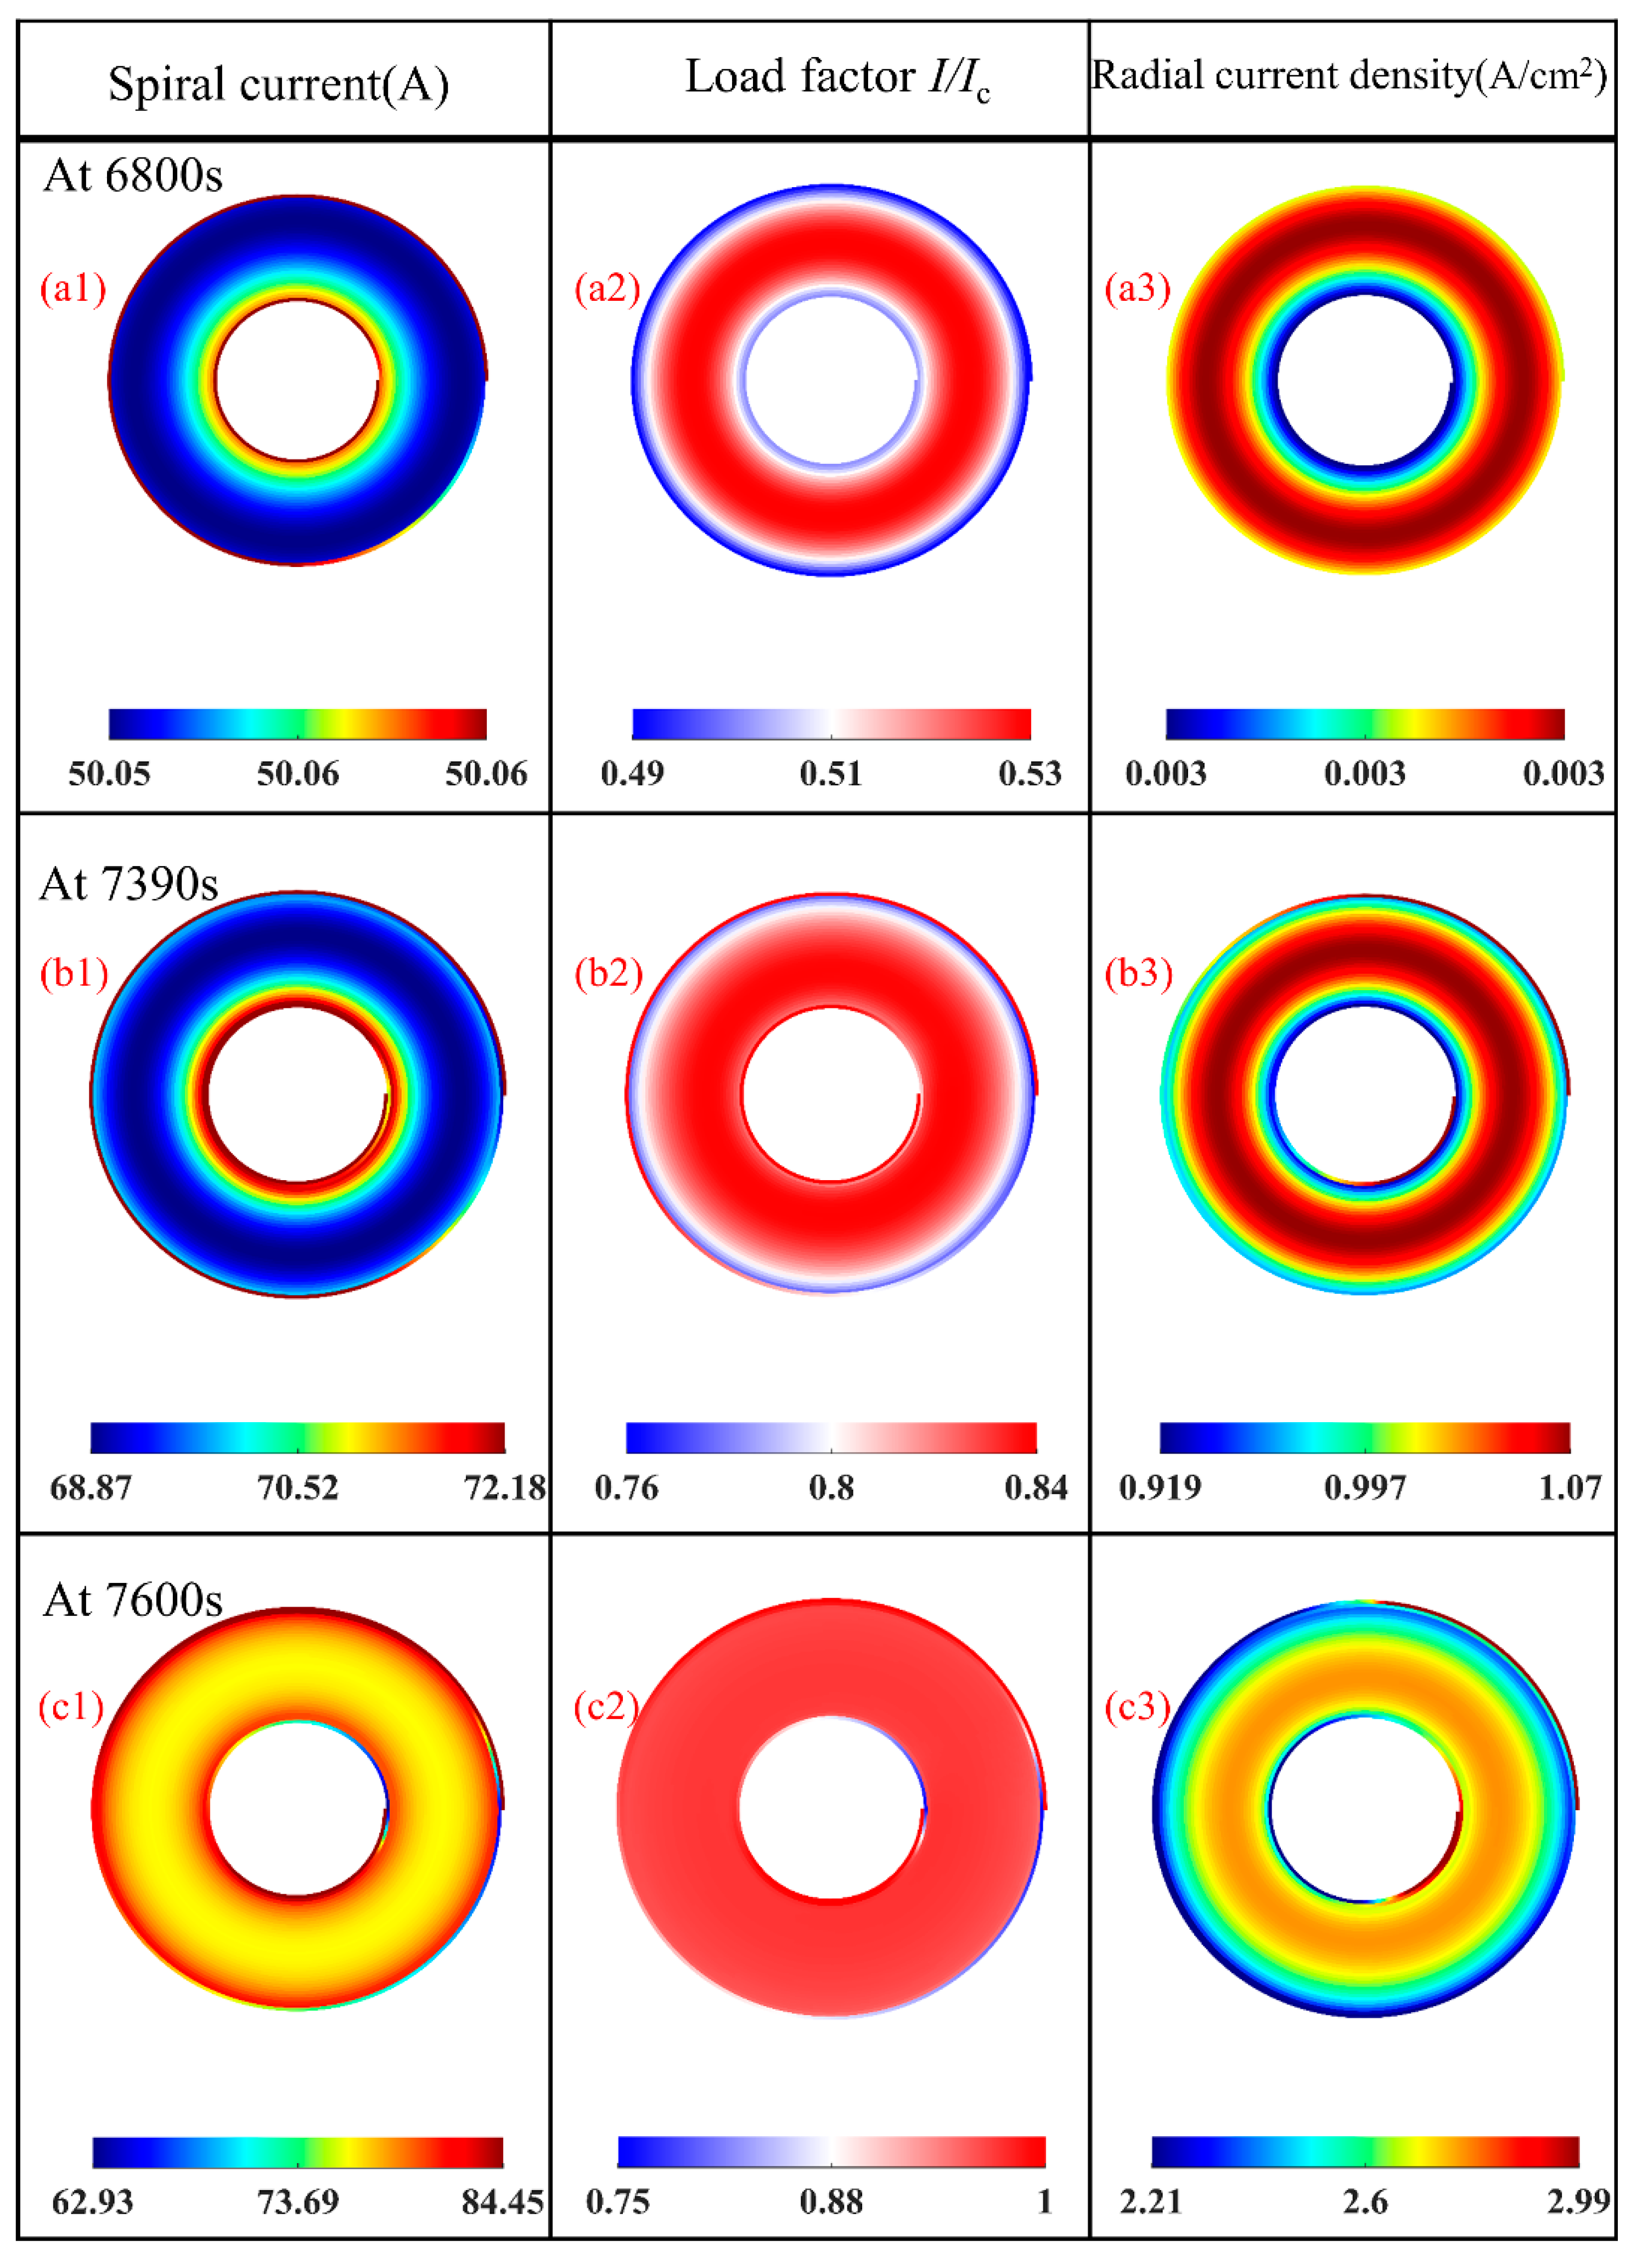
5.2. Current Distributions Inside the Coil
The profiles of the spiral current, load factor
I/Ic, and radial current density at 6800, 7390, and 7600 s are illustrated in
Figure 7.
It was observed that the spiral current was almost evenly distributed along the spiral HTS layer path and was close to the power supply current maintained at 50.1 A at 6800 s, while the radial current density was rather small. In contrast, the radial current density was much larger when
Iop was maintained at 120.3 A at 7600 s, as depicted in
Figure 7(a1,a3,c1,c3).
At 7390 s, when the power supply current reached 86.15 A and the magnetic field started to saturate, the overall index resistance was sufficiently large to initiate saturation even when none of the local load factors
I/Ic exceeded 0.85, as shown in
Figure 7(b2).
As shown in
Figure 7(c1,c3), the highest spiral current and radial current density were both distributed in the outermost turn near the electrodes and innermost turn near the port where the spiral current flowed to the other pancake during the overcurrent state. A similar phenomenon was observed in [
15] during charging without overcurrent.
The largest local load factors (>1) were located near the current input and output parts of the innermost and outermost turns, as depicted in
Figure 7(c2). This caused considerable spiral resistance, impeding the operating current flowing along the spiral path but making it flow along the radial path to the middle turns. This implied that both the innermost and outermost turns of each pancake near the ports where the power supply current was input and output were the most vulnerable areas when NI–DP coils operated under overcurrent conditions with bad cooling conditions or when the power supply current increased further.
This deduction may provide a reasonable explanation for the overcurrent tests of NI coils [
11], and even coils with turn-to-turn metal insulation [
13], which reported burnout of the innermost and outermost turns near the electrodes—that is, irreversible quenching was initiated at both the innermost and outermost turns close to current terminals, owing to excessive overcurrent excitation, and thereafter propagated to the middle turns. The ratiocination was different from the analysis in [
18], which indicates that quenching occurs from the exterior to the interior turns. Therefore, more emphasis should be placed on the protection of turns close to electrodes and joints between pancakes in the application of HTS magnets consisting of multiple DP coils, especially for the magnets in conduction-cooled conditions.
In addition, the critical current of the coil, 114.6 A, determined by the 1 μV/cm criteria, seriously overestimated the maximum spiral operating current because the main voltage drop was located along small pieces of HTS tape in the boundary turns, while most of the middle turns remained in a subcritical state according to the 1 μV/cm criteria. Therefore, it is more reasonable to evaluate the spiral current-carrying capacity from the perspective of the magnetic field [
15,
19].
5.3. Converged Load Factor for NI Coils
The non-uniform distribution of the magnetic field resulted in a non-uniform local critical current. Therefore, a non-uniform spiral current distribution was observed when the NI–DP coil operated under overcurrent conditions, as depicted in
Figure 7(c1). However, most of the local load factors
I/Ic inside the coil converged at approximately 0.97, as depicted in
Figure 7(c2) The convergence of load factors during overcurrent indicated that most of the spiral elements inside the coil reached their own maximum current-carrying capacity.
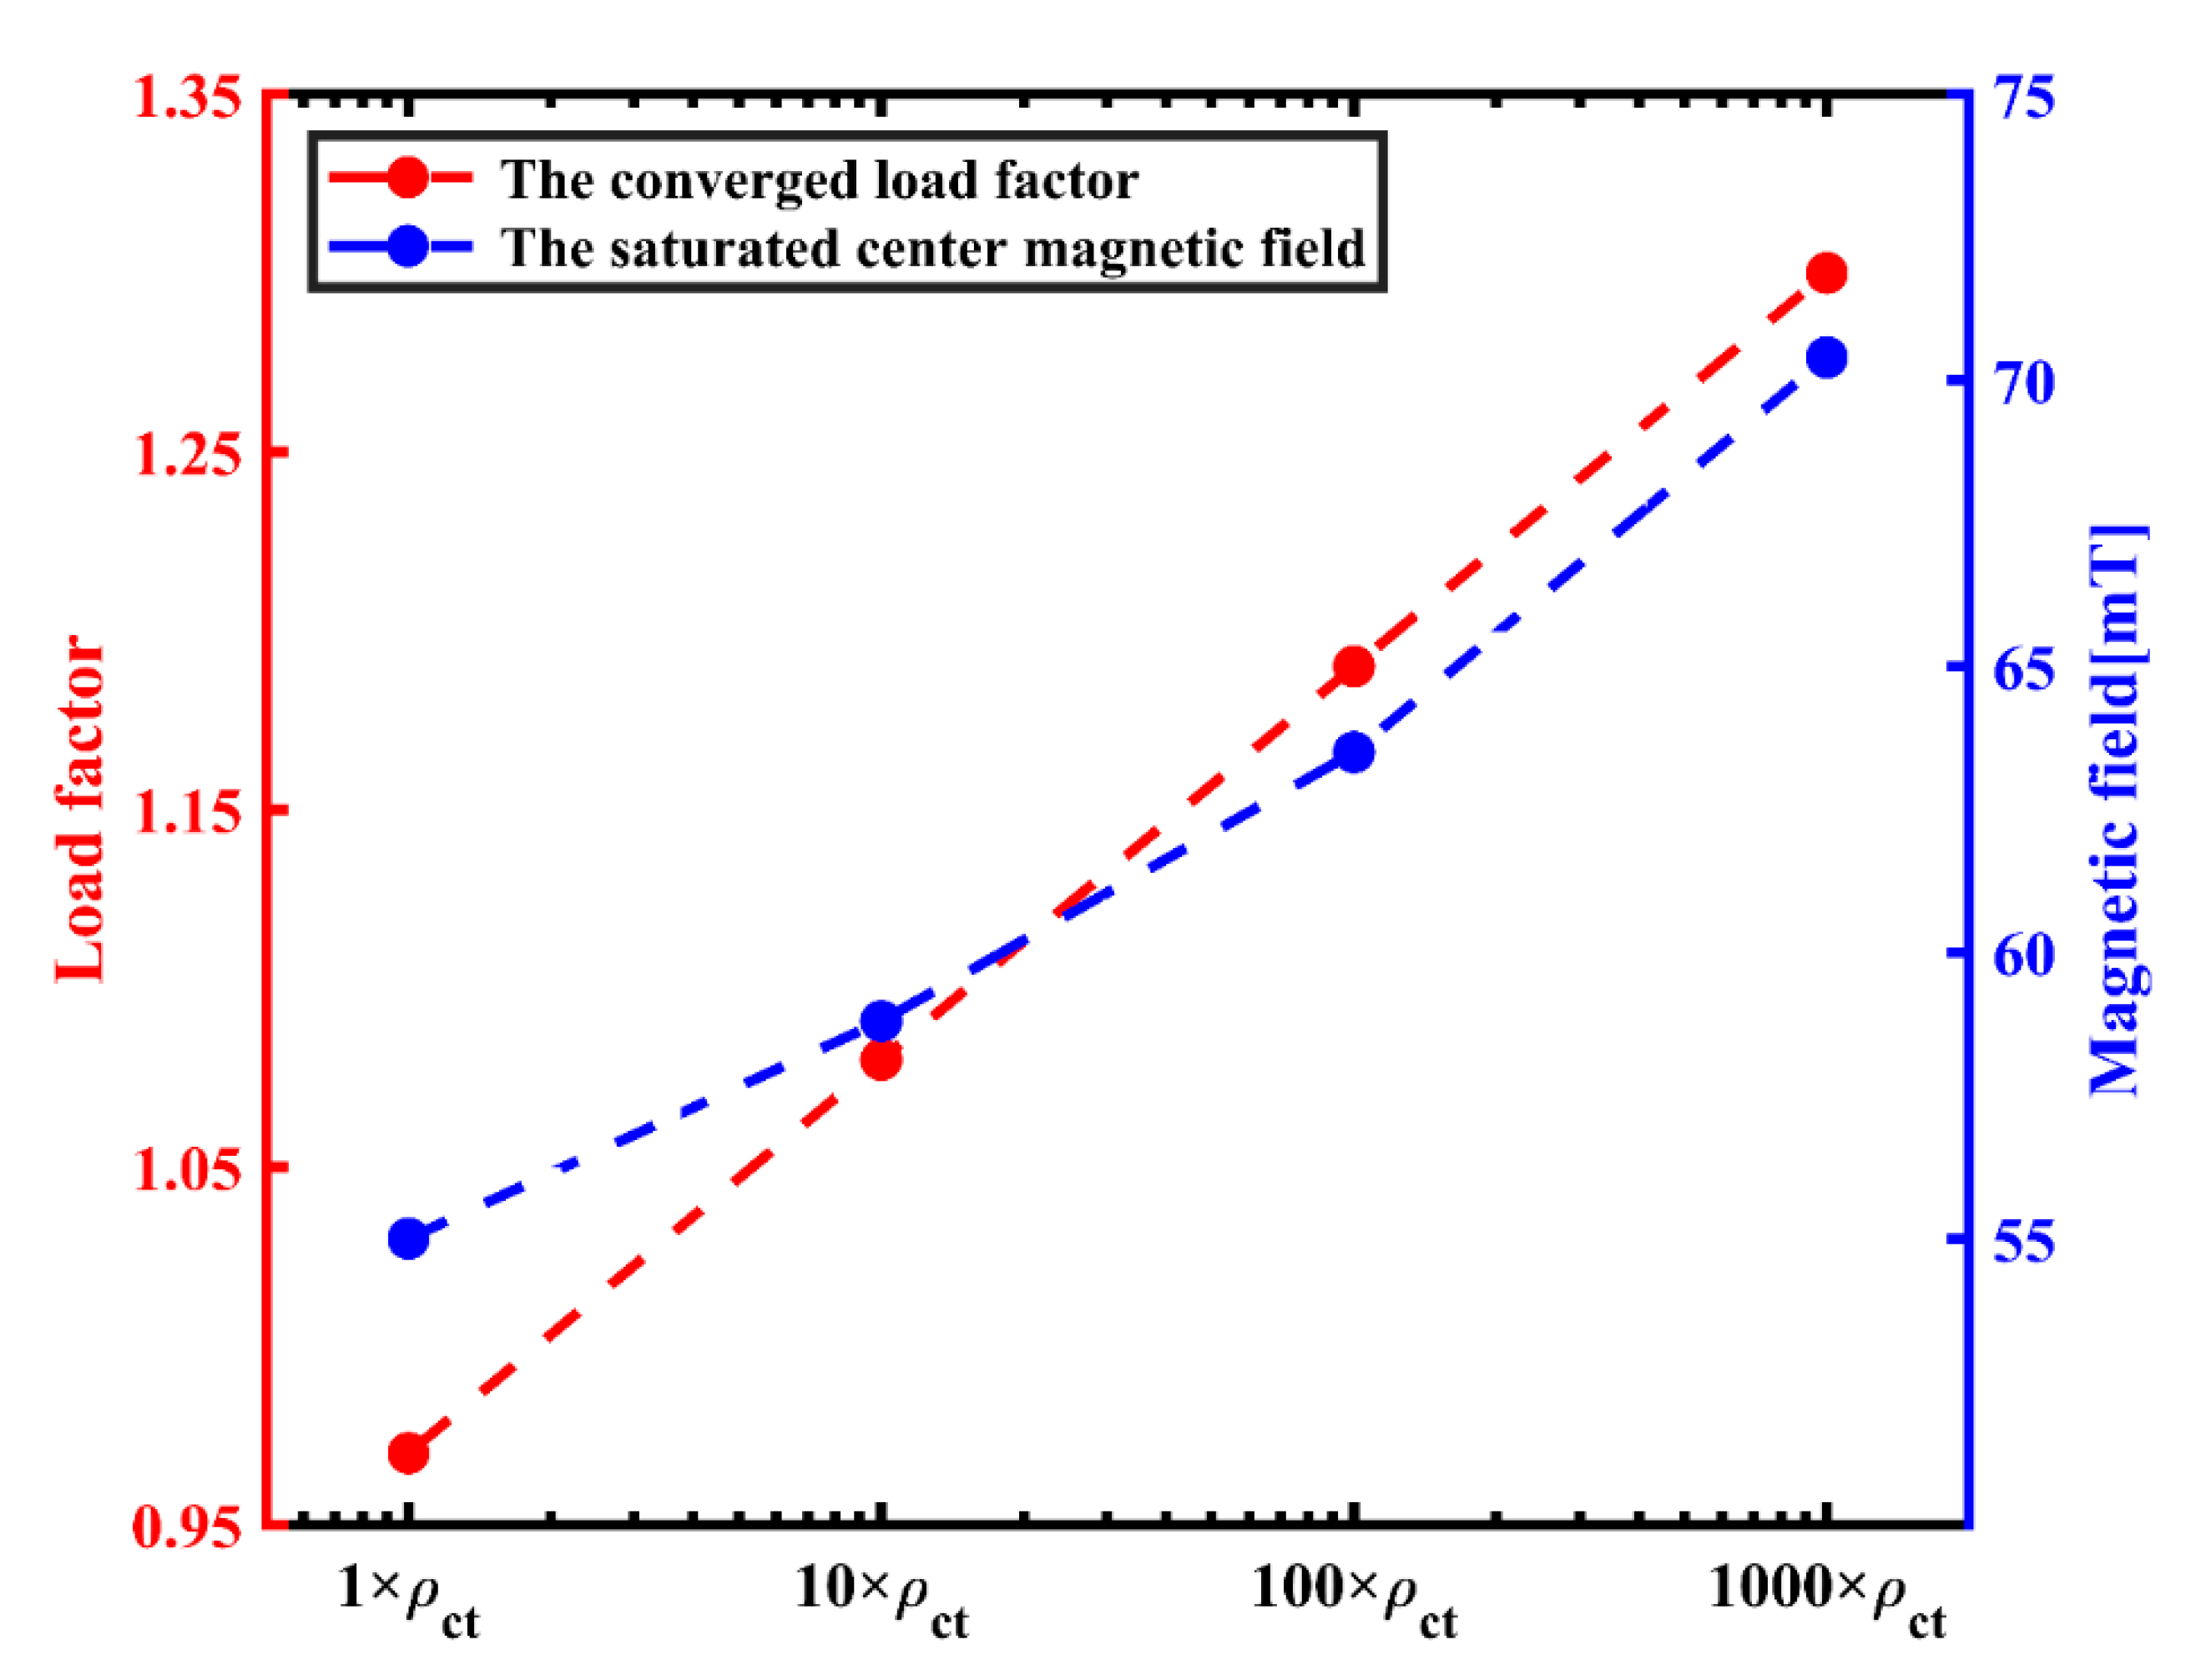
Thus, a concept defined as the converged load factor (CLF), which is the maximum load factor in the coil at the saturation state, was proposed to reflect an overall quasi-equilibrium mechanism between the index loss and contact resistivity existing in NI coils when operating at a reasonable overcurrent state, at which the NI coil reached its maximum potential to generate a stable magnetic field without heat accumulation and thermal degradation in an LN2 bath.
Figure 8 shows the simulated CLFs and saturated magnetic flux density of the NI–DP coils with respect to the contact resistivity. The simulated results demonstrate that for a given NI coil, the CLF can be lower than 1 with low contact resistivity. The high thermal stability of NI coils with low contact resistivity was at the expense of the time-consuming charging delay and also generated a lower saturated magnetic field, which underuses the full potential of HTS tapes [
15].
6. Conclusions
An ECG model coupled with magnetic field calculation and E–J power law of superconductors was adopted to further investigate the behavior of NI–DP coils during overcurrent charging. Experimentally, the entire process of magnetic-field saturation was consistent with the simulated results both in the magnetic flux density and voltage. The analysis of coil voltage signals and current distributions revealed the evolution of an overall quasi-equilibrium between the index loss and contact resistivity inside the coil, which drove the NI coil into a saturated state of the magnetic flux density in the coil’s axial direction.
The potential risk of irreversible quenching at both the innermost and outermost turns was also found to provide a possible explanation for the near-electrode burnout reports of NI coils during overcurrent excitations. Therefore, it is essential to strengthen the protection of the boundary turns of NI pancakes in HTS magnets, particularly under conduction cooling conditions.
A concept defined as the converged load factor (CLF), which is the maximum load factor in the coil at the saturation state, was proposed to quantitatively characterize the spiral-current-carrying capacity of NI coils during overcurrent conditions. The typical CLF values of NI coils with a turn-to-turn resistivity ranging from 6.47 to 6470 μΩ·cm2, which covers the range of typical NI coils, were calculated to be from 0.95 to 1.30. Although the CLF value was limited to around 1, the thermal stability of NI coils allowed the operation at a load factor evidently higher than insulated coils, which were unstable with the operation current close to their critical current in a real application system. From the viewpoint of achieving a higher magnetic field, turn-to-turn resistivity of NI coils as large as several thousands of μΩ·cm2 of was recommended, however, with compromised thermal stability and suggested to be applied in static conditions with lower risk of quenching.
In the future, the long-term operation of NI coils in overcurrent conditions and the detailed mechanism/transient behavior of the overcurrent during the elimination process of screening current should be studied.
Author Contributions
Conceptualization, W.W.; methodology, Y.G. and W.W.; software, Y.G.; validation, W.W. and Y.G.; formal analysis, W.W. and Y.G.; investigation, W.W. and Y.G.; resources, W.W. and Z.J.; data curation, Y.G.; writing—original draft preparation, Y.G. and W.W.; writing—review and editing, W.W. and Y.G.; visualization, Y.G.; supervision, Z.J.; project administration, W.W. and Z.J.; funding acquisition, W.W. All authors have read and agreed to the published version of the manuscript.
Funding
This research was funded by National Natural Science Foundation of China [51977130] and the APC was funded by the authors.
Data Availability Statement
The data presented in this study are available on request from the corresponding author. The data are not publicly available due to unfinished study on the data in future work.
Acknowledgments
The authors would like to thank Longbiao Wang from Shanghai Jiao Tong University for his help in the short sample test, and Xin Yu and Chao Zhang from Shanghai Superconductor Technology Co., Ltd. for their help in winding the test NI–DP coil.
Conflicts of Interest
The authors declare no conflict of interest.
References
- Hahn, S.; Park, D.K.; Bascunan, J.; Iwasa, Y. HTS Pancake Coils Without Turn-to-Turn Insulation. IEEE Trans. Appl. Supercond. 2011, 21, 1592–1595. [Google Scholar] [CrossRef]
- Tran, M.Q.; Elsisi, M.; Mahmoud, K.; Liu, M.K.; Lehtonen, M.; Darwish, M.M.F. Experimental Setup for Online Fault Diagnosis of Induction Machines via Promising IoT and Machine Learning: Towards Industry 4.0 Empowerment. IEEE Access 2021, 9, 115429–115441. [Google Scholar] [CrossRef]
- Elsisi, M.; Tran, M.Q.; Mahmoud, K.; Mansour, D.E.A.; Lehtonen, M.; Darwish, M.M.F. Towards Secured Online Monitoring for Digitalized GIS Against Cyber-Attacks Based on IoT and Machine Learning. IEEE Access 2021, 9, 78415–78427. [Google Scholar] [CrossRef]
- Lu, L.; Wu, W.; Yu, X.; Jin, Z. High-Temperature Superconducting Non-Insulation Closed-Loop Coils for Electro-Dynamic Suspension System. Electronics 2021, 10, 1980. [Google Scholar] [CrossRef]
- Weng, F.J.; Zhang, M.; Lan, T.; Wang, Y.W.; Yuan, W.J. Fully superconducting machine for electric aircraft propulsion: Study of AC loss for HTS stator. Supercond. Sci. Technol. 2020, 33, 104002. [Google Scholar] [CrossRef]
- Ma, G.; Gong, T.; Zhang, H.; Wang, Z.; Li, X.; Yang, C.; Liu, K.; Zhang, W. Experiment and Simulation of REBCO Conductor Coils for an HTS Linear Synchronous Motor. IEEE Trans. Appl. Supercond. 2017, 27, 5201805. [Google Scholar] [CrossRef]
- Brittles, G. Recent progress in HTS magnet development at Tokamak Energy. In Proceedings of the 9th Cryogenic Cluster Day, Rutherford Appleton Laboratory, Oxfordshire, UK, 24 May 2019. [Google Scholar]
- Li, Y.; Park, D.; Yan, Y.; Choi, Y.; Lee, J.; Michael, P.C.; Chen, S.; Qu, T.; Bascuñán, J.; Iwasa, Y. Magnetization and screening current in an 800 MHz (18.8 T) REBCO nuclear magnetic resonance insert magnet: Experimental results and numerical analysis. Supercond. Sci. Technol. 2019, 32, 105007. [Google Scholar] [CrossRef]
- Kim, H.-W.; Hur, J.; Kim, S.-W.; Ha, D.-W.; Ko, R.-K.; Hong, J.-P.; Kim, J.H.; Kim, H.M.; Joo, J.-H.; Kim, S.-B.; et al. Electrical Characteristic Analysis According to Contact Resistance Between Turns of HTS Coil. IEEE Trans. Appl. Supercond. 2016, 26, 4601504. [Google Scholar] [CrossRef]
- Kim, H.W.; Jo, Y.S.; Kim, S.W.; Kim, H.M.; Jeong, J.S.; Hong, J.P.; Hur, J. Determining the Operating Current of No-Insulation Field Coils in HTS Generators. IEEE Trans. Magn. 2015, 51, 9000404. [Google Scholar] [CrossRef]
- Yanagisawa, Y.; Sato, K.; Yanagisawa, K.; Nakagome, H.; Jin, X.; Takahashi, M.; Maeda, H. Basic mechanism of self-healing from thermal runaway for uninsulated REBCO pancake coils. Phys. C Supercond. Its Appl. 2014, 499, 40–44. [Google Scholar] [CrossRef]
- Kim, J.M.; Kim, J.C.; Kim, Y.G.; Hong, S.J.; Park, S.J.; Kim, J.H.; Kim, H.M.; Choi, Y.S.; Lee, H.G. Investigation about the effects of metal-clad winding on the electromagnetic characteristics of the GdBCO racetrack coils in a time-varying magnetic field. Results Phys. 2018, 11, 400–405. [Google Scholar] [CrossRef]
- Kim, J.; Yoon, S.; Cheon, K.; Shin, K.H.; Hahn, S.; Kim, D.L.; Lee, S.; Lee, H.; Moon, S.H. Effect of Resistive Metal Cladding of HTS Tape on the Characteristic of No-Insulation Coil. IEEE Trans. Appl. Supercond. 2016, 26, 4601906. [Google Scholar] [CrossRef]
- Wang, R.C.; Ma, G.T.; Zhou, P.B.; Gong, T.Y.; Li, S.L. Thermo-electromagnetic modeling of coated superconductor coils with metal insulation. Supercond. Sci. Technol. 2021, 34, 115017. [Google Scholar] [CrossRef]
- Wang, X.D.; Wang, T.; Nakada, E.; Ishiyama, A.; Itoh, R.; Noguchi, S. Charging Behavior in No-Insulation REBCO Pancake Coils. IEEE Trans. Appl. Supercond. 2015, 25, 4601805. [Google Scholar] [CrossRef]
- Wang, Y.; Song, H.; Xu, D.; Li, Z.Y.; Jin, Z.; Hong, Z. An equivalent circuit grid model for no-insulation HTS pancake coils. Supercond. Sci. Technol. 2015, 28, 045017. [Google Scholar] [CrossRef]
- Wang, T.; Noguchi, S.; Wang, X.; Arakawa, I.; Minami, K.; Monma, K.; Ishiyama, A.; Hahn, S.; Iwasa, Y. Analyses of Transient Behaviors of No-Insulation REBCO Pancake Coils During Sudden Discharging and Overcurrent. IEEE Trans. Appl. Supercond. 2015, 25, 4603409. [Google Scholar] [CrossRef]
- Liu, X.Y.; Xie, Z.T.; Ning, F.P.; Wang, Y.B.; Wang, X.W.; Zhang, G.Q.; Zhao, L.; Xu, Q.J.; Zhu, Z. Preliminary Study on Different Winding Processes of ReBCO Coils. IEEE Trans. Appl. Supercond. 2020, 30, 4603406. [Google Scholar] [CrossRef]
- Liu, X.Y.; Zhu, Z.A.; Ning, F.P.; Xie, Z.T.; Tong, X.Y.; Zhang, G.Q.; Xu, Q.J.; Zhao, L.; Zhao, W.; Hou, Z.L.; et al. The Research on No-Insulation ReBCO Racetrack Coil. IEEE Trans. Appl. Supercond. 2019, 29, 4602305. [Google Scholar] [CrossRef]
- Lai, L.F.; Gu, C. AC loss calculation in REBCO coils or stacks by solving the equation of motion for current using an integration approach. Supercond. Sci. Technol. 2021, 34, 015003. [Google Scholar] [CrossRef]
- Liu, D.H.; Li, D.K.; Zhang, W.W.; Yong, H.D.; Zhou, Y.H. Electromagnetic-thermal-mechanical behaviors of a no-insulation double-pancake coil induced by a quench in the self field and the high field. Supercond. Sci. Technol. 2021, 34, 025014. [Google Scholar] [CrossRef]
- Durmus, F.; Karagol, S. Mutual Inductance Calculation Formula for Planar Square Coils. In Proceedings of the 2018 2nd International Symposium on Multidisciplinary Studies and Innovative Technologies, IEEE, Ankara, Turkey, 19–21 October 2018. [Google Scholar]
- Liu, Y.Z.; Ou, J.; Gyuraki, R.; Schreiner, F.; de Sousa, W.T.B.; Noe, M.; Grilli, F. Study of contact resistivity of a no-insulation superconducting coil. Supercond. Sci. Technol. 2021, 34, 035009. [Google Scholar] [CrossRef]
- Sayed, A.M.; Abouelatta, M.A.; Badawi, M.; Mahmoud, K.; Lehtonen, M.; Darwish, M.M.F. Novel accurate modeling of dust loaded wire-duct precipitators using FDM-FMG method on one fine computational domains. Electr. Power Syst. Res. 2022, 203, 107634. [Google Scholar] [CrossRef]
- Abouelatta, M.A.; Ward, S.A.; Sayed, A.M.; Mahmoud, K.; Lehtonen, M.; Darwish, M.M.F. Fast Corona Discharge Assessment Using FDM integrated With Full Multigrid Method in HVDC Transmission Lines Considering Wind Impact. IEEE Access 2020, 8, 225872–225883. [Google Scholar] [CrossRef]
- Grilli, F.; Sirois, F.; Zermeno, V.M.R.; Vojenciak, M. Self-Consistent Modeling of the Ic of HTS Devices: How Accurate do Models Really Need to Be? IEEE Trans. Appl. Supercond. 2014, 24, 8000508. [Google Scholar] [CrossRef]
- Rostila, L.; Lehtonen, J.; Mikkonen, R.; Souc, J.; Seiler, E.; Melisek, T.; Vojenciak, M. How to determine critical current density in YBCO tapes from voltage-current measurements at low magnetic fields. Supercond. Sci. Technol. 2007, 20, 1097–1100. [Google Scholar] [CrossRef]
- Wang, Y.; Chan, W.K.; Schwartz, J. Self-protection mechanisms in no-insulation (RE)Ba2Cu3Oxhigh temperature superconductor pancake coils. Supercond. Sci. Technol. 2016, 29, 045007. [Google Scholar] [CrossRef]
- Chan, W.K.; Masson, P.J.; Luongo, C.; Schwartz, J. Three-Dimensional Micrometer-Scale Modeling of Quenching in High-Aspect-Ratio YBa2Cu3O7-δ Coated Conductor Tapes—Part I: Model Development and Validation. IEEE Trans. Appl. Supercond. 2010, 20, 2370–2380. [Google Scholar] [CrossRef]
- Wang, X.; Hahn, S.; Kim, Y.; Bascunan, J.; Voccio, J.; Lee, H.; Iwasa, Y. Turn-to-turn contact characteristics for an equivalent circuit model of no-insulation ReBCO pancake coil. Supercond. Sci. Technol. 2013, 26, 035012. [Google Scholar] [CrossRef]
| Publisher’s Note: MDPI stays neutral with regard to jurisdictional claims in published maps and institutional affiliations. |
© 2021 by the authors. Licensee MDPI, Basel, Switzerland. This article is an open access article distributed under the terms and conditions of the Creative Commons Attribution (CC BY) license (https://creativecommons.org/licenses/by/4.0/).


