Article

Performance Analysis of a Dynamic Virtual Machine Management Method Based on the Power-Aware Integral Estimation

1
Department of Informatics and Software Engineering, Igor Sikorsky Kyiv Polytechnic Institute, 37, Prosp. Peremohy, 03056 Kyiv, Ukraine
2
Department of Automatic Control and Computer Science, Cracow University of Technology, Warszawska 24, 31-155 Cracow, Poland
*
Author to whom correspondence should be addressed.
Electronics 2021, 10(21), 2581; https://doi.org/10.3390/electronics10212581
Submission received: 12 September 2021 / Revised: 16 October 2021 / Accepted: 19 October 2021 / Published: 22 October 2021

Abstract

:
The latest cloud resource management research has revealed that virtual machine (VM) consolidation allows for effectively managing the physical resources of cloud data centers. However, a tremendous waste of power and physical resources has been pointed as one of the research challenges related to the development of new methods for VM management in a cloud data center in order to deliver a wide range of IT services to clients effectively. This paper investigates a problem of power-aware VM consolidation under dynamic workloads, uncertainty, and a changing number of VMs. For this purpose, the authors propose a dynamic VM management method based on a beam search that takes into account four types of resources (CPU, memory, network throughput, and storage throughput) and six quality metrics. Optimal beam search algorithm parameters for the defined problem are determined using a new power-aware integral estimation method. The SLA violation minimization allows significant improvement of SLA quality metrics, accompanied by the decreased number of VM migrations and slight deterioration in the power consumption. The proposed method is evaluated using common widespread hardware configurations and Bitbrains workload traces. The experiments show that the proposed approach can ensure the efficient use of cloud resources in terms of SLA violation and the number of VM migrations.

1. Introduction

A multicloud strategy and a hybrid cloud strategy dominated last year [1], and the IaaS cloud service model remains the most prevalent to manage performance, quality of services, and power consumption in cloud data centers. A wide range of modern information services and applications are provided by cloud data centers represented by complex systems to deliver high-performance and fault-tolerant IT services for users and tenants using a utility computing concept [2].
Still, three main objectives for effective management of data center resource provisioning are (i) ensuring the service level agreement (SLA) between a cloud service provider and a user, (ii) reducing the power consumption of data centers, and (iii) reducing the operational costs of managing data center services.
An effective cloud data center resource utilization is mainly achieved by virtual machine (VM) consolidation, which determines how physical machine (PM) resources are allocated to run many VM instances to guarantee QoS requirements and reduce the total number of PMs used. VMs with different resource demands are usually placed in the same PM using the oversubscription technique, leading to resource contention, poor QoS, and, consequently, SLA violations. Nevertheless, data center administrators continue accepting VM consolidation methods despite all the drawbacks, such as performance and QoS degradation. Therefore, current issues in VM management schemas lead to the development and improvement of VM consolidation, considering the heterogeneity of resources, live VM migration, network and storage parameters, deployment platforms, workload patterns, and resource usage forecasting.
In the production data center, a mapping between VMs and PMs is usually performed with oversubscription according to the VM’s required resource capacity without considering long-term utilization. Moreover, the number of VMs and the intensity of VM workloads are continuously changing, requiring adaptive methods for dynamic VM management starting with a new VM placement request.
A VM consolidation problem is considered a bin-packing problem, where N numbers of items (virtual machines) with different sizes in a multidimensional resource space are placed on M numbers of bins (physical machines) to satisfy multiple objectives simultaneously. In this paper, the authors consider two: power consumption minimization and SLA violation minimization. The bin-packing problem is compounded by the variation of the item’s properties, requests to deploy new items, and reassigning existing items to other bins. As clients request services and submit jobs to be processed by one or multiple VMs, the workload in a cloud data center can change significantly over time. It requires solving an optimization problem to place new VMs and reallocate active VMs periodically using an asynchronous mode or after a defined number of steps. Other constraints while consolidating virtual machines are a restriction of the number of concurrent VM migrations per PM, a restriction of the PM’s resource utilization, and a limitation of the number (or time) of SLA violations [3].
This paper investigates a problem of SLA-aware VM consolidation under dynamic workloads, uncertainty, and the changing number of VMs. The proposed method of dynamic VM management consists of two stages, which are performed in each time interval. The first stage of the method is determining overloaded and underloaded PMs. The second stage of the method is choosing VMs for migration and placement as well as running a migration plan using a beam search algorithm proposed by the authors in [4]. The migration plan is executed by constructing a tree of possible target PMs for VM placement, which considers no more than n vertices, where n is a beamwidth. Each candidate vertex has an estimate by which the vertices are compared, so the best n vertices are selected.
To rate VM consolidation schemas and approaches on the infrastructure level, the authors define six quality metrics related to SLA violations, power consumption, and VM migrations. To estimate beam search algorithm parameters, the authors propose an integral estimation method (IEM) that allows determining optimal power consumption parameters, considering the minimum area under each curve that approximates a specific chart. To conduct optimization, the authors define two objectives: a minimization of PMs’ uptime (the power consumption minimization, PCM) and a minimization of the number of SLA violations (the SLA violation minimization, SLAVM), aiming to determine model parameters for both objectives separately. The optimization results allow for obtaining some scientific insights into VM consolidation approaches regarding the thresholds for the specified resource utilization, the minimization objectives, SLA violations, a workload intensity on a specific resource, and a complementary VM placement.
The current study extends the author’s previous paper [5] to the particular case of dynamic VM management based on the modified model and the modified VM consolidation method, resulting in determining different parameters of the proposed model and their effect on the quality metrics. As shown earlier, the approach presented in [5] outperforms a basic best-fit heuristic regarding the SLA violation, the number of active physical machines, and the number of VM migrations.
In the research literature, the problem of VM management in cloud environments is often referred to as a multiobjective multidimensional bin-packing problem. Exploring VM management as a general instance of the initial VM placement and the consolidation of active VMs is an ongoing research track [3,6,7]. It has been studied in the literature from a variety of perspectives, including the proactive resource allocation strategy [8], the use of a responsive live migration approach for high-throughput computing (HTC) systems with various migration policies as a fault-tolerance mechanism [9], the multiobjective genetic algorithm and Bernoulli simulation for the minimization of the number of active PMs [10], the cloud infrastructure resource allocation framework based on reinforcement learning mechanism [11], and setting upper and lower thresholds in VM consolidation schemas [12], to mention a few.
In the literature, multiobjective VM consolidation schemes are the most commonly used approaches to manage cloud resources under uncertainty [6,7,13,14]. However, despite the numerous research studies, there is a lack of research results regarding the effect of different parameters of VM management schemes on quality metrics in a dynamic mode (i.e., considering new VM requests, the different VM lifetime, the dynamic compute-intensive, memory-intensive, storage-intensive, and network-intensive workloads).
With the aim of minimizing the number of active PMs and maximizing the resource utilization, the framework based on the multiobjective genetic algorithm and Bernoulli simulation was proposed in [10]. Thus, two objectives were combined into one by the proposed weighted sum function as a fitness function of the genetic algorithm. However, the proposed framework considers only CPU and memory utilization and does not consider other PM resources and VM migrations.
In [14], extensive lab experiments and simulations with different controllers and different workloads were conducted using 6 identical servers and 90 VMs. The authors proposed combining placement controllers with periodic reallocations to achieve the highest energy efficiency in dynamic environments. The combinations of demand-based placement controllers with reallocation controllers lead to fewer VM migrations than reservation-based placement controllers and lower server demand. However, the proposed algorithm takes into account only CPU and memory monitoring data as an input to the controller and does not consider other PM resources. Besides, the authors used the homogenous PM configuration during the experiments.
To optimize VM placement in dynamic cloud data centers, the authors of [11] proposed an intelligent learning approach based on reinforcement learning (RL). The proposed RL approach learns optimized VM consolidation decisions under uncertainty of the incoming workload. However, the proposed algorithm does not account for the influence of the VM’s memory changes on the migration overhead.
In [9], the authors proposed VM live migration as a fault-tolerance mechanism in HTC systems. The proposed responsive live migration approach for HTC systems with various migration policies demonstrates low performance and energy impact. It saves approximately 75% of the system wasted energy due to job evictions by user interruptions, where migration is not employed as a fault-tolerance mechanism. The proposed HTC-Sim simulation framework has been used for trace-driven simulations to explore the impact of the policies on performance and energy.
The authors of [15] proposed the power-aware and performance-guaranteed VM placement method by developing the algorithm based on ant colony optimization. Based on the nonlinear power model of the PM and VM performance model, the authors formulated the VM placement problem as a biobjective optimization problem, which tries to minimize PM power consumption and guarantee VM performance. At the same time, storage utilization and VM migration overhead are not considered in the proposed models.
The proactive resource allocation method based on the adaptive prediction of the resource requests was proposed in [8]. The method is based on the prediction of resource requests and the multiobjective resource allocation optimization model, which alleviates the latency of the resource allocation and balanced utilization of the CPU and memory of a PM. However, the proposed approach considers only CPU and memory utilization and does not consider other PM resources. Furthermore, the proposed method does not account for VM migration and VM consolidation.
The first issue of many VM consolidation schemes is employing strategies aiming to optimize resource allocation based only on CPU utilization [11,12,16,17]. However, application workloads inside VMs can also be compute-intensive, memory-intensive, storage-intensive, and network-intensive, which can be a significant challenge to such schemes. The second issue is using outdated or unbalanced hardware configurations used for simulating data center PMs [10,11,12]. However, the modern PMs installed in data centers have very high performance and can host hundreds VMs. Therefore, evaluation results obtained by simulating data centers using PMs and VMs that differ little in performance are not helpful for real data centers. The third issue is using power consumption minimization and minimization of the number of migrations as the main objective function while minimizing the number of SLA violations according to the residual principle [9,14,15]. However, a minimization of power consumption, including those based on adaptive thresholds, is always accompanied by aggressive consolidation, which always results in sufficient SLA violations and an increasing number of switching PMs between the active and sleep modes. Besides, with respect to this, it is questionable whether an adaptive threshold in VM management schemes is suitable for modern data centers compared with static thresholds.
In contrast to prior VM management schemes reported in the literature, in this paper, the authors are improving the client’s experience by minimizing SLA violations, thereby ensuring maximum service uptime for clients, with the concern of minimizing the number of VM migrations while reducing power consumption. Besides, heterogeneous PMs with typical widespread hardware configurations are used for simulations applying real workload traces as input data. The proposed method considers all SLA violations on the infrastructure level.
The remaining parts of the paper continue with Section 2, where the authors develop the proposed dynamic VM management method. Section 3 describes the simulation environment, the simulation settings, the model parameters, and the optimization results using two objectives. Section 4 summarizes the revealed findings and scientific insights. Finally, Section 5 presents conclusions with remarks on future work.

2. Materials and Methods

The System Model and Main Objectives

The cluster of cloud data centers is composed of M PMs and N VMs, N , M   . Each PM has a fixed amount of hardware resources, such as a CPU measured in MHz, a RAM measured in GB, a storage measured in IOPS (input/output operations per second), and a network throughput measured in Gbps. VM resource requirements can change over time. During the time interval (also called a management step), the number of PMs is constant, but the numbers of VMs and VM resource requirements change.
There are four types of resources in the model denoted by k { C P U , R A M , I O , N E T } . The required resource k capacity of the j-th VM denoted by c j k is determined by a workload served by a VM. The resource k capacity of the i-th PM denoted by C i k is determined by the PM hardware configuration. The utilization of resource k of the i-th PM is denoted by u i k . The number of VMs running on the i-th PM is denoted by v i . The variables c j k and u i k can be changed during the VM lifetime and the VM migration.
The rest of the variables of the model are defined as follows: w k [ 0 , 1 ] is the weight of resource k, r max k is the largest value of the required capacity of each resource k among VMs for normalization, rj is the required resource capacity of the j-th VM, R max k is the largest value of the capacity of each resource k among PMs for normalization, Ri is the existing resource capacity of the i-th PM, ui is the utilization of resources of the i-th PM, T k [ 0 , 1 ] is the threshold of the available resource k of the i-th PM, D k [ 0 , 1 ] is the desired workload on the resource k, L k [ 0 , 1 ] is the threshold of the available resource k of the i-th PM that is determined as underloaded, Q k ( T k , 1 ] is the threshold of the available resource k of the i-th PM that can host migrating VMs, vi is the number of hosted VMs of the i-th PM, di is the deviation from the desired utilization of the i-th PM, d i k is the deviation from the desired utilization level of the resource k, f k is the total number of resources available for all migrations, c m k is the capacity of the resource k needed for VM migration, θ is an assessment of the VM migration possibility, A is a set with overloaded PMs, W is a set with underloaded PMs that is going to be set to sleep mode, B is a set of PMs that can accept migrating VMs, S is the total simulation time measured as the total number of simulations steps, and t = 1 , S ¯ is the management step.
All PMs are subdivided into three sets: A, W, and B, A + W + B = M , A B = , A W = , B W = . The proposed method tries to switch PMs from set W of underloaded PMs to the sleep mode by migrating all their VMs to PMs from set B and offloads PMs of set A of overloaded PMs. For each PM from sets A and W, the proposed method searches for PM from set B, which can accept VM migrations from overloaded and underloaded PMs. Then, all PMs of set W can be switched to the sleep mode when all their VMs migrate to PMs of set B.
The defined variables are used for the dynamic model of a data center during each simulation step (i.e., the interval between time t and t + 1). A number of PMs operating at the current simulation step t is defined as M P M ( t ) = A + W . The SLA violation is measured in time intervals when a resource contention is observed in the proposed model. An SLA violation occurs when i = 1 , M ¯ , k { C P U , R A M , N E T , I O } : u i k C i k during one-time interval (management step t), namely, when the total demand for the resource k exceeds the available resource capacity.
The authors define two objectives for the problem. First, the problem of a power consumption minimization can be formulated as follows:
minimize   t = 1 , S M P M ( t ) .
Second, the problem of an SLA violation minimization can be formulated as follows:
minimize   t = 1 , S ( i = 1 , M V i ( t ) ) ,
subject to i = 1 , M ¯ : V i ( t ) = 1 , k u i k C i k , 0 , otherwise . .

3. Results

3.1. Dynamic VM Management Method

This paper extends the author’s previous work [5] by modifying the VM selection stage, defining the main objectives, and exploring model parameters. VM selection is performed by choosing for migration a VM with minimal memory modification rate and minimum utilization of memory (RAM). A VM with a minimal memory modification rate is determined by considering the number of storage IO operations. A hypothesis is the smaller the number of storage IO operations is, the lower the memory modification rate is. In [18,19], experiments show that reducing the memory modification rate can significantly reduce the VM migration time, which in turn reduces a PM’s CPU utilization.
The proposed method provides consolidation of new and active VMs intending to minimize the number of active PMs and decrease the number of SLA violations. VM migration occurs due to PM overloading on one or more resources. The overloading of PM leads to resource contention, resulting in poor QoS and SLA violations. In turn, resource contention always leads to increased response time and SLA violation at the application level [20,21,22,23]. When the PM’s CPU utilization increases to 100%, the latency increases significantly, hosted VMs experience performance degradation, and their application performance becomes unpredictable.
The idea of the proposed dynamic VM management method is to place new VMs and consolidate active VMs, applying migrations using a beam search algorithm. The previous results [4,5] show that it is possible to consider the preferred VM migration plan using a specified objective since the best VM migration schema in the current step of the algorithm is not always improving in objective function value in the following steps. Therefore, the beam search algorithm can find a solution very close to the optimal one, given the objective of varying complexities [4].
Thus, in each time interval, the proposed method is composed of two stages. In the first stage of the method, three sets of PMs are created, namely, A, B, and W. In the second stage, the method performs VM consolidation by migrating determined VMs from PMs of sets A and B to PMs of set B. A set of consolidating VMs, U , contains migrating VMs and new VMs. VM migration is needed to either offload an overloaded PM or switch an underloaded PM to the sleep mode, migrating all VMs to other PMs.

3.1.1. The First Stage of the Method

The first stage of the method is a source PM selection for determining overloaded and underloaded PMs. Sets A and B are obtained due to the first stage of the method to further determine the migration plan in the second stage.
1. Set A of overloaded PMs is composed of PMs satisfying the following condition:
i = 1 , M ¯ , k { C P U , R A M , N E T , I O } : C i k u i k C i k < T k ,
where C i k is the resource k capacity of the i-th PM, u i k is the utilization of resource k of the i-th PM, and T k ( 0 , 1 ] is the threshold of the available resource k of the i-th PM. If condition (1) is satisfied, the i-th PM is overloaded and added to set A. The main reason behind condition (1) is to avoid SLA violations.
2. Set B of PMs can accept inbound VM migrations, and the new VM placement is composed of PMs satisfying the following condition:
i = 1 , M ¯ , i A , k { C P U , R A M , N E T , I O } : C i k u i k C i k > Q k ,
where C i k is the resource k capacity of the i-th PM, u i k is the utilization of resource k of the i-th PM, and Q k ( T k , 1 ] is the threshold of the available resource k of the i-th PM that can accept migrating and new VMs.
3. Set A is sorted in descending order of a deviation from the desired workload. The deviation is defined as follows: i = k w k i k R max k , i A , where i k = u i k C i k D k , k is the deviation of the utilization of resource k, D k ( 0 , 1 ) is the desired workload on resource k, u i k is the utilization of resource k of the i-th PM, w k [ 0 , 1 ] is the weight of resource k, and R max k is the largest capacity of resource k for normalization.
4. Underloaded PMs are determined among elements of set B. All PMs of set B that satisfy condition (2) are moved to set W.
i B , k { C P U , R A M , N E T , I O } : u i k C i k > L k ,
where L k ( 0 , 1 ) is the threshold of the available resource k of the i-th PM, which is determined to be underloaded.
5. Set W is sorted in descending order of the utilization of resources of PMs denoted by ui, and then set W is sorted in descending order of the number of hosted VMs, vi. The utilization of resources of the i-th PM is defined as follows: u i = k w k u i k R max k , i W .
6. Set B is sorted in descending order by k C i k u i k c j k C i k , i B , j = 1 , N ¯ .
It is necessary to consider all resources needed for VM consolidation and to determine the total amount of resources available for all migrations and placements. During VM migration, the source and destination PMs experience additional resource usage. For example, VM migration utilizes about 20% CPU of each PM [20,24]. Therefore, the total amount of resources available for all migrations is defined as follows: f k = ( 1 T k ) i B ( C i k u i k ) c m k i A , i W ( v i ) , where c m k is a capacity of resource k needed for VM migration, vi is the number of hosted VMs on the i-th PM, C i k is the capacity of resource k of the i-th PM, u i k is the utilization of resource k of the i-th PM, and T k ( 0 , 1 ] is the threshold of the available resource k of the i-th PM. The utilization of resource k by one inbound or outbound VM migration on the i-th PM is denoted by u i m k .
7. The transformation is applied for each i-th PM of set A as follows:
f k = f k u i k ,    u i k < f k , f k + ( C i k u i k ) ( 1 T k ) , otherwise .
Besides, if u i k f k , then the i-th PM is moved from set A to set B.

3.1.2. The Second Stage of the Method

The second stage of the method is to run a migration plan using a beam search algorithm proposed by the authors in [4]. Set U of migrating VMs comprises VMs of overloaded PMs, new VMs to be deployed, and VMs of underloaded PMs. The second stage is performed by applying the beam search algorithm for each PM i of sets A and W as follows:
1. VMs of each PM of sets A and W are sorted in ascending order by the used resource capacity indicator rj defined as follows:
r j = k w k c j k r max k ,
where r j is a required resource capacity indicator of the j-th VM, k { C P U , R A M , N E T , I O } , w k [ 0 , 1 ] is the weight of resource k, c j k is the current demand of resource k of the j-th VM, and r max k is the largest value of the required demand of each resource k among VMs for normalization.
2. The first VM is added with minimal utilization of resource k = IO and minimum RAM size used to set U .
3. The possibility of the migration of each VM of set U to the first PM in the sorted list B is checked.
4. N possible migrations with the highest value of a variable, θ , defined as θ = k w k θ k θ max k from all possible migrations are selected, where w k [ 0 , 1 ] is the weight of resource k, and θ k is defined as follows:
θ k = u i k < L k C i k : L k C i k u i k max u i k L k C i k : D k C i k u i k max ,
where L k ( 0 , 1 ) is the threshold of the available resource k of the i-th PM determined to be underloaded, C i k is the resource k capacity of the i-th PM of set B, D k ( 0 , 1 ) is the desired workload on resource k, and u i k is the utilization of resource k of the i-th PM of set B.
Condition (3) guarantees that all PMs can accept inbound VM migrations with sufficient free resource capacity. The value u i k also includes the utilization caused by previous VM migrations started at previous time intervals and continued in the current time interval. For overloaded PMs, when the PM is turned on, the PM startup penalty is subtracted from θ . In the case of underloaded PMs, such a penalty is not applied. However, the number of simultaneous VM migrations per PM is not taken into consideration.
Additionally, it is assumed that a PM can awake from the sleep mode between management steps t and t + 1. As shown in the following subsection, the time between management steps is 300 s. Modern dynamic power management methods with a server processor sleep state(s) allow a relatively fast transition of a PM to the active mode. Thus, it is assumed that a PM has time to switch to the active mode for inbound VM migrations or to place new VMs.
VM migrations are performed until the following conditions are satisfied: (i) fulfillment of condition (1) for PMs of set B; (ii) for underloaded PMs, vi = 0, i W ; (iii) i B , k { C P U , R A M , N E T , I O } : u i k Q k ; and (iv) U = . If the migration conditions are violated, the migration of the remaining VMs of set U is not performed, and correspondent PMs remain in the previous state.
Thus, the main models’ parameters to be evaluated using PCM and SLAVM objectives are n, Tk, Dk, Lk, and Qk. Such assumption is made considering the data center environment, resource constraints, and dynamic nature of processes. Analysis of the research literature shows that the specified parameters can sufficiently influence the quality metrics of the management method.

3.2. Evaluation of Simulation Results

3.2.1. The Simulation Environment

To evaluate the proposed method, the authors used Bitbrains trace data available for download from the Grid Workloads Archive at http://gwa.ewi.tudelft.nl/fileadmin/pds/trace-archives/grid-workloads-archive/datasets/gwa-t-12/fastStorage.zip (accessed on 20 October 2021) [25]. Four types of resources considered in Section 3 ensure the use of Bitbrains workload traces as input data for simulations. The simulation environment and the method of dynamic VM management are implemented as a software toolkit in C#. The experiments were conducted on a Windows 10 Pro computer with an Intel i7-3632QM processor and 8 GB RAM.
The software toolkit provides various types of simulation and allows for determining optimal model parameters for the power consumption minimization and the SLA violation minimization. It uses a multilayered architecture and a domain-driven design approach. It consists of: (i) the database layer providing interfaces for obtaining data from the database with Bitbrains traces, (ii) the layer of the main logic of the method of dynamic VM management, and (iii) the presentation layer providing interfaces for the console output, logging results into text files and generating MS Excel files with simulation results.
In each simulation, the authors used 20 heterogeneous PMs with the parameters as presented in Table 1. Besides, the authors used Bitbrains traces of 1250 VMs with different amounts of the requested CPU (in MHz) and requested memory (in MB).
Detailed statistical metrics of each Bitbrains trace are reported in [26]. The number of VMs is changed during simulation, as shown in Figure 1, according to data in Bitbrains workload traces [25]. Moreover, some VMs are provisioned in different time intervals and considered during the simulation as new VMs. Thus, each VM has its own runtime.
Bitbrains workload traces represent resource usage of Web, database, or application servers by 1250 VMs that belong to 44 different classes [26]. Each VM trace file contains data about CPU, memory, storage, and network interface usage.
The cumulative distribution functions (CDFs) of the requested resources per VM are shown in Figure 2 [5]. Figure 2 (left) shows the CDF of the amount of CPU frequency requested per VM. A large percentage (more than 80%) of VMs have low requirements for CPU frequency (about 20 GHz). Figure 2 (right) shows the CDF for the requested memory (RAM) of each VM. The requested memory can range from 1 to 512 GB per VM, but over 70% of VMs requested at most 8 GB of memory [5].
Newly created VMs do not request the amount of storage performance and the network interface throughput during simulation. Thus, the initial VM-to-PM assignment (initial VM placement) is performed according to the amount of CPU and memory requested per VM, as presented in [5].
Nevertheless, the dynamic VM management method consolidates VMs considering all current workloads inside a VM, namely, storage usage and network interface usage. Besides, the dynamic VM management method considers the impact caused by VM migrations to the PM’s CPU and network interface.

3.2.2. Simulation Settings and Model Parameters

The model parameters shown in Table 2 are stored in the settings.ini file and are used for each simulation.
The parameter BEAM_LENGTH determines the number of PMs taken into the search process. The parameter VM_PER_SERVER determines the number of VMs taken as candidates for migration from a source PM. The parameter MIN_CHILD_NODES_PER_VM determines the number of PMs taken into the search process for each migrating VM. The parameter CPU_ON_MIGRATION determines the CPU utilization of the PM (source and destination) per one VM migration. The parameter MIN_NETWORK_ON_MIGRATION determines the network utilization of the PM (source and destination) per one VM migration. The number of values the variables n, m, and l can take is selected considering the analysis of the system behavior during the experiments. The parameters wk, Tk, Dk, Lk, and Qk were set up with the same values for each resource k { C P U , R A M , N E T , I O } , for example, w C P U = w R A M = w N E T = w I O .
All Bitbrains data indicating each VM resource usage are loaded into the SQL database to be used during all simulation runs. Each simulation run consists of 1100 time intervals (management steps), which equal 300 s as presented in Bitbrains traces. The proposed method performs dynamic VM consolidation better if monitoring data (or trace measurements) are obtained in intervals shorter than 5 min but greater than the maximum VM migration time in the current environment. Different factors affect the maximum VM migration time that needs adoption during regular operations. Therefore, the authors do not consider the maximum VM migration time parameter for adoption in the proposed method.

3.2.3. Determining the Model Parameters and Optimization

The experimental evaluation aims to determine optimal model parameters (Table 2) and evaluate quality metrics of the proposed VM management method under dynamic workloads. The quality metrics are defined as follows: the number of CPU SLA violations, the number of memory SLA violations, the number of network SLA violations, the number of storage SLA violations, the uptime of PMs, and the number of VM migrations. The authors propose to rate VM consolidation schemas and approaches on the infrastructure level using the quality metrics defined in this paper. The uptime of PMs is defined in terms of time intervals when a PM is in an active state. A direct relationship is used; the less a PM is in an active state, the less power it consumes.
In this way, the further study aims to determine the following: optimal beam search algorithm parameters, optimal model parameters to the power consumption minimization, optimal model parameters to the SLA violation minimization, and finally, to evaluate the results and the quality metrics.

Determining the Optimal Beam Search Algorithm Parameters

The first phase of the study is to determine the optimal beam search algorithm parameters for the defined problem, namely, BEAM_LENGTH, VM_PER_SERVER, and MIN_CHILD_NODES_PER_VM, to minimize all quality metrics, namely, the power consumption (the uptime of PMs), the number of SLA violations, and the number of VM migrations.
Several experiments are carried out, each of which is designated by the code “nml”. For instance, the designation “Uptime744” denotes the influence of the beam search algorithm parameters n = 7, m = 4, and l = 4 on the uptime of PMs during a simulation run. “CPU633” denotes the influence of the beam search algorithm parameters n = 6, m = 3, and l = 3 on the number of CPU SLA violations during a simulation run. Finally, “Migrations644” denotes the influence of the beam search algorithm parameters n = 6, m = 4, and l = 4 on the number of VM migrations during a simulation run. The degree of dependence between the quality metrics and the beam search algorithm parameters, having changed the variable Lk, is depicted in Figure 3.
From Figure 3a, it is seen that the minimum uptime of PMs is accompanied by an increase in the number of VM migrations. The minimum uptime is obtained by setting Lk within a fixed range of 0.25–0.35. The number of migrations reduces when Lk tends toward 0 and when Lk is more than 0.4, accompanied by increased uptime. In VM management, it is also preferred to reduce the number of VM migrations. Another interesting conclusion is that the beam search algorithm parameters have sufficient influence on the CPU SLA violations, the number of network SLA violations, and the number of VM migrations, but less influence on the uptime of PMs and the number of storage SLA violations. A negligible influence is observed on the number of memory SLA violations. The beam search algorithm parameters determined during optimization are helpful when a VM management system must achieve a particular objective in the specific mode, for example, minimizing VM migrations or minimizing the number of CPU SLA violations when a trend of new VM requests is present.
Two mutually exclusive objectives are seen here for further optimization. The first objective is the minimization of the uptime of PMs (the power consumption minimization). The second objective is the minimization of the number of SLA violations (SLA violation minimization) for each resource k. The goal is to determine optimal beam search algorithm parameters for the defined problem and the remaining model parameters for both objectives separately.
Since many model parameters influence quality metrics, the authors propose a power-aware integral estimation method that considers the area under a curve approximating a specific chart in Figure 3. A polynomial trendline of degree 2 is used to approximate each chart in Figure 3; then the area under each curve is calculated using integration. Table 3 lists the areas under each curve approximating a specific chart in Figure 3 for different beam search algorithm parameters.
The minimal area under all curves that correspond to the quality metrics is obtained using the following values: n = 6, m = 3, and l = 3 (sum = 10,347 in the first highlighted line of Table 3). However, all quality metrics must be taken into account in production data centers with scaling by the same factor, for instance, the associated operating costs.
The second phase of the study is to determine the optimal model parameters according to two formulated objectives. To perform the study’s second phase, the values n = 6, m = 3, and l = 3 are fixed.

Determining the Model Parameters for the Power Consumption Minimization

The effect of Lk on the quality metrics is determined using the arbitrary model parameters Tk = 0.05, Dk = 0.9, and Qk = 0.4. Lk takes values as shown in Table 2. The optimal value in power consumption is Lk = 0.35 (Figure 4) since the minimum uptime of PMs is observed. The exact value of the parameter Lk is used when determining the remaining model parameters to minimize the number of SLA violations. Besides, the number of migrations is not the maximum (12,755). However, the number of CPU SLA violations is quite large (529).
An explicit relatively large number of storage SLA violations can be explained by using Bitbrains traces with high VM demands for storage along with a weak storage hardware performance of PMs used in simulations. The hardware of the PMs (Table 1) cannot cope with the storage workload, which leads to an increase in the number of VM migrations and the number of storage SLA violations. The important conclusion here is that a PM’s hardware must be balanced. That is, the proportions between the performances of all four subsystems (CPU, RAM, storage performance, and network throughput) must be ensured for the specific workload intensity. For example, a PM with a high volume of RAM and many CPU cores cannot be equipped by the network interface and the storage controller with poor productivity. Before the experiments, this requirement was not considered, and the vendor’s standard servers were chosen (Table 1).
Next, with a fixed value of the parameter Lk = 0.35, the effect of Tk on the quality metrics is determined. Tk takes values as shown in Table 2. The optimal value in power consumption is Tk = 0.03 (Figure 5) since the minimum uptime of PMs is observed. The value of Tk is fixed at 0.03 when determining the optimal values of the remaining model parameters Dk and Qk.
Figure 6 shows the effect of Dk on the quality metrics with the fixed values Lk = 0.35 and Tk = 0.03. Dk takes values as shown in Table 2. The optimal value in terms of power consumption is Dk = 0.9 (Figure 6) since the minimum uptime of PMs is observed. The values of Tk and Dk are fixed when determining the optimal value of the parameter Qk.
Next, with the fixed values of Lk = 0.35, Tk = 0.03, and Dk = 0.9, the effect of Qk on the quality metrics is determined. Qk takes values as shown in Table 2. The optimal value in terms of power consumption is Qk = 0.1 (Figure 7) since the minimum uptime of PMs is observed.
Thus, to achieve the minimum power consumption (the minimum uptime of PMs), it is necessary to set the model parameters as follows: Lk = 0.35, Tk = 0.03, Dk = 0.9, and Qk = 0.1. The quality metrics of the power consumption minimization are presented in Figure 8.
It can be observed from Figure 8 that the proposed method of dynamic VM management can effectively offload PMs in order to switch them to the sleep mode and reduce the power consumption. However, during the study, it is also determined that the storage performance is too low for the PMs of the first (PM1–PM5) and the third (PM11–PM15) groups.

Determining the Model Parameters for the Minimization of the Number of SLA Violations

Cloud services based on the IaaS service model are always affected by an SLA violation due to a lack of one or more resources for a VM serving a dynamic workload. The effect of Lk on the quality metrics was determined earlier in the previous section. The minimum number of SLA violations is obtained by Lk = 0.1 (Figure 4). At the same time, the number of VM migrations is 16.8% less than with the power consumption minimization. The number of CPU SLA violations is also decreased by 37.2%, and the uptime of PMs is increased by only 7.3%.
Next, with a fixed value of the parameter Lk = 0.1, the effect of Tk on the quality metrics is determined. Tk takes values as shown in Table 2. The optimal value in terms of the number of SLA violations is Tk = 0.15 (Figure 9) since the minimum number of CPU SLA violations is observed.
CPU violations play a critical role in cloud services as a CPU resource is most critical. Thus, it is crucial to allocate sufficient resource capacity for VMs considering changing a VM number and a workload. Since the number of network SLA violations and the number of memory SLA violations are small, their related contribution to a result may be negligible. Thus, the number of CPU SLA violations is considered the primary quality metric during SLA violation minimization. However, the number of storage SLA violations is not considered when detecting optimal model parameters due to the unbalanced hardware configuration of PMs used for the study. Therefore, the value of Tk is fixed at 0.15 when determining the optimal values of the remaining model parameters Dk and Qk.
Next, with fixed values of the parameters Lk = 0.1 and Tk = 0.15, the effect of Dk on the quality metrics is determined. Dk takes values as shown in Table 2. The optimal value in terms of the number of SLA violations is Dk = 0.95 (Figure 10) since the minimum number of CPU SLA violations is observed. The values of Tk and Dk are fixed when determining the optimal value of the parameter Qk.
Next, with fixed values of the parameters Lk = 0.1, Tk = 0.15, and Dk = 0.95, the effect of Qk on the quality metrics is determined. Qk takes values as shown in Table 2. The optimal value in terms of the number of SLA violations is Qk = 0.4 (Figure 11) since the minimum number of CPU SLA violations is observed.
Thus, to achieve the minimum number of CPU SLA violations, it is necessary to set the model parameters as follows: Lk = 0.1, Tk = 0.15, Dk = 0.95, and Qk = 0.4. The quality metrics of the SLA violation minimization are presented in Figure 12.
As shown in Figure 12, the number of SLA violations is reduced significantly compared with the power consumption minimization results shown in Figure 8. The high rate of storage SLA violations remains due to the unbalanced hardware configuration of PMs. The low rate of CPU SLA violations is observed as a result of the SLA violation minimization. Figure 12 also shows that the storage performance is too low for the PMs of the first (PM1–PM5) and the third (PM11–PM15) groups.
Figure 13 shows SLA quality metrics of the dynamic VM management method during the simulation run. The number of active PMs (green) corresponds to the SLA violation minimization.
SLA violations cannot be completely avoided because of the nature of cloud workloads. Nevertheless, compared with the results of the power consumption minimization, the proposed VM management method can achieve a better reduction of SLA violations by decreasing the number of CPU SLA violations by 76.5%, by decreasing the number of memory SLA violations by 53.8%, and by decreasing the number of network SLA violations by 3.6% (Figure 8 and Figure 12). Moreover, the number of VM migrations is also decreased by 16.4% (Figure 14). However, at the same time, the uptime metric is increased only by 14.9%, which means that PMs are in an active state only 14.9% longer.

4. Discussion

Table 4 summarizes the influence of the model parameters on the quality metrics during the SLA violation minimization and the power consumption minimization (the objective functions as defined in Section 2). Grey rows of the table indicate the power consumption minimization results. IEM is applied in the study’s first phase, whereas PCM and SLAVM are applied in the second phase.
The thresholds Tk, Dk, Lk, and 
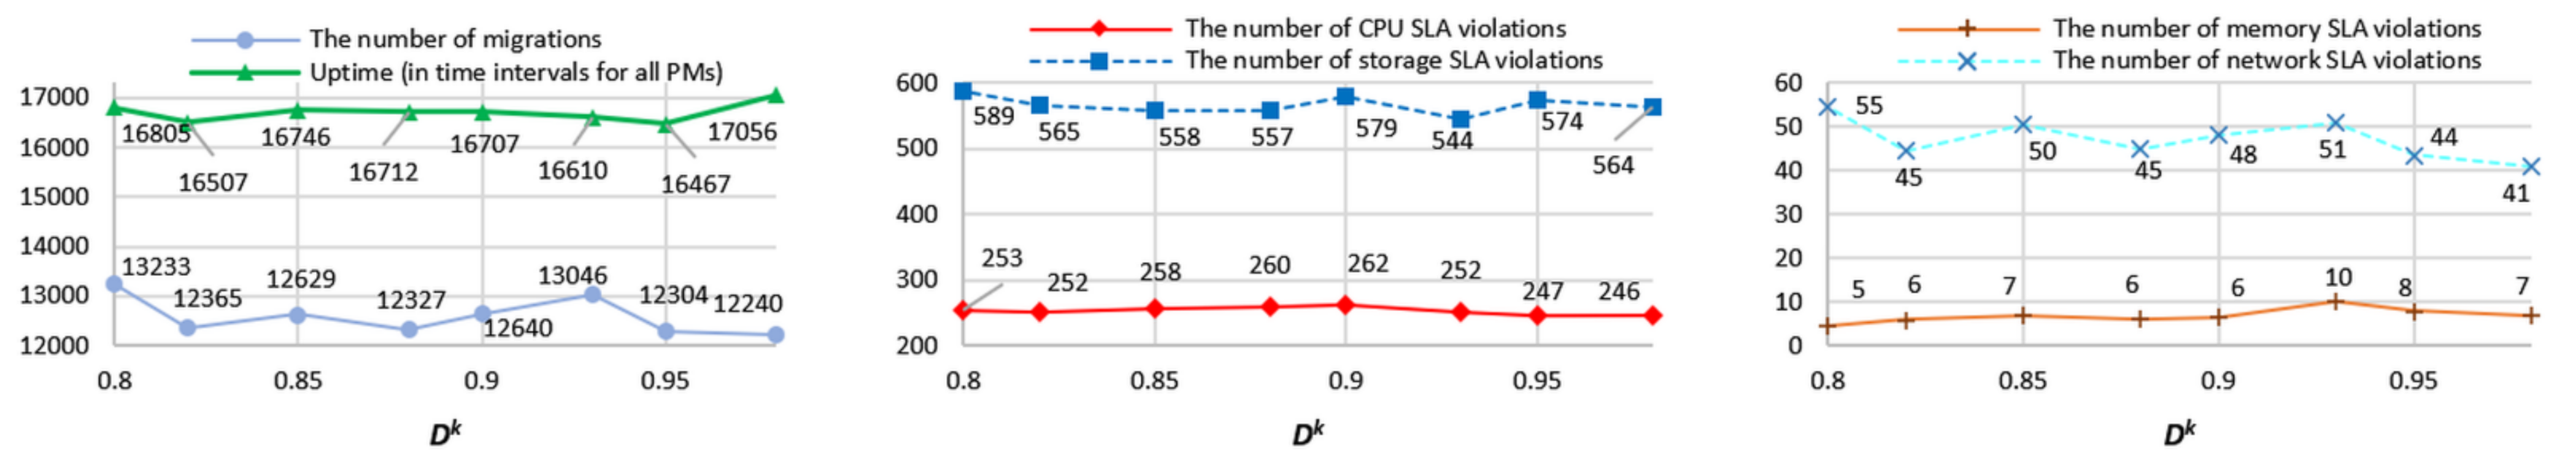
Qk have a complex influence on each objective function’s quality metrics. There appears to be no benefit in using the threshold Dk for VM management because it has a weak effect on both objectives’ quality metrics. The threshold 
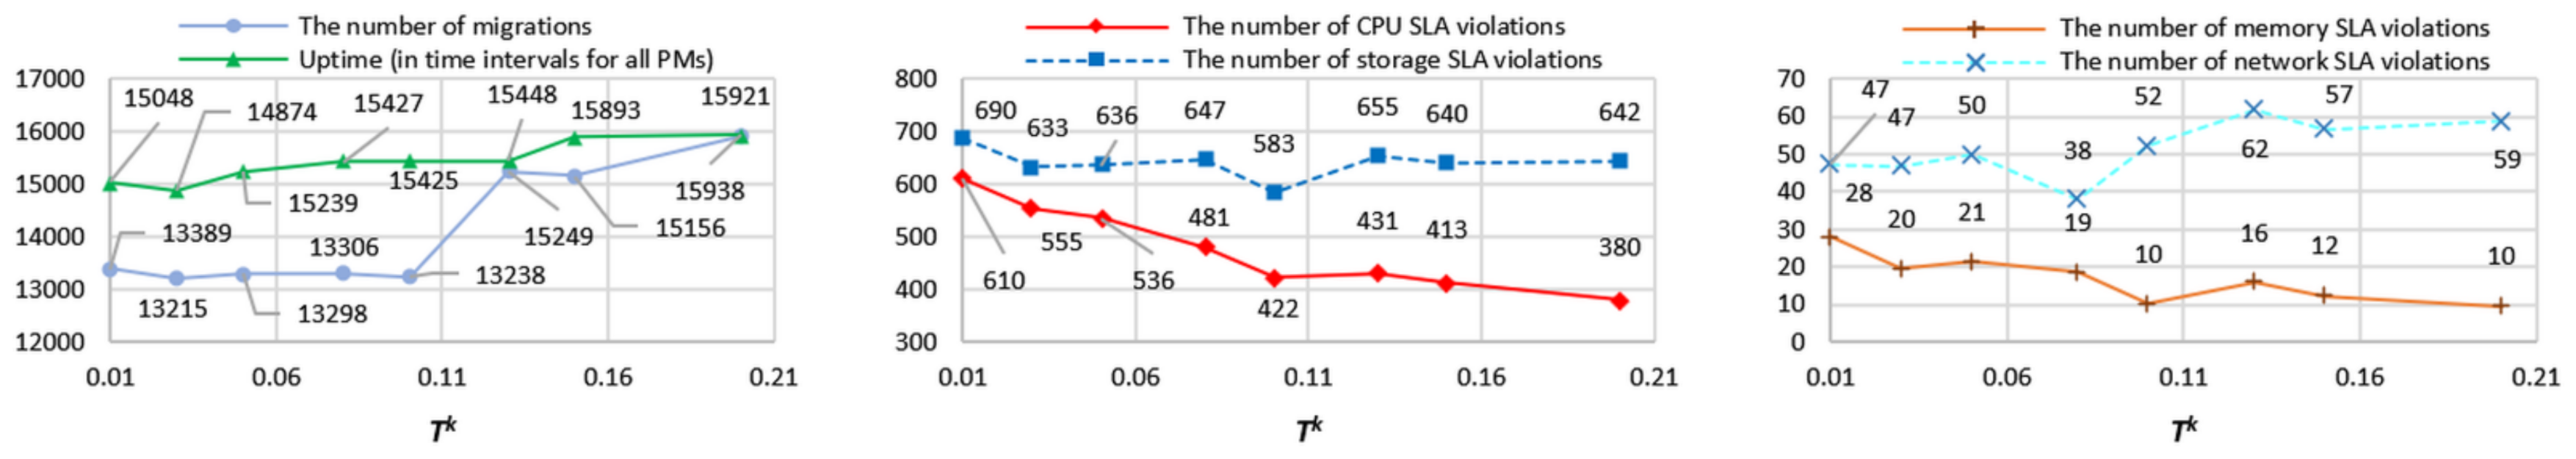
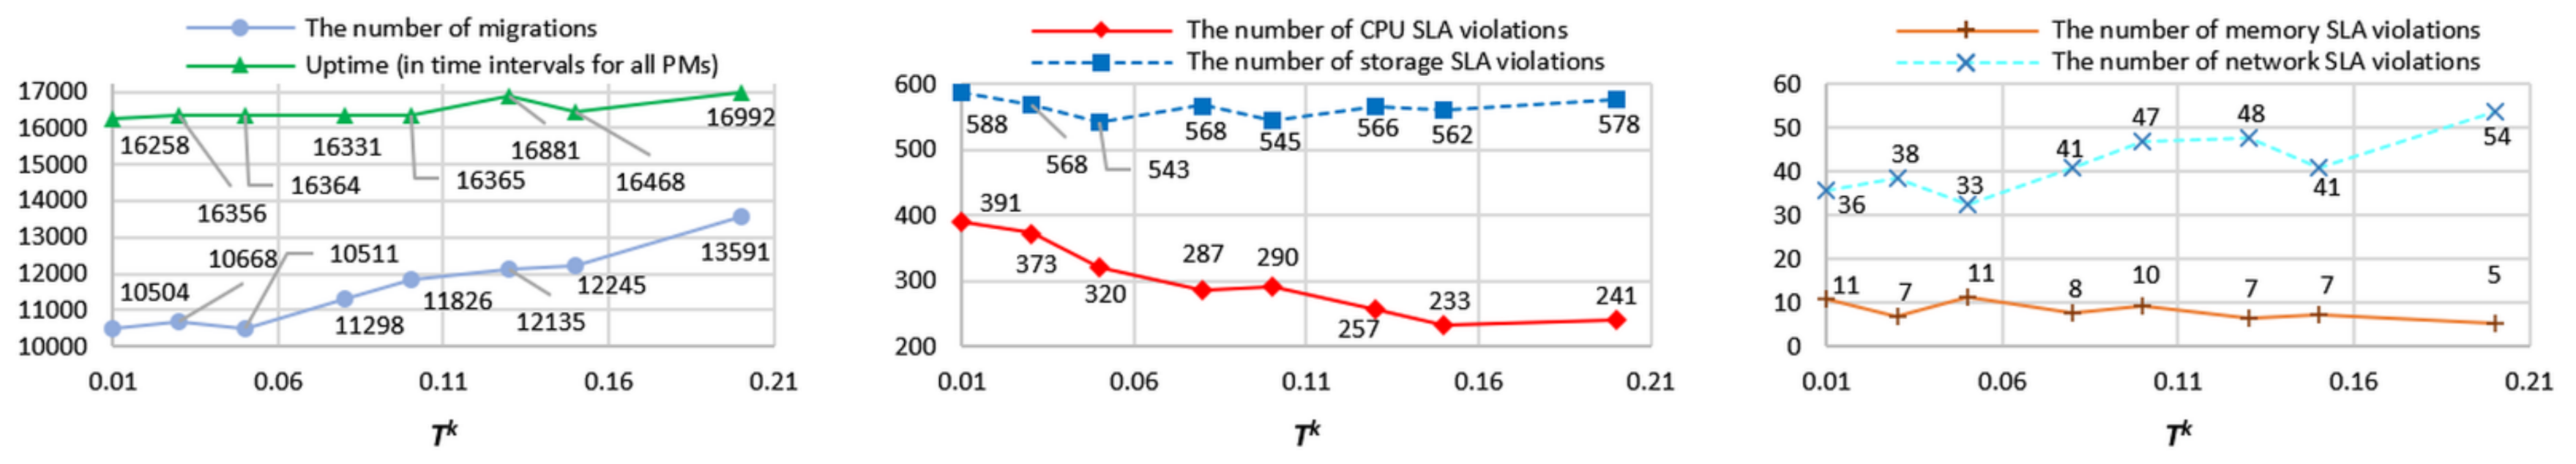
Tk strongly influences the five out of six quality metrics for the PCM objective function; therefore, it should be used for VM management. On the other hand, for SLAVM objective function, Tk has a strong influence on three out of six quality metrics; therefore, it can be constant. The threshold 
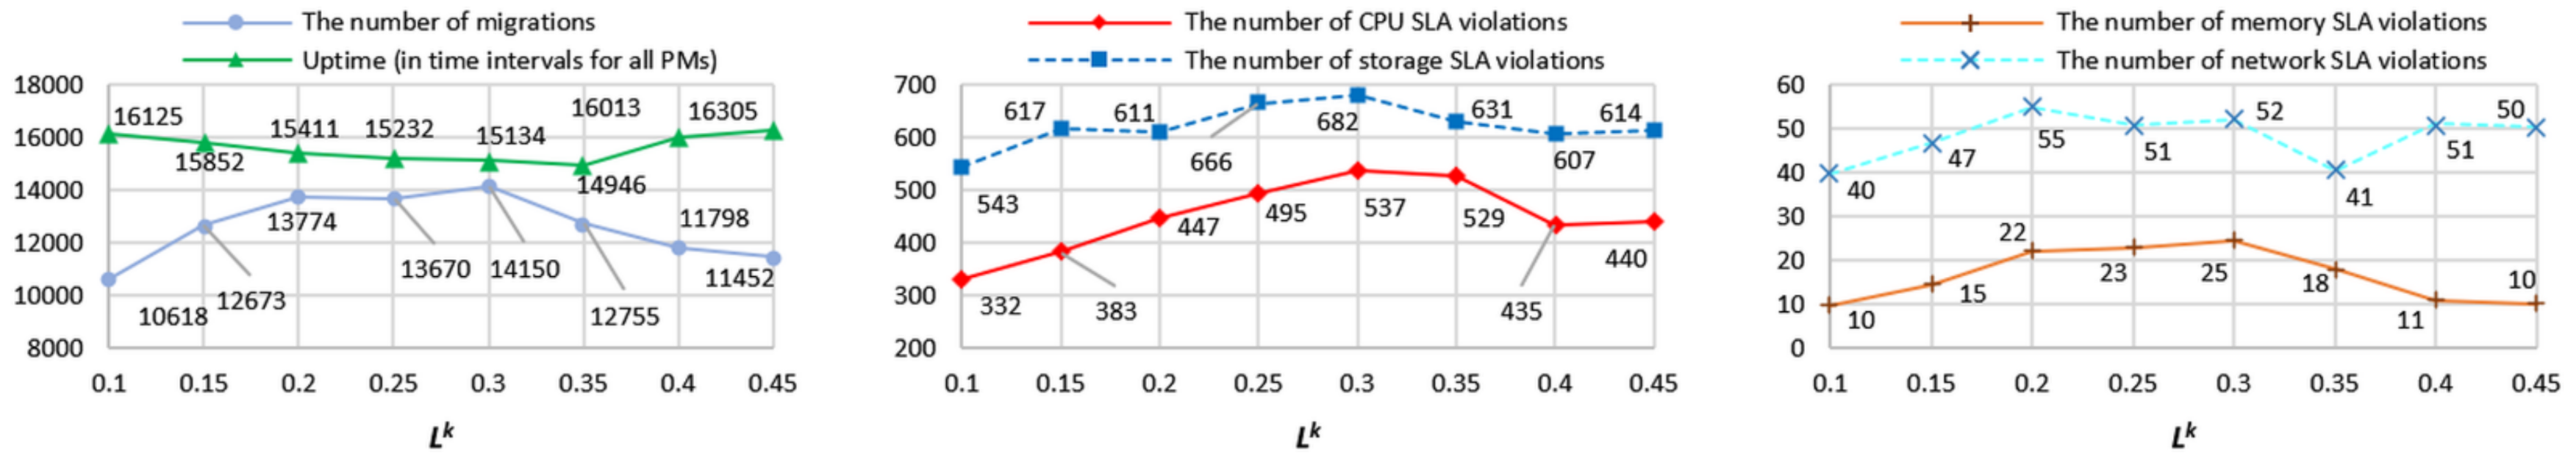
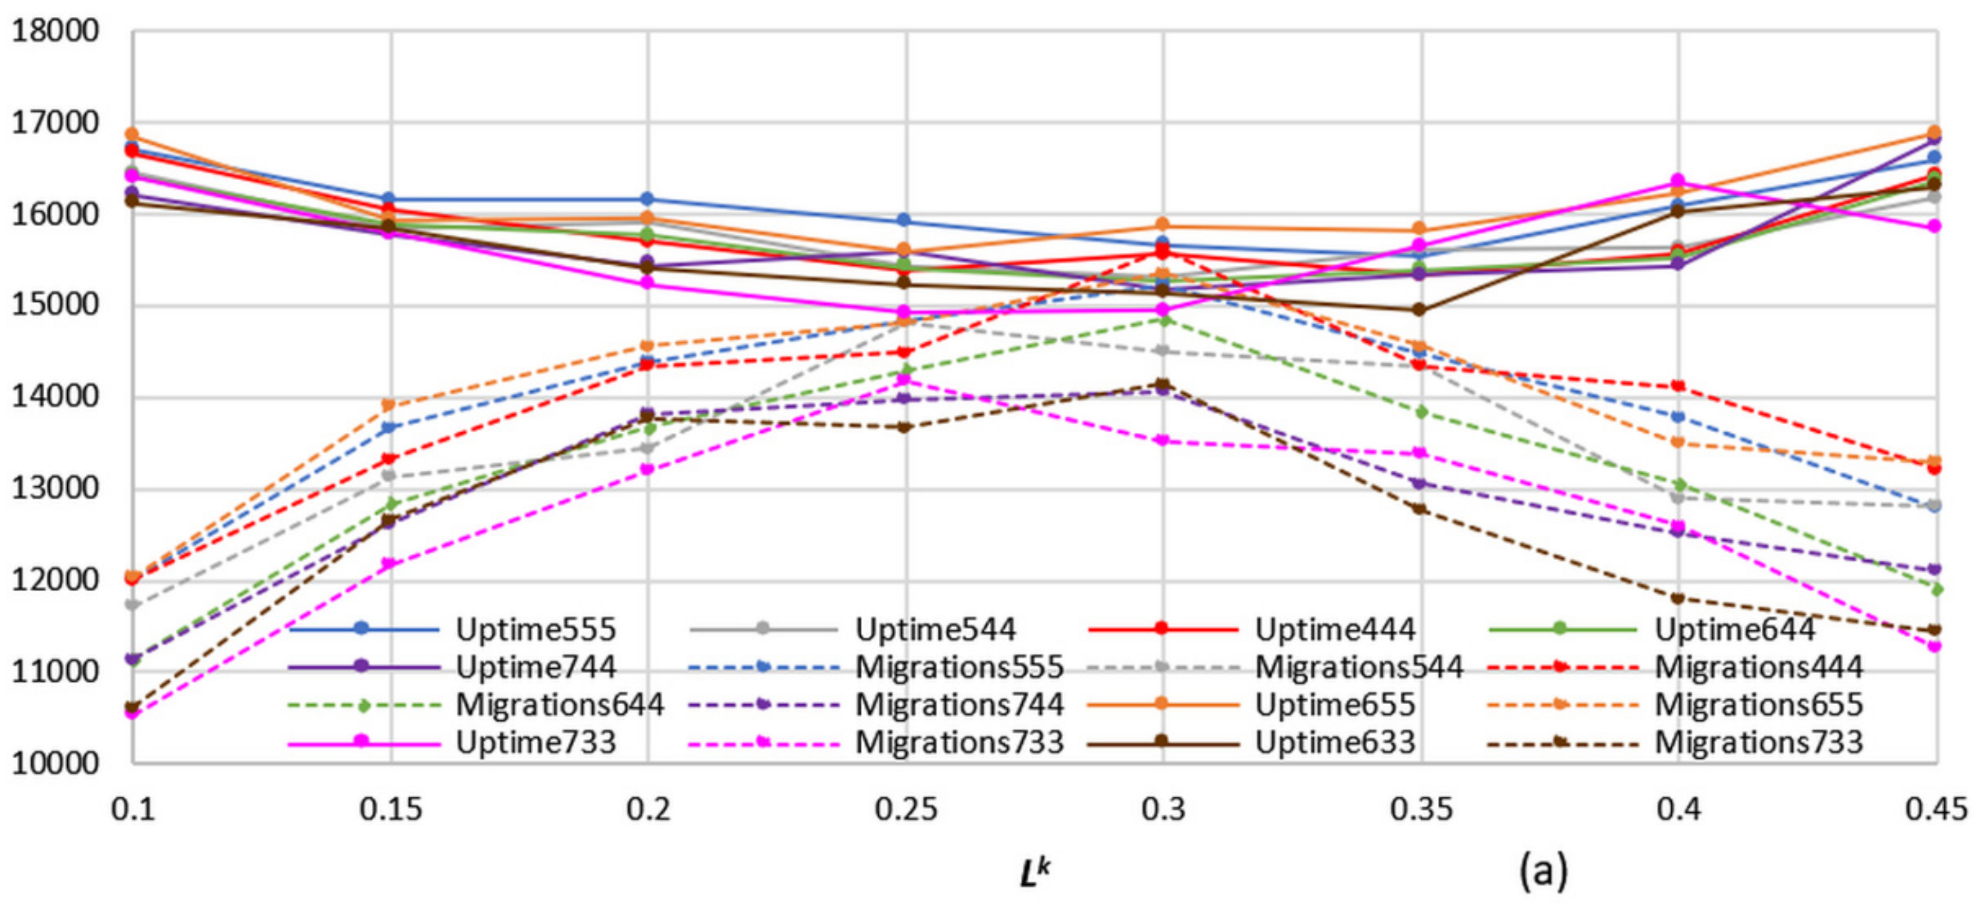
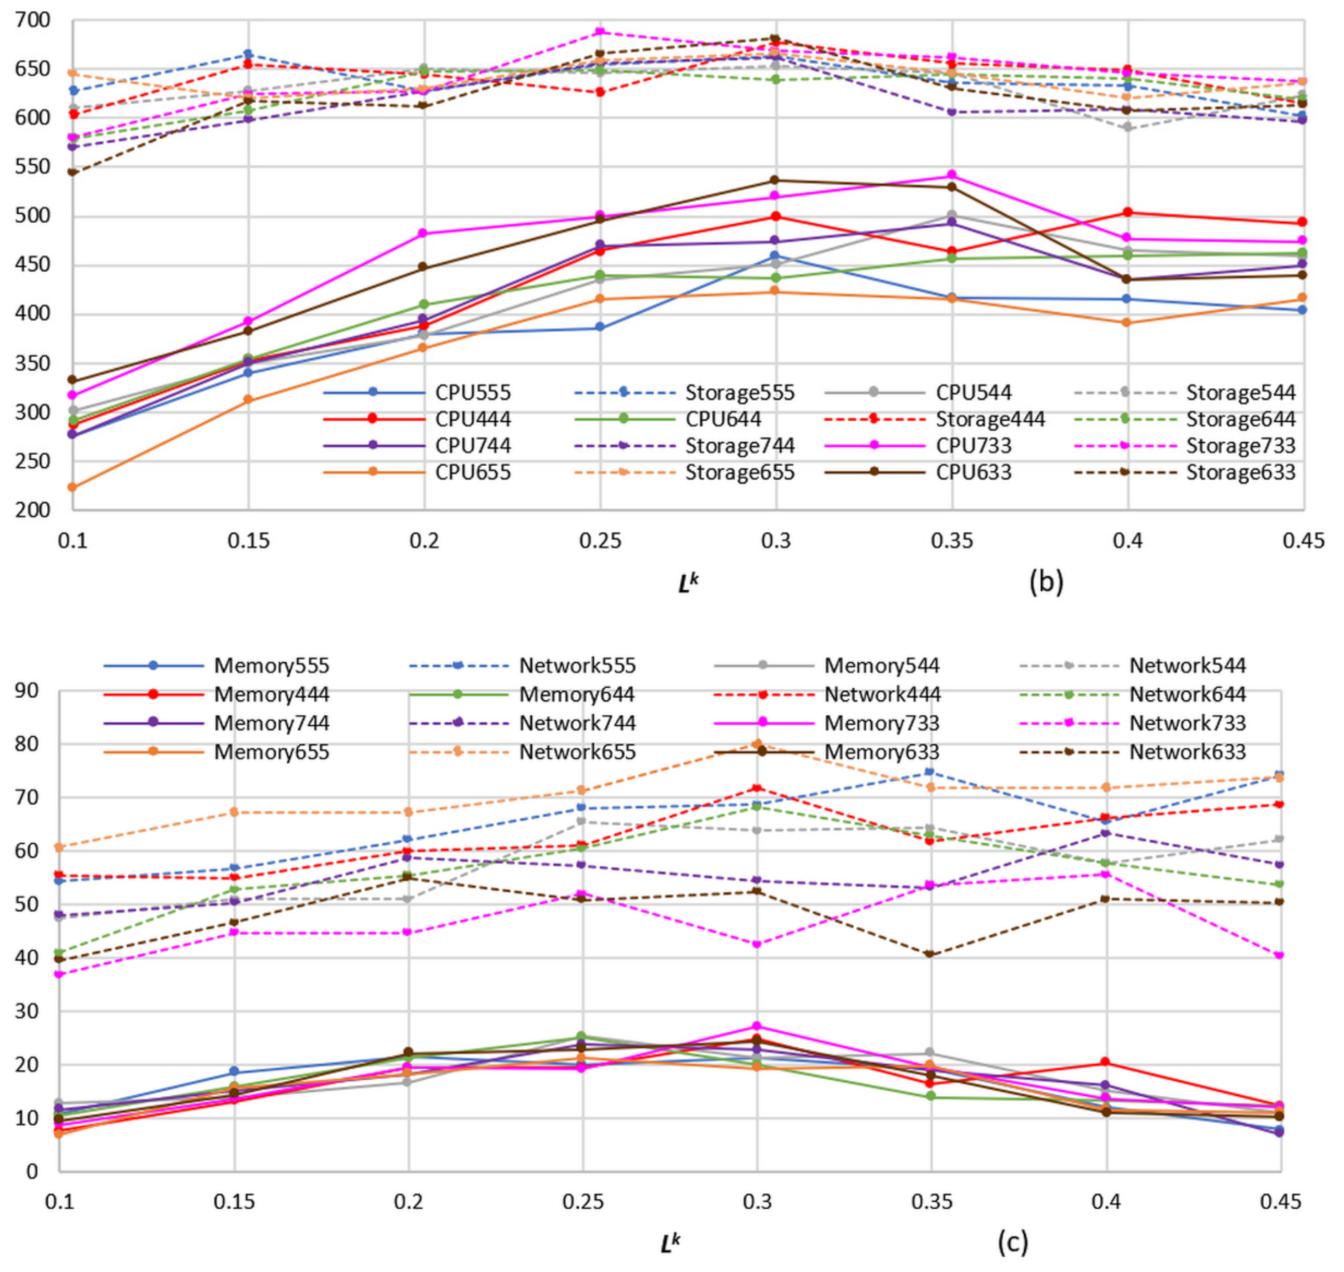
Lk strongly influences the five out of six quality metrics for both objective functions; therefore, it should also be used for VM management. The threshold 
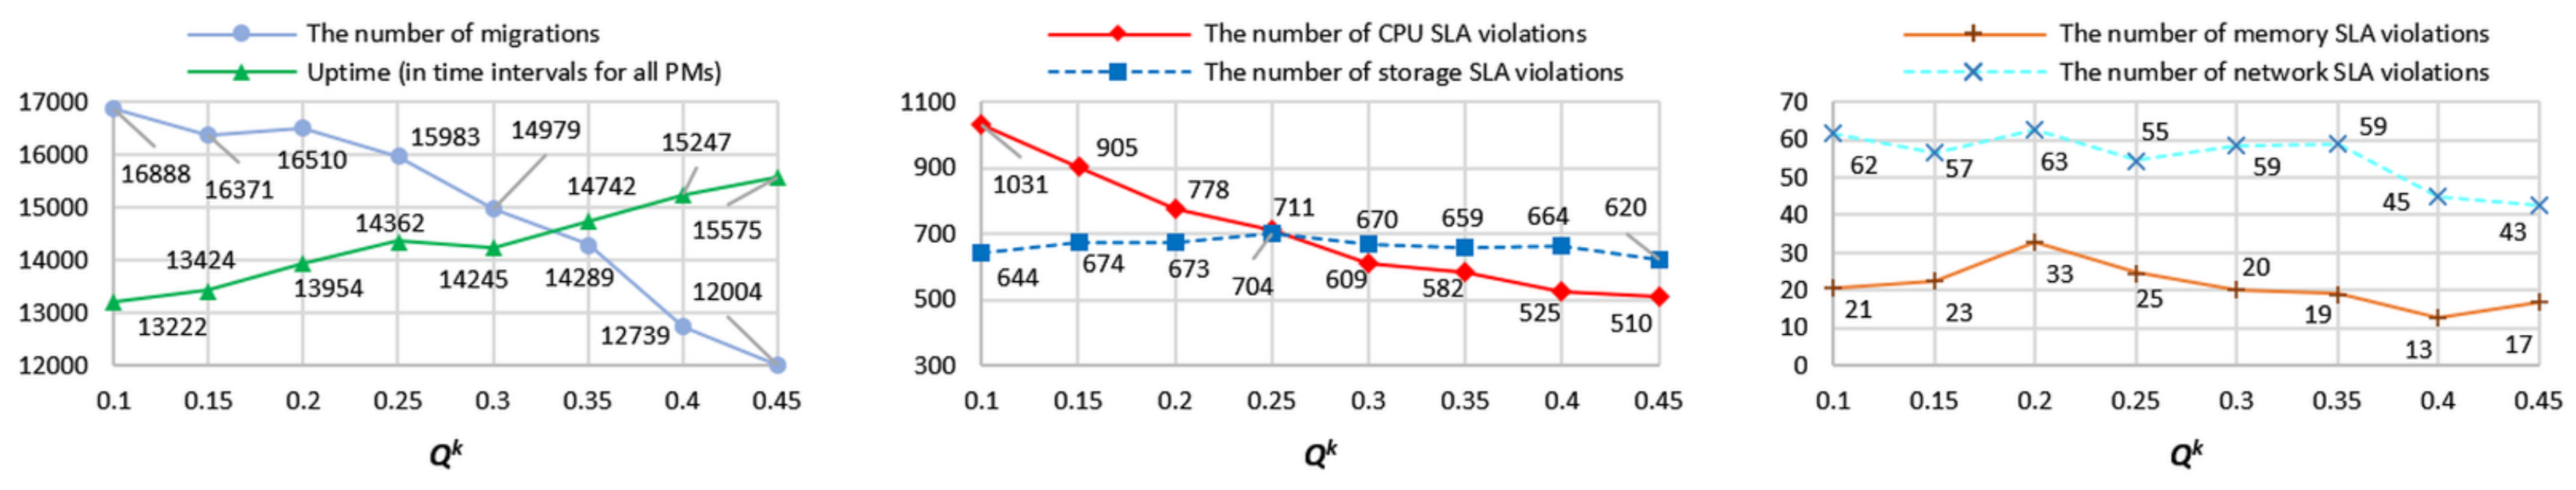
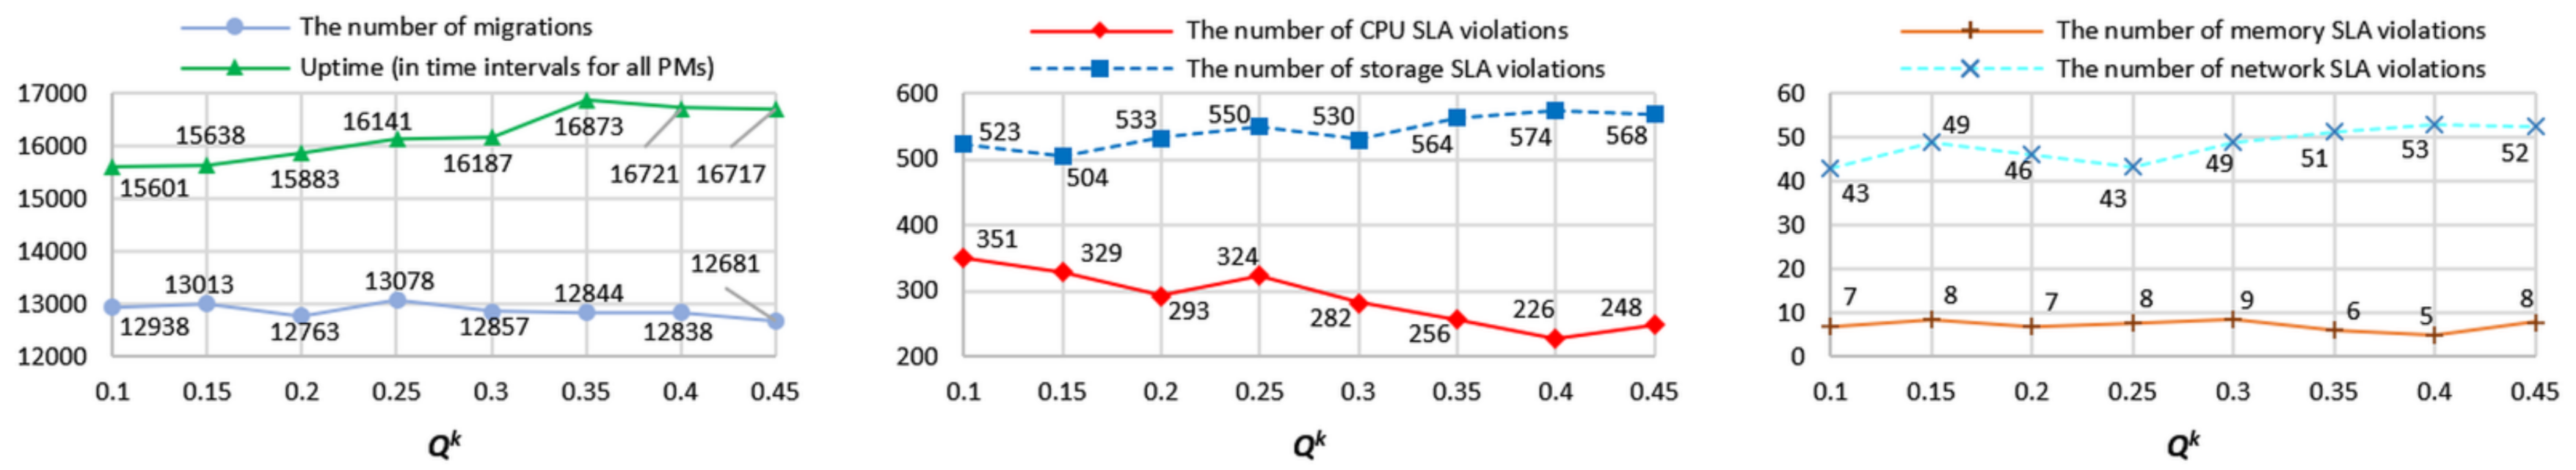
Qk strongly influences the four out of six quality metrics for both objective functions; therefore, it is recommended for VM management. From Figure 4, Figure 5, Figure 6 and Figure 7 and Figure 9, Figure 10 and Figure 11, it should be noted that the overall objective function sensitivity to the thresholds is not great, and consequently, the proposed model is practical.
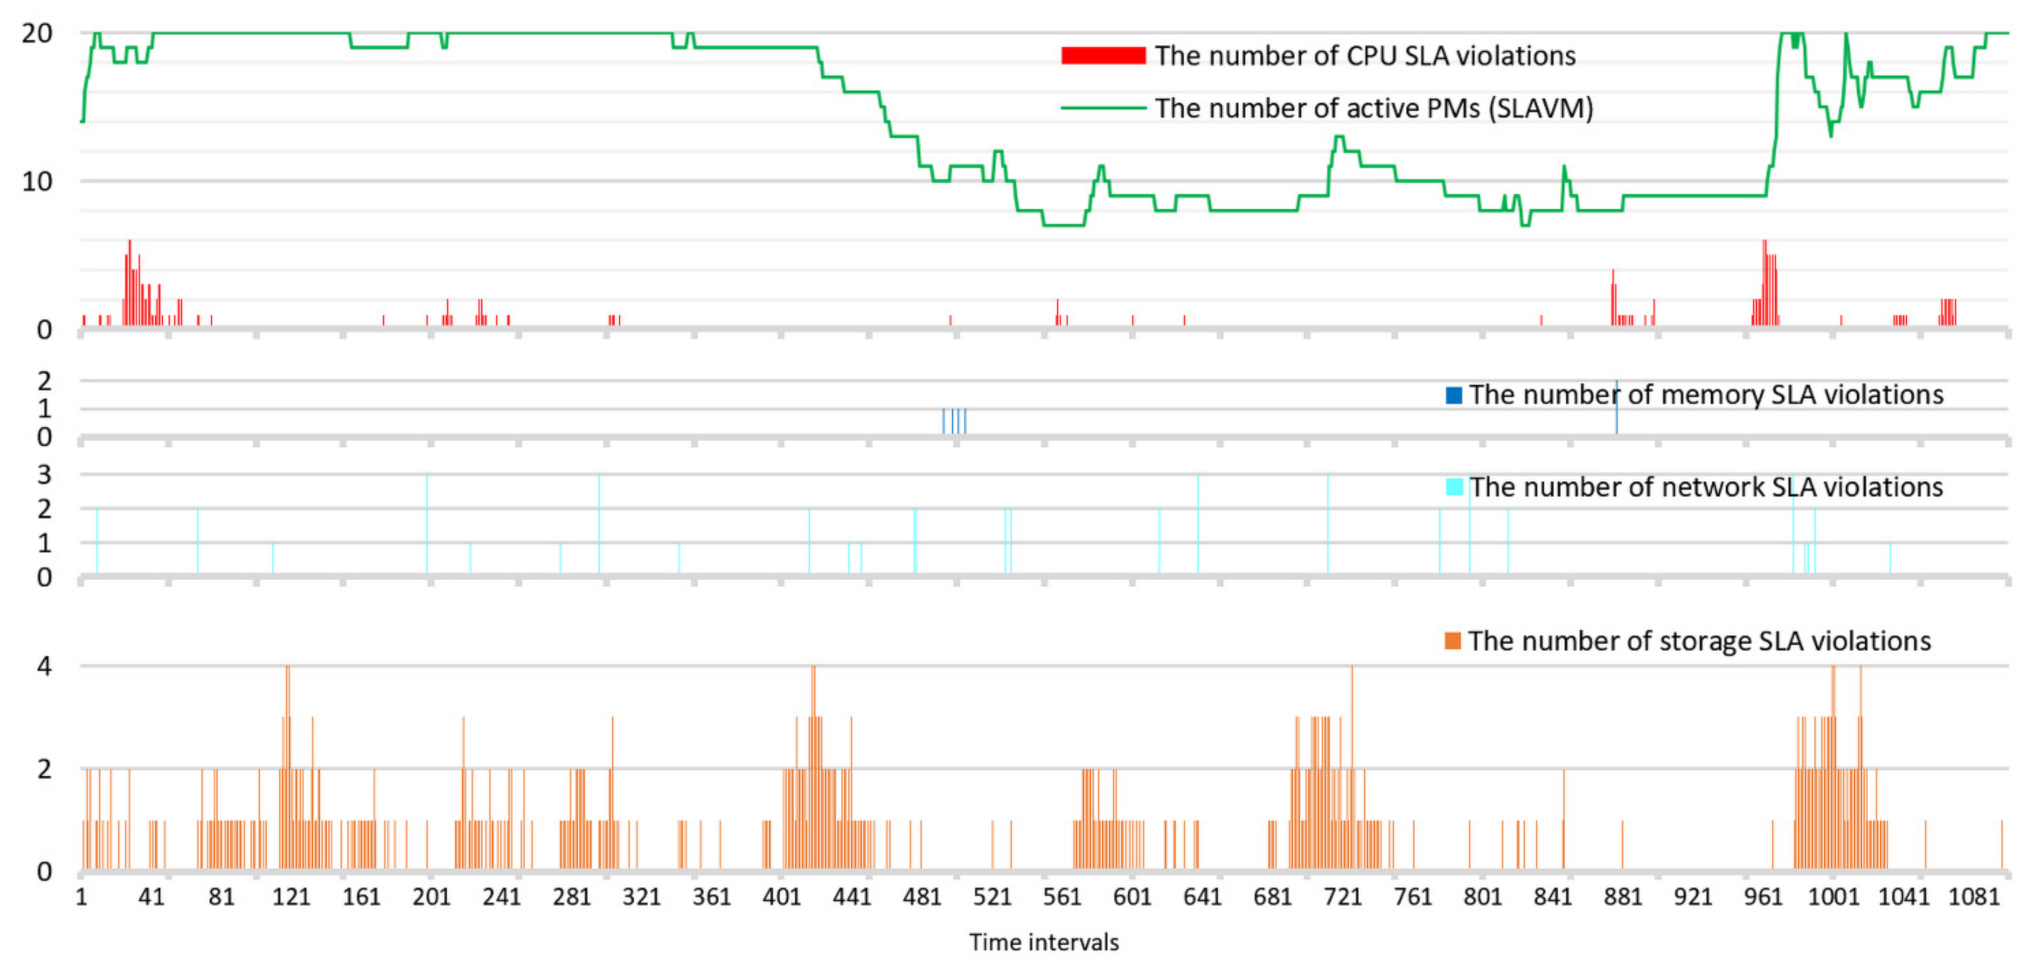
The memory SLA violation metric varies from around 5 cases up to 33 cases during simulation runs. However, compared with other quality metrics, memory SLA violations occur very rarely, which can be explained by the sufficient RAM capacity of PMs.
The parameters of the beam search algorithm have a substantial effect on the quality metrics except for memory and storage SLA violations. The storage SLA violation metric is affected only by the parameter Lk, which controls the number of underloaded PMs. This is explained by the unbalanced hardware configuration of PMs that were used for the study. Each VM migration increases storage utilization under other storage capacities except for storage based on storage area network.
The model parameter Dk has a negligible effect on the quality metrics. It means that the desired workload threshold cannot be applied in such hardware configurations with insufficient storage capacity and periodical storage SLA violations. This parameter can be taken into account when workload balancing schemas are applied. In all other cases, it can be set to 0.9.
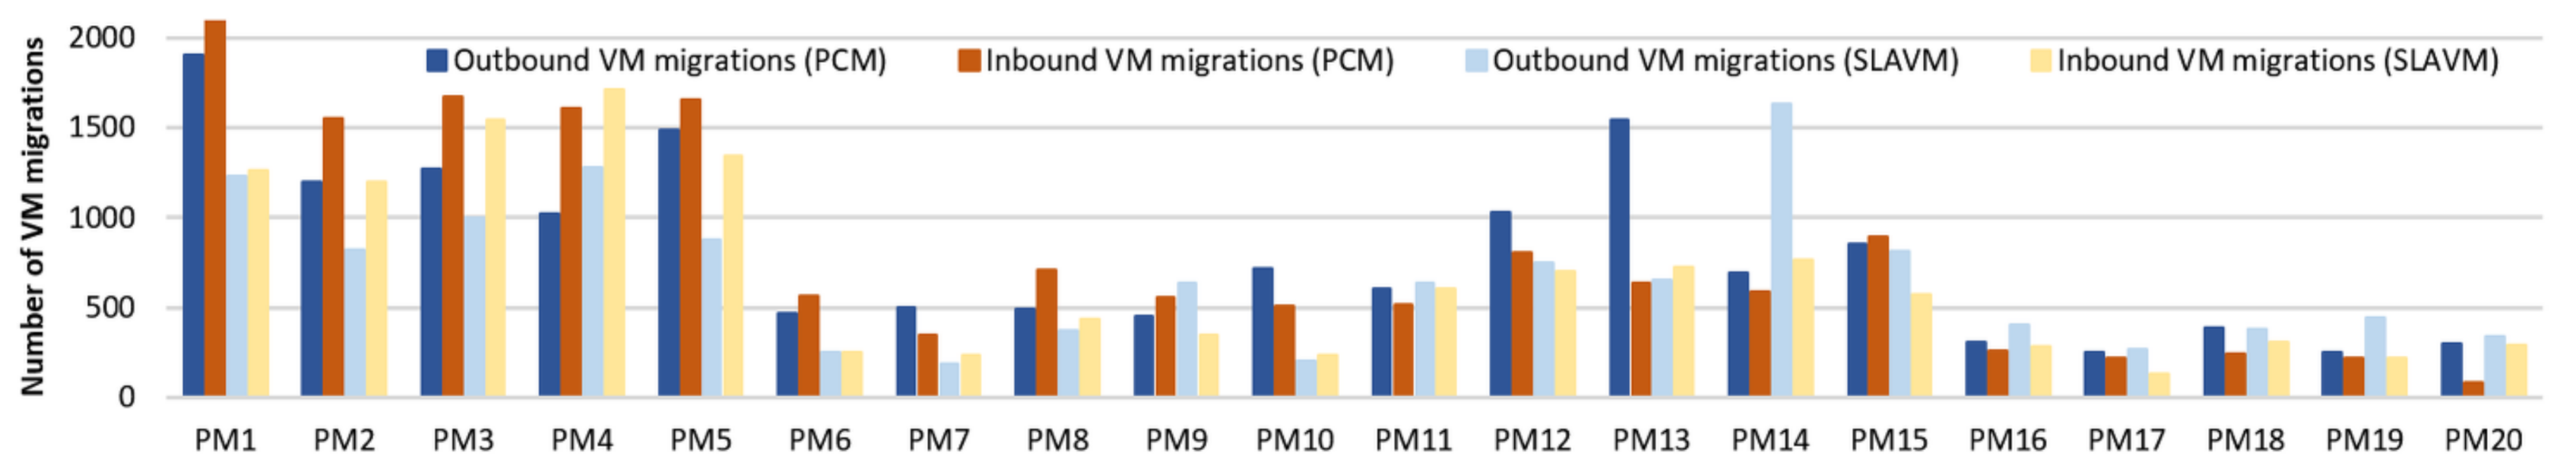
In this study, minimizing the number of VM migrations is not considered but is taken into account when determining optimal model parameters according to defined objectives. Simulation results show the strong effect of SLAVM on the number of VM migrations (Figure 14), which decreases the number of VM migrations by 16.4%.
Based on the minimization results using two defined objectives, the authors conclude that the SLA violation minimization is a preferred optimization technique compared with the power consumption minimization. It is explained by the significant improvement of SLA quality metrics, the decreased number of VM migrations, and a slight deterioration in the uptime metric directly related to power consumption.
The power consumption minimization is always followed by an increasing number of VM migrations that are usually not acceptable in production [27]. Furthermore, switching a PM from the sleep mode to the active state (PM setup) takes significant time at a data center scale, and ignoring the power consumption during PM setup can be a serious drawback when many PMs change their states frequently [28]. For example, during a setup, PMs consume about 200 W, which is close to the maximal rate for some PMs [29,30]. Furthermore, the setup time of PMs varies from 20 to 200 s depending on the hardware and software configuration and can be as large as 260 s [31]. Thus, keeping some PMs in the active state, the VM management method will be more robust to the emergence of new VM schedule requests and VM migrations.
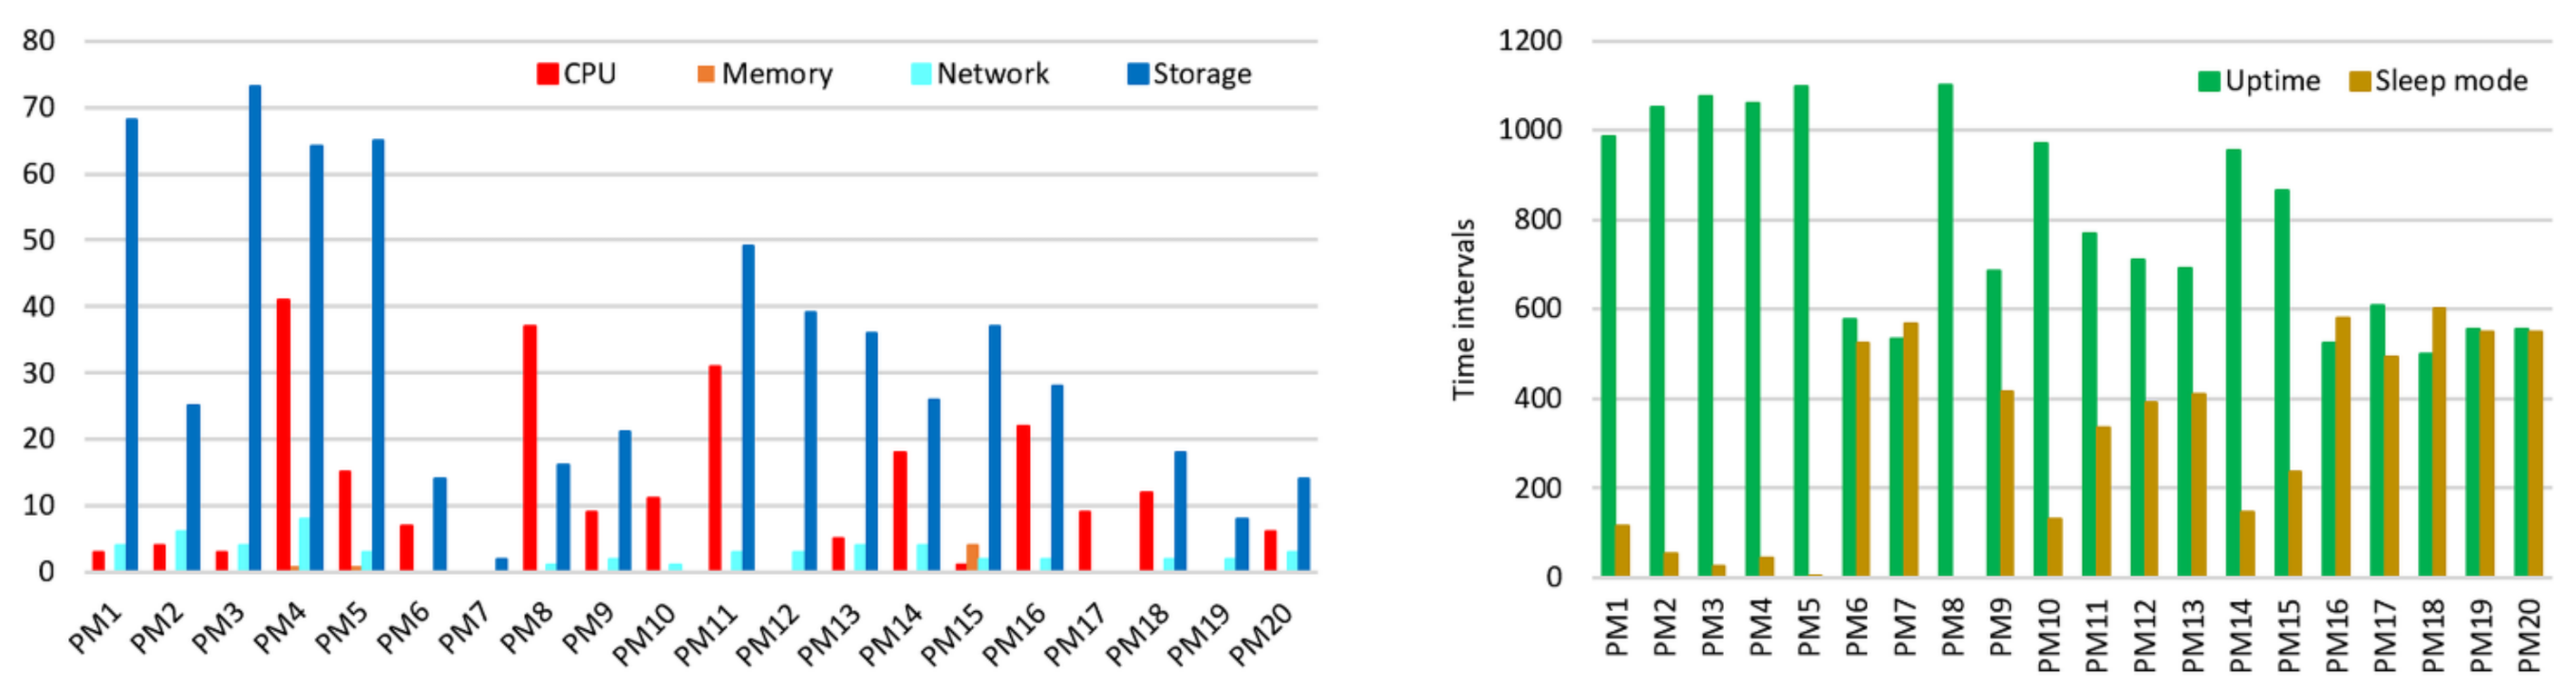
Figure 15 shows each resource utilization and the number of active PMs resulting from the power consumption minimization (red) and the SLA violation minimization (green) during each simulation run. It also shows summarized data from Bitbrains about each VM’s demands, namely, CPU, memory, network, and storage resources used by all VMs. The dashed lines show CPU, memory, network, and storage resources provisioned by PMs.
Notable amounts of network and memory resources are provisioned to serve a VM’s workload; therefore, these resources are underutilized. However, at the same time, the amounts of CPU and storage resources are not always enough for spikes of a VM’s workload, which results in an increased number of SLA violations.
In response to the increasing workload on any resource, many PMs switch from the sleep mode to the active state. The red chart (PCM) shows a significantly higher number of such switches than using SLAVM; therefore, from the perspective of power consumption, an increase in uptime by 14.9% may be comparable to switching overhead.
To summarize, the authors propose scientific insights into VM consolidation approaches:
1. The determined model parameters Lk = 0.1, Tk = 0.15, Dk = 0.95, and Qk = 0.4 can also be used with other VM consolidation methods and frameworks along with any dynamic workloads.
2. In many cases, there is no need to define adaptive thresholds for the specified resource utilization since experiments show that an aggressive policy of switching PMs into the sleep mode is not helpful to minimize the number of SLA violations and the presence of workload spikes mainly defines the thresholds. Furthermore, the sensitivity of many model parameters to a small range of changes does not significantly affect the quality metrics.
3. Generally speaking, objectives such as power consumption minimization and minimization of the number of migrations sometimes appear to be an end in themselves, as a deterioration in service quality level often accompanies them. However, a careful analysis of the above results reveals that it is preferred to transform these objectives into constraints for the well-known VM consolidation methods. At the same time, the SLA violation minimization has more chances to be used in an objective function. A set of simulation-based experiments shows that minimizing the number of SLA violations will decrease the number of VM migrations, and the uptime of PMs will increase insignificantly.
4. The proposed dynamic VM management method (probably as well as many others) copes well with VM consolidation if the SLA is violated by only one resource. However, if the SLA violations occur on two or more resources, it is necessary to use more balanced PM hardware configurations.
5. A consolidation, taking into account the mutual influence of VMs running on one PM at runtime (a complementary VM placement [32]), is excessive here, since when the management method takes into account all PM resources, the availability of PM resources for VMs is verified using already-known resource requirements by default. Therefore, a VM consolidation focusing on a specific workload intensity is more promising, namely, a mixed VM consolidation with balanced compute-intensive, memory-intensive, storage-intensive, and network-intensive workloads. However, such a heuristic is not applied in this paper.

5. Conclusions

Effective power-aware VM management directly affects power consumption, cost, scalability, scheduling, and capacity planning. By being grounded in an extensive quantitative and qualitative analysis of the literature, the authors present the dynamic VM management method to effectively allocate new VMs and migrate active VMs by applying the beam search algorithm to offload overloaded and underloaded PMs. Furthermore, the proposed method consolidates VMs, considering all current workloads inside a VM, such as CPU, memory, storage, and network interface usage.
A new power-aware integral estimation method for determining the optimal beam search algorithm parameters for the defined problem is proposed, which considers the area under a polynomial trendline of degree 2 that approximates a specific chart. It considers multiple quality metrics defined as follows: the number of CPU SLA violations, the number of memory SLA violations, the number of network SLA violations, the number of storage SLA violations, the uptime of PMs, the number of VM migrations. The minimum area under all curves corresponding to the quality metrics is obtained using the following beam search algorithm parameters: n = 6, m = 3, and l = 3. The beam search algorithm parameters have sufficient influence on the CPU SLA violations, the number of network SLA violations, and the number of VM migrations, but less influence on the uptime of PMs and the number of storage SLA violations. Furthermore, the number of memory SLA violations has a negligible influence on the beam search algorithm parameters. The thresholds Tk, Lk, and Qk have a complex influence on the quality metrics, and they are recommended to be used in VM management frameworks based on the SLAVM or the PCM objectives.
The main models’ parameters that influence the quality metrics of the proposed method are obtained for two objectives, namely, the minimum power consumption and the minimum number of CPU SLA violations. Prior research in cloud computing shows that SLA violations cannot be completely avoided because of the nature of cloud workloads and oversubscription. However, the number of SLA violations is reduced significantly in the SLAVM optimization compared with the PCM optimization results. Thus, the authors conclude that the SLAVM is a preferred optimization technique compared with PCM. It is explained by a significant improvement of SLA quality metrics (the number of CPU SLA violations decreasing by 76.5%, the number of memory SLA violations decreasing by 53.8%, and the number of network SLA violations decreasing by 3.6%) accompanied by a decreased number of VM migrations (decreased by 16.4%) and by a slight deterioration in the uptime metric (increased by 14.9%), which is directly related to the power consumption.
Without entangling with the implementation aspects of applying thresholds, the obtained results provide sufficient insight into the critical challenges in VM management. These insights include: using the quality metrics defined in this paper to rate VM consolidation schemas and approaches on infrastructure level, an advantage of using static thresholds for the specified resource utilization, preferred usage of the SLA violation minimization as the main objective, transformation of the objectives such as the power consumption minimization and the number of migration minimizations into constraints to use with well-known VM consolidation methods, and considering a specific workload intensity and balanced VM consolidation instead of considering the mutual influence of VMs at runtime (complementary VM placement).
Future work can improve the dynamic VM management method by predicting resource demands, planning a preferred PM’s resource capacity used for dynamic VM consolidation, and considering all quality metrics with scaling by the factor associated with operating costs.

Author Contributions

Conceptualization, E.Z. and S.T.; methodology, E.Z.; software, E.Z.; validation, E.Z. and S.T.; formal analysis, S.T.; investigation, E.Z.; resources, E.Z.; data curation, E.Z.; writing—original draft preparation, E.Z.; writing—review and editing, E.Z.; visualization, E.Z.; supervision, S.T.; project administration, E.Z. All authors have read and agreed to the published version of the manuscript.

Funding

This research received no external funding.

Data Availability Statement

The datasets analyzed during the current study are available in the Grid Workloads Archive repository, http://gwa.ewi.tudelft.nl/datasets/gwa-t-12-bitbrains (accessed on 20 October 2021). The data of PMs’ system features used during the current study are available in the List of Dell EMC PowerEdge Models repository, https://www.dell.com/support/kbdoc/en-us/000143479/list-of-poweredge-models-and-generation?lang=en (accessed on 20 October 2021).

Conflicts of Interest

The authors declare no conflict of interest.

References

  1. Cloud Computing Trends: 2020 State of the Cloud Report. Available online: https://www.flexera.com/blog/industry-trends/trend-of-cloud-computing-2020/ (accessed on 12 September 2021).
  2. Barroso, L.A.; Hölzle, U.; Ranganathan, P. The Datacenter as a Computer: Designing Warehouse-Scale Machines, 3rd ed.; Morgan & Claypool: San Rafael, CA, USA, 2018; Volume 13, pp. 1–189. [Google Scholar] [CrossRef] [Green Version]
  3. Prabha, B.; Ramesh, K.; Renjith, P.N. A Review on Dynamic Virtual Machine Consolidation Approaches for Energy-Efficient Cloud Data Centers; Data Intelligence and Cognitive Informatics; Springer: Singapore, 2021; pp. 761–780. [Google Scholar]
  4. Telenyk, S.; Rolik, O.; Zharikov, E.; Serdiuk, Y. Energy efficient data center resources management using beam search algorithm. Czas. Tech. 2018, 4, 127–138. [Google Scholar]
  5. Zharikov, E.; Telenyk, S.; Rolik, O.; Serdiuk, Y. Cloud Resource Management with a Hybrid Virtual Machine Consolidation Approach. In Proceedings of the 2019 IEEE International Conference on Advanced Trends in Information Theory (ATIT), Kyiv, Ukraine, 18–20 December 2019; pp. 289–294. [Google Scholar] [CrossRef]
  6. Zolfaghari, R.; Sahafi, A.; Rahmani, A.M.; Rezaei, R. Application of virtual machine consolidation in cloud computing systems. Sustain. Comput. Inform. Syst. 2021, 30, 100524. [Google Scholar]
  7. Jin, C.; Bai, X.; Yang, C.; Mao, W.; Xu, X. A review of power consumption models of servers in data centers. Appl. Energy 2020, 265, 114806. [Google Scholar] [CrossRef]
  8. Chen, J.; Wang, Y.; Liu, T. A proactive resource allocation method based on adaptive prediction of resource requests in cloud computing. EURASIP J. Wirel. Commun. Netw. 2021, 2021, 24. [Google Scholar] [CrossRef]
  9. Alrajeh, O.; Forshaw, M.; Thomas, N. Using Virtual Machine live migration in trace-driven energy-aware simulation of high-throughput computing systems. Sustain. Comput. Inform. Syst. 2021, 29, 100468. [Google Scholar] [CrossRef]
  10. Riahi, M.; Krichen, S. A multi-objective decision support framework for virtual machine placement in cloud data centers: A real case study. J. Supercomput. 2018, 74, 2984–3015. [Google Scholar] [CrossRef]
  11. Shaw, R.; Howley, E.; Barrett, E. Applying Reinforcement Learning towards automating energy efficient virtual machine consolidation in cloud data centers. Inf. Syst. 2021, 101722, 101722. [Google Scholar] [CrossRef]
  12. Saadi, Y.; El Kafhali, S. Energy-efficient strategy for virtual machine consolidation in cloud environment. Soft Comput. 2020, 24, 14845–14859. [Google Scholar] [CrossRef]
  13. Kupin, A.; Muzyka, I.; Kuznetsov, D.; Kumchenko, Y. Stochastic Optimization Method in Computer Decision Support System. Adv. Intell. Syst. Comput. 2018, 754, 349–358. [Google Scholar] [CrossRef]
  14. Wolke, A.; Tsend-Ayush, B.; Pfeiffer, C.; Bichler, M. More than bin packing: Dynamic resource allocation strategies in cloud data centers. Inf. Syst. 2015, 52, 83–95. [Google Scholar] [CrossRef]
  15. Zhao, H.; Wang, J.; Liu, F.; Wang, Q.; Zhang, W.; Zheng, Q. Power-Aware and Performance-Guaranteed Virtual Machine Placement in the Cloud. IEEE Trans. Parallel Distrib. Syst. 2018, 29, 1385–1400. [Google Scholar] [CrossRef]
  16. Shen, H.; Chen, L. Distributed Autonomous Virtual Resource Management in Datacenters Using Finite-Markov Decision Process. IEEE/ACM Trans. Netw. 2017, 25, 3836–3849. [Google Scholar] [CrossRef]
  17. Monil, M.A.H.; Malony, A.D. QoS-Aware Virtual Machine Consolidation in Cloud Datacenter. In Proceedings of the 2017 IEEE International Conference on Cloud Engineering (IC2E), Vancouver, BC, Canada, 4–7 April 2017; pp. 81–87. [Google Scholar] [CrossRef]
  18. Accelerating Virtual Machine Migration over vSphere vMotion and Mellanox End-to-End 40GbE Interconnect Solutions. Available online: http://www.mellanox.com/related-docs/solutions/SB_Accelerating_Virtual_Machine_Migration.pdf (accessed on 12 September 2021).
  19. Live Migration: TCP vs. RDMA. Available online: https://www.youtube.com/watch?v=u5EWqojkI1A (accessed on 12 September 2021).
  20. Lv, H.; Dong, Y.; Duan, J.; Tian, K. Virtualization challenges. ACM SIGPLAN Not. 2012, 47, 15–26. [Google Scholar] [CrossRef]
  21. Kalyvianaki, E.; Charalambous, T.; Hand, S. Adaptive Resource Provisioning for Virtualized Servers Using Kalman Filters. ACM Trans. Auton. Adapt. Syst. 2014, 9, 10. [Google Scholar] [CrossRef]
  22. Casalicchio, E. A study on performance measures for auto-scaling CPU-intensive containerized applications. Clust. Comput. 2019, 22, 995–1006. [Google Scholar] [CrossRef] [Green Version]
  23. Han, X.; Schooley, R.; MacKenzie, D.; David, O.; Lloyd, W.J. Characterizing Public Cloud Resource Contention to Support Virtual Machine Co-residency Prediction. In Proceedings of the 2020 IEEE International Conference on Cloud Engineering (IC2E), Sydney, NSW, Australia, 21–24 April 2020; pp. 162–172. [Google Scholar] [CrossRef]
  24. Xu, J.; Fortes, J. A multi-objective approach to virtual machine management in datacenters. In Proceedings of the 8th ACM International Conference on PErvasive Technologies Related to Assistive Environments, New York, NY, USA, 14 June 2011; pp. 225–234. [Google Scholar] [CrossRef]
  25. GWA-T-12 Bitbrains. Available online: http://gwa.ewi.tudelft.nl/datasets/gwa-t-12-bitbrains (accessed on 12 September 2021).
  26. Shen, S.; Van Beek, V.; Iosup, A. Statistical Characterization of Business-Critical Workloads Hosted in Cloud Datacenters. In Proceedings of the 2015 15th IEEE/ACM International Symposium on Cluster, Cloud and Grid Computing; Institute of Electrical and Electronics Engineers (IEEE), Shenzhen, China, 4–7 May 2015; pp. 465–474. [Google Scholar] [CrossRef]
  27. Limits on Simultaneous Migrations. Available online: https://docs.vmware.com/en/VMware-vSphere/6.0/com.vmware.vsphere.vcenterhost.doc/GUID-25EA5833-03B5-4EDD-A167-87578B8009B3.html (accessed on 12 September 2021).
  28. Paya, A.; Marinescu, D.C. Energy-Aware Load Balancing and Application Scaling for the Cloud Ecosystem. IEEE Trans. Cloud Comput. 2017, 5, 15–27. [Google Scholar] [CrossRef]
  29. Xi, S.L.; Guevara, M.; Nelson, J.; Pensabene, P.; Lee, B.C.; Nelson, J.; Lee, B.C. Understanding the critical path in power state transition latencies. In Proceedings of the International Symposium on Low Power Electronics and Design (ISLPED), Beijing, China, 4–6 September 2013; pp. 317–322. [Google Scholar] [CrossRef] [Green Version]
  30. Gandhi, A.; Harchol-Balter, M.; Raghunathan, R.; Kozuch, M.A. AutoScale. ACM Trans. Comput. Syst. 2012, 30, 14. [Google Scholar] [CrossRef]
  31. Gandhi, A.; Harchol-Balter, M.; Kozuch, M.A. Are sleep states effective in data centers? In Proceedings of the 2012 International Green Computing Conference (IGCC), San Jose, CA, USA, 4–8 June 2012; pp. 1–10. [Google Scholar] [CrossRef]
  32. Shen, H.; Chen, L. CompVM: A Complementary VM Allocation Mechanism for Cloud Systems. IEEE/ACM Trans. Netw. 2018, 26, 1348–1361. [Google Scholar] [CrossRef]
Figure 1. The number of VMs running on PMs during each simulation.
Electronics 10 02581 g001
Figure 2. CDFs of the requested CPU frequency (left) and the amount of requested RAM (right).
Electronics 10 02581 g002
Figure 3. The influence of the variables Lk, n, m, and l on the (a) the uptime of PMs and the number of VM migrations, (b) the number of CPU and Storage SLA violations, (c) the number of network and memory SLA violations.
Electronics 10 02581 g003aElectronics 10 02581 g003b
Figure 4. The effect of Lk on the quality metrics for power consumption minimization.
Electronics 10 02581 g004
Figure 5. The effect of Tk on the quality metrics for power consumption minimization.
Electronics 10 02581 g005
Figure 6. The effect of Dk on the quality metrics for power consumption minimization.
Electronics 10 02581 g006
Figure 7. The effect of Qk on the quality metrics for power consumption minimization.
Electronics 10 02581 g007
Figure 8. The quality metrics of the power consumption minimization after a simulation run.
Electronics 10 02581 g008
Figure 9. The effect of Tk on the quality metrics for SLA violation minimization.
Electronics 10 02581 g009
Figure 10. The effect of Dk on the quality metrics for SLA violation minimization.
Electronics 10 02581 g010
Figure 11. The effect of Qk on the quality metrics for SLA violation minimization.
Electronics 10 02581 g011
Figure 12. The quality metrics of the SLA violation minimization after a simulation run.
Electronics 10 02581 g012
Figure 13. The number of SLA violations during the simulation run using the model parameters Lk = 0.1, Tk = 0.15, Dk = 0.95, and Qk = 0.4.
Electronics 10 02581 g013
Figure 14. The number of inbound and outbound VM migrations during two simulation runs for both objectives.
Electronics 10 02581 g014
Figure 15. The results of dynamic PM management, resource utilization of active PMs, and VM workload during the simulation run.
Electronics 10 02581 g015
Table 1. Physical machine parameters.
Physical MachineNumberCPU, MHzNumber of PEsRAM, GBStorage Performance, IOPSNetwork Throughput, GbpsPM Names during Experiments
PowerEdge R9405250011238432,00040PM1–PM5
PowerEdge R740525005619223,19040PM6–PM10
PowerEdge R8305220088256800040PM11–PM15
PowerEdge R6305220044128600040PM16–PM20
Table 2. Simulation settings.
ParameterVariableValue
TIME_STEP_VALUE-300, s
STEPS_TO_SIMULATE-1100
RESOURCE_WEIGHTwk1
RESOURCE_THREADHOLDTkchanges, [0.01, 0.03, 0.05, 0.08, 0.1, 0.13, 0.15, 0.2]
RESOURCE_DESIRED_LEVELDkchanges, [0.98, 0.95, 0.93, 0.9, 0.88, 0.85, 0.82, 0.8]
RESOURCE_LOW_LEVELLkchanges, [0.1, 0.15, 0.2, 0.25, 0.3, 0.35, 0.4, 0.45]
RESOURCE_RECEIVER_THREADHOLDQkchanges, [0.98, 0.95, 0.93, 0.9, 0.88, 0.85, 0.82, 0.8]
BEAM_LENGTHnchanges, [4, 5, 6, 7]
VM_PER_SERVERmchanges, [3, 4, 5]
MIN_CHILD_NODES_PER_VMlchanges, [3, 4, 5]
CPU_ON_MIGRATION 100, MHz
MIN_NETWORK_ON_MIGRATION 100, Mbps
Table 3. The area under each curve approximates a specific chart in Figure 3.
The Beam Search Algorithm Parameters (n, m, l)The Area under the Curve
UptimeVM MigrationsCPU SLA ViolationsMemory SLA ViolationsNetwork SLA ViolationsStorage SLA ViolationsSum
6335431451016261722010347
7335436451216661722710364
7445463460115061921810457
6445480471914762022210595
5445501478814862122210687
4445505495534462222611057
5555605495113762322510948
6555611498213362522510981
Table 4. The influence of the model parameters on the quality metrics.
The Model ParameterValueOptimizationUptimeCPU SLA ViolationsMemory SLA ViolationsNetwork SLA ViolationsStorage SLA ViolationsVM Migrations
n, m, ln/aIEMstrongstrongweakstrongweakstrong
Lk0.35PCMstrongstrongstrongweakstrongstrong
0.1SLAVMstrongstrongstrongweakstrongstrong
Tk0.03PCMstrongstrongstrongstrongweakstrong
0.15SLAVMweakstrongweakstrongweakstrong
Dk0.9PCMweakweakweakweakweakweak
0.95SLAVMweakweakweakweakweakweak
Qk0.1PCMstrongstrongweakstrongweakstrong
0.4SLAVMstrongstrongweakstrongstrongweak
Publisher’s Note: MDPI stays neutral with regard to jurisdictional claims in published maps and institutional affiliations.

