Article

RMU-Net: A Novel Residual Mobile U-Net Model for Brain Tumor Segmentation from MR Images

1
Department of Computer Science, University of Okara, Okara 56310, Pakistan
2
School of Computer Science and Engineering Department, Central South University, Changsha 410000, China
3
Computer Science Department, UMM Al-Qura University, Makkah City 21961, Saudi Arabia
4
Department of Computer Science, Lahore Garrison University, Lahore 54000, Pakistan
*
Author to whom correspondence should be addressed.
Electronics 2021, 10(16), 1962; https://doi.org/10.3390/electronics10161962
Submission received: 19 June 2021 / Revised: 20 July 2021 / Accepted: 21 July 2021 / Published: 14 August 2021
(This article belongs to the Special Issue Advances in Machine Learning)

Abstract

:
The most aggressive form of brain tumor is gliomas, which leads to concise life when high grade. The early detection of glioma is important to save the life of patients. MRI is a commonly used approach for brain tumors evaluation. However, the massive amount of data provided by MRI prevents manual segmentation in a reasonable time, restricting the use of accurate quantitative measurements in clinical practice. An automatic and reliable method is required that can segment tumors accurately. To achieve end-to-end brain tumor segmentation, a hybrid deep learning model RMU-Net is proposed. The architecture of MobileNetV2 is modified by adding residual blocks to learn in-depth features. This modified Mobile Net V2 is used as an encoder in the proposed network, and upsampling layers of U-Net are used as the decoder part. The proposed model has been validated on BraTS 2020, BraTS 2019, and BraTS 2018 datasets. The RMU-Net achieved the dice coefficient scores for WT, TC, and ET of 91.35%, 88.13%, and 83.26% on the BraTS 2020 dataset, 91.76%, 91.23%, and 83.19% on the BraTS 2019 dataset, and 90.80%, 86.75%, and 79.36% on the BraTS 2018 dataset, respectively. The performance of the proposed method outperforms with less computational cost and time as compared to previous methods.

1. Introduction

A tumor is a bunch of abnormal cells that grow within the brain. These abnormal cells can cause death if not detected in the early stages. A brain tumor is classified into two main types: benign, which is not cancer, and malignant, a severe type of cancer. Gliomas are the most ordinary kind of brain tumor in adults, which is categorized into two different grades: high-grade gliomas (HGG) proliferate, while low-grade gliomas (LGG) are slowly growing tumors [1]. Primary tumors started within the brain and came from the cells, infiltrating the brain and the nervous system [2]. Secondary tumors begin in one part of the body and metastasize to the brain [3]. Tumors like meningiomas can be easily segmented, while glioblastomas and gliomas are challenging to find and localize due to high contrast and diffusion. In addition, its appearance varies in size, shape, and form, which makes it more challenging to detect. A study concluded that 25 people out of 100,000 have tumors, of which 33% of people were critical [4].
Medical images such as X-rays, CT images, and MRI were used for the diagnosis of diseases. Medical Resonance Imaging has been widely used to detect and treat brain tumors [5]. It provides high-quality images of the brain, which helps for the diagnosis and treatment of tumor. Segmentation of brain tumor using MRI has excellent improvements in diagnosis, treatment, and growth rate. It is essential to separate tumor regions from MRI-captured images accurately. The structure of a brain tumor is complex, which makes it challenging to separate cancer from the brain. Therefore, an automated segmentation technique is required to detect more accurately and segment tumor regions easily. Hand-crafted segmentation is time-consuming and can lead to human errors.
Machine learning-based techniques provide a powerful mechanism for the analysis of medical images. Mounting advanced deep learning models can achieve quick and automatic segmentation of medical images. Several deep learning models such asFCN [6], SegNet [7], U-Net [8], Theory-based [9], and region-based [10] are available for image segmentation. U-Net provides a great perfection in image segmentation among all these models and has attracted attention due to its tremendous performance. U-Net for image segmentation depends on two purposes: First, it works well on small datasets when trained end-to-end. Although it gives better performance as compared with other approaches, it also consumes too much time. We changed the encoding part of U-Net with MobileNetV2 [11], which Google introduced for real-time visual applications and mobile devices to decrease computation cost. It provides superior accuracy with a minimum number of parameters. The proposed hybrid model is named RMU-Net as it is providing the best results by joining the MobileNetV2 with residual blocks and U-Net. The contribution of the proposed work is given below:
  • To introduce a novel end-to-end brain tumor segmentation technique that performs classification on the pixel level.
  • To extract discriminant features for introducing a unique approach with adequate results for a clinical setting.
  • To develop an efficient network that reduces the computational cost while maintaining high accuracy.
  • We are adapting the MobileNetV2 [11] as an encoder for U-Net architecture and identifying the changes in performance.

2. Materials and Methods

Machine learning and digital image processing have been modernized through the innovation of deep learning technology. The power of deep learning methods focuses on images’ ability to generate stable, discriminatory, and useful semantic characteristics. The word deep refers to the addition of more layers to increase the network size. Deep learning has created advancements in many fields such as medical image analysis [12], security applications [13], and agriculture [14]. Convolutional neural networks are the most frequently used technique to solve image-based problems. In the proposed CNN model, various combinations of layers are used. A threshold-based deep learning model was proposed [15] in which a multi-level neural network was used to diagnose glaucoma using fundus images. The dataset was collected locally and pre-processed using an adaptive histogram equalizer to remove noise. Two deep learning models are used, one for glaucoma detection as detection-net and another for classification of affected and non-affected glaucoma images. The outcome of the network performs well as compared to previous approaches. The deep LSTM used by Ghulam Ali et al. [16] and the IoT sensors integration helps detect the availability of available parking slots. Birmingham parking dataset was used for the evaluation of the model. Three different experiments were performed based on the different regions and time. This models outperforms from the state-of-the-art methods.Different convolutional network models are U-Net [8], AlexNet [17], ResNet [18], VGG16 [19], DenseNet [20], and Inception [21].
This research aims to segment LGG (low-grade gliomas) brain tumours from MRI images using three models. The first model used is MobileNetV2 [11], released by Google and belongs to the family of neural network architectures used on machines with limited computational power, such as mobile devices. The complete architecture of the MobileNetV2 is shown in Figure 1. It provides promising accuracy results while requiring less computational memory as well as computational power. Moreover, it makes them a high-speed network for image processing tasks. MobileNetV2 is a lightweight convolutional neural network used in synchronous functions for two reasons; first, the number of trainable parameters is less than traditional convolution; it reduces computational costs because of the minimum number of parameters.
In the second network, the standard encoder-decoder architecture of U-Net [8] was maintained. However, we replaced the encoder part with the MobileNetV2. The upsampled part of U-Net is used as a decoder. The architecture of MU-Net with encoder-decoder parts is shown in Figure 2. The features from the input dataset are extracted with MobileNetV2. These features are passed to the decoder part of MU-Net for the segmentation task.
The third model takes inspiration from the ResNet [18] deep learning model, in which a residual learning framework was used to train deeper models. In this model, the residual blocks are added to the network architecture of MobileNetV2, as shown in Figure 3. As a result, the gradient becomes very small due to the deeper residual network, and the training errors decrease due to the additional layers. This modified network is used as an encoder part in the final proposed model named RMU-Net.
One can observe the main difference between this model and the standard U-Net architecture, which has a more complex system of skip connections. Residual blocks are now also present in the encoder part of the network in RMU-Net, propagating information from deeper parts of the encoder up to the topmost layers. The features from the encoder part are given to the decoder part directly without using any connection. Moreover, deep supervision is also present here; however, it is placed along with the first skip connection. The benefit of this approach with RMU-Net is that the blocks along the first concatenation produce full-resolution segmentation maps, consisting of upsampled feature data from the deeper layers of the encoder.
The goal of segmentation is to simplify or change the representation of an image into something meaningful and easier to analyze. The proposed network works in two phases; first, the network is trained to target three classes of the tumor (Enhanced Tumor, Whole Tumor, Tumor Core). The input of the network is an MRI image, and its corresponding label masks all three classes. All the image pixels are assigned to one of the three classes. The output of the network is three predicted masks for each category. The evaluation of the results is conducted by comparing the actual mask and the predicted mask of each type using a dice coefficient score.

2.1. Dataset Definition

2.1.1. BraTS 2020

The BraTS 2020 dataset [22,23,24,25] is used in this research to evaluate the performance of the proposed network. There are 369 training, 125 validation, and 169 test multi-modal brain MR studies.T1-weighted (T1), post-contrast T1-weighted (T1ce), T2-weighted (T2), and fluid-attenuated inversion recovery (Flair) sequences are included in each study, as shown in Figure 4. The size of all the MR images is 240 × 240 × 155. In addition, experts annotated the enhancing tumor (ET), peritumoral edema (ED), as well as the necrotic and non-enhancing tumor core (NET) for each study. For online evaluation and final segmentation competition, the annotations for training studies are made public, whereas the annotations for validation and test trials are kept withheld.

2.1.2. BraTS 2019

The BraTS 2019 dataset [22,23,24] consists of 259 HGG and 76 LGG MRI scans. The ground truth of all the images has been created manually using the same annotation protocol. Annotations were approved by experienced neuroradiologists [25], which contains enhancing tumor (ET label 4), the peritumoral edema (ED label 2), and the necrotic or non-enhancing tumor core (NCR/NET label 1). Figure 5 shows the sample images from the BraTS 2019 dataset.

2.1.3. BraTS 2018

The BraTS 2018 challenge training dataset [22,23,24] consists of 210 HGG and 75 LGG scans. The validation dataset includes 66 different MRI scans. All MRI of the BraTS 2018 dataset has a volume dimension of 240 × 240 × 155. The MRI volumes have been segmented manually by one to four raters, and experienced neuroradiologists approved their annotations. Each tumor was segmented into edema, necrosis, and non-enhancing tumor and active/enhancing tumor. The sample images from the BraTS 2018 dataset are shown in Figure 6.

2.2. Evaluation Metrics

An essential part of evaluating the neural network’s success is comparing segmented images to determine segmentation accuracy. The dice similarity coefficient (DSC) [26] is the most common and popular evaluation measure for comparing the segmented image and its ground truth. It compares two sets, Q1 and Q2, by normalizing their intersection sizes over the average of their sizes. The formula for DSC is given in the following equation:
D S C = 2 Q 1 Q 2 Q 1 + Q 2 .
Jaccard similarity coefficient (Jaccard) [26] is also an evaluation measure of the segmentation methods. For example, the following equation is given by Jacquard to calculate the match of two Q1 and Q2 sets by normalizing the size of their intersection over their union:
J a c c a r d = Q 1 Q 2 Q 1 Q 2 .
Sensitivity and specificity are statistical decision theory metrics and are determined using the following equations, respectively.
S e n s i t i v i t y = T P T P + F N
S p e c i f i c i t y = T N T N + F P
We used the Jaccard score, dice coefficient score, sensitivity, and specificity to evaluate the performance of the proposed network.

2.3. Model Training

Following normalization, cropping, and resampling the images, the next step was training the model to extract the multiclass tumor segments automatically. Samples were processed one by one rather than in batches due to the data’s dimensionality. The training dataset is divided into an 80–20 train–test split. All three network models are trained with the training period spanning 200 epochs and using a learning rate of 0.0001. The networks are trained by Adam [27], which is an adaptive first-order gradient-based optimization algorithm. The size of the minibatch is 16 image crops. We also use early stopping, which means the training process will be terminated if there is no improvement after ten epochs on the validation data. We decrease the learning rate by multiplying a factor of 0.4 when the validation loss has no improvement for five epochs. Unless otherwise specified, we use cross-entropy as the default loss function. The MobileNetV2 takes three h and 23 min, MU-Net takes two h 57 min, and the proposed model takes two hours and 47 min to complete the training process. The test speed of MobileNetV2, MU-Net, and the proposed network are 3.5, 3.2, 2.8 s per subject, respectively.

3. Results

In this section, the performance of the proposed models is discussed. Several experiments were conducted to identify the improvements in the final model. A detailed description of experiments is presented in this section, including a summary of investigations conducted in the research. Following the best model configuration being selected, the results on BraTS 2020, BraTS 2019, and BraTS 2018 datasets were obtained.

3.1. Pre-Processing

The first step in any data-driven study is to pre-process the raw images. First, the images of all three datasets are resized to 224 × 224 for feeding as input to MobileNetv2. In every dataset, each subject contains four images with annotated masks. All the images are given to the networks by considering each image separately as ET, TC, and TC classes.
First, the MobileNetV2 model discussed in the previous section is trained on the BraTS datasets. The results of the model are presented in Table 1 and Table 2. The performance of MobileNetV2 is less in terms of dice coefficient score. However, the computational cost of MobileNetV2 is much smaller, with 4.6 million trainable parameters and 53 MB of model size.
To increase the dice score, a hybrid deep learning model MU-Net is used in which MobileNetV2 is used as an encoder part for feature extraction. MobileNetV2 is a lightweight neural network that reduces trainable parameters. The decoder part of the U-Net is used for tumor segmentation. The results of this model are shown in Table 3 and Table 4. The results of MU-Net are improved with fewer computational parameters.

3.2. Data Augmentation

To generate extra input samples for model training, data augmentation techniques are employed to create synthetic examples of real-world data. As stated by [28], the objective of using data augmentation for datasets with limited data is to produce a more robust dataset for the model during training. This is generally helpful for training models tasked with solving scarce data, such as biomedical image segmentation. The original U-Net [8] proposal also made use of data augmentation techniques in this regard. The different types of augmentation used in this study are discussed below.

3.2.1. Scaling and Rotation

Deep neural networks models can learn important deep features using a scaled version of the training set. This operation G can be performed in different directions, and Gx and Gy represents the scaling factors for the X and Y directions. Due to the different tumorsizes, scaling can generate viable augmented images for training. Scaling is combined with cropping to maintain the dimensions of the input image.Cropping can limit only to those parts of the image that are necessary.

3.2.2. Flip and Rotation

Random flipping produces a mirror reflection of the original image along axes. Natural images may usually be flipped along the horizontal axis, but not the vertical axis because up and down components of an image are not always “interchangeable”. A similar property applies to MRI brain images: a brain contains two hemispheres in the axial plane, and the brain can be considered anatomically symmetrical in most circumstances. The left hemisphere is swapped with the right hemisphere when you flip along the horizontal axis and vice versa. In this case, rotating an image by an angle around the central pixel can be helpful. After that, appropriate interpolation was used to fit the original image size. The rotation operation Z is frequently used in which zero paddings is applied to missing pixels.
An ablation study was conducted to assess whether data augmentation was beneficial to the final model predictions, comparing two separate training runs. The results are presented in Table 5 and Table 6. From the scores obtained, one can observe how data augmentation was beneficial across all the evaluation criteria and greatly improved the model’s brain tumor segmentation capabilities.

3.3. Encoder Features with Residual Blocks

The second model is a more compact version of the proposed MU-Net model. This model follows the standard U-Net model closely with a minor change: residual blocks are added to the architecture of MobileNetV2, the encoder part of U-Net is replaced with the modified MobileNetV2 architecture. The experiments of this model were conducted using augmentation, and one was trained without augmentation. We compared the results of the model, as shown in Table 7 and Table 8. The results of the augmentation model were promising as compared to the model without augmentation.

3.4. Using Dropout Regularization

Dropout regularization is commonly used in CNNs to reduce the possibility of the model overfitting the training data. However, the latter process causes the model to only learn the salient features from the training data rather than generalize for new, unseen samples. In this experiment, we used the original online repository’s dropout value of 0.3, with the results shown in Table 9 and Table 10. The results for this dropout value show that there was no substantial improvement in terms of the model prediction. For this reason, we decided not to use dropout regularization going forward. In our case, experiment prioritization is the main reason for only having a singular dropout test using a value of 0.3. Thus, additional testing with other dropout values is encouraged, as it may lead others to obtain more positive results.

4. Discussion

4.1. Comparison of RMU-Net with other Deep Learning Segmentation Models

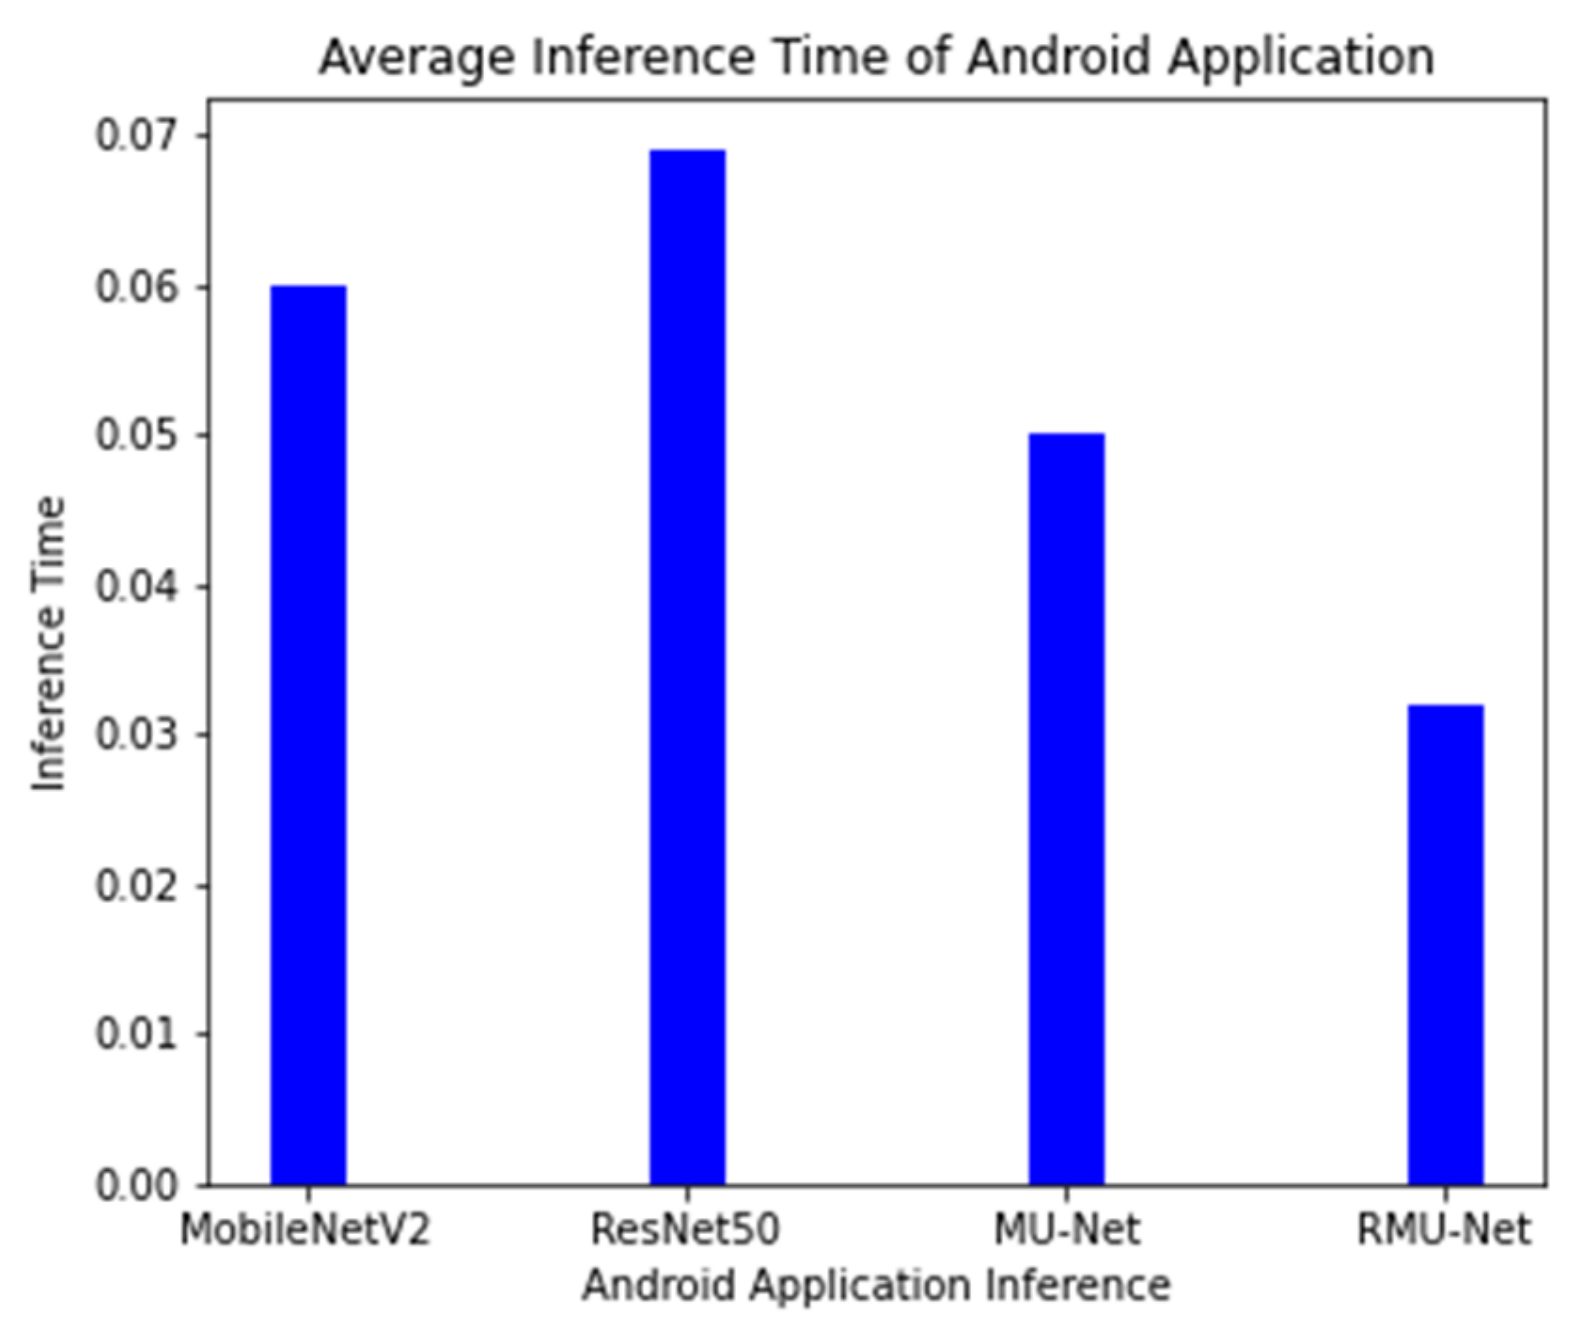
On an industrial machine, the proposed model is tested, and the cost of computation is compared with the current system. RMU-Net is a deep, lightweight neural network designed with convolution depth-wise. In U-Net, the depth-wise convolution used is much faster than standard convolution. On the central processor unit (CPU) platform, separation convolution is generally quicker than traditional convolution. On both GPU and CPU platforms, the proposed RMU-Net performs well in segmentation time. However, the number of parameters impacts the number of computer resources used and the time it takes to train. RMU-Net time is also assessed on various hardware platforms, including two GPU platforms (GTX 1080Ti and GTX 745), a CPU platform (Intel i7), and an embedded platform. The suggested RMU-Net performs well in segmentation time on the GPU platform with two h 47 min. However, the CPU takes 47 h, while the embedded system takes 32 h to complete the process. A lighter weight model with a limited number of parameters and model size is the proposed technique. The results obtained from different segmentation models are shown in Table 11, which includes a brief explanation, trainable parameters, and the models’ size.
In the article [29], Lucas Fidon introduced a 3D U-Net model to segment brain tumors. The author used the same model as before, but he experimented with non-standard loss functions such as the Wasserstein loss function. Ranger, a non-standard optimizer, was adopted for optimization. Ranger is a more generalized version of Adam that works well with small batches and noisy labels. To find the best results, three deep learning models were trained using different optimizers. The BraTS 2020 dataset was used to test the model. The model had dice scores of 88.9%, 84.1%, 81.4% for the whole tumor, tumor core, and enhanced tumor, respectively, and Hausdorff distances of 6.4, 19.4, and 15.8 for the entire tumor, tumor core, and enhanced tumor. Another automatic brain tumor segmentation approach was proposed by Yixin Wang et al. [30] with modality-pairing learning methods. To extract complex information from several modalities, different layer connections were used. An average ensemble of all the models was used to obtain results, along with post-processing methods. The model performed well on the BraTS 2020 dataset, with dice scores of 89.1%, 84.2%, and 81.6% for the entire tumor, tumor core, and enhanced tumor, respectively. Haozhe jia et al. [31] used H2NF-Net for the segmentation of brain tumor from multi-modal MRI images. To separate the distinct parts of the tumor, the author employed a single, cascaded network and concatenated the pre-predictions to reach the final segmentation result. BraTS 2020 training and validation datasets were used to train and evaluate the model. The model attained dice scores of 78.75%, 91.29%, and 85.46% for the enhanced tumor, whole tumor, and tumor core, respectively, and Hausdorff distances of 26.57, 4.18, and 4.97 by integrating the single and cascaded networks.
A modified nnU-Net was proposed by [32] for the segmentation of brain tumors with data augmentation, post-processing, and region-based training. The model showed improved results with several minor modifications and achieved first place in the BraTS 2020 dataset challenge. The dice scores of the model were 88.95%, 85.06%, and 82.03% for the whole tumor, tumor core, and enhanced tumor, respectively. Wenbo Zhang et al. [33] used a multi-encoder framework for brain tumor segmentation. In addition, the author created a new loss function called categorical loss and assigned various weights to different segmented regions. The model was evaluated using the BraTS 2020 dataset. The method achieved promising results with dice scores of 70.24%, 88.26%, and 73.86% for the entire tumor, tumor core, and enhanced tumor. A deep neural network architecture for brain tumor segmentation [34] is proposed to cascade three deep learning models. The output feature map of the previous stage was used in the next step as input. The dataset used for this study was the publicly available BraTS 2020 dataset. The model achieved dice scores of 88.58%, 82.97%, and 79% for the whole tumor, core tumor, and enhanced tumor. Another modified architecture of U-Net was proposed by Parvez Ahmad et al. [35] for automatic brain tumor segmentation. The author extracts multi-contextual features by using dense connections between encoder and decoder. In addition, local and global information was also extracted with residual inception blocks. The author validated the model on the BraTS 2020 dataset. The dice scores for the whole tumor, tumor core, and enhanced tumor were 89.12%, 84.74%, and 79.12%, respectively.
Henry et al. [36] trained multiple U-Net network-like models with stochastic weights and deep vision on a Multi-modal BraTS 2020 training dataset to make the process automated and standardized. Two different models were trained separately, and feature maps from both models were concatenated. The BraTS 2020 test dataset was used for testing the model that achieved dice scores of 81%, 91%, and 95% for the enhanced tumor, whole tumor, and tumor core. Carlo Russo [37] used spherical space transformed input data to extract better features than standard feature extraction methods. The spherical coordinate transformation was used as pre-processing to improve the accuracy for brain tumor segmentation on the BraTS 2020 dataset. The model achieved dice scores for the whole tumor, tumor core, and enhanced tumor of 86.87%, 80.66%, and 78.98%. In article [38], the author trained a two-dimensional network for the three-dimensional segmentation of a brain tumor. EfficientNet was used as the encoder part that achieved promising results compared to previous work with dice scores of 69.59%, 80.86%, and 75.20% for the enhanced tumor, whole tumor, and tumor core.
A multi-step deep neural network [39] was proposed, which takes the hierarchical structure of the brain tumor and segments the substructures. Deep supervision along with data augmentation techniques was used to overcome the gradient vanishing and overfitting. The model has evaluated the BraTS 2019 dataset with dice scores of 88.6%, 81.3%, 77.1% for the whole tumor, tumor core, and enhanced tumor. Wang et al. [40] proposed a 3D U-net based deep earning model using brain-wise normalization and a patching method for brain tumor segmentation. The model was tested on the BraTS 2019 challenge dataset. Dice scores of the enhanced tumor, tumor core and whole tumor are 77.8%, 79.8%, and 85.5%. In [41], a CNN model was trained on high-contrast images to improve the segmentation results of the sub-regions. A Generative Adversarial Network is used for synthesizing high-contrast images. The experiments were conducted on the BraTS 2019 dataset, showing that the high-contrast images have more segmentation accuracy. The dice scores of the synthetic images are 76.65%, 89.65%, and 79.01% for the ET, WT, and TC, respectively.
An automated three-dimensional [42] deep model for the segmentation of gliomas in 3D pre-operative MRI scans was proposed—the model segments the tumor and its subregions. One deep learning model learns the local features of the input data, and another model extracts the global features from the whole image. The output from both the models is ensembled to develop a more accurate learning process. The model is trained on the BraTS 2019 dataset, which gives promising segmentation results. A comparison of 3D semantic segmentation [43], convolutional neural network, and encoder–decoder architecture is used to improve the performance of the segmentation results. The method is evaluated on the BraTS 2019 dataset, which achieved dice scores for the ET, WT, and TC classes of 82.6%, 88.2%, and 83.7%, respectively. The segmentation results of the testing dataset were 0.82, 0.72, and 0.70 for the whole tumor, tumor core, and enhanced tumor.
A two-step approach [44] for brain tumor segmentation was proposed using two different 3D U-net models. First, the tumor is located using 3D U-net, and the second model segments the detected tumor into sub regions. The segmentation results of the ET, WT, and TC classes are 62.1, 84.4, and 72.8, respectively. An automated 2D [45] brain tumor segmentation method is proposed. The network architecture used in this work was a modified U-net architecture for improving the segmentation results. To address the class imbalance problem, weighted cross-entropy and the generalized dice score were used as loss functions. The proposed segmentation system has been tested on the BraTS 2018 dataset, which achieved dice scores of 78.3%, 86.8%, and 80.5%, respectively. Another modified 3D U-net architecture [46] was introduced with the augmentation technique to handle MRI input data. The quality of the tumor segmentation was enhanced with context obtained from models of same network. A cascade of CNN networks [47] for the segmentation of brain tumors using MRI images was introduced that is a trade-off between computational cost and model complexity. Experiments with the BraTS dataset showed that the model achieved dice scores for WT, ET, and TC of 90.5%, 78.6%, and 83.8%, respectively.
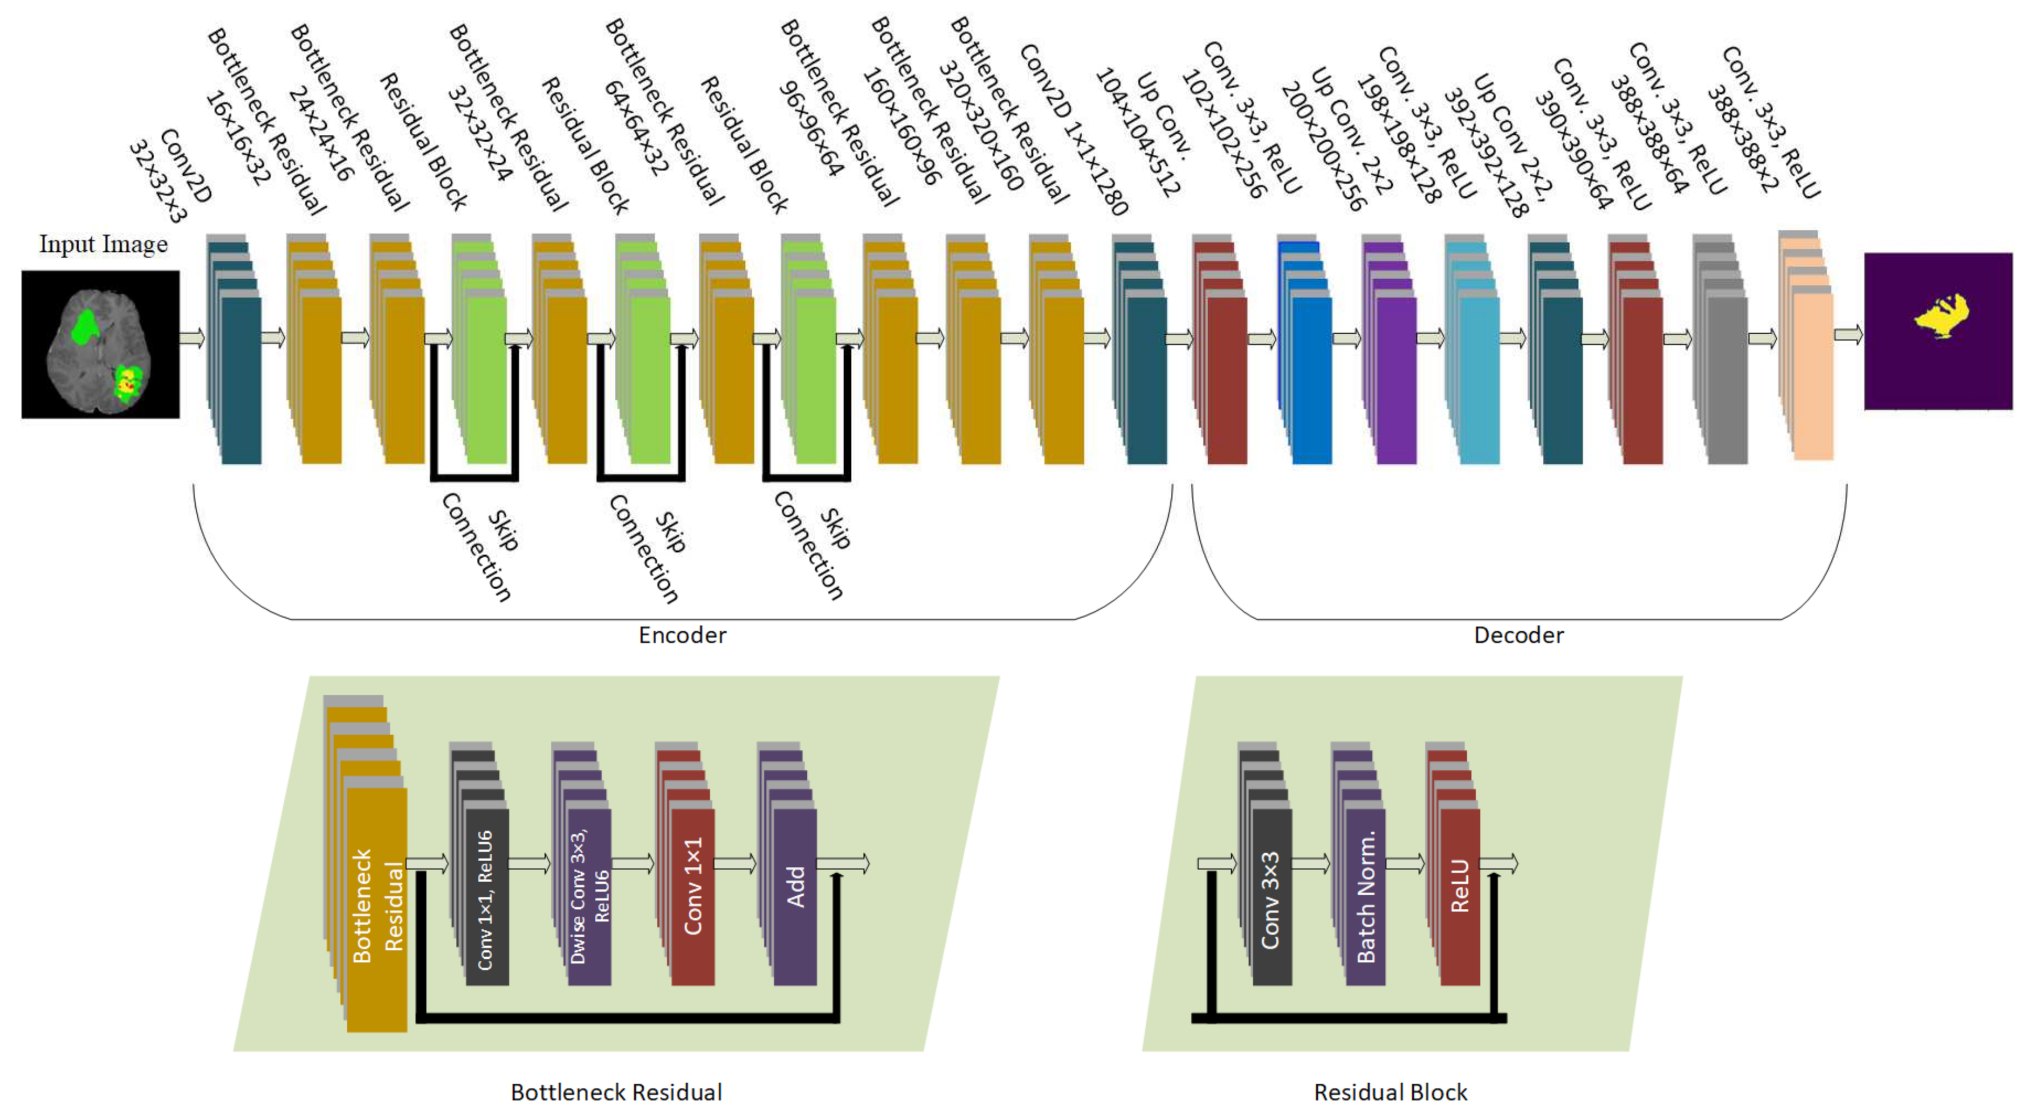
A similar model was proposed by AMADEUS et al. [49], which introduced an approach that can be used in low resource devices such as mobile devices. Two different models were introduced in which both models used three convolutional layers to decrease the computational cost. Batch normalization, residual layers, and depthwise separable convolution layers were used to preserve the features and reduce the number of operations. These models were tested on ImageNet, CIFAR 10, CIFAR 100, and some other datasets. The input size of the datasets was 32 × 32 with total trainable parameters of 907,449. Whereas, in the proposed model, we applied the modified architecture of MobileNetV2 with additional residual blocks as an encoder, which was integrated with the U-Net decoder for the segmentation task. The input size is 224 × 224 with a total of 4.6 million trainable parameters.
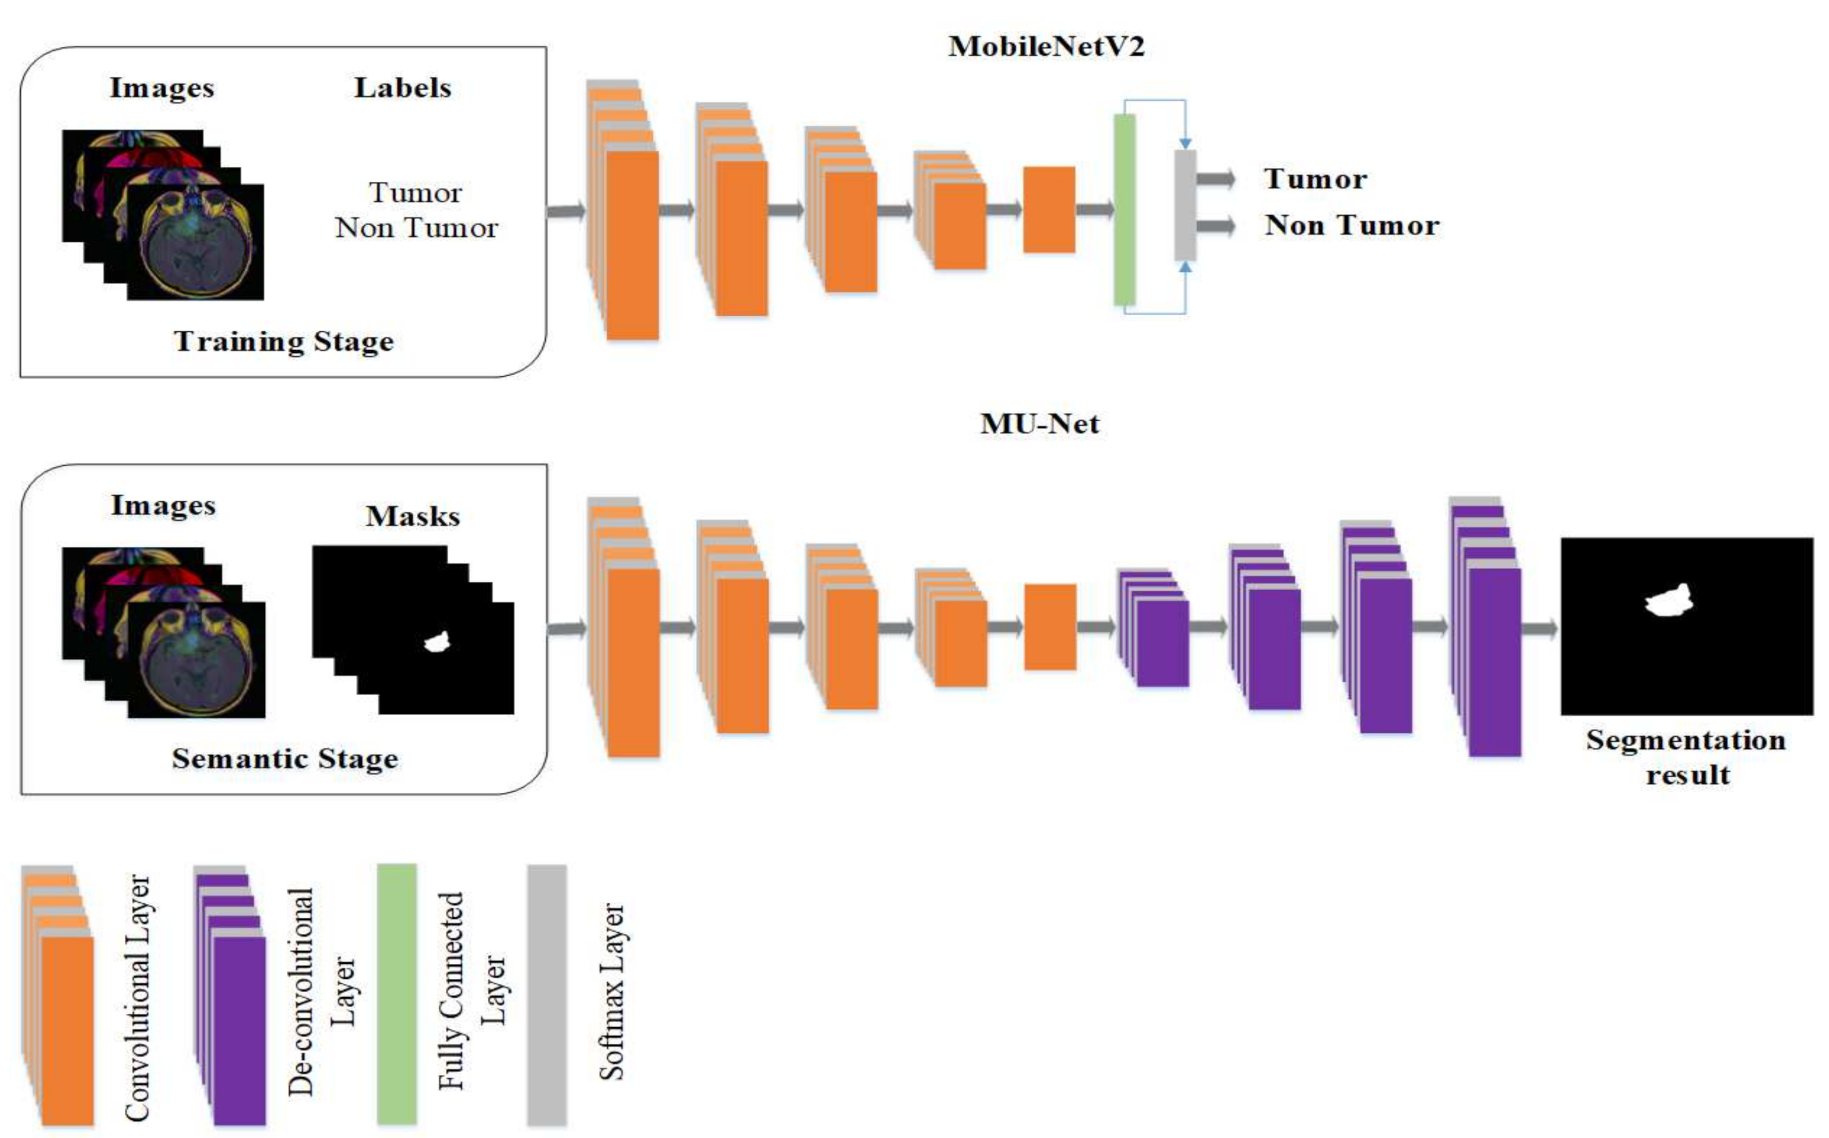
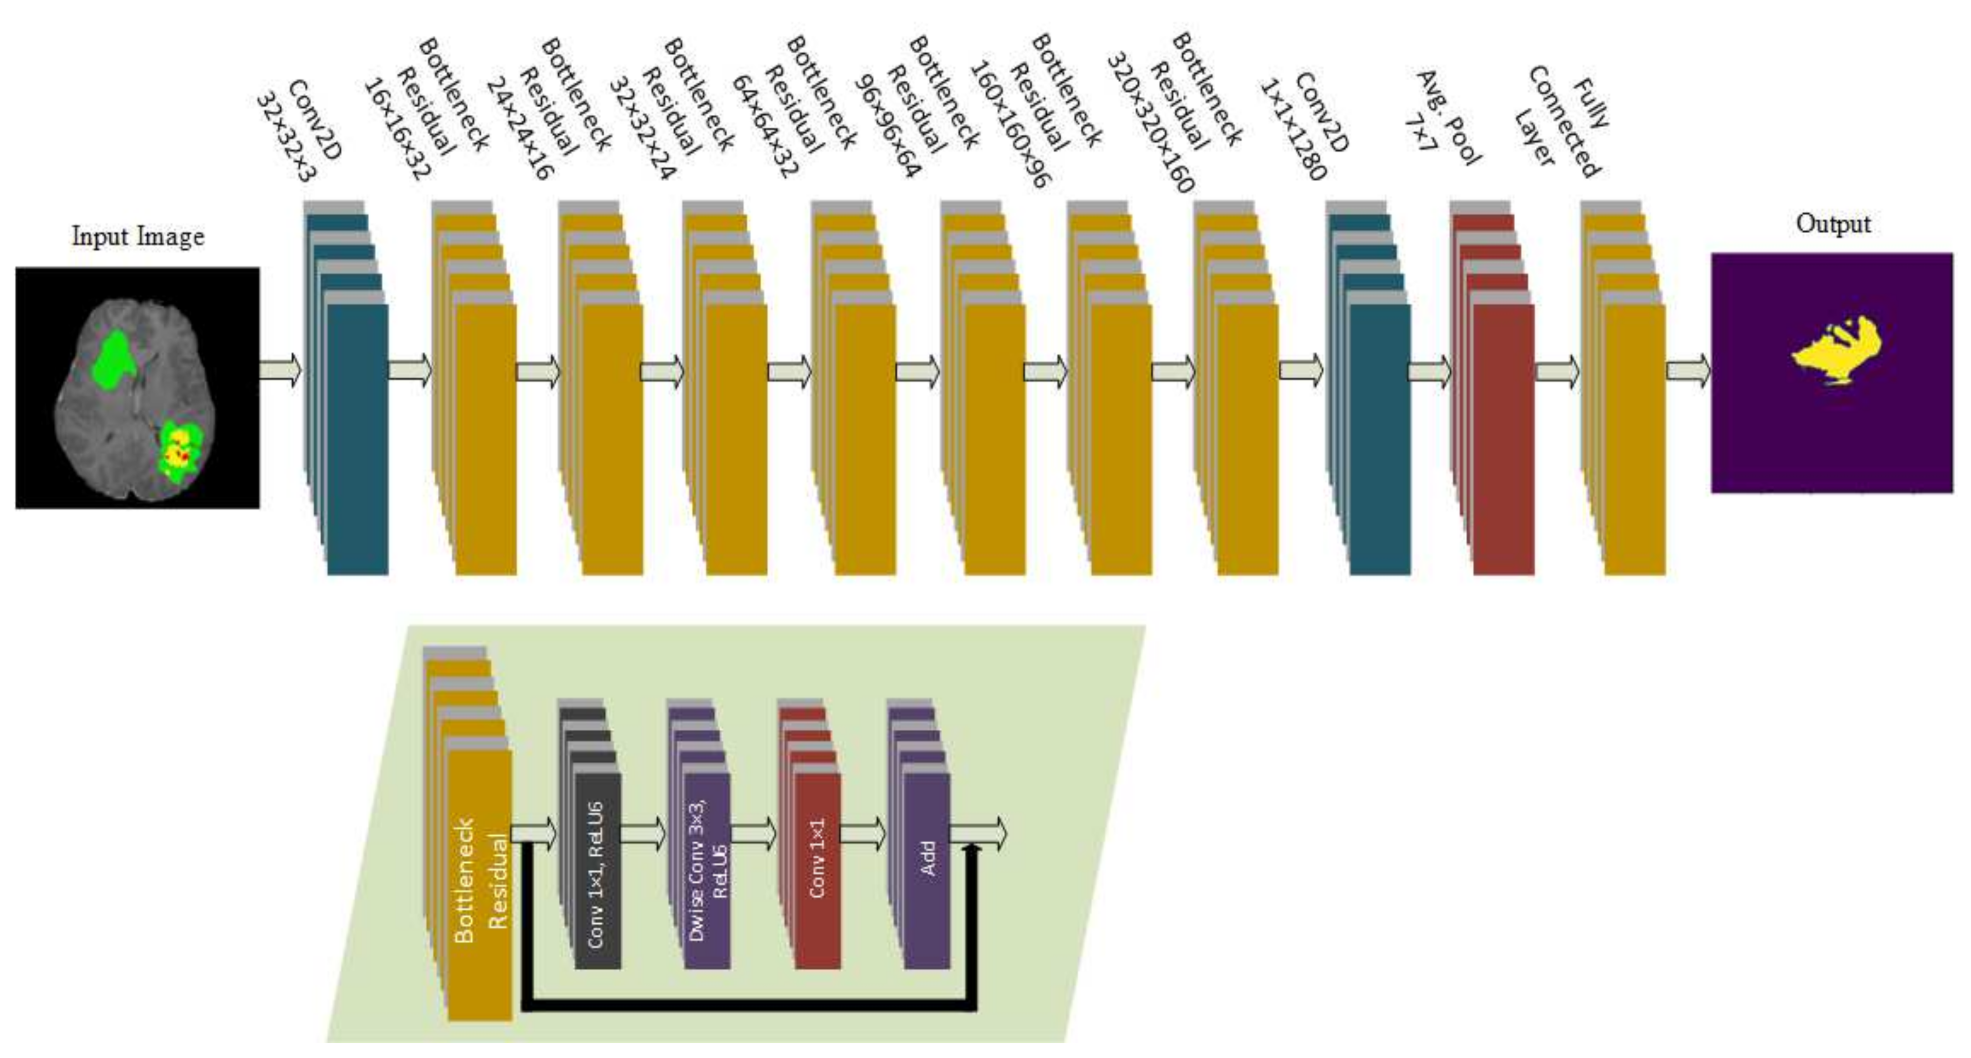
The model proposed in this study used an encoder–decoder architecture for brain tumor segmentation. The encoder part used modified MobileNetV2 for extracting features from MRI images. These feature maps were given as input to the decoder part of U-Net [8] for the segmentation task. The model is evaluated using the BraTS 2020 dataset. The model contains 4.6M parameters along with a model size of 53MB. Experiments show that the model achieved the dice coefficient scores for WT, TC, and ET as 91.35%, 88.13%, and 83.26% on BraTS 2020, 91.76%, 91.23%, and 83.19% on BraTS 2019, 90.80%, 86.75%, and 79.36% on BraTS 2018 datasets, respectively. Thus, RMU-Net is an improved method for brain tumor segmentation with fewer computational parameters while maintaining high accuracy.

4.2. Inference Time of Android Application

All the deep learning models trained in this work are tested in Android application. The specifications of the mobile device used are an Android 11, MIUI 12, CPU Octa-core, GPU Adreno 618 with 8GB RAM. The inference times of all the models are compared using prediction time. The results of the proposed models are shown in Figure 7. The time taken by the models for a single prediction is represented with the blue bar. The result shows that the proposed network model gives fast performance in theAndroid application platform as compared to other models.

5. Conclusions

In diagnostic procedures, brain tumor segmentation is an essential process. Medical diagnosis is easy with specific segmentation, but the chances of survival of the subject are also greatly improved. In this research, an efficient deep learning RMU-Net model for brain tumor segmentation is proposed, which is inspired by MobileNetV2 and U-net. RMU-Net is evaluated on the BraTS 2020, BraTS 2019, and BraTS 2018 datasets. Compared with other deep learning models, RMU-Net has fewer parameters and achieved the dice coefficient scores for WT, TC, and ET as 91.35%, 88.13%, and 83.26% on BraTS 2020, 91.76%, 91.23%, and 83.19% on BraTS 2019, 90.80%, 86.75%, and 79.36% on BraTS 2018 datasets, respectively. However, RMU-Net’s training requires a large amount of brain tumor manually annotated data; therefore, developing a weak supervised and unsupervised brain tumor segmentation method will be the direction of future research.

Author Contributions

M.U.S. and G.A. have proposed the research conceptualization and methodology. The technical and theoretical framework is prepared by, W.B. and S.H.A. The technical review and improvement have been performed by M.U.S., M.A.A. and G.A. The overall technical support, guidance, and project administration is done by A.A.N., K.M. The editing and finally proofread is done by R.u.A. All authors have read and agreed to the published version of the manuscript.

Funding

This research received no external funding.

Conflicts of Interest

The authors declared there is no conflict of interest.

References

  1. Bauer, S.; Wiest, R.; Nolte, L.-P.; Reyes, M. A survey of MRI-based medical image analysis for brain tumor studies. Phys. Med. Biol. 2013, 58, R97. [Google Scholar] [CrossRef] [Green Version]
  2. Langegård, U.; Ahlberg, K.; Björk-Eriksson, T.; Fransson, P.; Johansson, B.; Ohlsson-Nevo, E.; Witt-Nyström, P.; Sjövall, K. The art of living with symptoms: A qualitative study among patients with primary brain tumors receiving proton beam therapy. Cancer Nurs. 2020, 43, E79. [Google Scholar] [CrossRef]
  3. Fujii, M.; Ichikawa, M.; Iwatate, K.; Bakhit, M.; Yamada, M.; Kuromi, Y.; Sato, T.; Sakuma, J.; Sato, H.; Kikuta, Y.; et al. Secondary brain tumors after cranial radiation therapy: A single-institution study. Rep. Pract. Oncol. Radiother. 2020, 25, 245–249. [Google Scholar] [CrossRef]
  4. Stoyanov, G.S.J.G. The 2016 revision of the World Health Organization classification of tumors of the central nervous system: Evidence-based and morphologically flawed. Glioma 2019, 2, 165. [Google Scholar] [CrossRef]
  5. Wadhwa, A.; Bhardwaj, A.; Verma, V.S. A review on brain tumor segmentation of MRI images. Magn. Reson. Imaging 2019, 61, 247–259. [Google Scholar] [CrossRef]
  6. Li, H.; Li, A.; Wang, M. A novel end-to-end brain tumor segmentation method using improved fully convolutional networks. Comput. Biol. Med. 2019, 108, 150–160. [Google Scholar] [CrossRef]
  7. Badrinarayanan, V.; Kendall, A.; Cipolla, R. Segnet: A deep convolutional encoder-decoder architecture for image segmentation. IEEE Trans. Pattern Anal. Mach. Intell. 2017, 39, 2481–2495. [Google Scholar] [CrossRef]
  8. Ronneberger, O.; Fischer, P.; Brox, T. U-net: Convolutional networks for biomedical image segmentation. In Proceedings of the International Conference on Medical Image Computing and Computer-Assisted Intervention, Munich, Germany, 5–9 October 2015; pp. 234–241. [Google Scholar]
  9. Lizarraga-Morales, R.A.; Sanchez-Yanez, R.E.; Ayala-Ramirez, V.; Patlan-Rosales, A.J. Improving a rough set theory-based segmentation approach using adaptable threshold selection and perceptual color spaces. J. Electron. Imaging 2014, 23, 013024. [Google Scholar] [CrossRef] [Green Version]
  10. Wang, Z.; Jensen, J.R.; Im, J.J.E.M. An automatic region-based image segmentation algorithm for remote sensing applications. Environ. Modell. Softw. 2010, 25, 1149–1165. [Google Scholar] [CrossRef]
  11. Sandler, M.; Howard, A.; Zhu, M.; Zhmoginov, A.; Chen, L.-C. Mobilenetv2: Inverted residuals and linear bottlenecks. In Proceedings of the IEEE Conference on Computer Vision and Pattern Recognition, Salt Lake City, UT, USA, 18–23 June 2018; pp. 4510–4520. [Google Scholar]
  12. Litjens, G.; Kooi, T.; Bejnordi, B.E.; Setio, A.A.A.; Ciompi, F.; Ghafoorian, M.; Van Der Laak, J.A.; Van Ginneken, B.; Sánchez, C.I. A survey on deep learning in medical image analysis. Med Image Anal. 2017, 42, 60–88. [Google Scholar] [CrossRef] [PubMed] [Green Version]
  13. Guo, W.; Mu, D.; Xu, J.; Su, P.; Wang, G.; Xing, X. Lemna: Explaining deep learning based security applications. In Proceedings of the 2018 ACM SIGSAC Conference on Computer and Communications Security, Toronto, ON, Canada, 15–19 October 2018; pp. 364–379. [Google Scholar]
  14. Kamilaris, A.; Prenafeta-Boldú, F.X. Deep learning in agriculture: A survey. Comput. Electron. Agric. 2018, 147, 70–90. [Google Scholar] [CrossRef] [Green Version]
  15. Aamir, M.; Irfan, M.; Ali, T.; Ali, G.; Shaf, A.; Al-Beshri, A.; Alasbali, T.; Mahnashi, M.H.J.D. An adoptive threshold-based multi-level deep convolutional neural network for glaucoma eye disease detection and classification. Diagnostics 2020, 10, 602. [Google Scholar] [CrossRef]
  16. Ali, G.; Ali, T.; Irfan, M.; Draz, U.; Sohail, M.; Glowacz, A.; Sulowicz, M.; Mielnik, R.; Faheem, Z.B.; Martis, C.J.E. IoT based smart parking system using deep long short memory network. Electronics 2020, 9, 1696. [Google Scholar] [CrossRef]
  17. Alom, M.Z.; Taha, T.M.; Yakopcic, C.; Westberg, S.; Sidike, P.; Nasrin, M.S.; Van Esesn, B.C.; Awwal, A.A.; Asari, V.K. The history began from alexnet: A comprehensive survey on deep learning approaches. arXiv 2018, arXiv:1803.01164. [Google Scholar]
  18. Targ, S.; Almeida, D.; Lyman, K. Resnet in resnet: Generalizing residual architectures. arXiv 2016, arXiv:1603.08029. [Google Scholar]
  19. Qassim, H.; Verma, A.; Feinzimer, D. Compressed residual-VGG16 CNN model for big data places image recognition. In Proceedings of the 2018 IEEE 8th Annual Computing and Communication Workshop and Conference (CCWC), Las Vegas, NV, USA, 8–10 January 2018; pp. 169–175. [Google Scholar]
  20. Iandola, F.; Moskewicz, M.; Karayev, S.; Girshick, R.; Darrell, T.; Keutzer, K. Densenet: Implementing efficient convnet descriptor pyramids. arXiv 2014, arXiv:1404.1869. [Google Scholar]
  21. Barratt, S.; Sharma, R.J. A note on the inception score. arXiv 2018, arXiv:1801.01973. [Google Scholar]
  22. Menze, B.H.; Jakab, A.; Bauer, S.; Kalpathy-Cramer, J.; Farahani, K.; Kirby, J.; Burren, Y.; Porz, N.; Slotboom, J.; Wiest, R.; et al. The multimodal brain tumor image segmentation benchmark (BRATS). IEEE Trans. Med Imaging 2014, 34, 1993–2024. [Google Scholar] [CrossRef]
  23. Bakas, S.; Akbari, H.; Sotiras, A.; Bilello, M.; Rozycki, M.; Kirby, J.S.; Freymann, J.B.; Farahani, K.; Davatzikos, C. Advancing the cancer genome atlas glioma MRI collections with expert segmentation labels and radiomic features. Sci. Data 2017, 4, 1–13. [Google Scholar] [CrossRef] [Green Version]
  24. Bakas, S.; Reyes, M.; Jakab, A.; Bauer, S.; Rempfler, M.; Crimi, A.; Shinohara, R.T.; Berger, C.; Ha, S.M.; Rozycki, M.; et al. Identifying the best machine learning algorithms for brain tumor segmentation, progression assessment, and overall survival prediction in the BRATS challenge. arXiv 2018, arXiv:1811.02629. [Google Scholar]
  25. Bakas, S.; Akbari, H.; Sotiras, A.; Bilello, M.; Rozycki, M.; Kirby, J.; Freymann, J.; Farahani, K.; Davatzikos, C.J.T.c.i.a. Segmentation labels and radiomic features for the pre-operative scans of the TCGA-LGG collection. Cancer Imaging Arch. 2017, 286. [Google Scholar] [CrossRef]
  26. Yeghiazaryan, V.; Voiculescu, I. An Overview of Current Evaluation Methods Used in Medical Image Segmentation; University of Oxford: Oxford, UK, 2015. [Google Scholar]
  27. Bock, S.; Weiß, M. A proof of local convergence for the Adam optimizer. In Proceedings of the 2019 International Joint Conference on Neural Networks (IJCNN), Budapest, Hungary, 14–19 July 2019; pp. 1–8. [Google Scholar]
  28. Shorten, C.; Khoshgoftaar, T.M.J.J.o.B.D. A survey on image data augmentation for deep learning. J. Big Data 2019, 6, 1–48. [Google Scholar] [CrossRef]
  29. Fidon, L.; Ourselin, S.; Vercauteren, T. Generalized Wasserstein Dice Score, Distributionally Robust Deep Learning, and Ranger for brain tumor segmentation: BraTS 2020 challenge. arXiv 2011, arXiv:2011.01614. [Google Scholar]
  30. Wang, Y.; Zhang, Y.; Hou, F.; Liu, Y.; Tian, J.; Zhong, C.; Zhang, Y.; He, Z. Modality-Pairing Learning for Brain Tumor Segmentation. arXiv 2020, arXiv:2010.09277. [Google Scholar]
  31. Jia, H.; Cai, W.; Huang, H.; Xia, Y. H2NF-Net for Brain Tumor Segmentation Using Multimodal MR Imaging: 2nd Place Solution to BraTS Challenge 2020 Segmentation Task; University of Pennsylvania: Philadelphia, PA, USA, 2020. [Google Scholar]
  32. Isensee, F.; Jaeger, P.F.; Full, P.M.; Vollmuth, P.; Maier-Hein, K.H. nnU-Net for Brain Tumor Segmentation; Springer Nature: Basingstoke, UK, 2020. [Google Scholar]
  33. Zhang, W.; Yang, G.; Huang, H.; Yang, W.; Xu, X.; Liu, Y.; Lai, X. ME-Net: Multi-encoder net framework for brain tumor segmentation. Int. J. Imaging Syst. Technol. 2021. [Google Scholar] [CrossRef]
  34. Silva, C.A.; Pinto, A.; Pereira, S.; Lopes, A. Multi-stage Deep Layer Aggregation for Brain Tumor Segmentation. arXiv 2021, arXiv:2101.00490. [Google Scholar]
  35. Ahmad, P.; Qamar, S.; Shen, L.; Saeed, A. Context Aware 3D UNet for Brain Tumor Segmentation. arXiv 2020, arXiv:2010.13082. [Google Scholar]
  36. Henry, T.; Carre, A.; Lerousseau, M.; Estienne, T.; Robert, C.; Paragios, N.; Deutsch, E. Brain tumor segmentation with self-ensembled, deeply-supervised 3D U-net neural networks: A BraTS 2020 challenge solution. arXiv 2020, arXiv:2011.01045. [Google Scholar]
  37. Russo, C.; Liu, S.; Di Ieva, A. Impact of Spherical Coordinates Transformation Pre-processing in Deep Convolution Neural Networks for Brain Tumor Segmentation and Survival Prediction. arXiv 2020, arXiv:2011.11052. [Google Scholar]
  38. Messaoudi, H.; Belaid, A.; Allaoui, M.L.; Zetout, A.; Allili, M.S.; Tliba, S.; Salem, D.B.; Conze, P.H. Efficient embedding network for 3D brain tumor segmentation. arXiv 2020, arXiv:2011.11052. [Google Scholar]
  39. Li, X.; Luo, G.; Wang, K. Multi-step cascaded networks for brain tumor segmentation. In Proceedings of the International MICCAI Brainlesion Workshop, Shenzhen, China, 13–17 October 2019; pp. 163–173. [Google Scholar]
  40. Wang, F.; Jiang, R.; Zheng, L.; Meng, C.; Biswal, B. 3d u-net based brain tumor segmentation and survival days prediction. In Proceedings of the International MICCAI Brainlesion Workshop, Shenzhen, China, 17 October 2019; pp. 131–141. [Google Scholar]
  41. Hamghalam, M.; Lei, B.; Wang, T. Brain tumor synthetic segmentation in 3D multimodal MRI scans. In Proceedings of the International MICCAI Brainlesion Workshop, Shenzhen, China, 17 October 2019; pp. 153–162. [Google Scholar]
  42. Amian, M.; Soltaninejad, M. Multi-resolution 3D CNN for MRI brain tumor segmentation and survival prediction. In Proceedings of the International MICCAI Brainlesion Workshop, Shenzhen, China, 17 October 2019; pp. 221–230. [Google Scholar]
  43. Myronenko, A.; Hatamizadeh, A. Robust semantic segmentation of brain tumor regions from 3D MRIs. In Proceedings of the International MICCAI Brainlesion Workshop, Shenzhen, China, 17 October 2019; pp. 82–89. [Google Scholar]
  44. Weninger, L.; Rippel, O.; Koppers, S.; Merhof, D. Segmentation of brain tumors and patient survival prediction: Methods for the brats 2018 challenge. In Proceedings of the International MICCAI Brainlesion Workshop, Granada, Spain, 16 September 2018; pp. 3–12. [Google Scholar]
  45. Kermi, A.; Mahmoudi, I.; Khadir, M.T. Deep convolutional neural networks using U-Net for automatic brain tumor segmentation in multimodal MRI volumes. In Proceedings of the International MICCAI Brainlesion Workshop, Granada, Spain, 16 September 2018; pp. 37–48. [Google Scholar]
  46. Lachinov, D.; Vasiliev, E.; Turlapov, V. Glioma segmentation with cascaded UNet. In Proceedings of the International MICCAI Brainlesion Workshop, Granada, Spain, 16 September 2018; pp. 189–198. [Google Scholar]
  47. Wang, G.; Li, W.; Ourselin, S.; Vercauteren, T. Automatic Brain Tumor Segmentation Based on Cascaded Convolutional Neural Networks with Uncertainty Estimation. Comput. Neurosci. 2019, 13, 56. [Google Scholar] [CrossRef] [PubMed] [Green Version]
  48. Myronenko, A. 3D MRI brain tumor segmentation using autoencoder regularization. In Proceedings of the International MICCAI Brainlesion Workshop, Granada, Spain, 16 September 2018; pp. 311–320. [Google Scholar]
  49. Winoto, A.S.; Kristianus, M.; Premachandra, C.J.I.A. Small and slim deep convolutional neural network for mobile device. IEEE Access 2020, 8, 125210–125222. [Google Scholar] [CrossRef]
Figure 1. MobileNetV2 architecture for segmentation of brain tumor implemented in this research.
Electronics 10 01962 g001
Figure 2. The MU-Net architecture was implemented in this research for brain tumor segmentation.
Electronics 10 01962 g002
Figure 3. The proposed RMU-Net architecture is implemented in this research.
Electronics 10 01962 g003
Figure 4. MRI images and their ground truth for various modalities. Green, red, and yellow highlight the ED, NET, and ET areas, respectively.
Electronics 10 01962 g004
Figure 5. MRI images and their ground truth for various modalities. Green, red, and yellow highlight the ED, NET, and ET areas, respectively.
Electronics 10 01962 g005
Figure 6. MRI images and their ground truth for various modalities. Green, red, and blue highlight the ED, NET, and ET areas, respectively.
Electronics 10 01962 g006
Figure 7. Inference time of different models for Android application.
Electronics 10 01962 g007
Table 1. Dice coefficient score and Jaccard score for the MobileNetV2 model on Enhanced Tumor (ET), Whole Tumor (WT), and Tumor Core (TC) classes of the BraTS 2020, 2019, and 2018 datasets.
ConfigurationDatasetDice Coefficient ScoreJaccard Score
ETWTTCETWTTC
MobileNetV2BraTS 20200.61390.69810.66250.59170.63080.6495
BraTS 20190.65980.75490.60370.62490.68490.6229
BraTS 20180.63950.72650.64190.63980.69490.6071
Table 2. Sensitivity and specificity for MobileNetV2 on Enhanced Tumor (ET), WholeTumor (WT), and Tumor Core (TC) classes of the BraTS 2020, 2019, and 2018 datasets.
ConfigurationDatasetSensitivitySpecificity
ETWTTCETWTTC
MobileNetV2BraTS 20200.72260.79340.74450.73560.76050.7965
BraTS 20190.78540.86160.69970.79180.82760.7693
BraTS 20180.76130.82340.73580.81450.83190.7126
Table 3. Dice coefficient score and Jaccard score for MU-Net on Enhanced Tumor (ET), Whole Tumor (WT), and Tumor Core (TC) classes of the BraTS 2020, 2019, and 2018 datasets.
ConfigurationDatasetDice Coefficient ScoreJaccard Score
ETWTTCETWTTC
MU-NetBraTS 20200.65170.84210.72850.79420.88750.7537
BraTS 20190.69210.82640.73290.74690.91270.7429
BraTS 20180.70290.89670.76920.77380.90490.7795
Table 4. Sensitivity and specificity for MU-Net on Enhanced Tumor (ET), Whole Tumor (WT), and Tumor Core (TC) classes of the BraTS 2020, 2019, and 2018 datasets.
ConfigurationDatasetSensitivitySpecificity
ETWTTCETWTTC
MU-NetBraTS 20200.82170.87210.73850.81420.84750.8317
BraTS 20190.88690.82360.76580.89520.85270.8179
BraTS 20180.87290.79280.78920.90960.87850.7906
Table 5. Dice coefficient score and Jaccard score for MU-Net with and without data augmentation on Enhanced Tumor (ET), Whole Tumor (WT), and Tumor Core (TC) classes of the BraTS 2020, 2019, and 2018 datasets. Best scores in bold.
ConfigurationDatasetDice CoefficientJaccard Score
ETWTTCETWTTC
MU-Net (without augmentation)BraTS 20200.65170.84210.72850.79420.88750.7537
MU-Net (with augmentation)0.70150.92750.78370.85290.91390.8275
Average Improvement6.35%5.29%
MU-Net (without augmentation)BraTS 20190.69210.82640.73290.74690.91270.7429
MU-Net (with augmentation)0.76290.86920.79640.78290.92690.7926
Average Improvement5.91%3.33%
MU-Net (without augmentation)BraTS 20180.70290.89670.76920.77380.90490.7795
MU-Net (with augmentation)0.75250.92320.78960.78910.90810.7935
Average Improvement3.21%1.08%
Table 6. Sensitivity and specificity for MU-Net with and without data augmentation on Enhanced Tumor (ET), Whole Tumor (WT), and Tumor Core (TC) classes of the BraTS 2020, 2019, and 2018 datasets. Best scores in bold.
ConfigurationDatasetSensitivitySpecificity
ETWTTCETWTTC
MU-Net (without augmentation)BraTS 20200.82170.87210.73850.81420.84750.8317
MU-Net (with augmentation)0.90150.92750.78370.83290.87210.8875
Average Improvement4.68%3.30%
MU-Net (without augmentation)BraTS 20190.88690.82360.76580.89520.85270.8179
MU-Net (with augmentation)0.92660.89520.80920.92650.95260.8959
Average Improvement5.16%6.98%
MU-Net (without augmentation)BraTS 20180.87290.79280.78920.90960.87850.7906
MU-Net (with augmentation)0.95260.85640.85620.95850.98260.8295
Average Improvement7.01%6.40%
Table 7. Dice coefficient and Jaccard score for the second model of RMU-Net with and without data augmentation on Enhanced Tumor (ET), Whole Tumor (WT), and Tumor Core (TC) classes of the BraTS 2020, 2019, and 2018 datasets. Best scores in bold.
ConfigurationDatasetDice CoefficientJaccard Score
ETWTTCETWTTC
RMU-Net (without augmentation)BraTS 20200.83950.81730.79310.81240.87150.8074
RMU-Net (with augmentation)0.86260.91350.88130.86790.92430.8817
Average Improvement6.92%6.09%
RMU-Net (without augmentation)BraTS 20190.88950.79460.90360.89450.73480.8587
RMU-Net (with augmentation)0.91760.83190.91230.90580.79260.8927
Average Improvement2.47%3.44%
RMU-Net (without augmentation)BraTS 20180.87680.77590.86260.86650.89730.8596
RMU-Net (with augmentation)0.90800.79360.86750.89560.90490.8869
Average Improvement1.79%2.14%
Table 8. Sensitivity and specificity for the second model of RMU-Net with and without data augmentation on Enhanced Tumor (ET), Whole Tumor (WT), and Tumor Core (TC) classes of the BraTS 2020, 2019, and 2018 datasets. Best scores in bold.
ConfigurationDatasetSensitivitySpecificity
ETWTTCETWTTC
RMU-Net (without augmentation)BraTS 20200.84150.89540.88570.81890.84290.9274
RMU-Net (with augmentation)0.99180.98250.92450.92860.89210.9371
Average Improvement9.20%5.62%
RMU-Net (without augmentation)BraTS 20190.89150.92390.90730.88780.86820.9513
RMU-Net (with augmentation)0.98960.99310.95190.97510.92670.9683
Average Improvement7.07%5.43%
RMU-Net (without augmentation)BraTS 20180.83800.86250.87580.85410.90100.8269
RMU-Net (with augmentation)0.89400.92950.90360.94240.91290.8918
Average Improvement10%5.51%
Table 9. Dice coefficient and Jaccard score for RMU-Net with and without dropout regularization on Enhanced Tumor (ET), Whole Tumor (WT), and Tumor Core (TC) classes of the BraTS 2020, 2019, and 2018 datasets. Best scores in bold.
ConfigurationDatasetDice CoefficientJaccard Score
ETWTTCETWTTC
RMU-Net (without dropout)BraTS 20200.86260.91350.88130.86790.92430.8817
RMU-Net (with dropout)0.78150.81970.83650.86260.90120.8636
Average Improvement−7.33%−1.55%
RMU-Net (without dropout)BraTS 20190.91760.83190.91230.90580.79260.8927
RMU-Net (with dropout)0.78150.81970.83650.86260.90120.8636
Average Improvement−7.46%−1.21%
RMU-Net (without dropout)BraTS 20180.90800.79360.86750.89560.90490.8869
RMU-Net (with dropout)0.88190.73560.80190.85160.86280.8617
Average Improvement−4.98%−3.71%
Table 10. Sensitivity and specificity for RMU-Net with and without dropout regularization on Enhanced Tumor (ET), Whole Tumor (WT), and Tumor Core (TC) classes of the BraTS 2020, 2019, and 2018 datasets. Best scores in bold.
ConfigurationDatasetSensitivitySpecificity
ETWTTCETWTTC
RMU-Net (without dropout)BraTS 20200.99180.98250.92450.92860.89210.9371
RMU-Net (with dropout)0.90350.91030.91370.89290.87620.9085
Average Improvement−5.71%−2.67%
RMU-Net (without dropout)BraTS 20190.98960.99310.95190.97510.92670.9683
RMU-Net (with dropout)0.95510.93250.90360.96590.87240.9093
Average Improvement−4.78%−4.08%
RMU-Net (without dropout)BraTS 20180.89400.92950.90360.94240.91290.8918
RMU-Net (with dropout)0.85540.86610.85930.90620.88640.8803
Average Improvement−4.87%−2.47%
Table 11. Comparison of RMU-Net with state-of-the-art segmentation models regarding model size and the number of parameters.
ReferencesDataset UsedArchitecture InformationDice Coefficient Score
Whole Tumor (WT)%Enhanced Tumor(ET)%Tumor Core (TC)%
[29]BraTS 20203D U-Net architecture with additional layers88.981.484.1
[30]BraTS 2020Modality pairing architecture like 3D U-Net architecture89.181.684.2
[31]BraTS 2020Single and cascaded HNF-Net91.2978.7585.46
[32]BraTS 2020nnU-Net architecture with augmentation and modification88.9582.0385.06
[33]BraTS 2020Multi-encoder architecture with Categorical dice score70.2473.8688.26
[34]BraTS 2020Three deep layer aggregation neural network using previous outputs as input88.587982.97
[35]BraTS 2020Modified U-Net architecture with densely connected blocks89.1279.1284.74
[36]BraTS 2020Ensemble model with multiple U-Net networks918185
[37]BraTS 2020Lesion encoder framework with DCNN network86.8778.9880.66
[38]BraTS 2020Efficient network as an encoder with the three-dimensional network for segmentation80.6869.5975.20
[39]BraTS 2019Multi-step cascaded model with hierarchical topology88.6077.1081.30
[40]BraTS 20193D U-Net based deep learning model using brain-wise normalization and patching strategies85.2077.8079.80
[41]BraTS 2019CNN on high-contrast images with GAN (Generative Adversarial Network)91.6579.2690.76
[42]BraTS 20193D deep learning model for segmentation and random forest for survival prediction847174
[43]BraTS 2019Encoder–decoder-based 3D semantic segmentation-based architecture with loss function89.408083.40
[44]BraTS 2018Two 3D U-Nets were used. One for finding tumor location and second for detecting subtle tumor84.4062.1072.80
[45]BraTS 2018Modified U-Net architecture based on 2D deep neural network86.8078.3080.50
[46]BraTS 2018Modified 3D U-Net architecture90.8078.4084.40
[47]BraTS 2018Cascaded 2.5D CNN network90.5078.6083.8
[48]BraTS 2018Ensemble of ten deep learning models with auto-regularization88.3976.6481.54
Proposed ModelBraTS 2020MobileNetV2 with residual blocks as encoder and upsampling part of U-Net as decoder91.3583.2688.13
BraTS 201991.7683.1991.23
BraTS 201890.8079.3686.75
Publisher’s Note: MDPI stays neutral with regard to jurisdictional claims in published maps and institutional affiliations.

