
Innovative IoT Solutions and Wearable Sensing Systems for Monitoring Human Biophysical Parameters: A Review


Abstract
:1. Introduction
- A comprehensive overview of recent advances in sensing technologies to monitor the biophysical parameters suitable for integration into wearable and portable devices; specifically, we focused on advanced techniques for monitoring HR, BP, respiration rate (RR), blood glucose level and others, in a non-invasive or even contactless way. In addition, wearable applications involving Galvanic Skin Response (GSR) measurements are discussed, a standard indicator of the physical or psychological conditions, for predicting epileptic seizures [22], diagnosing bipolar dysfunction [23], and detecting sleepiness [24]. We investigated the application of sweat sensors for rapid and non-invasive detection of toxins, drugs, hormones, alcohol, and glucose level [25].
- An overview of the IoT systems for health monitoring applications, focusing on the different IoT architectures and supported services. Analyzed systems make heavy use of wearable devices for high-resolution detection of the patient parameters, along with edge/fog computing to limit their requirements in terms of computational resources, power consumption, and energy autonomy [26]. Furthermore, cloud computing allows integrated management, and processing and storing of acquired data can be carried out. In this context, Artificial Intelligence (AI) and Machine Learning (ML) techniques can be integrated into their supported services to simplify the handling of a massive data amount and to infer useful information from them [27]. Finally, IoT frameworks for gait and life-quality monitoring are discussed, focusing on IoT systems for remote fall detection, based on wearable devices and ML techniques [28].
2. Overview of Innovative Sensing Systems and Algorithms for Monitoring Biophysical Parameters
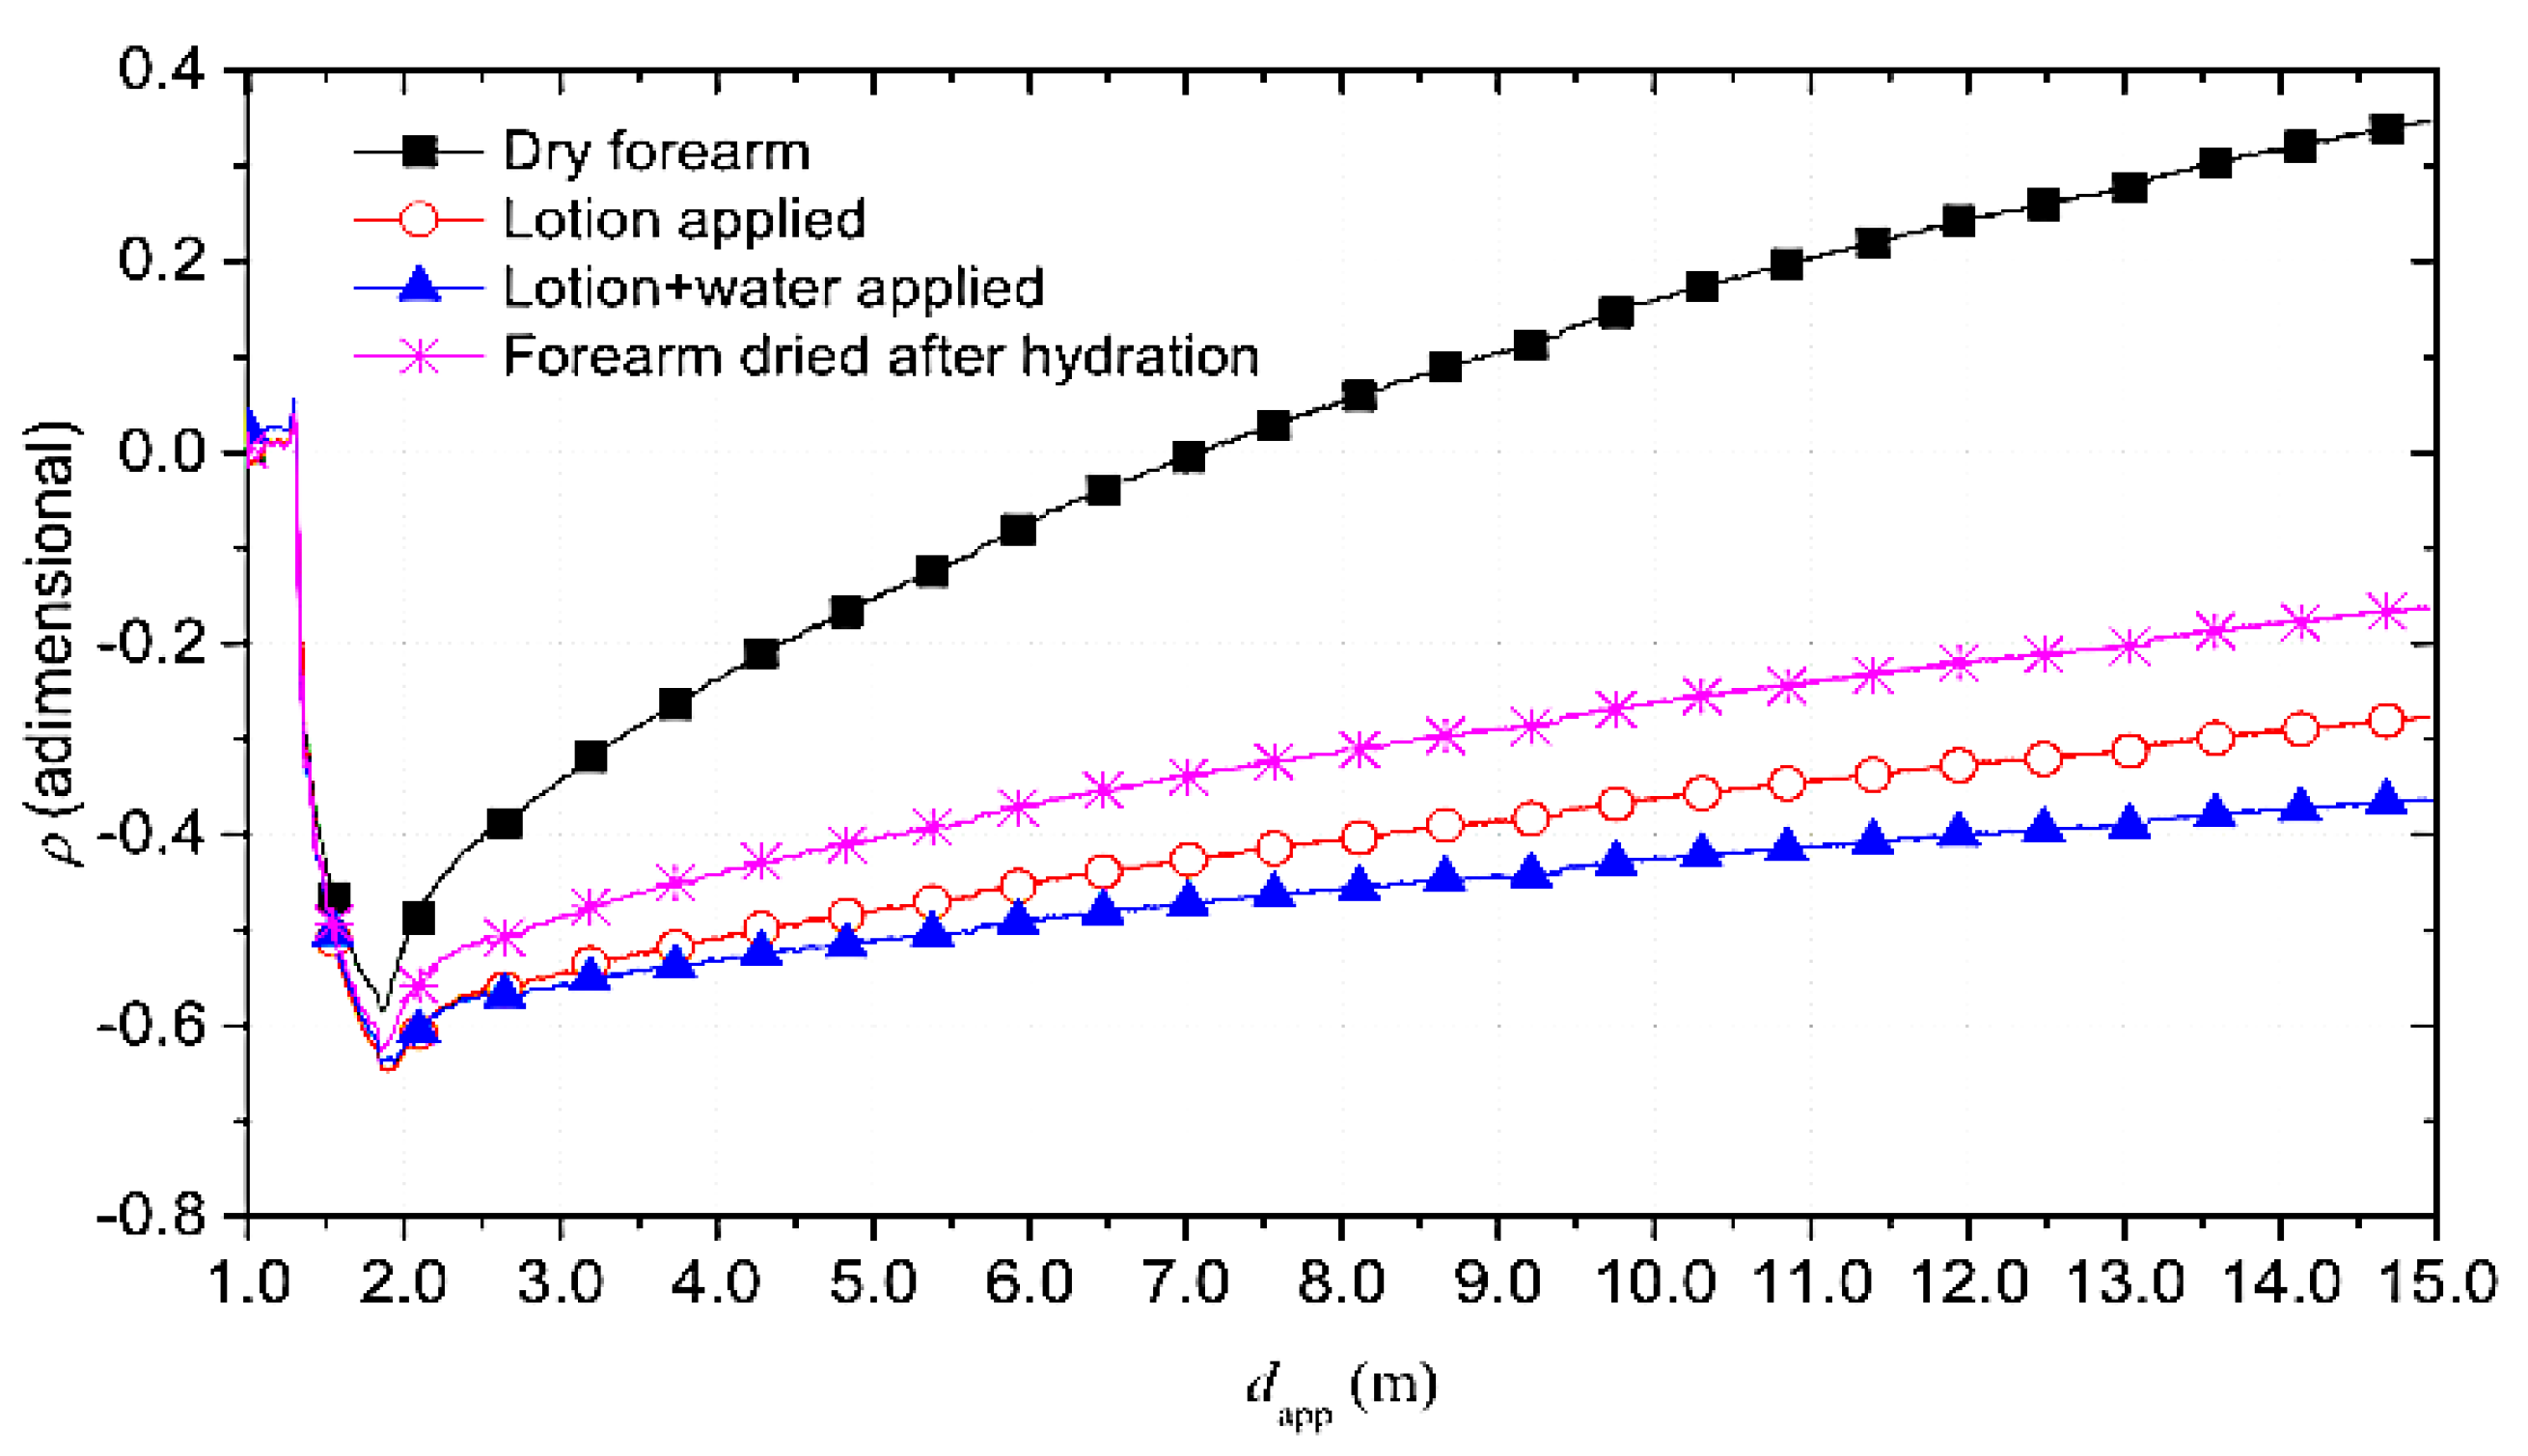
- Forearm in dry condition;
- Forearm with applied a skin lotion to increase the hydration level;
- Forearm wet with water;
- Forearm dried to remove lotion and water residues.
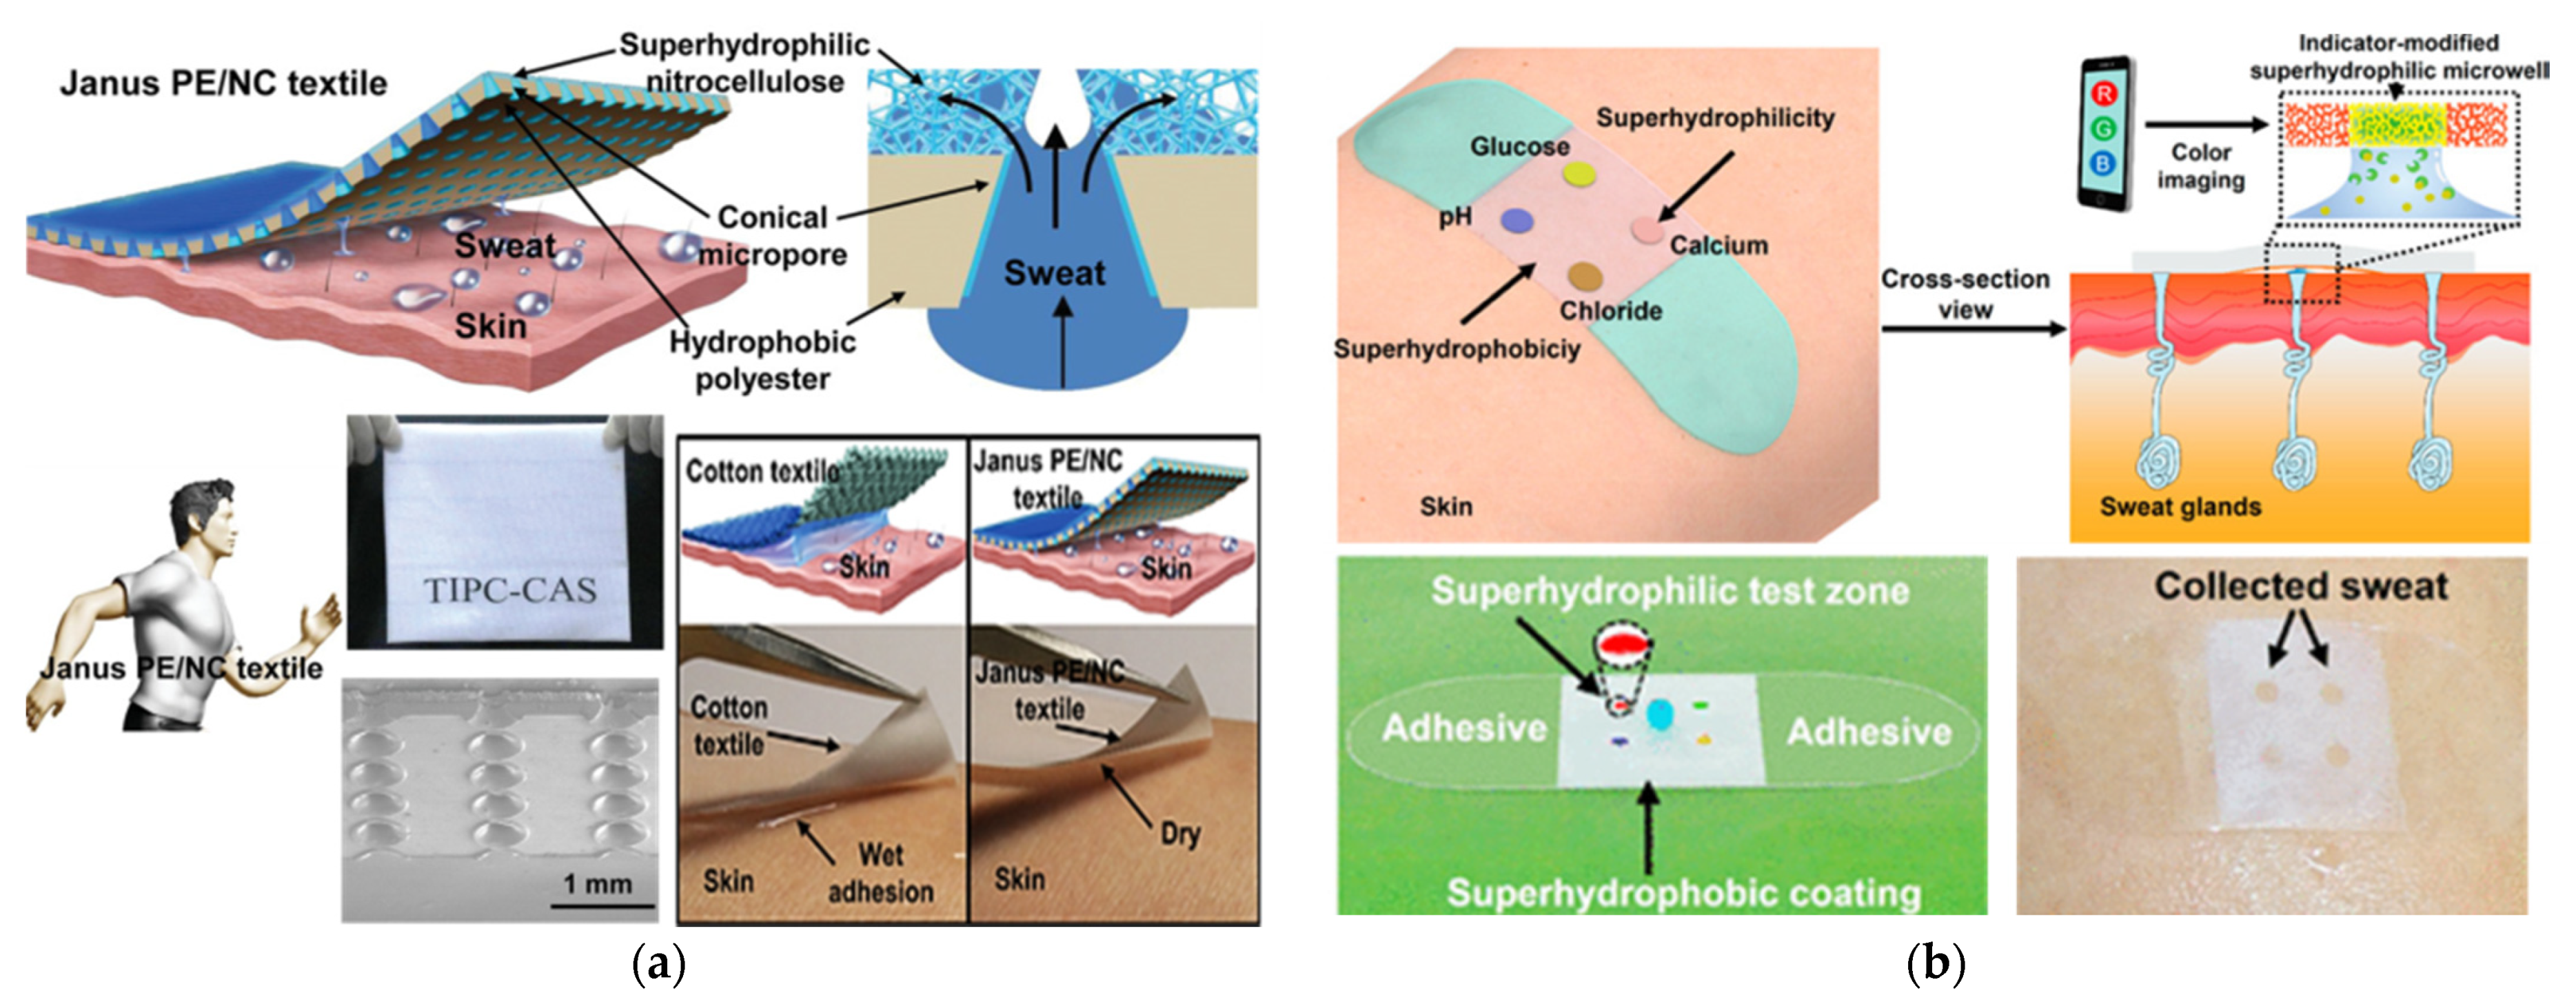
- Whole-body washdown technique: It is the main technique to determine electrolyte loss since the outflow sweat is collected, and evaporative sweating is undisturbed;
- Patches: Consisting of a hydrophilic and porous structure placed between the skin and an external membrane. It is applied to the forearm, thigh, back, and calf;
- Polymer bags/films: A polyethene sheet with a thin layer of petroleum jelly and paraffin oil on the skin is used as an anaerobic sweat collector to gather large sweat volumes with less contamination and evaporative water loss;
- Macroducts: Plastic capsule placed on the skin with spiral plastic tube collecting sweat, avoiding sweat loss, contamination, and potential hydromeiosis.
3. Overview on IoT Systems for Health Monitoring Applications: Architecture Point of View and Supported Services
- Ambient Assisted Living (AAL), an IoT platform that assists elderly and disabled people thanks to AI techniques for extending and improving their life;
- Internet of m-health things (m-IoT), that consists of mobile computing, medicals sensors, and communication technologies for healthcare services;
- IoT-based Adverse Drug Reaction (ADR), that allows a patient to find a specific solution, according to his allergy profile and electronic health record, for an injury caused by the medicine of assumption;
- Community Healthcare (CH), an IoT-based network that covers an area surrounding a local community to access remote medical advice and health data;
- Children Health Information (CHI) that helps children with behavioral or mental problems by educating and amusing them;
- Wearable Device Access (WDA) that allows remote monitoring of a patient by using non-intrusive sensors equipping mobile computing devices like smartphones;
- Semantic Medical Access (SMA) for sharing medical knowledge and information by using semantics and ontologies;
- Indirect Emergency Healthcare (IEH) that suggests the behavior in dangerous situations like road accidents or adverse weather conditions;
- Embedded Gateway Configuration (EGC), an architectural service that links the Internet and medical devices to the network nodes to which patients are connected;
- Embedded Context Prediction (ECP), a generic framework with a suitable mechanism to create context-aware healthcare applications.
- Glucose level sensing that helps planning meals, activities, and medication by revealing the blood glucose level of patients affected by diabetes;
- Electrocardiogram monitoring to eventually diagnose heart diseases such as arrhythmias and myocardial ischemia by detecting the heart electrical activity;
- Monitoring of blood pressure and body temperature, by using suitable sensors, crucial parameters for healthcare services;
- Oxygen saturation monitoring, useful for technology-driven medical healthcare applications, obtained by combining pulse oximetry with IoT;
- Rehabilitation system for improving the rehabilitation of people with physical impairment or disability;
- Medication management, that offers several solutions to the non-fulfilment problem in medication, representing a severe menace for public health;
- Wheelchair management, that offers an automatic wheelchair to disabled people;
- Imminent healthcare solutions, that allows numerous portable medical devices to be integrated with IoT networks;
- Healthcare solutions using smartphones, exploiting smartphone functionalities to control electronic devices extending its capabilities in the IoT platform.
4. Conclusions
Author Contributions
Funding
Informed Consent Statement
Data Availability Statement
Conflicts of Interest
References
- Chan, M.; Estève, D.; Fourniols, J.-Y.; Escriba, C.; Campo, E. Smart Wearable Systems: Current Status and Future Challenges. Artif. Intell. Med. 2012, 56, 137–156. [Google Scholar] [CrossRef]
- Frischer, R.; Krejcar, O.; Maresova, P.; Fadeyi, O.; Selamat, A.; Kuca, K.; Tomsone, S.; Teixeira, J.P.; Madureira, J.; Melero, F.J. Commercial ICT Smart Solutions for the Elderly: State of the Art and Future Challenges in the Smart Furniture Sector. Electronics 2020, 9, 149. [Google Scholar] [CrossRef] [Green Version]
- Lobaccaro, G.; Carlucci, S.; Löfström, E. A Review of Systems and Technologies for Smart Homes and Smart Grids. Energies 2016, 9, 348. [Google Scholar] [CrossRef] [Green Version]
- de Fazio, R.; Sponziello, A.; Cafagna, D.; Velazquez, R.; Visconti, P. An Overview on Technologies and Devices against Covid-19 Pandemic Diffusion: Virus Detection and Monitoring Solutions. Int. J. Smart Sens. Intell. Syst. 2021, 14, 1–28. [Google Scholar] [CrossRef]
- Latifi, R. Current Principles and Practices of Telemedicine and e-Health, 1st ed.; Ios Press, Inc.: Amsterdam, The Netherlands; Washington, DC, USA, 2008; ISBN 978-1-58603-806-9. [Google Scholar]
- Wen, H.J.; Tan, J. The Evolving Face of Telemedicine E-Health: Opening Doors and Closing Gaps in e-Health Services Opportunities Challenges. In Proceedings of the 36th Annual Hawaii International Conference on System Sciences, Big Island, HI, USA, 6–9 January 2003; pp. 1–12. [Google Scholar]
- Surantha, N.; Atmaja, P.; David; Wicaksono, M. A Review of Wearable Internet-of-Things Device for Healthcare. Procedia Comput. Sci. 2021, 179, 936–943. [Google Scholar] [CrossRef]
- Nasajpour, M.; Pouriyeh, S.; Parizi, R.M.; Dorodchi, M.; Valero, M.; Arabnia, H.R. Internet of Things for Current COVID-19 and Future Pandemics: An Exploratory Study. J. Healthc. Inf. Res. 2020, 4, 325–364. [Google Scholar] [CrossRef] [PubMed]
- Singh, R.P.; Javaid, M.; Haleem, A.; Suman, R. Internet of Things (IoT) Applications to Fight against COVID-19 Pandemic. Diabetes Metab. Syndr. 2020, 14, 521–524. [Google Scholar] [CrossRef] [PubMed]
- Dong, Y.; Yao, Y.-D. IoT Platform for COVID-19 Prevention and Control: A Survey. IEEE Access 2021, 9, 49929–49941. [Google Scholar] [CrossRef]
- Kadhim, K.T.; Alsahlany, A.M.; Wadi, S.M.; Kadhum, H.T. An Overview of Patient’s Health Status Monitoring System Based on Internet of Things (IoT). Wirel. Pers. Commun. 2020, 114, 2235–2262. [Google Scholar] [CrossRef]
- Ennafiri, M.; Mazri, T. Internet of Things for Smart Healthcare: A Review on a Potential IOT Based System and Technologies to Control COVID-19 Pandemic. Innov. Smart Cities Appl. 4 2020, 183, 1256–1269. [Google Scholar] [CrossRef]
- Zhang, L.; Yang, L.; Wang, Z.; Yan, D. Sports Wearable Device Design and Health Data Monitoring Based on Wireless Internet of Things. Microprocess. Microsyst. 2020, 103423, 1–7. [Google Scholar] [CrossRef]
- Putri, A.; Ali, M.; Abdulmajid, M.S.; Hidayat, S.S. Wearable Sensor and Internet of Things Technology for Better Medical Science: A Review. Int. J. Emerg. Technol. Learn. (IJET) 2019, 7, 1–4. [Google Scholar] [CrossRef]
- Burmaoglu, S.; Trajkovik, V.; Tutukalo, T.L.; Yalcin, H.; Caulfield, B. Chapter 14—Evolution Map of Wearable Technology Patents for Healthcare Field. In Wearable Technology in Medicine and Health Care; Tong, R.K.-Y., Ed.; Academic Press: Cambridge, MA, USA, 2018; pp. 275–290. ISBN 978-0-12-811810-8. [Google Scholar]
- Honarvar, M.G.; Latifi, M. Overview of Wearable Electronics and Smart Textiles. J. Text. Inst. 2017, 108, 631–652. [Google Scholar] [CrossRef]
- Stavropoulos, T.G.; Papastergiou, A.; Mpaltadoros, L.; Nikolopoulos, S.; Kompatsiaris, I. IoT Wearable Sensors and Devices in Elderly Care: A Literature Review. Sensors 2020, 20, 2826. [Google Scholar] [CrossRef]
- de Fazio, R.; Cafagna, D.; Marcuccio, G.; Minerba, A.; Visconti, P. A Multi-Source Harvesting System Applied to Sensor-Based Smart Garments for Monitoring Workers’ Bio-Physical Parameters in Harsh Environments. Energies 2020, 13, 2161. [Google Scholar] [CrossRef]
- Jayathilaka, W.A.D.M.; Qi, K.; Qin, Y.; Chinnappan, A.; Serrano-García, W.; Baskar, C.; Wang, H.; He, J.; Cui, S.; Thomas, S.W.; et al. Significance of Nanomaterials in Wearables: A Review on Wearable Actuators and Sensors. Adv. Mater. 2019, 31, 1–21. [Google Scholar] [CrossRef]
- Wang, C.; Xia, K.; Wang, H.; Liang, X.; Yin, Z.; Zhang, Y. Advanced Carbon for Flexible and Wearable Electronics. Adv. Mater. 2019, 31, 1–37. [Google Scholar] [CrossRef] [PubMed]
- Lim, H.-R.; Kim, H.S.; Qazi, R.; Kwon, Y.-T.; Jeong, J.-W.; Yeo, W.-H. Advanced Soft Materials, Sensor Integrations, and Applications of Wearable Flexible Hybrid Electronics in Healthcare, Energy, and Environment. Adv. Mater. 2020, 32, 1–43. [Google Scholar] [CrossRef]
- Nagai, Y.; Jones, C.I.; Sen, A. Galvanic Skin Response (GSR)/Electrodermal/Skin Conductance Biofeedback on Epilepsy: A Systematic Review and Meta-Analysis. Front. Neurol. 2019, 10, 1–8. [Google Scholar] [CrossRef]
- Anwar, Y.; Khan, A.A. Assistive Technologies for Bipolar Disorder: A Survey. Int. J. Adv. Comput. Sci. Appl. 2019, 10, 490–499. [Google Scholar] [CrossRef]
- Malathi, D.; Jayaseeli, J.D.; Madhuri, S.; Senthilkumar, K. Electrodermal Activity Based Wearable Device for Drowsy Drivers. J. Phys. Conf. Ser. 2018, 1000, 1–11. [Google Scholar] [CrossRef]
- Chung, M.; Fortunato, G.; Radacsi, N. Wearable Flexible Sweat Sensors for Healthcare Monitoring: A Review. J. R. Soc. Interface 2019, 16, 1–15. [Google Scholar] [CrossRef]
- Paul, A.; Pinjari, H.; Hong, W.-H.; Seo, H.C.; Rho, S. Fog Computing-Based IoT for Health Monitoring System. J. Sens. 2018, 2018, 1–8. [Google Scholar] [CrossRef]
- Aldahiri, A.; Alrashed, B.; Hussain, W. Trends in Using IoT with Machine Learning in Health Prediction System. Forecasting 2021, 3, 181–206. [Google Scholar] [CrossRef]
- Vallabh, P.; Malekian, R.; Ye, N.; Bogatinoska, D.C. Fall Detection Using Machine Learning Algorithms. In Proceedings of the 2016 24th International Conference on Software, Telecommunications and Computer Networks (SoftCOM), Split, Croatia, 22–24 September 2016; pp. 1–9. [Google Scholar]
- Hong, L.; Deye, Y.; Andrew, B.; Naresh, V.; Jing, W.; Jia, W.S.; Pu, Z.P.; Genyue, F.; Kang, L.; Feng, Z.-P. Smartphone-Based Blood Pressure Measurement Using Transdermal Optical Imaging Technology. Circ. Cardiovasc. Imaging 2019, 12, 1–30. [Google Scholar] [CrossRef] [Green Version]
- Chandrasekhar, A.; Kim, C.-S.; Naji, M.; Natarajan, K.; Hahn, J.-O.; Mukkamala, R. Smartphone-Based Blood Pressure Monitoring via the Oscillometric Finger-Pressing Method. Sci. Transl. Med. 2018, 10, 1–10. [Google Scholar] [CrossRef] [PubMed] [Green Version]
- Chen, S.; Wu, N.; Lin, S.; Duan, J.; Xu, Z.; Pan, Y.; Zhang, H.; Xu, Z.; Huang, L.; Hu, B.; et al. Hierarchical Elastomer Tuned Self-Powered Pressure Sensor for Wearable Multifunctional Cardiovascular Electronics. Nano Energy 2020, 70, 1–9. [Google Scholar] [CrossRef]
- Zambrana-Vinaroz, D.; Vicente-Samper, J.M.; Juan, C.G.; Esteve-Sala, V.; Sabater-Navarro, J.M. Non-Invasive Device for Blood Pressure Wave Acquisition by Means of Mechanical Transducer. Sensors 2019, 19, 4311. [Google Scholar] [CrossRef] [PubMed] [Green Version]
- Haxha, S.; Jhoja, J. Optical Based Noninvasive Glucose Monitoring Sensor Prototype. IEEE Photonics J. 2016, 8, 1–11. [Google Scholar] [CrossRef] [Green Version]
- Sim, J.Y.; Ahn, C.-G.; Jeong, E.-J.; Kim, B.K. In Vivo Microscopic Photoacoustic Spectroscopy for Non-Invasive Glucose Monitoring Invulnerable to Skin Secretion Products; Scientific Reports. Nature 2018, 8, 1–11. [Google Scholar] [CrossRef] [Green Version]
- Rachim, V.P.; Chung, W.-Y. Wearable-Band Type Visible-near Infrared Optical Biosensor for Non-Invasive Blood Glucose Monitoring. Sens. Actuators B Chem. 2019, 286, 173–180. [Google Scholar] [CrossRef]
- Villarejo, M.V.; Zapirain, B.G.; Zorrilla, A.M. A Stress Sensor Based on Galvanic Skin Response (GSR) Controlled by ZigBee. Sensors 2012, 12, 6075–6101. [Google Scholar] [CrossRef] [Green Version]
- Raj, J.V.; Sarath, T.V. An IoT Based Real-Time Stress Detection System for Fire-Fighters. In Proceedings of the 2019 International Conference on Intelligent Computing and Control Systems (ICCS), Madurai, India, 15–17 May 2019; pp. 354–360. [Google Scholar]
- Bayo-Monton, J.-L.; Martinez-Millana, A.; Han, W.; Fernandez-Llatas, C.; Sun, Y.; Traver, V. Wearable Sensors Integrated with Internet of Things for Advancing EHealth Care. Sensors 2018, 18, 1851. [Google Scholar] [CrossRef] [Green Version]
- Freivalds, A.; Lyu, S. Body Balance Estimation in Standing and Walking Conditions Using Inertial Measurement Units and Galvanic Skin Response. In Proceedings of the 20th Congress of the International Ergonomics Association (IEA 2018); Bagnara, S., Tartaglia, R., Albolino, S., Alexander, T., Fujita, Y., Eds.; Springer International Publishing: Cham, Switzerland, 2019; pp. 9–12. [Google Scholar]
- Du, Y. Fall Detection with Galvanic Skin Response Sensor. Thesis, Nanyang Technology University, Singapore, 2019. Available online: https://dr.ntu.edu.sg/handle/10356/78931 (accessed on 21 June 2021).
- Kikhia, B.; Stavropoulos, T.G.; Andreadis, S.; Karvonen, N.; Kompatsiaris, I.; Sävenstedt, S.; Pijl, M.; Melander, C. Utilizing a Wristband Sensor to Measure the Stress Level for People with Dementia. Sensors 2016, 16, 1989. [Google Scholar] [CrossRef] [PubMed] [Green Version]
- Acerbi, G.; Rovini, E.; Betti, S.; Tirri, A.; Rónai, J.F.; Sirianni, A.; Agrimi, J.; Eusebi, L.; Cavallo, F. A Wearable System for Stress Detection Through Physiological Data Analysis. In Proceedings of the Ambient Assisted Living; Casiddu, N., Porfirione, C., Monteriù, A., Cavallo, F., Eds.; Springer International Publishing: Cham, Switzerland, 2017; pp. 31–50. [Google Scholar]
- Navea, R.F.; Buenvenida, P.J.; Cruz, C.D. Stress Detection Using Galvanic Skin Response: An Android Application. J. Phys. Conf. Ser. 2019, 1372, 1–7. [Google Scholar] [CrossRef]
- Hernando Gallego, F.; Luengo, D.; Artés Rodríguez, A. Feature Extraction of Galvanic Skin Responses by Non-Negative Sparse Deconvolution. IEEE J. Biomed. Health Inform. 2017, 22, 1385–1394. [Google Scholar] [CrossRef] [PubMed]
- Lestari, G.R.; Abuzairi, T. Design of Portable Galvanic Skin Response Sensor for Pain Sensor. In Proceedings of the 2020 International Conference on Smart Technology and Applications (ICoSTA), Surabaya, Indonesia, 20 February 2020; pp. 1–5. [Google Scholar]
- Kyriakou, K.; Resch, B.; Sagl, G.; Petutschnig, A.; Werner, C.; Niederseer, D.; Liedlgruber, M.; Wilhelm, F.H.; Osborne, T.; Pykett, J. Detecting Moments of Stress from Measurements of Wearable Physiological Sensors. Sensors 2019, 19, 3805. [Google Scholar] [CrossRef] [Green Version]
- Mahmud, M.S.; Wang, H.; Fang, H. SensoRing: An Integrated Wearable System for Continuous Measurement of Physiological Biomarkers. In Proceedings of the 2018 IEEE International Conference on Communications (ICC), Kansas City, MO, USA, 20–24 May 2018; pp. 1–7. [Google Scholar]
- Schiavoni, R.; Monti, G.; Piuzzi, E.; Tarricone, L.; Tedesco, A.; De Benedetto, E.; Cataldo, A. Feasibility of a Wearable Reflectometric System for Sensing Skin Hydration. Sensors 2020, 20, 2833. [Google Scholar] [CrossRef]
- Lee, Y.K.; Jang, K.-I.; Ma, Y.; Koh, A.; Chen, H.; Jung, H.N.; Kim, Y.; Kwak, J.W.; Wang, L.; Xue, Y.; et al. Chemical Sensing Systems That Utilize Soft Electronics on Thin Elastomeric Substrates with Open Cellular Designs. Adv. Funct. Mater. 2017, 27, 1–8. [Google Scholar] [CrossRef] [Green Version]
- Kim, J.; Sempionatto, J.R.; Imani, S.; Hartel, M.C.; Barfidokht, A.; Tang, G.; Campbell, A.S.; Mercier, P.P.; Wang, J. Simultaneous Monitoring of Sweat and Interstitial Fluid Using a Single Wearable Biosensor Platform. Adv. Sci. 2018, 5, 1–11. [Google Scholar] [CrossRef] [PubMed] [Green Version]
- Huang, X.; Huang, X.; Liu, Y.; Chen, K.; Shin, W.-J.; Lu, C.-J.; Kong, G.-W.; Patnaik, D.; Lee, S.-H.; Cortes, J.F.; et al. Stretchable, Wireless Sensors and Functional Substrates for Epidermal Characterization of Sweat. Nano Micro Small 2014, 10, 3083–3090. [Google Scholar] [CrossRef] [PubMed]
- Gao, W.; Emaminejad, S.; Nyein, H.Y.Y.; Challa, S.; Chen, K.; Peck, A.; Fahad, H.M.; Ota, H.; Shiraki, H.; Kiriya, D.; et al. Fully Integrated Wearable Sensor Arrays for Multiplexed in Situ Perspiration Analysis. Nature 2016, 529, 509–514. [Google Scholar] [CrossRef] [PubMed] [Green Version]
- Lee, H.; Song, C.; Hong, Y.S.; Kim, M.S.; Cho, H.R.; Kang, T.; Shin, K.; Choi, S.H.; Hyeon, T.; Kim, D.-H. Wearable/Disposable Sweat-Based Glucose Monitoring Device with Multistage Transdermal Drug Delivery Module. Sci. Adv. 2017, 3, 1–9. [Google Scholar] [CrossRef] [Green Version]
- Dai, B.; Li, K.; Shi, L.; Wan, X.; Liu, X.; Zhang, F.; Jiang, L.; Wang, S. Bioinspired Janus Textile with Conical Micropores for Human Body Moisture and Thermal Management. Adv. Mater. 2019, 13, 1–7. [Google Scholar] [CrossRef]
- He, X.; Xu, T.; Gu, Z.; Gao, W.; Xu, L.-P.; Pan, T.; Zhang, X. Flexible and Superwettable Bands as a Platform toward Sweat Sampling and Sensing. Anal. Chem. 2019, 91, 4296–4300. [Google Scholar] [CrossRef] [Green Version]
- Liu, G.; Ho, C.; Slappey, N.; Zhou, Z.; Snelgrove, S.E.; Brown, M.; Grabinski, A.; Guo, X.; Chen, Y.; Miller, K.; et al. A Wearable Conductivity Sensor for Wireless Real-Time Sweat Monitoring. Sens. Actuators B Chem. 2016, 227, 35–42. [Google Scholar] [CrossRef]
- Wang, S.; Wu, Y.; Gu, Y.; Li, T.; Luo, H.; Li, L.-H.; Bai, Y.; Li, L.; Liu, L.; Cao, Y.; et al. Wearable Sweatband Sensor Platform Based on Gold Nanodendrite Array as Efficient Solid Contact of Ion-Selective Electrode. Anal. Chem. 2017, 89, 10224–10231. [Google Scholar] [CrossRef]
- Nyein, H.Y.Y.; Tai, L.-C.; Ngo, Q.P.; Chao, M.; Zhang, G.B.; Gao, W.; Bariya, M.; Bullock, J.; Kim, H.; Fahad, H.M.; et al. A Wearable Microfluidic Sensing Patch for Dynamic Sweat Secretion Analysis. ACS Sens. 2018, 3, 944–952. [Google Scholar] [CrossRef]
- Koh, A.; Kang, D.; Xue, Y.; Lee, S.; Pielak, R.M.; Kim, J.; Hwang, T.; Min, S.; Banks, A.; Bastien, P.; et al. A Soft, Wearable Microfluidic Device for the Capture, Storage, and Colorimetric Sensing of Sweat. Sci. Transl. Med. 2016, 8, 1–24. [Google Scholar] [CrossRef] [Green Version]
- Reeder, J.T.; Choi, J.; Xue, Y.; Gutruf, P.; Hanson, J.; Liu, M.; Ray, T.; Bandodkar, A.J.; Avila, R.; Xia, W.; et al. Waterproof, Electronics-Enabled, Epidermal Microfluidic Devices for Sweat Collection, Biomarker Analysis, and Thermography in Aquatic Settings. Sci. Adv. 2019, 5, 1–14. [Google Scholar] [CrossRef] [Green Version]
- Yang, Y.; Song, Y.; Bo, X.; Min, J.; Pak, O.S.; Zhu, L.; Wang, M.; Tu, J.; Kogan, A.; Zhang, H.; et al. A Laser-Engraved Wearable Sensor for Sensitive Detection of Uric Acid and Tyrosine in Sweat. Nat. Biotechnol. 2020, 38, 217–224. [Google Scholar] [CrossRef] [Green Version]
- Gamella, M.; Campuzano, S.; Manso, J.; de Rivera, G.G.; López-Colino, F.; Reviejo, A.J.; Pingarrón, J.M. A Novel Non-Invasive Electrochemical Biosensing Device for in Situ Determination of the Alcohol Content in Blood by Monitoring Ethanol in Sweat. Anal. Chim. Acta 2014, 806, 1–7. [Google Scholar] [CrossRef]
- Hubble, L.J.; Wang, J. Sensing at Your Fingertips: Glove-Based Wearable Chemical Sensors. Electroanalysis 2018, 31, 428–436. [Google Scholar] [CrossRef]
- Bandodkar, A.J.; O’Mahony, A.M.; Ramírez, J.; Samek, I.A.; Anderson, S.M.; Windmiller, J.R.; Wang, J. Solid-State Forensic Finger Sensor for Integrated Sampling and Detection of Gunshot Residue and Explosives: Towards “Lab-on-a-Finger”. Analyst 2013, 138, 5288–5295. [Google Scholar] [CrossRef] [Green Version]
- Mats, d.J.; Sleegers, N.; Kim, J.; Durme, F.V.; Samyn, N.; Wang, J.; Wael, K.D. Electrochemical Fingerprint of Street Samples for Fast On-Site Screening of Cocaine in Seized Drug Powders. Chem. Sci. 2016, 7, 2364–2370. [Google Scholar] [CrossRef] [Green Version]
- Cui, B.; Tertiş, M.; Cernat, A.; Sandulescu, R.; Wang, J.; Cristea, C. Finger-Based Printed Sensors Integrated on a Glove for On-Site Screening Of Pseudomonas Aeruginosa Virulence Factors. Anal. Chem. 2018, 90, 7761–7768. [Google Scholar] [CrossRef]
- Ciui, B.; Martin, A.; Mishra, R.K.; Nakagawa, T.; Dawkins, T.; Lyu, M.; Cristea, C.; Sandulescu, R.; Wang, J. Chemical Sensing at the Robot Fingertips: Toward Automated Taste Discrimination in Food Samples. ACS Sens. 2018, 3, 2375–2384. [Google Scholar] [CrossRef] [PubMed]
- Islam, S.M.R.; Kwak, D.; Kabir, M.D.H.; Hossain, M.; Kwak, K.-S. The Internet of Things for Health Care: A Comprehensive Survey. IEEE Access 2015, 3, 678–708. [Google Scholar] [CrossRef]
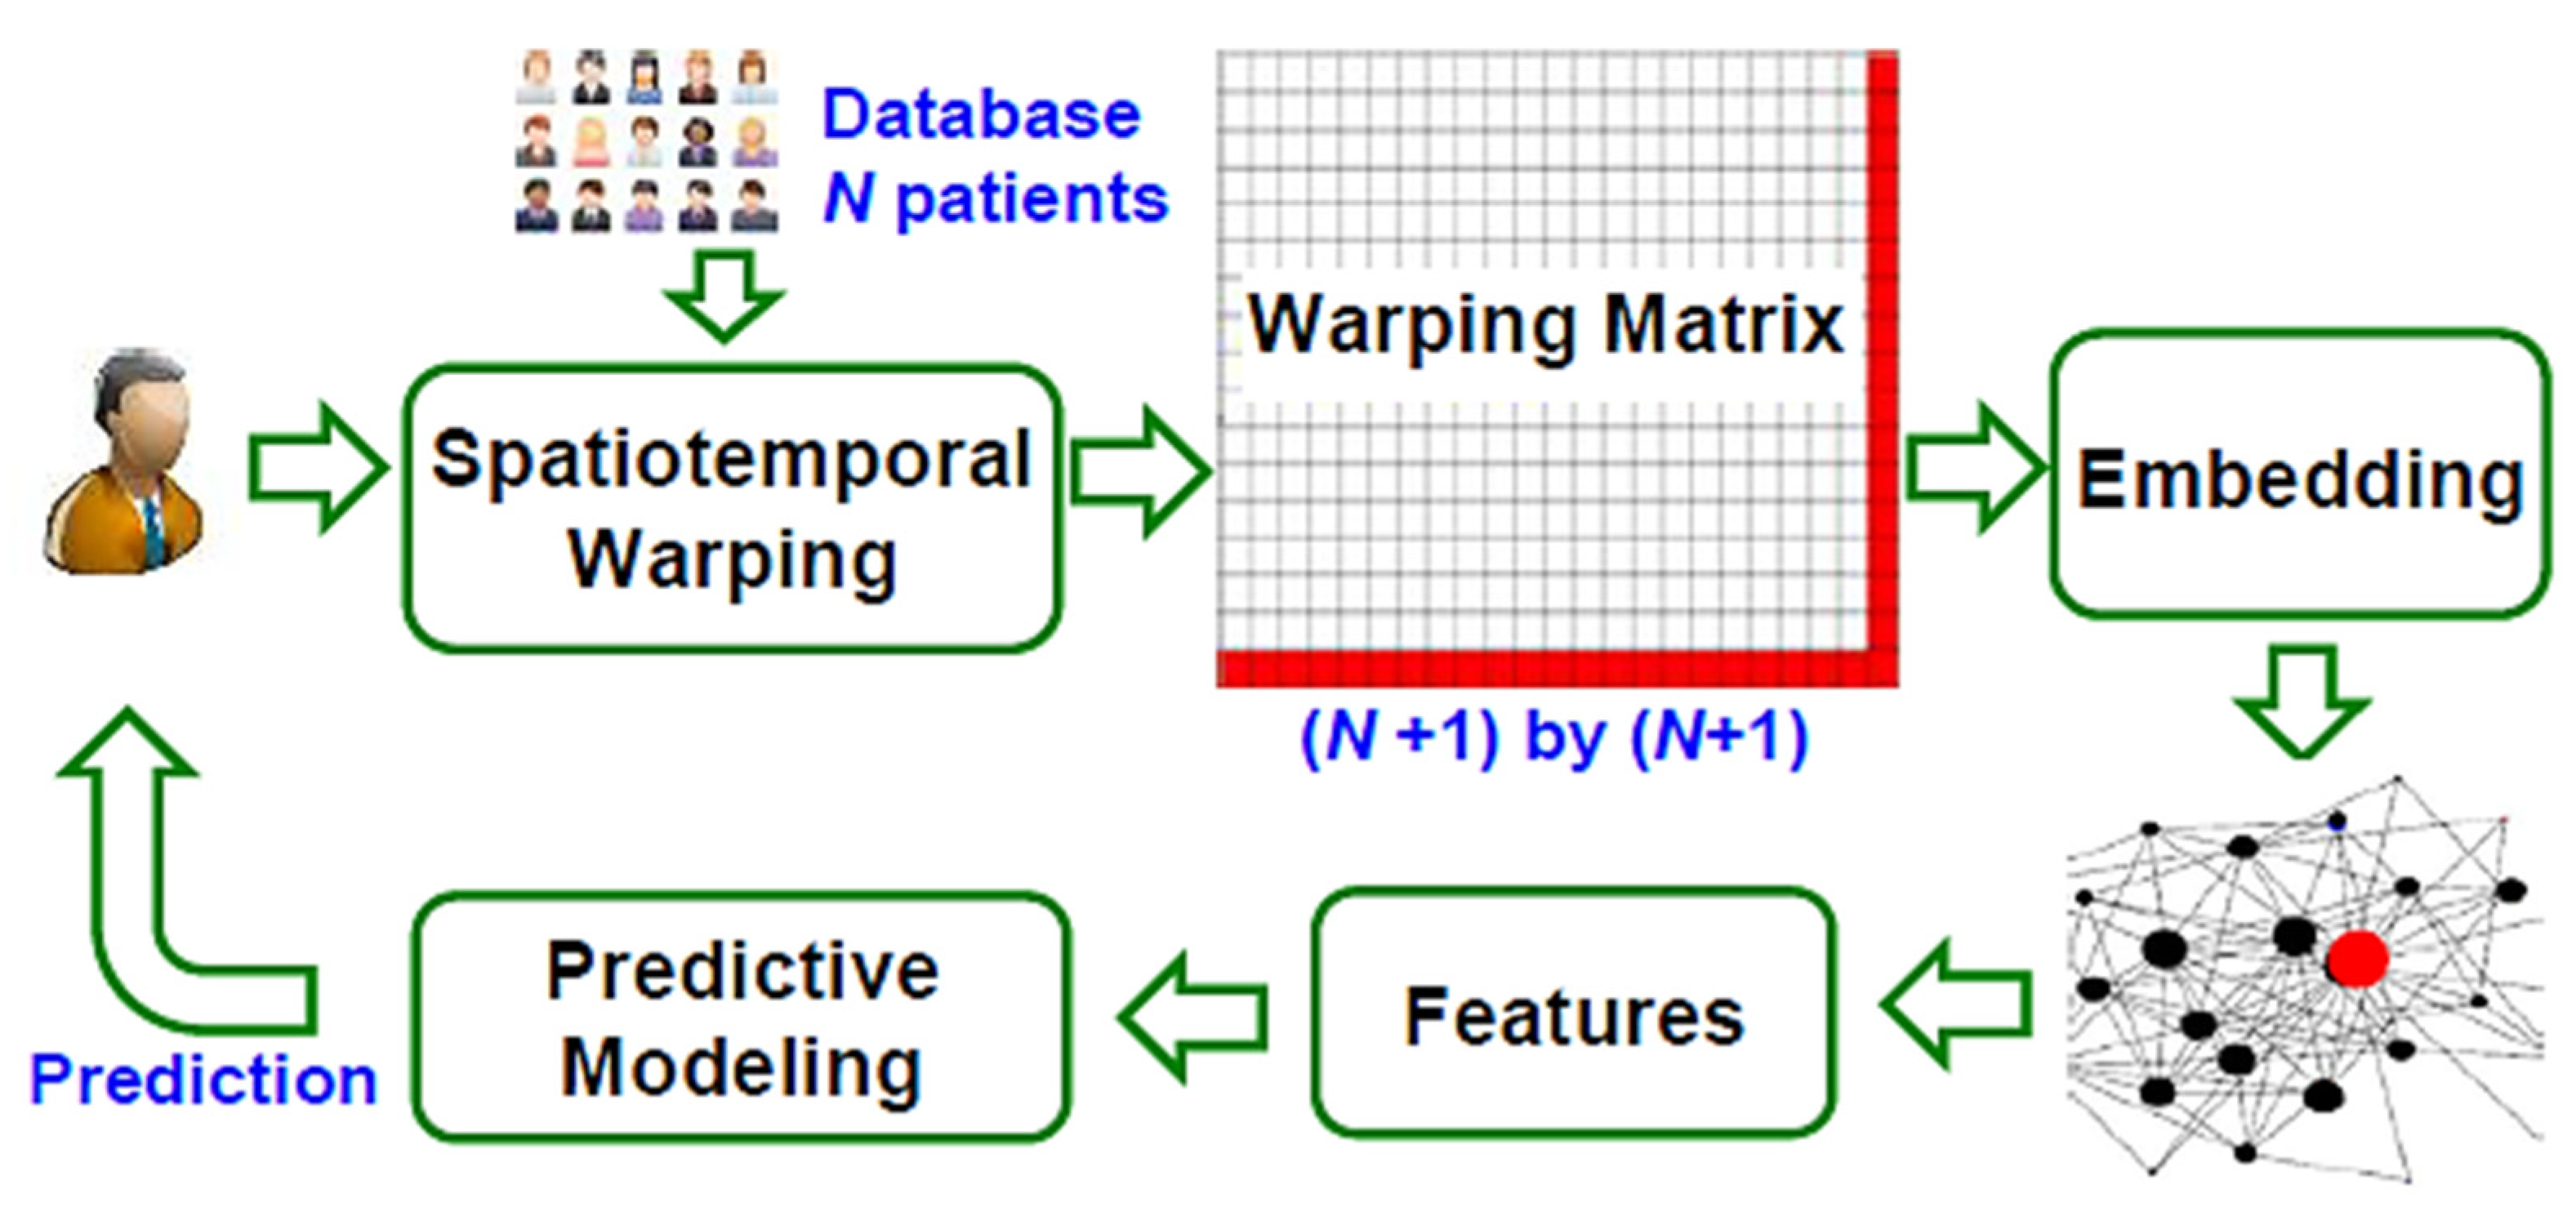
- Kan, C.; Chen, Y.; Leonelli, F.; Yang, H. Mobile Sensing and Network Analytics for Realizing Smart Automated Systems towards Health Internet of Things. In Proceedings of the 2015 IEEE International Conference on Automation Science and Engineering (CASE), Gothenburg, Sweden, 24 August 2015; pp. 1072–1077. [Google Scholar]
- Spanò, E.; Di Pascoli, S.; Iannaccone, G. Low-Power Wearable ECG Monitoring System for Multiple-Patient Remote Monitoring. IEEE Sens. J. 2016, 16, 5452–5462. [Google Scholar] [CrossRef]
- Moustafa, H.; Schooler, E.M.; Shen, G.; Kamath, S. Remote Monitoring and Medical Devices Control in EHealth. In Proceedings of the 2016 IEEE 12th International Conference on Wireless and Mobile Computing, Networking and Communications (WiMob), New York, NY, USA, 17 October 2016; pp. 1–8. [Google Scholar]
- Chen, M.; Ma, Y.; Li, Y.; Wu, D.; Zhang, Y.; Youn, C.-H. Wearable 2.0: Enabling Human-Cloud Integration in Next Generation Healthcare Systems. IEEE Commun. Mag. 2017, 55, 54–61. [Google Scholar] [CrossRef]
- Rahmani, A.M.; Gia, T.N.; Negash, B.; Anzanpour, A.; Azimi, I.; Jiang, M.; Liljeberg, P. Exploiting Smart E-Health Gateways at the Edge of Healthcare Internet-of-Things: A Fog Computing Approach. Future Gener. Comput. Syst. 2018, 78, 641–658. [Google Scholar] [CrossRef]
- Farahani, B.; Firouzi, F.; Chang, V.; Badaroglu, M.; Constant, N.; Mankodiya, K. Towards Fog-Driven IoT EHealth: Promises and Challenges of IoT in Medicine and Healthcare. Future Gener. Comput. Syst. 2018, 78, 659–676. [Google Scholar] [CrossRef] [Green Version]
- Almotiri, S.H.; Khan, M.A.; Alghamdi, M.A. Mobile Health (m-Health) System in the Context of IoT. In Proceedings of the 2016 IEEE 4th International Conference on Future Internet of Things and Cloud Workshops (FiCloudW), Vienna, Austria, 22 August 2016; pp. 39–42. [Google Scholar]
- Rashed, A.; Ibrahim, A.; Adel, A.; Mourad, B.; Hatem, A.; Magdy, M.; Elgaml, N.; Khattab, A. Integrated IoT Medical Platform for Remote Healthcare and Assisted Living. In Proceedings of the 2017 Japan-Africa Conference on Electronics, Communications and Computers (JAC-ECC), Alexandria, Egypt, 18 December 2017; pp. 160–163. [Google Scholar]
- Pang, I.; Okubo, Y.; Sturnieks, D.; Lord, S.R.; Brodie, M.A. Detection of Near Falls Using Wearable Devices: A Systematic Review. J. Geriatr. Phys. Ther. 2019, 42, 48–56. [Google Scholar] [CrossRef] [PubMed]
- Mubashir, M.; Shao, L.; Seed, L. A Survey on Fall Detection: Principles and Approaches. Neurocomputing 2013, 100, 144–152. [Google Scholar] [CrossRef]
- Torres, G.G.; Bayan Henriques, R.V.; Pereira, C.E.; Müller, I. An EnOcean Wearable Device with Fall Detection Algorithm Integrated with a Smart Home System. IFAC Pap. 2018, 51, 9–14. [Google Scholar] [CrossRef]
- Wu, F.; Zhao, H.; Zhao, Y.; Zhong, H. Development of a Wearable-Sensor-Based Fall Detection System. Int. J. Telemed. Appl. 2015, 2015, 1–15. [Google Scholar] [CrossRef] [PubMed] [Green Version]
- Li, Q.; Stankovic, J.A.; Hanson, M.A.; Barth, A.T.; Lach, J.; Zhou, G. Accurate, Fast Fall Detection Using Gyroscopes and Accelerometer-Derived Posture Information. In Proceedings of the 2009 Sixth International Workshop on Wearable and Implantable Body Sensor Networks, Berkeley, CA, USA, 3–5 June 2009; pp. 138–143. [Google Scholar]
- Palmerini, L.; Klenk, J.; Becker, C.; Chiari, L. Accelerometer-Based Fall Detection Using Machine Learning: Training and Testing on Real-World Falls. Sensors 2020, 20, 6479. [Google Scholar] [CrossRef]
- Luna-Perejón, F.; Domínguez-Morales, M.J.; Civit-Balcells, A. Wearable Fall Detector Using Recurrent Neural Networks. Sensors 2019, 19, 4885. [Google Scholar] [CrossRef] [Green Version]
- Kraft, D.; Srinivasan, K.; Bieber, G. Deep Learning Based Fall Detection Algorithms for Embedded Systems, Smartwatches, and IoT Devices Using Accelerometers. Technologies 2020, 8, 72. [Google Scholar] [CrossRef]
- Hussain, F.; Umair, M.B.; Ehatisham-ul-Haq, M.; Pires, I.M.; Valente, T.; Garcia, N.M.; Pombo, N. An Efficient Machine Learning-Based Elderly Fall Detection Algorithm. arXiv 2019, 1–6. Available online: https://arxiv.org/ftp/arxiv/papers/1911/1911.11976.pdf (accessed on 26 April 2021).
- Gunale, K.G.; Mukherji, P. Fall Detection Using K-Nearest Neighbor Classification for Patient Monitoring. In Proceedings of the 2015 International Conference on Information Processing (ICIP), Pune, India, 16–19 December 2015; pp. 520–524. [Google Scholar]
- Pierleoni, P.; Pernini, L.; Belli, A.; Palma, L.; Valenti, S.; Paniccia, M. SVM-Based Fall Detection Method for Elderly People Using Android Low-Cost Smartphones. In Proceedings of the 2015 IEEE Sensors Applications Symposium (SAS), Zadar, Croatia, 13–15 April 2015; pp. 1–5. [Google Scholar]
- Mazurek, P.; Morawski, R.Z. Application of Naïve Bayes Classifier in Fall Detection Systems Based on Infrared Depth Sensors. In Proceedings of the 2015 IEEE 8th International Conference on Intelligent Data Acquisition and Advanced Computing Systems: Technology and Applications (IDAACS), Warsaw, Poland, 24–26 September 2015; Volume 2, pp. 717–722. [Google Scholar]
- Greene, S.; Thapliyal, H.; Carpenter, D. IoT-Based Fall Detection for Smart Home Environments. In Proceedings of the 2016 IEEE International Symposium on Nanoelectronic and Information Systems (iNIS), Gwalior, India, 19 December 2016; pp. 23–28. [Google Scholar]
- Pierleoni, P.; Belli, A.; Maurizi, L.; Palma, L.; Pernini, L.; Paniccia, M.; Valenti, S. A Wearable Fall Detector for Elderly People Based on AHRS and Barometric Sensor. IEEE Sens. J. 2016, 16, 6733–6744. [Google Scholar] [CrossRef]
- Liu, K.-C.; Yen, C.-Y.; Chang, L.-H.; Hsieh, C.-Y.; Chan, C.-T. Wearable Sensor-Based Activity Recognition for Housekeeping Task. In Proceedings of the 2017 IEEE 14th International Conference on Wearable and Implantable Body Sensor Networks (BSN), Eindhoven, The Netherlands, 9–12 May 2017; pp. 67–70. [Google Scholar]
- Kaur, K.; Sachdeva, M. Fog Computing in IOT: An Overview of New Opportunities. In Proceedings of the ICETIT 2019: Emerging Trends in Information Technology; Singh, P.K., Panigrahi, B.K., Suryadevara, N.K., Sharma, S.K., Singh, A.P., Eds.; Springer International Publishing: Cham, Switzerland, 2020; pp. 59–68. [Google Scholar]
- Bonomi, F.; Milito, R.; Zhu, J.; Addepalli, S. Fog Computing and Its Role in the Internet of Things. In Proceedings of the First Edition of the MCC Workshop on Mobile Cloud Computing; Association for Computing Machinery: Helsinki, Finland, 2012; pp. 13–16. [Google Scholar]


| Work | Edge/Fog Computing | Storage Modality | Feedback Typology |
|---|---|---|---|
| C. Kan et al. [69] | Smartphone provided pre-processing capability and network connectivity | Central DB | Prediction about heart diseases |
| E. Spanò et al. [70] | Gateway collected and processed data from wearables devices | Central DB | Information about heart dysfunctions |
| H. Moustafa et al. [71] | Edge Cloud of Gateway performed data aggregation from wearable devices | Local and Central DB | Information about health and wellness of user’s status |
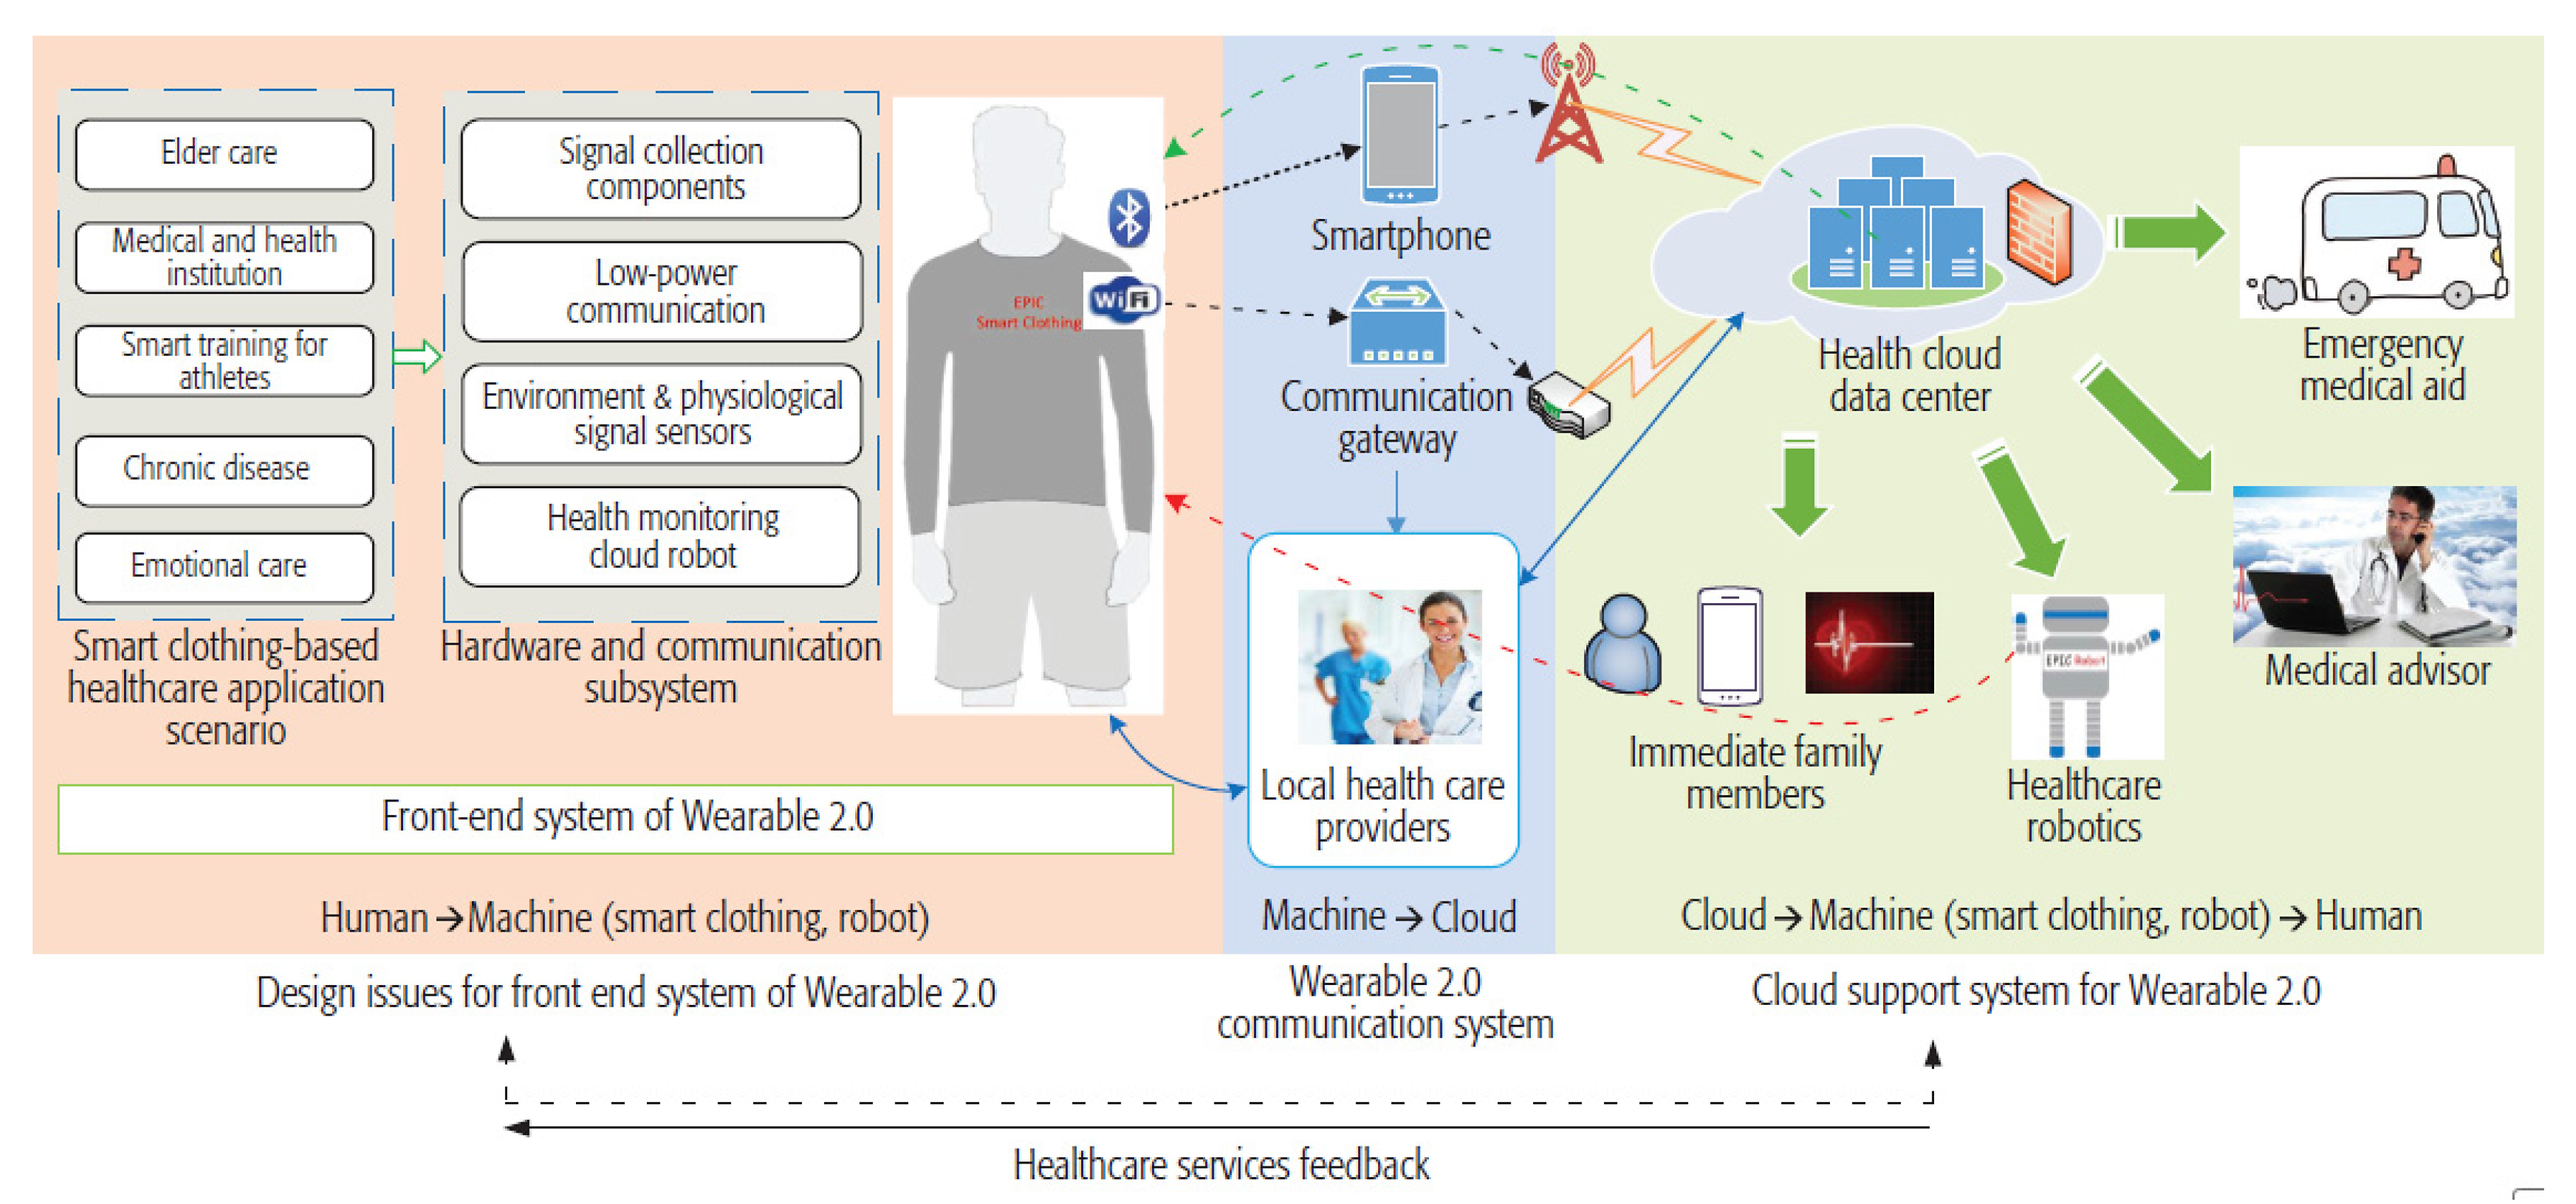
| M. Chen et al. [72] | Local Health providers | Central DB | Emergency medical aid |
| Medical advisor | |||
| Warning to family members | |||
| A.M. Rahmani et al. [73] | Gateways carried out data processing, local notification, protocol conversion, data filtering and mining | Local and Central DB | Emergency medical aid |
| Medical advisor | |||
| Warning to family members | |||
| B. Farahani et al. [74] | Fog nodes provided network connectivity, computational power and storage | Local and Central DB | Emergency medical aid |
| Medical advisor | |||
| Warning to family members | |||
| A. Rashed et al. [76] | Gateways carried out data processing, local notification, protocol conversion | Local and Central DB | Medical advisor |
| Information about health and wellness of user’s status | |||
| S. Green et al. [89] | - | Local and Central DB | Fall Detection, Warning messages to family and caregivers |
Publisher’s Note: MDPI stays neutral with regard to jurisdictional claims in published maps and institutional affiliations. |
© 2021 by the authors. Licensee MDPI, Basel, Switzerland. This article is an open access article distributed under the terms and conditions of the Creative Commons Attribution (CC BY) license (https://creativecommons.org/licenses/by/4.0/).
Share and Cite
De Fazio, R.; De Vittorio, M.; Visconti, P. Innovative IoT Solutions and Wearable Sensing Systems for Monitoring Human Biophysical Parameters: A Review. Electronics 2021, 10, 1660. https://doi.org/10.3390/electronics10141660
De Fazio R, De Vittorio M, Visconti P. Innovative IoT Solutions and Wearable Sensing Systems for Monitoring Human Biophysical Parameters: A Review. Electronics. 2021; 10(14):1660. https://doi.org/10.3390/electronics10141660
Chicago/Turabian StyleDe Fazio, Roberto, Massimo De Vittorio, and Paolo Visconti. 2021. "Innovative IoT Solutions and Wearable Sensing Systems for Monitoring Human Biophysical Parameters: A Review" Electronics 10, no. 14: 1660. https://doi.org/10.3390/electronics10141660
APA StyleDe Fazio, R., De Vittorio, M., & Visconti, P. (2021). Innovative IoT Solutions and Wearable Sensing Systems for Monitoring Human Biophysical Parameters: A Review. Electronics, 10(14), 1660. https://doi.org/10.3390/electronics10141660