Article

Identification of the Factors That Influence University Learning with Low-Code/No-Code Artificial Intelligence Techniques

by
William Villegas-Ch.
1,*,
Joselin García-Ortiz
1 and
Santiago Sánchez-Viteri
2
1
Escuela de Ingeniería en Tecnologías de la Información, FICA, Universidad de Las Américas, Quito 170125, Ecuador
2
Departamento de Sistemas, Universidad Internacional del Ecuador, Quito 170411, Ecuador
*
Author to whom correspondence should be addressed.
Electronics 2021, 10(10), 1192; https://doi.org/10.3390/electronics10101192
Submission received: 27 April 2021 / Revised: 11 May 2021 / Accepted: 14 May 2021 / Published: 17 May 2021

Abstract

:
Education is one of the sectors that improves the future of societies; unfortunately, the pandemic generated by coronavirus disease 2019 has caused a variety of problems that directly affect learning. Universities have found it necessary to begin a transition towards remote or online educational models. To do so, the only method that guarantees the continuity of classes is using information and communication technologies. The transition in the foreground points to the use of technological platforms that allow interaction and the development of classes through synchronous sessions. In this way, it has been possible to continue developing both administrative and academic activities. However, in effective education, there are factors that create an ideal environment where the generation of knowledge is possible. By moving from traditional educational models to remote models, this environment has been disrupted, significantly affecting student learning. Identifying the factors that influence academic performance has become the priority of universities. This work proposes the use of intelligent techniques that allow the identification of the factors that affect learning and allow effective decision-making that allows improving the educational model.

1. Introduction

Currently, improving the quality of university education is one of the main objectives of higher education institutions. To meet this objective, student-centered educational methods have been designed that allow them to improve student learning and lower university dropout rates [1]. However, choosing the educational method and models that allow adequate decision-making and actions is not an easy process to apply, due to the diversity of factors that influence academic performance [2]. Academic performance is generally associated with psychological, economic, social and institutional factors [3]. Therefore, student success depends on characteristics, means and values that establish an ideal environment for the generation of learning [4]. Several of the works related to the prediction of academic performance associate factors such as the pre-university education of the country, as well as the method used by the teacher, with very few existing applications analyzing university educational models through the available data in institutions [5].
Generally, academic performance is the product of the achievements obtained by students in the traditional grading system [6]. This assessment is associated with factors such as the habits of the student in the practices of study, work, fun, etc., the family in relation to the student’s environment, and economic income. Universities provide educational resources, interaction with teachers and students, schedules, teacher pedagogy, etc. Most of the studies analyzed focus on identifying the difficulties that students have or the problems that are generated in learning, but they rarely propose real solutions applied to the new reality [7] which has occurred because of the coronavirus disease 2019 (COVID-19) pandemic [8,9]. Universities and their educational models have been compromised by COVID-19 [10]. The solution that universities have taken is to move from traditional educational models to remote models [11,12]. These remote education models are executed in an environment where ICT are integrated, allowing communication and the execution of certain administrative activities [13]. However, the remote educational mode presents problems that affect learning. These works posit psychological, economic and academic problems as the main factors. In the remote education model, the traditional education method is maintained, but it does not create a suitable environment where the teacher is the main actor of learning [14]. By not having the control of the group, through teacher–student physical interaction, in addition to problems related to the use of technology, teachers take a back seat, which is detrimental to learning. In addition, there are problems related to the student’s lack of interest in the educational model [15]. Faced with these problems, the academic quality and management departments have been overwhelmed in academic monitoring and the identification of learning problems. Effectiveness has even been lost, causing even more serious problems such as repeating or dropping out of college [16,17]. Several works focus on the use of artificial intelligence (AI) techniques or models to identify the factors that influence the academic performance of students [18,19,20]. This analysis allows for identifying and characterizing the profiles of the students to classify them, according to the academic performance of the different subjects [21]. For this, several works use techniques such as decision trees or regressions, applied to databases of learning management systems (LMS).
Other works use data mining techniques or the Gradient Boosting Machine to predict academic performance [22]. In its processing, absenteeism, basic education, the economy and age are identified as pre-determining factors in academic performance. In addition, there are studies that make use of algorithms based on machine learning, fuzzy logic, K nearest neighbor, fuzzy logic or neural networks that have been able to predict academic performance with greater accuracy [23,24]. Other variables include motivating tasks, objectives, perception of instrumentalization and self-regulated learning [25]. Other works analyzed the personality traits among students against academic performance in the same conditions, finding significant differences in each of the groups, with which a prediction was established according to the traits of the students [26]. In general, AI has been used to predict a wide variety of events, among which the following stand out: characterization and prediction of academic downloads, improvement of learning, and prediction of performance based on cognitive and non-cognitive factors [27]. Once the problems that affect the learning of university students have been identified, the research question is posed that allows us to propose a method adaptable to the current situation. The question is “Is artificial intelligence, with its potential to generate knowledge from data, capable of generating an academic monitoring system that identifies problems in academic performance in order to improve current educational models?”
This work proposes the prediction of the academic performance of university students with the use of AI techniques based on the use of classifiers. The work was carried out on a sample of computer engineering students from a private university in Ecuador. [28], for which a set of factors are considered, such as the frequency of study, interaction with teachers, economic factor, university resources, infrastructure, etc. This work is divided into the following sections that have been considered key to reach the proposed objectives. Section 2 defines the materials and methods; Section 3 presents the results obtained from the analysis; Section 4 presents the discussion of the results obtained with the proposal for improvement in the educational modality to improve learning; and Section 5 presents the conclusions found in the development of the work.

2. Materials and Methods

To develop the method, it is necessary to identify the concepts that are used in each stage of the development of the proposal and how they define the guidelines of the problem encountered in learning.

2.1. Theoretical Foundation

To establish the method, it is necessary to start from several concepts that contribute to the design proposal of an academic monitoring system. As main concepts, the modality of remote education is considered; this concept seeks to clarify the real situation of education. In the technical part, reference is made to artificial intelligence.

2.1.1. Remote Education Model

Due to the threat of COVID-19, universities are faced with decisions about how to continue teaching and learning while keeping their staff and students safe from contagion. Several universities have chosen to cancel all face-to-face classes, including labs and other learning experiences [29]. To continue with the activities, teachers have passed their courses to LMS to follow a model similar to online education. The transition to remote education can provide the flexibility to teach and learn anywhere, anytime, while university staff and support teams are generally available to help education actors learn and implement remote learning [30]. In the current situation, the learning management teams and department do not offer the same level of support to all teachers in such a narrow preparation window. No matter how clever a solution is, it is understandable that many instructors find this a stressful process, impairing their educational activity.
The main drawbacks that arose due to the contingency was the lack of preparation for this modality, since the institutions had to engage remotely and restructure the educational plan that was already established. These new emerging scenarios invite us to rethink education from the point of view of informal and non-formal settings, in which learning can reside outside the usual contexts and even outside educational institutions [31,32]. Both daily learning through the use of technologies and informational connections through networks and nodes can be two perspectives that allow understanding the new environments and environments of teachers and students. On the other hand, universities have been forced to respond to this health emergency with different academic contingency plans according to their installed capacity. This has not been easy, given that educational institutions have been configured around a face-to-face modality. This has been reflected in the resistance around these modalities, the lack of training of teachers in digital skills, and an ineffective integration of ICT in the classroom.

2.1.2. Artificial Intelligence in Education

Providing each student with the faculty to achieve the highest possible level should be the goal of universities and teachers. In the pursuit of these purposes, it is essential to take into account a crucial aspect in training—evaluation. Traditional models propose a homogeneous rate of learning, whose form of evaluation is purely informative and only classifies students according to their results. Faced with instructional models, which propose student-centered learning, with a heterogeneous, formative, personalized assessment and with immediate feedback [33]. However, conducting a formative assessment involves a lot of work for the teacher. In this sense, AI can help to deal with this task and puts into practice the ideas proposed by the instructional models [34]. The key is in automation, which allows meeting the needs of many students in better conditions than doing it with traditional methods.
AI in education offers numerous possibilities to add more value to students, facilitate the teaching-learning process and improve the positioning of educational institutions. AI uses fields such as machine learning (ML), deep learning and natural language processing (NLP) to make algorithms learn by themselves [35,36]. That is, they can process, automate and organize large amounts of data to execute an action and obtain a specific result. Using these innovations in education can bring multiple benefits, especially if you consider that digital transformation is a reality and determines how we will relate. AI algorithms can identify patterns in student behavior—for example, the frequency with which they access counseling services, to interpret whether a student is having difficulties in their educational training. With the processing of these data, it is possible to obtain the necessary information to establish trends in its performance. In fact, some AI software is capable of evaluating the initial state of the student and making projections of its evolution or predicting how likely it is that a student will drop out at a certain time. This allows the implementation of corrective actions to design better teaching methodologies or create curricular networks that favor more efficient learning.

2.1.3. Low-Code/No-Code Artificial Intelligence Techniques

Currently, no-code/base-code AI platforms range from guided platforms, offering classic drag-and-drop functionality, to fully automated machine learning services suitable for machine learning beginners and professionals alike. In addition to no-code artificial intelligence solutions, there are also low-code solutions. In fact, a growing number of tools promise to make the field of data science more accessible. This is not an easy task considering the complexity of data science and the machine learning process. However, many libraries and tools, including Weka, Keras and FastAI, make creating a data science project significantly easier by providing a high-level, easy-to-use interface with several pre-built components. No-code platforms do not require deep programming knowledge, but they allow one to build simple environments quickly [37]. The border between no-code and low-code platforms is quite thin. Platforms that promote themselves as “no-code” often leave some room for customization.

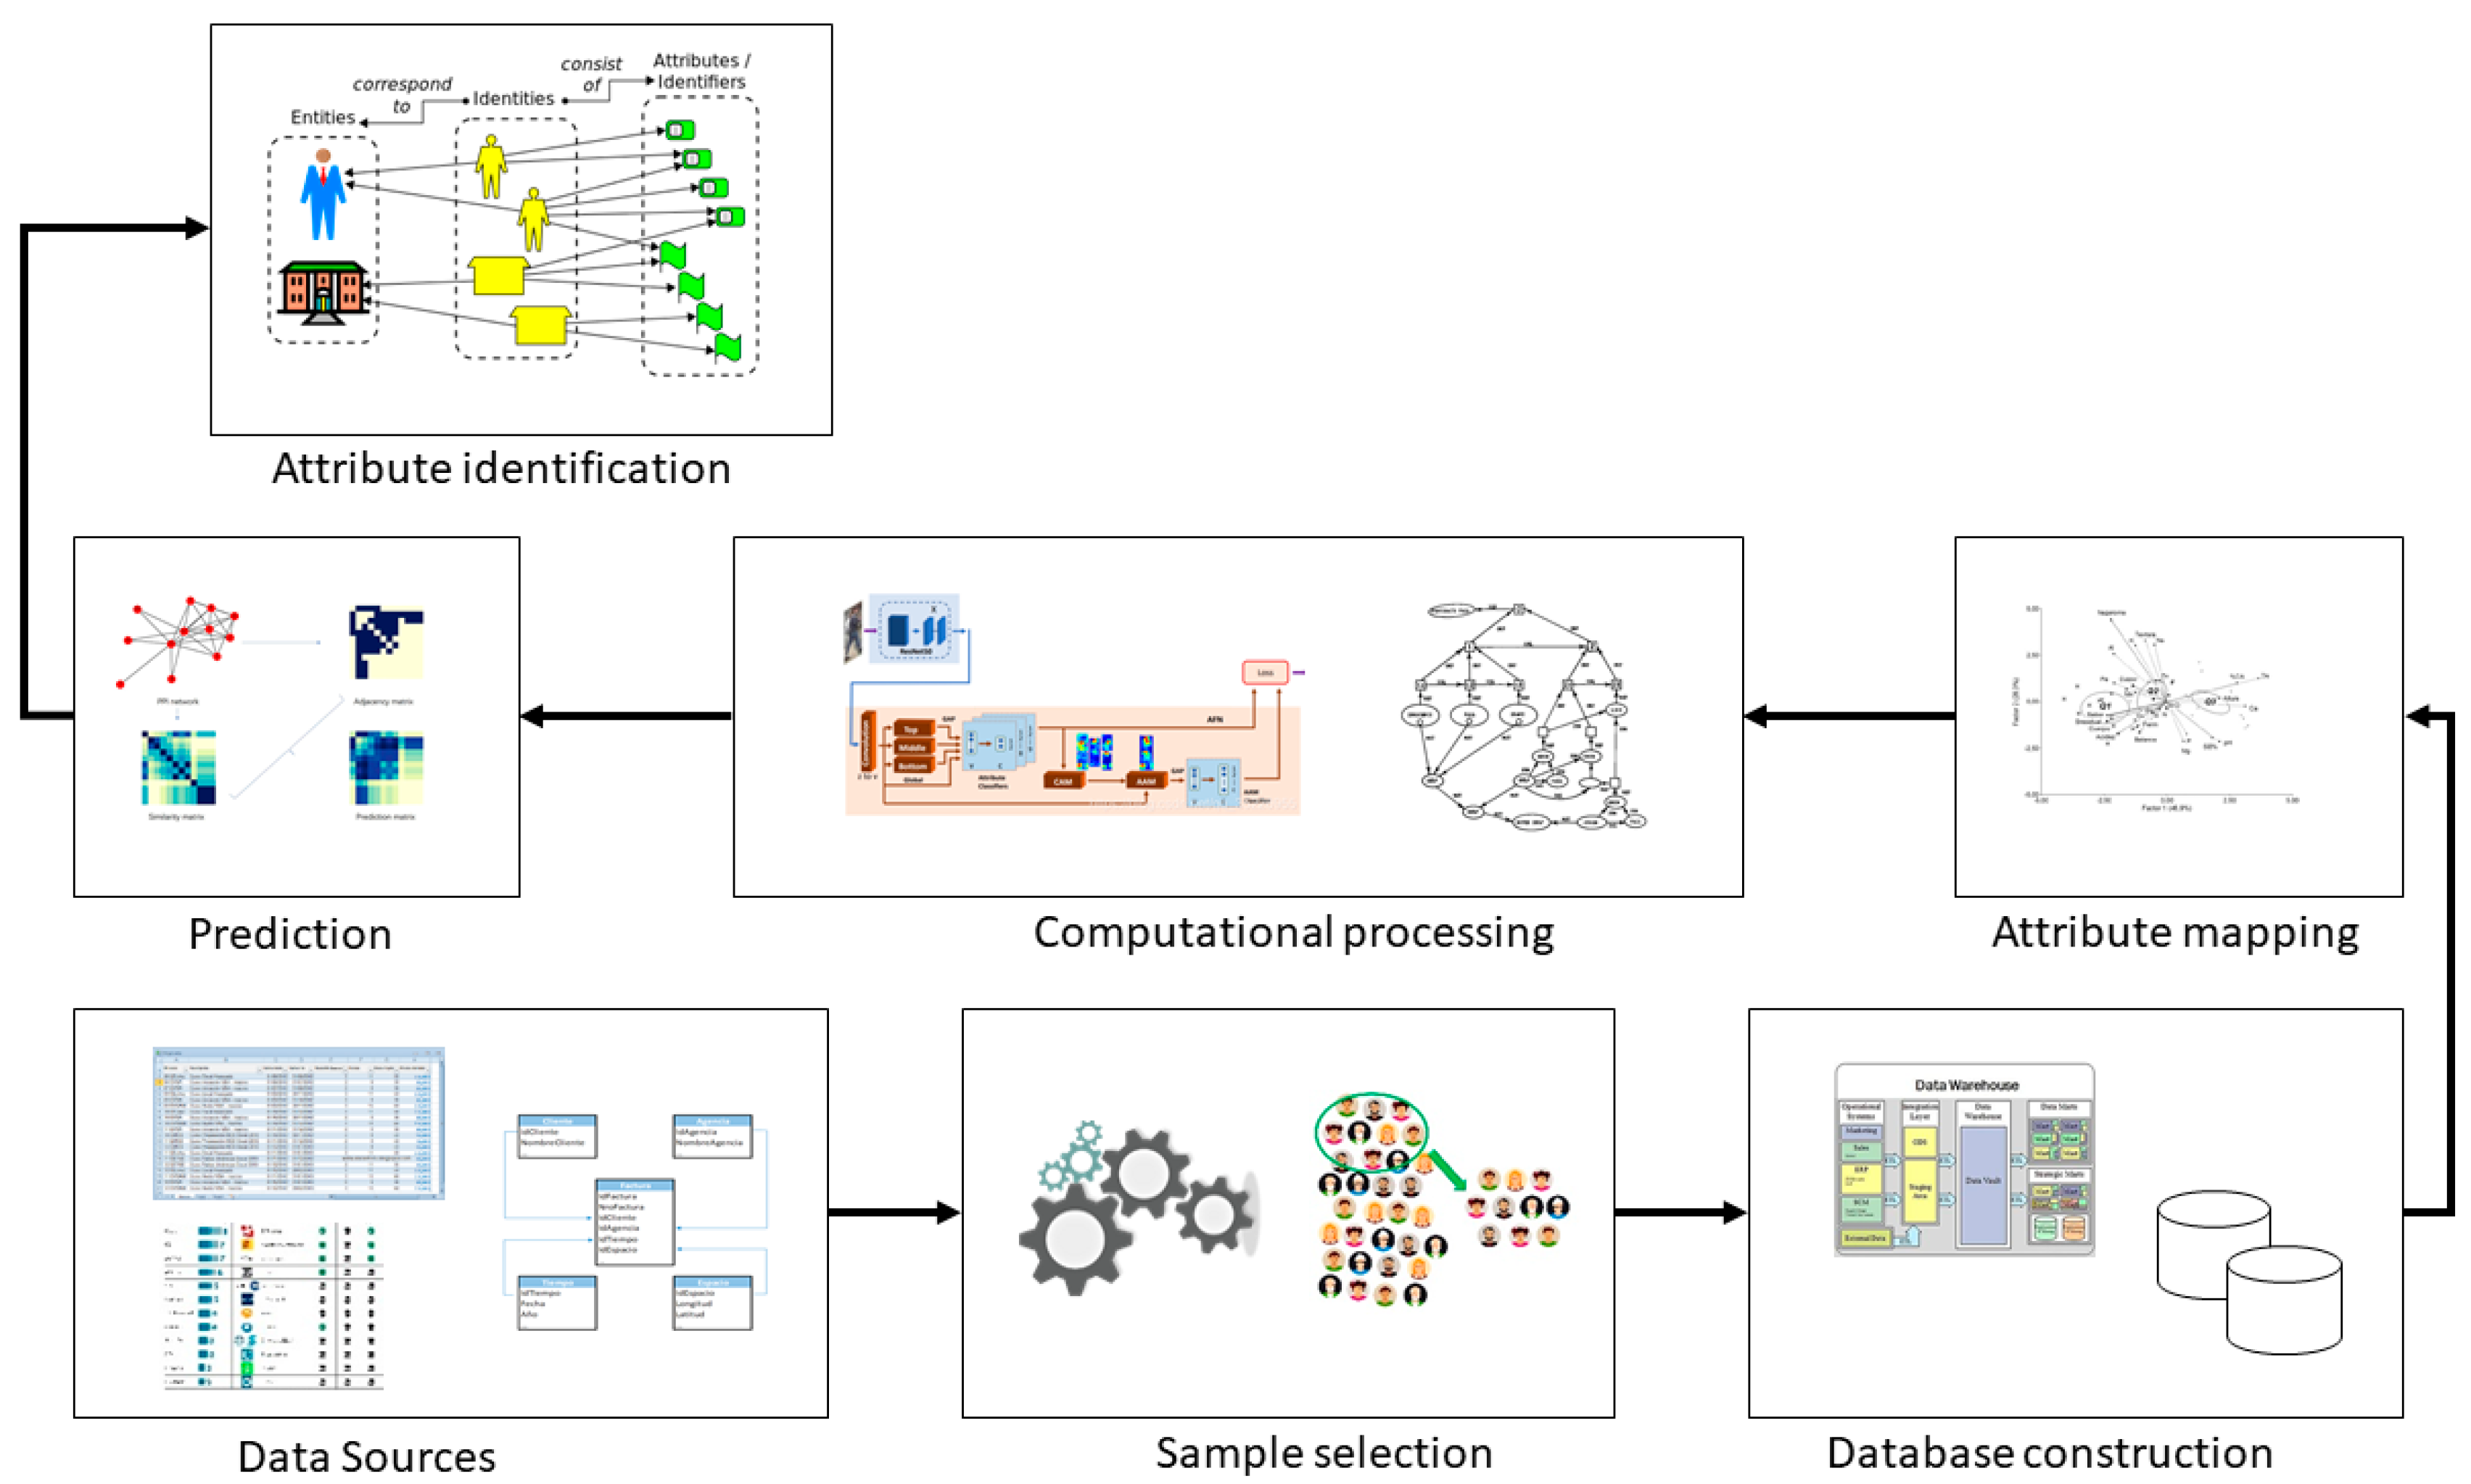
2.2. Analysis of the Factors That Influence Learning with the Use of Artificial Intelligence

For the development of the methodology, intelligent classification techniques, based on AI algorithms, were considered. The tool used for the execution of the algorithms is the Weka program [38]. Smart ranking allows you to predict the academic performance of a college student. With the results obtained, it is possible to establish effective and personalized strategies such as assistance and follow-up programs for students with a projected performance that is unsatisfactory [39]. In addition, the ranking system determines the factors that affect a student’s academic performance. With this information, it is possible to deploy continuous improvement programs at the institutional level. Knowing that these answers are important for decisions, the demand for explainable AI (XAI) is considered. The XAI is the ability to explain a machine learning prediction. Some works substitute a global explanation about what is driving an algorithm in general as a response to the need for explicability [40]. Others equate regression modeling with machine learning, as it can provide a set of explainable factors behind a prediction. Regression modeling is not the same as machine learning; XAI is any machine learning technology that can accurately explain a prediction at the individual level. The methodology is described in a general way in seven stages, which are observed in Figure 1.
  • Data sources (surveys, xlms, databases)
  • Sample selection
  • Database construction
  • Attribute mapping
  • Computational processing
  • Academic performance prediction
  • Identification of influential attributes
The methodology proposal begins with the collection of information in the data sources. Sources include surveys, xlms files, databases, etc. In order to analyze each of the 12 attributes involved in the classification study, several attributes comprise data that were obtained through surveys. The surveys used a five-level scale:
  • 1: never
  • 2: rarely
  • 3: sometimes
  • 4: almost always
  • 5: always.
However, in some questions, 1 should be understood as the lowest level, terrible or none, and 5 should be understood as the highest level, many or excellent. In phase two, the sample is selected. In order to obtain greater statistical reliability, a simple random sampling was applied to 56 students belonging to the fourth level of the computer science engineering program. The sample calculation was carried out by means of the sample calculation equation [41], where:
  • n: dimension of the sample.
  • Z: confidence level,
  • p: variation of success.
  • q: variation of failure.
  • M: number of students in the undergraduate program.
  • e: sample error.
In phase three, the database was built, and the survey was applied to a number n, obtained from the equation of the sample calculation of randomly selected individuals. Therefore, it was considered adequate when it comes to applying Bayesian models. In addition to the surveys, the academic data of the selected students were integrated, such as grade point average, economic situation, etc. The data to enter the system were organized into 5 groups, according to the academic average of each student.
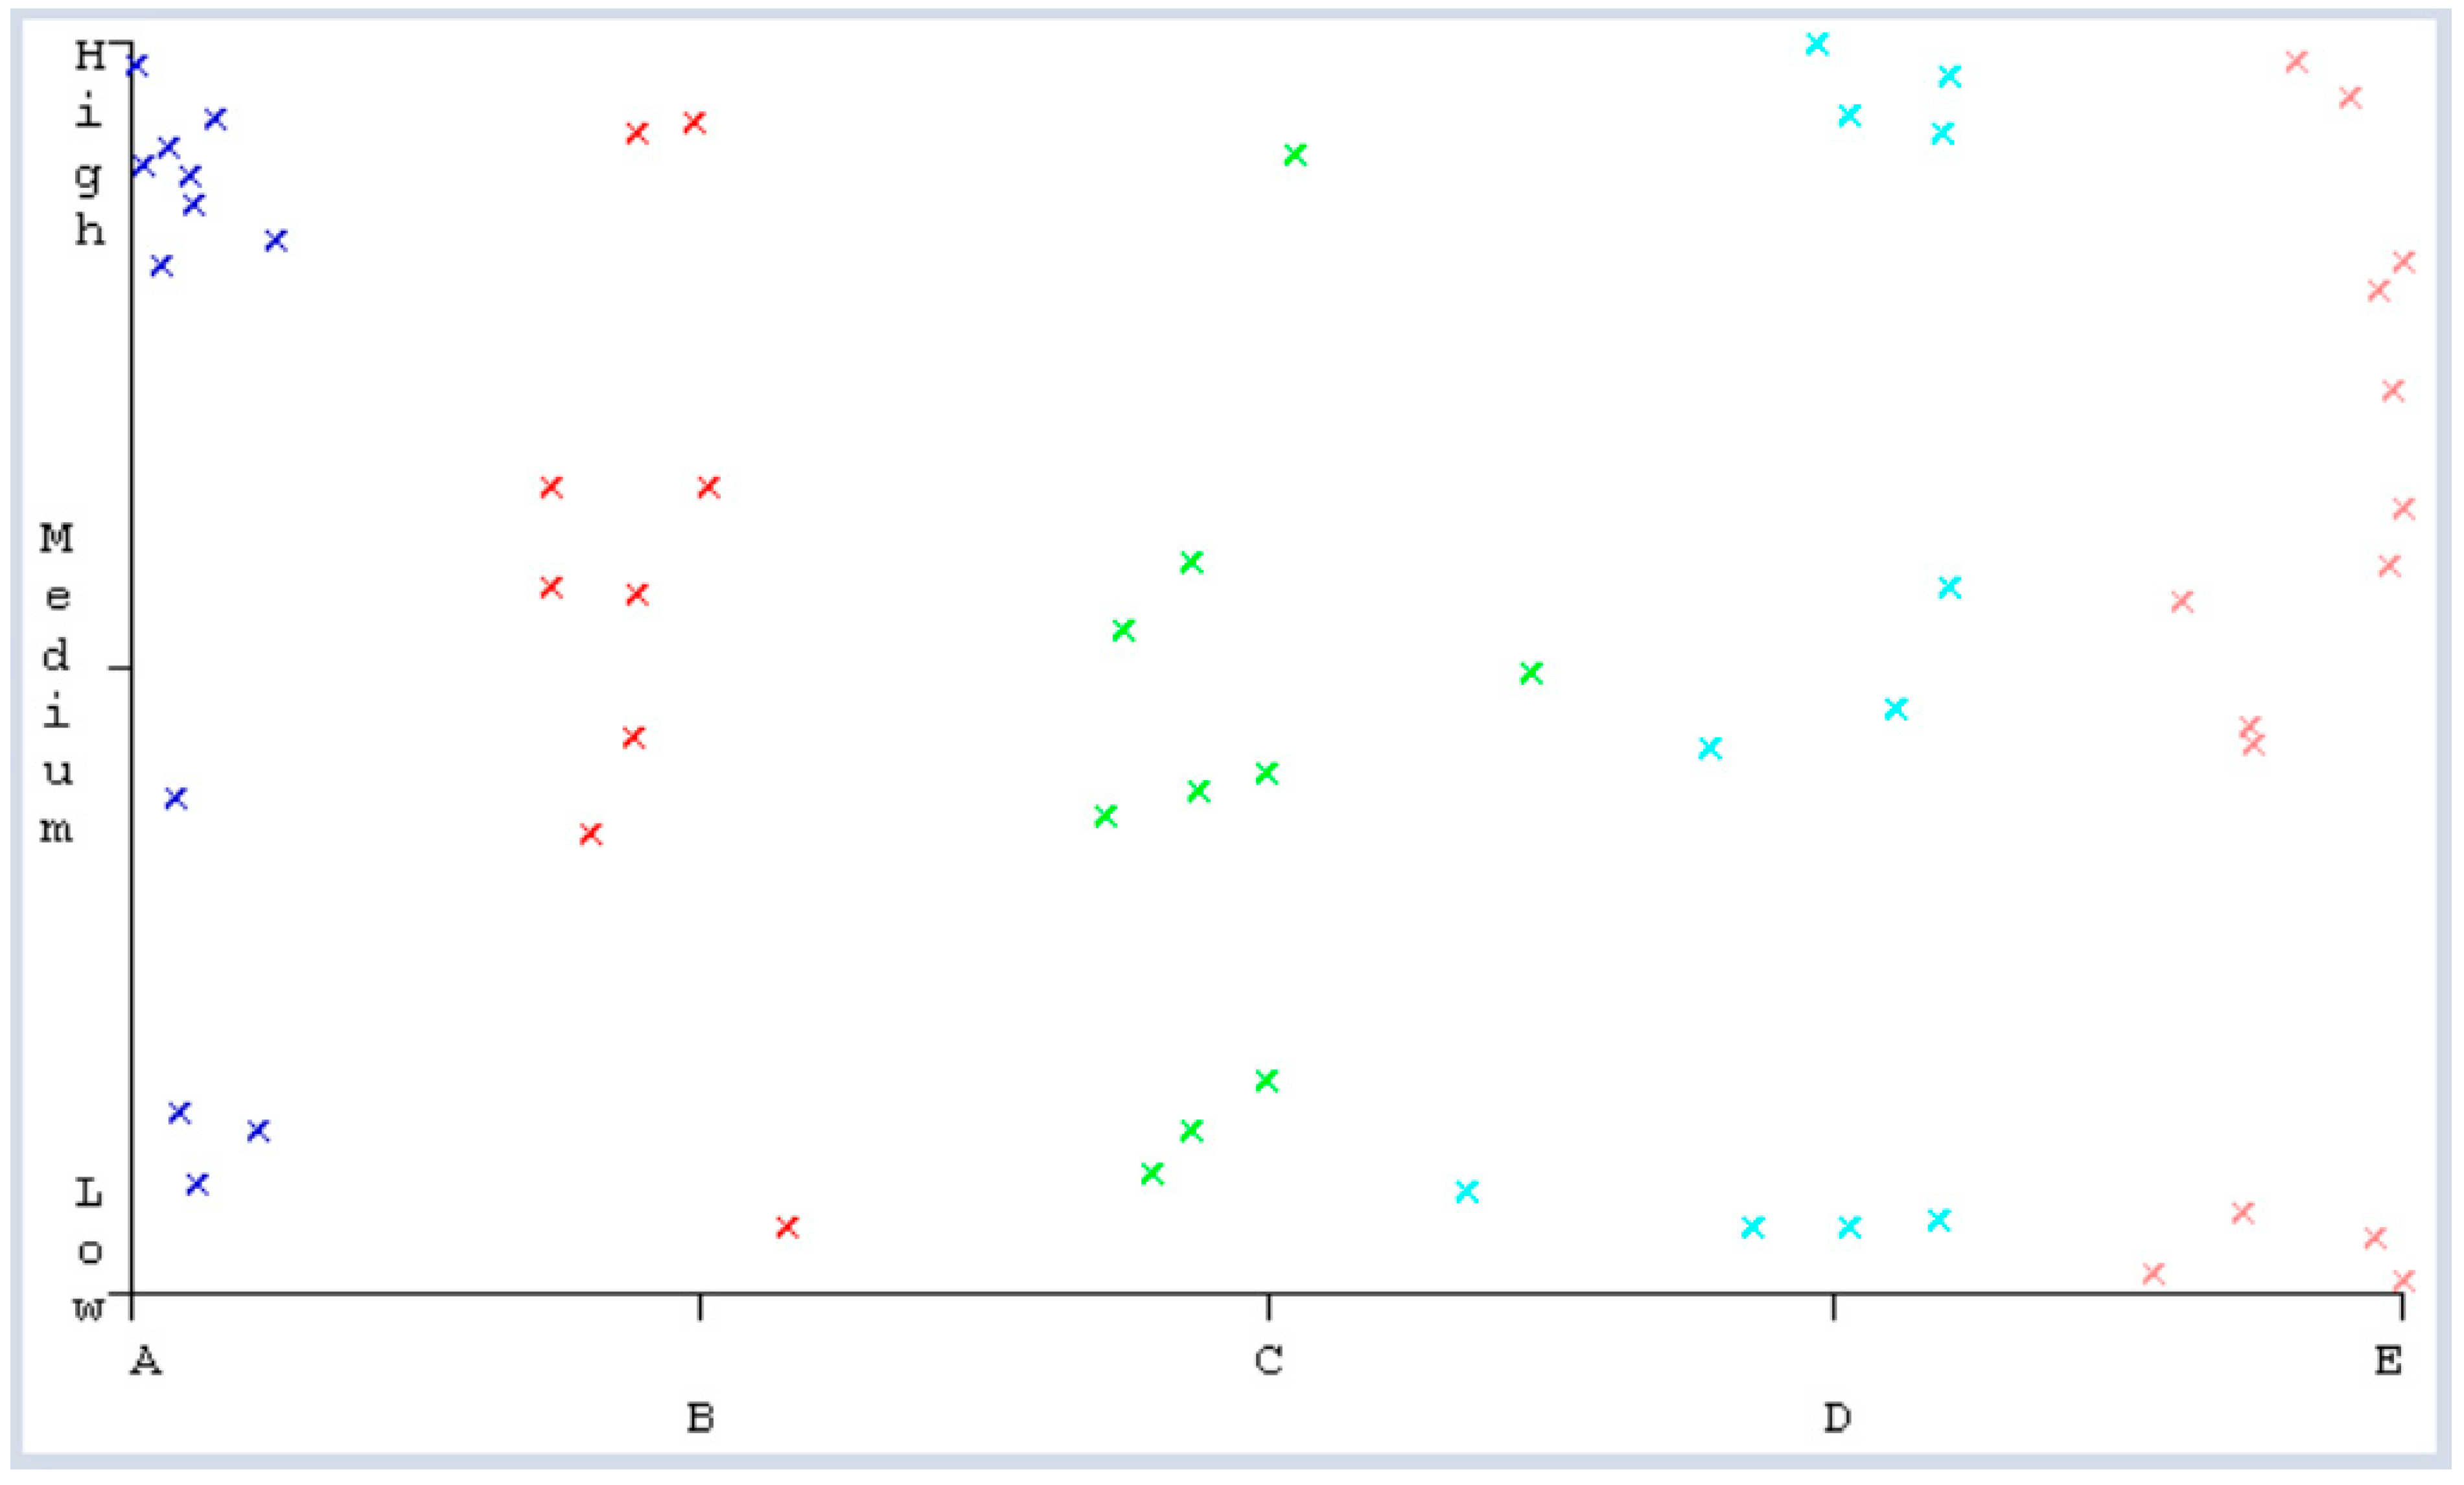
  • A: Average between (8–10)
  • B: average between (<8–6)
  • C: average between (<6–4)
  • D: average between (<4–2)
  • E: average between (<2–0).
In phase 4, the attribute correlation was generated, for which a correlation matrix of the analyzed attributes was built with respect to the dependent variable. This correlation allowed us to demonstrate that the effect produced on the dependent variable is not the product of a single independent variable and establishes the variables that present a greater correlation with the dependent variable. In addition, a previous selection of variables was carried out before using the Bayesian classifier, by means of which the multivariate analysis was carried out.
Phase five performed the computational processing based on the previously defined groups and the attributes selected in phase 4. The header of the. arff file was designed for ingestion in the software platform with the Weka tool. The heading includes each of the nine attributes analyzed, plus the average attribute of each student. Additionally, with the results obtained in step 2, the body of the .arff file was structured to be analyzed by the Weka program, by means of the different artificial intelligence techniques. In phase six, the prediction of academic performance was generated. The .arff file was analyzed by means of a tree-type classifier and other techniques included in Weka that can give good results; however, the advantage of the classifier is that it allows for obtaining efficient results with few data.
In each phase, the main influencing attributes in academic performance were identified. By means of the J48 classification algorithm, Weka makes it possible to obtain the decision tree. Based on this tree, the main influencing attributes of students’ academic performance were identified.

3. Results

The results evaluate the method used for the analysis and prediction of academic performance. For which, several data sources were used: among the sources are surveys, as well as data stored in academic and financial systems. In addition, the LMS data are included, as well as the report issued by the platform used to generate synchronous sessions. These sessions replace face-to-face classes due to the COVID-19 pandemic. Therefore, the university that participated in this study is running a remote education model. In phase one, the structure shown in Table 1 is generated, where the attributes and the type of data they handle are established.
In phase two, the sample is selected, based on Equation (1) of the sample population; the parameters that are considered to define the sample size are the following:
  • N = 320 is the total number of students who are part of the computer engineering academic program
  • Z = 1645 confidence level.
  • p = 0.5
  • q = 0.5
  • e = 0.10 (10% sampling error, for a 90% interval).
n = N Z 2 p q e 2 ( N 1 ) + Z 2 p q
The sample size obtained (n) was 55.9. Therefore, 56 students were considered for the analysis.
In phases three and four, the database and the correlation between attributes are built [42]. Table 2 presents the database containing the 56 students chosen at random from the 320 students that make up the Computer Engineering program. In this table, the correlation of each of the 56 initial columns (independent variables or attributes) with respect to the last column, called the dependent variable, was calculated, and the results are in the last row of the table. To calculate this correlation, the values in the “dependent variable” column were substituted as: A = 5, B = 4, C = 3, D = 2, E = 1.
Column “b” refers to the level of income—this factor was measured based on the existing financial problems due to the pandemic. To calculate the correlation coefficient, in the calculation the measurement criteria were changed to the following values; low = 1, medium = 2, high = 3. However, the table presents the text in column “b” for a better understanding of it, and in column “b-1” the values for correlation. When processing the data with the analysis tool, column “b-1” will be eliminated.
In the table, in addition to the values of each attribute, the existing correlation coefficient between each attribute and the dependent variable was added. Values above 0.38 are marked in green, considering that they are the values closest to the trend line. These values are considered to create the data that will be analyzed with Weka [43]. The attributes that are considered most significant in determining factors in learning are income level, frequency of study, interaction with the teacher, the pedagogy used in remote classes, and the academic average. Table 3 shows the five categories with the data that are used in the analysis. As general aspects, it is indicated that column “a” represents the identifiers of the students that have been placed in the tables. For this reason, these values are sequential and refer to data security and protection. These identifiers are used to determine the students who have problems in the different subjects; if these results are necessary, the personal identification of each student will be passed on to those in charge of academic quality. In these areas, strict controls are applied to the information and the people who handle it, complying with regulations and policies on data protection.
In phases six and seven, the prediction of academic performance and the identification of the influencing attributes in academic performance are performed. To do this, the database is uploaded to the Weka system. When executing the algorithm, it shows information about the type of classifier used, the database being used (students), the number of instances (21), the number of attributes (6), and the type of test (cross validation).
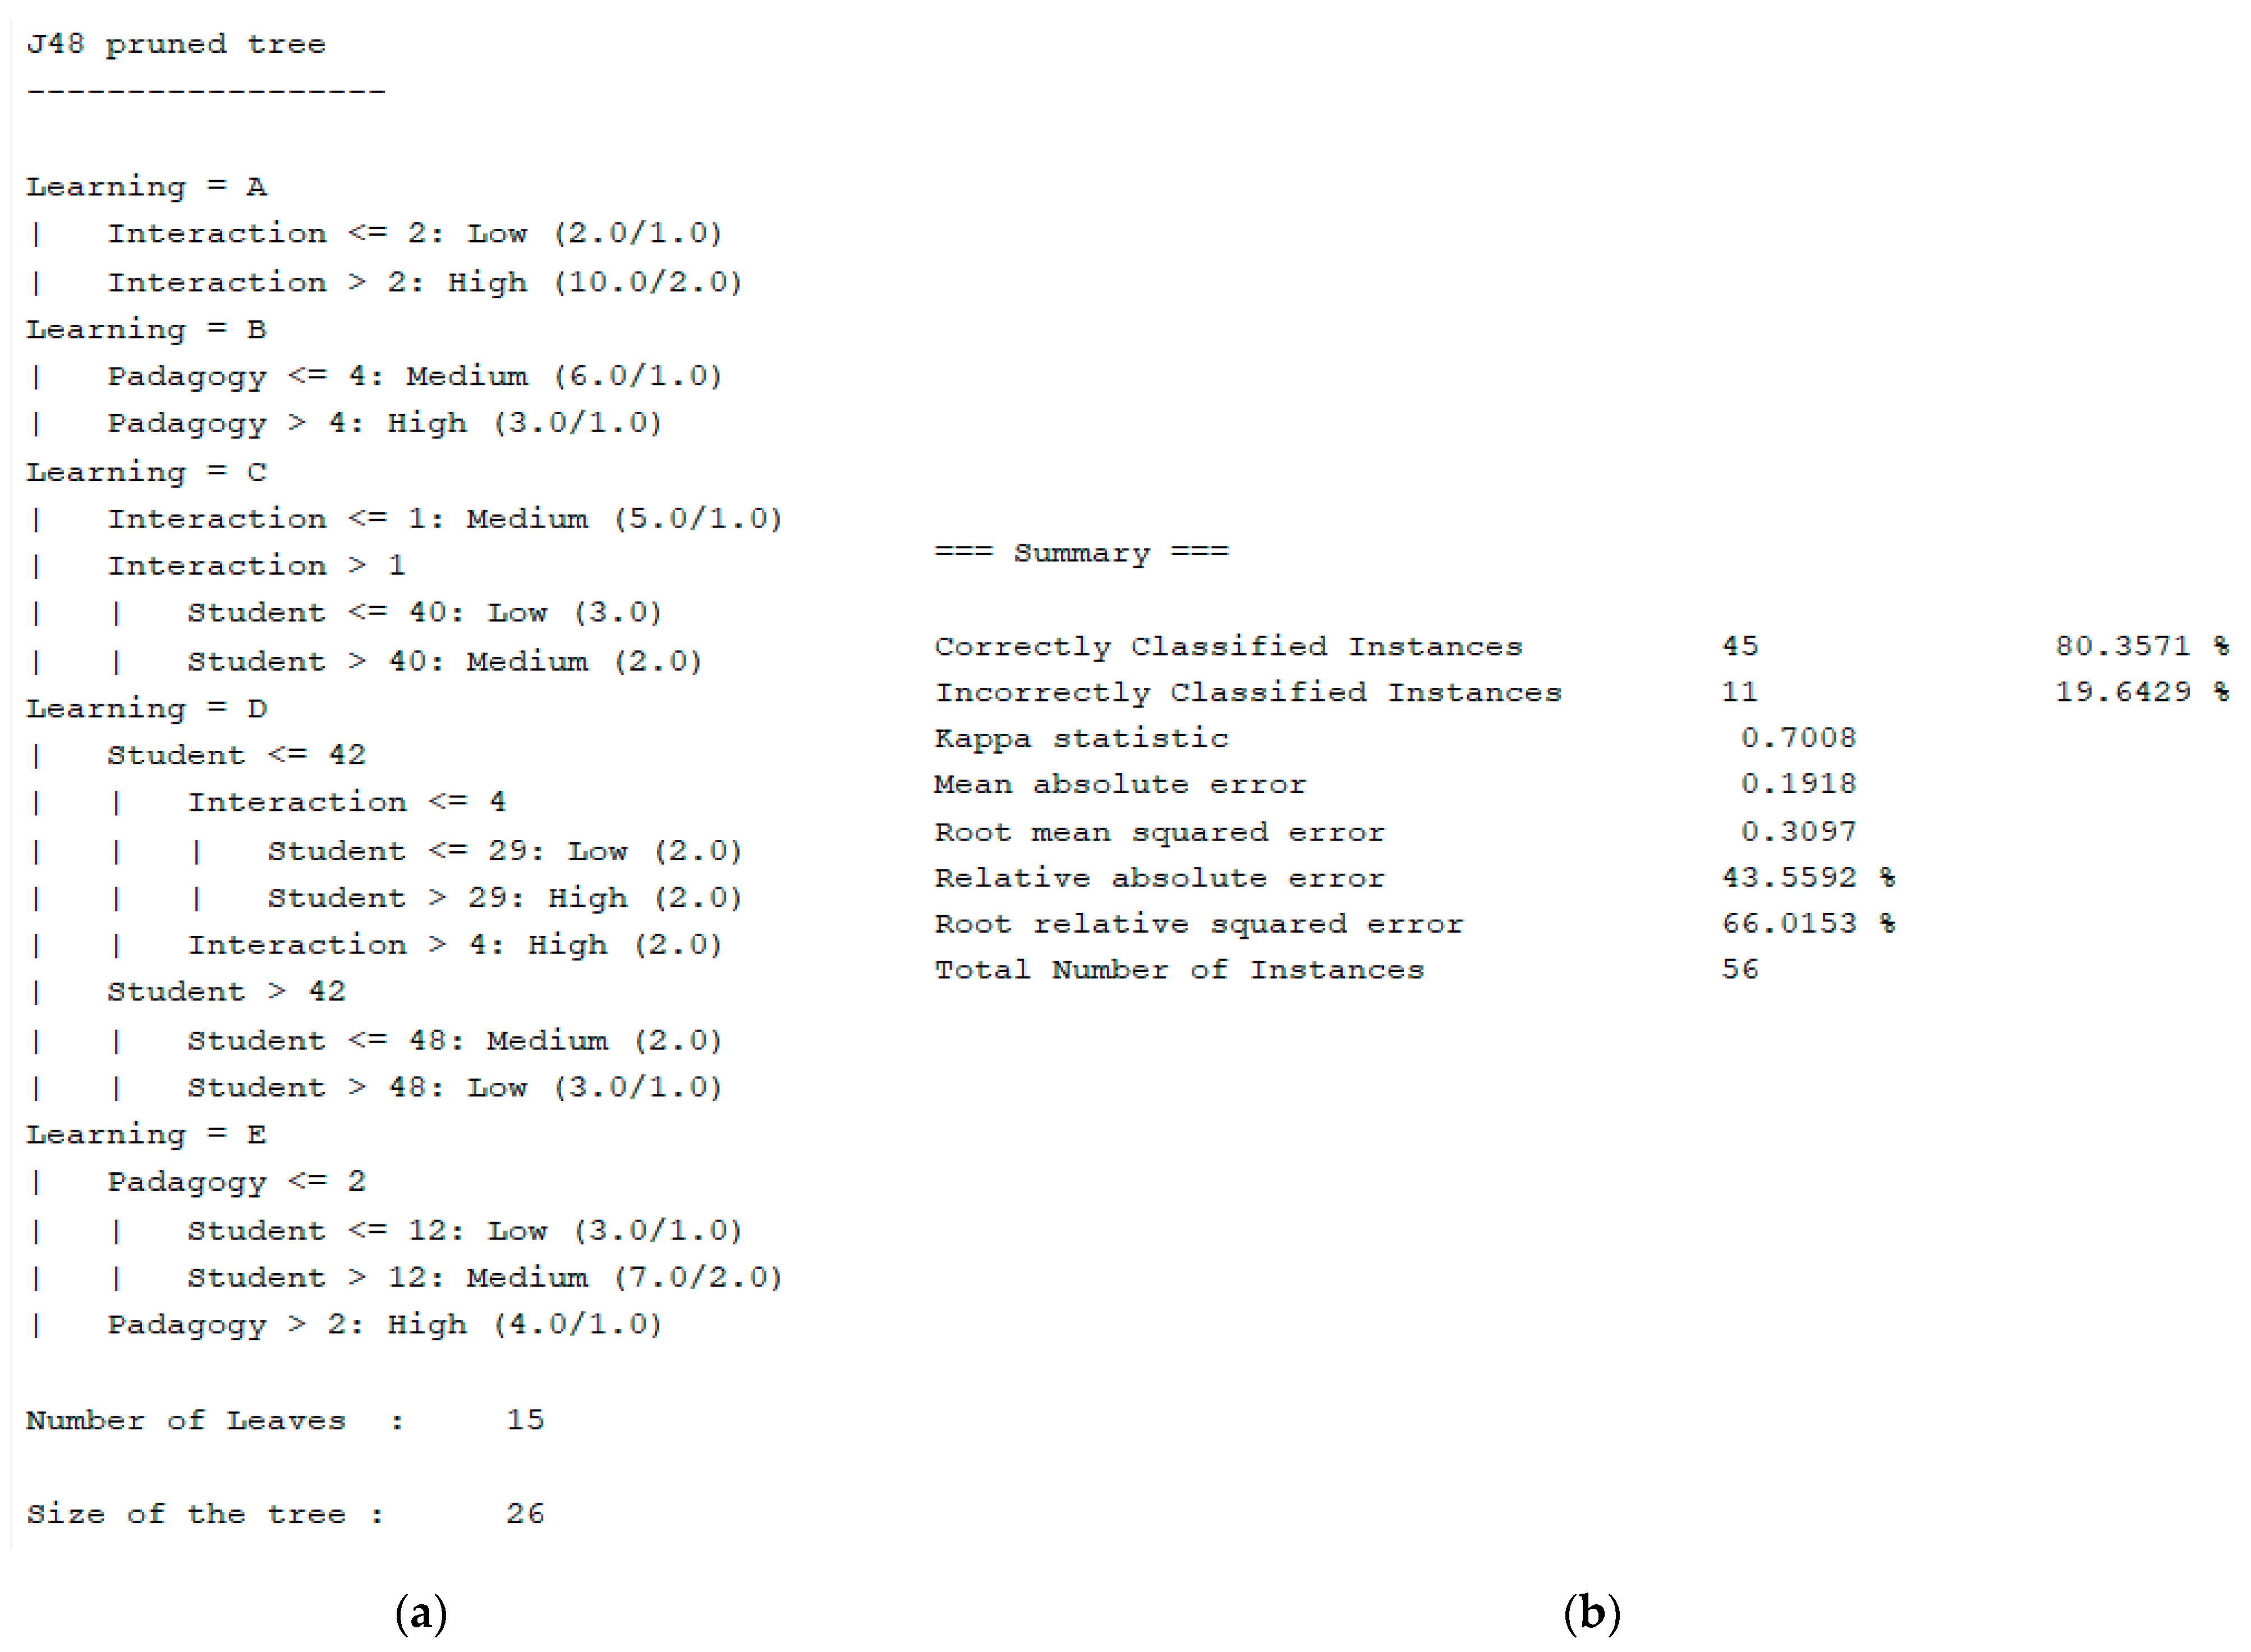
  • Scheme: weka.classifiers.trees.J48 -C 0.25 -M 2
  • Relation: student
  • Instances: 21
  • Attributes: 6
  • Income_level
    Frequency-in-the-study
    Interaction
    Padagogy
    Academic_average
    Learning
  • Test mode: 10-fold cross-validation
The classifier describes the tree information that has been generated and the number of instances that each node classifies. A level of success of 80.95% was obtained in the prediction of academic performance. In the processing carried out by the algorithm, the main factors influencing academic performance were identified and the classification tree was obtained. The tree identifies the branches of attributes that lead to the highest academic averages (A and B). In the same way, the branches that lead to the worst average (E) can be found. The sequence of steps from the initial node to the final node represents the attributes that lead to obtaining a better academic average. The tree data obtained according to the following sequence of attributes are those presented in Figure 2a. In this figure, it is presented how the different factors affect learning in each of the possible situations in relation to the attribute “Income level”. In addition, Figure 2b shows the details of the learning process carried out by the J48 algorithm, where the percentage of classification of instances is 80.3571%, this value representing a high value of effectiveness.
In Figure 3, the learning results of the algorithm are displayed, the learning is shown on the “x” axis and it is possible to contrast it with each attribute that has been integrated into the analysis. In this case, it was evaluated with the attribute that encompasses the financial problems faced by the students. This is presented on the “y” axis. The visualization allows us to establish where the most problems are found—for example, the “x”s in blue are the students with the highest scores. Of 56 students, 12 have an average of 8–10, of which eight have serious financial problems, one has medium-level problems and three have few financial problems. This information is important in all groups; however, it is necessary to establish a greater follow-up in groups C, D, and E, since, their academic averages indicate that there are problems in academic performance, and this constitutes a risk factor relating to dropping out or increases in repetition. This index is very marked in the group in which its average is between 0 and 2. Of 14 students who are in this group, only four have mild financial problems. The remaining 10 have a high probability of dropping out due to financial problems. With this information, the university can make decisions that allow it to establish financial aid, such as scholarships or financing, in order to avoid increases in student dropouts. By having the ability to cross-validate information, the visualization tool guarantees the reliability of the results and an adequate presentation for the use of the different areas involved in academic quality.
To contrast the algorithm used, the processing was also done with the use of random forest. The data are presented in Figure 4, where it can be seen that it consists of 56 instances, of which 23 are correct, with a rate of 41.0714%. There are 33 wrong instances. This shows that learning with the J48 algorithm is better according to the stratified cross-validation data. To improve the prediction, it is possible to modify the values in the cross-validation; however, we decided to present in a future work a training process with a greater number of data to improve the values of instances of correct classification.

4. Discussion

Identifying academic performance is a time-consuming task. This burden on a teacher causes many problems due to the limited time available for the preparation of classes and training activities [44]. The area of academic quality is overwhelmed by the large volume of students who have to be analyzed. For this reason, the generation of ICT tools that focus on analyzing the data generated by the students becomes a necessity. The variables that affect student learning are various, and discovering those that have the greatest incidence is where the analysis work is concentrated. Intelligent techniques, employing algorithms such as the one used in this work, “J48”, become a tempting solution for academic management [45].
Several of the works carried out focus on various techniques that allow them to generate knowledge about educational data; this involves a large investment of resources, both technological, economic and human, and its implementation requires long periods of time. This is something that universities do not have if they want to respond to the problems generated by the pandemic. The solution presented is the first step for the integration of AI into educational processes in the short term [46]. By having the ability to use a tool that has a variety of analysis algorithms, it is possible to train the classification method and apply it according to the needs of the university. AS an open source tool, the costs are greatly reduced, and the response is immediate. This is the most important characteristic in the new normal, where, after more than 13 months of isolation due to the pandemic, there is no immediate end in sight. Universities need to provide immediate answers to learning problems.
The classification process allows for identifying the most influential attributes on academic performance. The work carried out shows that an adequate academic performance is based on a good frequency in the study, good interaction with teachers and good pedagogy. There are other important factors affecting academic performance, such as the quality of teachers [6]. In the literature review, several categories of factors influencing academic performance were identified, the most recurrent being economic, social, personal and institutional problems. These factors cannot always be controlled by universities. This work shows that, by controlling the attributes that have been identified, it is possible to influence the academic performance of a student.
Various works associate academic performance with personal, social, and institutional factors, as well as resources and enthusiasm, etc.; meanwhile, this work associates academic performance specifically to human factors related to teachers and students. These factors in a remote education model should be the main ones for universities. Interaction with teachers plays a very important role in academic performance. When comparing the classification percentages with the classification percentages obtained by some works cited in the introduction to this article, it is found that the level of success is high, which supports the reliability of the study.

5. Conclusions

Education will never be the same again; the pandemic has brought the continuity of educational activities to a critical point. ICT have demonstrated their potential by offering a wide variety of tools that allow the development people’s activities. However, education, which has undergone a forced and abrupt transition towards a remote educational model, needs greater integration of technologies. The integration of ICT in education should focus on accompanying the student in their learning. This undoubtedly serves as a starting point to create new educational models where students take a central role in their learning, alongside ICT which allows for creating suitable environments for the generation of knowledge.
AI is one of the tools that are capable of creating quick solutions that contribute to student learning. The creation of academic monitoring models and recommendation systems become ideal assistants for teachers. By having exact data on the academic problems that students face, it is possible to define educational models aligned to the needs of the students.
This work identifies the factors that influence learning, through intelligent techniques that are quick to execute and provide a great response capacity to the problems we face in the new reality. Along these lines, universities are preparing for a permanent transition to a hybrid and remote educational model, where the integration of technologies must be considered in an integral model that is able to recognize the limitations of students and teachers, and from this knowledge ideal environments can be created for the generation of knowledge. This work opens up a great variety of possibilities for more robust applications, where data analysis is a preamble for the identification of patterns in educational data and AI is in charge of generating knowledge that allow to improve learning. In future works, the authors propose the use of intelligent techniques in data analysis architectures, for the generation of digital environments that are closer to the construction of Smart campus.
When evaluating the method proposed in this work, encouraging results have been obtained in the use of the WEKA tool. However, this efficiency is determined by the volume of data, which is small relative to the speed at which datasets can grow. This tool, which is presented as ideal for evaluating the operation of intelligent classification processes, can be a limitation in a production environment where a greater number of factors are integrated. Future work should consider the integration of tools with greater scalability and robustness that can even be integrated into big data architectures.
As a future work, the creation of applications that combine IoT with AI in universities is proposed, with the aim of understanding and predicting a variety of risks, as well as automating a rapid response, allowing better management of the security of education actors. In the same way, the use of machine learning is proposed, so as to analyze the data of wearable devices, in order to estimate the risk of heat stress that students may suffer in classrooms.

Author Contributions

W.V.-C. contributed to the following: the conception and design of the study, acquisition of data, analysis, and interpretation of data. J.G.-O. contributed to the study by drafting the article and approval of the submitted version. The authors S.S.-V. and W.V.-C. contributed to the study by design, conception, interpretation of data, and critical revision. S.S.-V. made the following contributions to the study: analysis and interpretation of data, approval of the submitted version. All authors have read and agreed to the published version of the manuscript.

Funding

This research received no external funding.

Conflicts of Interest

The authors declare no conflict of interest.

References

  1. Villegas-Ch, W.; Román-Cañizares, M.; Palacios-Pacheco, X. Improvement of an Online Education Model with the Integration of Machine Learning and Data Analysis in an LMS. Appl. Sci. 2020, 10, 5371. [Google Scholar] [CrossRef]
  2. Janssen, M.; van der Voort, H.; Wahyudi, A. Factors influencing big data decision-making quality. J. Bus. Res. 2017, 70, 338–345. [Google Scholar] [CrossRef]
  3. Guarin, C.E.L.; Guzman, E.L.; Gonzalez, F.A. A Model to Predict Low Academic Performance at a Specific Enrollment Using Data Mining. IEEE Rev. Iberoam. Tecnol. Aprendiz. 2015, 10, 119–125. [Google Scholar] [CrossRef]
  4. Bahasoan, A.N.; Ayuandiani, W.; Mukhram, M. Aswar Rahmat Effectiveness of Online Learning In Pandemic Covid-19. Int. J. Sci. Technol. Manag. 2020, 1, 100–106. [Google Scholar] [CrossRef]
  5. Cohen, J. Parents as Educational Models and Definers. J. Marriage Fam. 2016, 49, 339–351. [Google Scholar] [CrossRef]
  6. Hodges, C.B. Suggestions for the design of e-learning environments to enhance learner self-efficacy. IADIS Int. Conf. Cogn. Explor. Learn. Digit. Age CELDA 2013, 2013, 10–16. [Google Scholar]
  7. Horton, J. Identifying At-Risk Factors That Affect College Student Success. Int. J. Process Educ. 2015, 7, 83–102. [Google Scholar]
  8. Sidpra, J.; Gaier, C.; Reddy, N.; Kumar, N.; Mirsky, D.; Mankad, K. Sustaining education in the age of COVID-19: A survey of synchronous web-based platforms. Quant. Imaging Med. Surg. 2020, 10, 1422–1427. [Google Scholar] [CrossRef]
  9. Li, H.; Liu, S.-M.; Yu, X.-H.; Tang, S.-L.; Tang, C.-K. Coronavirus disease 2019 (COVID-19): Current status and future perspectives. Int. J. Antimicrob. Agents 2020, 55, 105951. [Google Scholar] [CrossRef]
  10. Green, J.K.; Burrow, M.S.; Carvalho, L. Designing for Transition: Supporting Teachers and Students Cope with Emergency Remote Education. Postdigital Sci. Educ. 2020, 2, 906–922. [Google Scholar] [CrossRef]
  11. Stroeva, O.; Zviagintceva, Y.; Tokmakova, E.; Petrukhina, E.; Polyakova, O. Application of remote technologies in education. Int. J. Educ. Manag. 2019, 33, 503–510. [Google Scholar] [CrossRef]
  12. Hernandez-Ortega, J.; Daza, R.; Morales, A.; Fierrez, J.; Ortega-Garcia, J. edBB: Biometrics and behavior for assessing remote education. arXiv 2019, arXiv:1912.04786. [Google Scholar]
  13. Picciano, A.G. The Evolution of Big Data and Learning Analytics in American Higher Education. J. Asynchronous Learn. Netw. 2012, 16, 9–20. [Google Scholar] [CrossRef] [Green Version]
  14. Lichtenstein, S.; Nguyen, L.; Hunter, A. Issues in IT Service-Oriented Requirements Engineering. Australas. J. Inf. Syst. 2005, 13, 176–191. [Google Scholar] [CrossRef] [Green Version]
  15. AlQurashi, E. Self-Efficacy In Online Learning Environments: A Literature Review. Contemp. Issues Educ. Res. (CIER) 2016, 9, 45–52. [Google Scholar] [CrossRef]
  16. Rios-Campos, C.; Campos, P.R.; Delgado, F.C.; Ramírez, I.M.; Hubeck, J.A.; Fernández, C.J.; Vega, Y.C.; Méndez, M.C. Covid-19 and Universities in Latin America. South Fla. J. Dev. 2021, 2, 577–585. [Google Scholar] [CrossRef]
  17. Quispe-Prieto, S.; Cavalcanti-Bandos, M.F.; Caipa-Ramos, M.; Paucar-Caceres, A.; Rojas-Jiménez, H.H. A Systemic Framework to Evaluate Student Satisfaction in Latin American Universities under the COVID-19 Pandemic. Systems 2021, 9, 15. [Google Scholar] [CrossRef]
  18. Sokkhey, P.; Okazaki, T. Hybrid Machine Learning Algorithms for Predicting Academic Performance. Int. J. Adv. Comput. Sci. Appl. 2020, 11, 32–41. [Google Scholar] [CrossRef] [Green Version]
  19. Rivas, A.; González-Briones, A.; Hernández, G.; Prieto, J.; Chamoso, P. Artificial neural network analysis of the academic performance of students in virtual learning environments. Neurocomputing 2021, 423, 713–720. [Google Scholar] [CrossRef]
  20. Hellas, A.; Ihantola, P.; Petersen, A.; Ajanovski, V.V.; Gutica, M.; Hynninen, T.; Knutas, A.; Leinonen, J.; Messom, C.; Liao, S.N. Predicting academic performance: A systematic literature review. In Proceedings Companion of the 23rd Annual ACM Conference on Innovation and Technology in Computer Science Education, Larnaca, Cyprus, 2–4 July 2018; pp. 175–199. [Google Scholar] [CrossRef] [Green Version]
  21. Osmanbegovic, E.; Suljic, M. Data mining approach for predicting student performance. J. Econ. Bus. 2012, 10, 3–12. [Google Scholar]
  22. Haihao, L.; Rahul, M. Randomized Gradient Boosting Machine. SIAM J. Optim. 2018, 30, 2780–2808. [Google Scholar]
  23. Tchoubar, T.; Sexton, T.R.; Scarlatos, L.L. Role of Digital Fluency and Spatial Ability in Student Experience of Online Learning Environments. Intell. Comput. 2019, 1, 251–264. [Google Scholar] [CrossRef]
  24. Xu, A.; Liu, Z.; Guo, Y.; Sinha, V.; Akkiraju, R. A New Chatbot for Customer Service on Social Media. In Proceedings of the 2017 CHI Conference on Human Factors in Computing Systems, Denver, CO, USA, 6–11 May 2017; pp. 3506–3510. [Google Scholar]
  25. Chen, C. Personalized E-learning system with self-regulated learning assisted mechanisms for promoting learning performance. Expert Syst. Appl. 2009, 36, 8816–8829. [Google Scholar] [CrossRef]
  26. Medhat, W.; Hassan, A.; Korashy, H. Sentiment analysis algorithms and applications: A survey. Ain Shams Eng. J. 2014, 5, 1093–1113. [Google Scholar] [CrossRef] [Green Version]
  27. Gorham, J.; Zakahi, W.R. A comparison of teacher and student perceptions of immediacy and learning: Monitoring process and product. Commun. Educ. 1990, 39, 354–368. [Google Scholar] [CrossRef]
  28. Hasan, R.; Palaniappan, S.; Raziff, A.R.A.; Mahmood, S.; Sarker, K.U. Student Academic Performance Prediction by using Decision Tree Algorithm. In Proceedings of the 2018 4th International Conference on Computer and Information Sciences (ICCOINS), Jalandhar, India, 30–31 August 2018; pp. 1–5. [Google Scholar]
  29. Daniel, S.J. Education and the COVID-19 pandemic. Prospects 2020, 49, 91–96. [Google Scholar] [CrossRef] [PubMed] [Green Version]
  30. Humanante-Ramos, P.; García-Peñalvo, F.J.; Conde-González, M. Entornos personales de aprendizaje móvil: Una revisión sistemática de la literatura. RIED. Rev. Iberoam. Educ. Distancia 2017, 20, 73–92. [Google Scholar] [CrossRef] [Green Version]
  31. Zhou, L.; Wu, S.; Zhou, M.; Li, F. ’School’s Out, But Class’ On’, The Largest Online Education in the World Today: Taking China’s Practical Exploration During The COVID-19 Epidemic Prevention and Control As an Example. SSRN Electron. J. 2020, 4, 501–509. [Google Scholar] [CrossRef]
  32. Reinoso, G.G.L.; Barzola, K.M.; Caguana, D.M.; Lopez, R.P.; Lopez, J.C.P. M-learning, a path to ubiquitous learning in higher education in Ecuador. RISTI-Rev. Iber. Sist. Tecnol. Inf. 2019, 2019, 47–59. [Google Scholar]
  33. Huang, Y.-M.; Liang, T.-H.; Su, Y.-N.; Chen, N.-S. Empowering personalized learning with an interactive e-book learning system for elementary school students. Educ. Technol. Res. Dev. 2012, 60, 703–722. [Google Scholar] [CrossRef]
  34. Casañ, G.A.; Cervera, E.; Moughlbay, A.A.; Alemany, J.; Martinet, P. ROS-based online robot programming for remote education and training. In Proceedings of the 2015 IEEE International Conference on Robotics and Automation (ICRA), Seattle, WA, USA, 26–30 May 2015; IEEE: New York, NY, USA; Volume 2015-June, pp. 6101–6106. [Google Scholar]
  35. Lopatovska, I.; Williams, H. Personification of the amazon alexa: BFF or a mindless companion? In Proceedings of the 2018 conference on Human Information Interaction & Retrieval, New Brunswick, NJ, USA, 11–15 March 2018; pp. 265–268. [Google Scholar]
  36. Villegas-Ch, W.; Arias-Navarrete, A.; Palacios-Pacheco, X. Proposal of an Architecture for the Integration of a Chatbot with Artificial Intelligence in a Smart Campus for the Improvement of Learning. Sustainability 2020, 12, 1500. [Google Scholar] [CrossRef] [Green Version]
  37. Soh, J.; Singh, P. Introduction to Azure Machine Learning. In Data Science Solutions on Azure; Soh, J., Singh, P., Eds.; In Professional and Applied Computing; Apress: Berkeley, CA, USA, 2020; pp. 117–148. ISBN 978-1-4842-6405-8. [Google Scholar]
  38. Duriqi, R.; Raca, V.; Cico, B. Comparative analysis of classification algorithms on three different datasets using WEKA. In Proceedings of the 2016 5th Mediterranean Conference on Embedded Computing (MECO), Bar, Montenegro, 12–16 June 2016; pp. 335–338. [Google Scholar]
  39. Xiao, J.; Wang, M.; Jiang, B.; Li, J. A personalized recommendation system with combinational algorithm for online learning. J. Ambient. Intell. Humaniz. Comput. 2018, 9, 667–677. [Google Scholar] [CrossRef]
  40. Gramegna, A.; Giudici, P. Why to Buy Insurance? An Explainable Artificial Intelligence Approach. Risks 2020, 8, 137. [Google Scholar] [CrossRef]
  41. Bhalerao, S.; Kadam, P. Sample size calculation. Int. J. Ayurveda Res. 2010, 1, 55–57. [Google Scholar] [CrossRef] [PubMed] [Green Version]
  42. Gogtay, N.J.; Thatte, U.M. Principles of Correlation Analysis. J. Assoc. Physicians India 2017, 65, 78–81. [Google Scholar]
  43. Holmes, G.; Donkin, A.; Witten, I.H. WEKA: A machine learning workbench. In Proceedings of the Australian and New Zealand Conference on Intelligent Information Systems–Proceedings, Brisbane, Australia, 29 November–2 December 1994; pp. 357–361. [Google Scholar]
  44. Watson, J. Blending Learning: The Convergence of Online and Face-to-Face Education. Anal. Chim. Acta 2006, 572, 113–120. [Google Scholar]
  45. Wang, T.-H. Developing an assessment-centered e-Learning system for improving student learning effectiveness. Comput. Educ. 2014, 73, 189–203. [Google Scholar] [CrossRef]
  46. Hill, J.R.; Hannafin, M.J. Teaching and learning in digital environments: The resurgence of resource-based learning. Educ. Technol. Res. Dev. 2001, 49, 37–52. [Google Scholar] [CrossRef]
Figure 1. Methodology of a model for the identification of academic performance.
Electronics 10 01192 g001
Figure 2. This figure presents the data obtained from the analysis of the data by the algorithm J48. (a) Tree generated by in the processing of learning in relation to economic problems; (b) description of correct and incorrect classification instances and error values.
Electronics 10 01192 g002
Figure 3. Visualization of analysis results between learning in relation to financial problems.
Electronics 10 01192 g003
Figure 4. Summary of the values obtained in the instances of correct and incorrect classification and the details of values by class.
Electronics 10 01192 g004
Table 1. Structure of attributes assigned to the generated analysis in the classifier.
AttributesType of Data
Students (a)Numeric
Income level (b)Text -Numeric
Frequency in the study (c)Numeric
Frequency in academic activities (d)Numeric
Frequency at work (e) Numeric
Environment (f)Numeric
Family atmosphere (g) Numeric
Educational resources (h) Numeric
Interaction (i)Numeric
Schedules (j)Numeric
Padagogy (k)Numeric
Academic average (l)Numeric
Approves (m)Text
Learning (n)Text
Dependent variable (o)Numeric
Table 2. Data table with the correlation between independent variables and the dependent variable.
ABB-1CDEFGHIJKLMNO
1Low13530332151FalseE1
2Medium24443221034FalseC3
3High34150305218TrueA5
4High31533400510FalseE1
5Medium21445241127TrueB4
6Medium21421551546TrueB4
7High35402344158TrueA5
8Medium24055450145FalseC3
9High30421125212FalseD2
10Low14132514302FalseD2
11Low10430030310FalseE1
12Low14503313521FalseE1
13Medium20221051110FalseE1
14High33145001556TrueB4
15High334223352410TrueA5
16Medium23251120400FalseE1
17Low14434432325FalseC3
18High35535213528TrueA5
19Medium25140052139TrueA5
20Low13225412349TrueA5
21Medium20225451134FalseC3
22Medium32234351224FalseC3
23High22415423348TrueA5
24Medium11255143121FalseE1
25Low11154154553FalseD2
26Low11334432511FalseE1
27Low24143233214FalseC3
28Medium25312223211FalseE1
29Medium31224113446TrueB4
30High32311521345FalseC3
31High34445514156TrueB4
32High11233525312FalseD2
33Low35543355229TrueA5
34High11425452443FalseD2
35Low12251352334FalseC3
36Low22551325227TrueB4
37Medium34533121537TrueB4
38High35145315428TrueA5
39High35113455358TrueA5
40High35543314223FalseD2
41High22241245111FalseE1
42Medium21242222321FalseE1
43Medium25525123556TrueB4
44Medium21311341323FalseD2
45Medium11525514335FalseC3
46Low35341135458TrueA5
47High21512552231FalseE1
48Medium12321342252FalseD2
49Low21444542233FalseD2
50Medium24454552313FalseD2
51Medium21112345337TrueB4
52Medium11313135415FalseC3
53Low35354241212FalseD2
54High31252152231FalseE1
55High323415552410TrueA5
56High34145541251FalseE1
Corr_coef 0.400.41−0.02−0.070.130.04−0.100.400.060.400.98
Table 3. Database for the generation of the .arff file with the factors that have the greatest impact on academic performance.
ABCIKLN
1Low3251E
2Medium4134C
3High4518A
4High1010E
5Medium1127B
6Medium1146B
7High5458A
8Medium4045C
9High0512D
10Low4402D
11Low0010E
12Low4321E
13Medium0110E
14High3156B
15High35410A
16Medium3000E
17Low4225C
18High5328A
19Medium5239A
20Low3249A
21Medium0134C
22Medium2124C
23High2348A
24Medium1321E
25Low1453D
26Low1211E
27Low4314C
28Medium5311E
29Medium1346B
30High2145C
31High4456B
32High1512D
33Low5529A
34High1243D
35Low2234C
36Low2527B
37Medium4137B
38High5528A
39High5558A
40High5423D
41High2511E
42Medium1221E
43Medium5356B
44Medium1123D
45Medium1435C
46Low5558A
47High1231E
48Medium2252D
49Low1233D
50Medium4213D
51Medium1537B
52Medium1515C
53Low5112D
54High1231E
55High25410A
56High4151E
Corr_coef0.400.410.400.400.98
Publisher’s Note: MDPI stays neutral with regard to jurisdictional claims in published maps and institutional affiliations.

