Abstract
Recommending quizzes in e-Learning systems always represents a challenging task, as the quality of recommendations may have a high impact on the student’s progress. We propose a data analysis workflow based on building multiple stacks of models that use information from former students’ taken quizzes. The current implementation uses the RandomForest algorithm for building the models on a real-world dataset that has been obtained in a controlled environment. As preprocessing techniques, we have used normalization and discretization such that training data have been used for classification and regression tasks. At run-time, the models are queried for classifying the student and inferring an optimal quiz that is personalized for the student. We have evaluated the accuracy parametrized on the previous number of quizzes and found that a possible optimal timeframe for each class of students should be used and may provide more helpful quizzes.
1. Introduction
This paper is strongly related to the educational data mining research area and presents an approach to exploring how predicting students’ performance changes over the semester. The research area of educational data mining became more and more significant as the e-Learning platforms became more popular for both distance learning programs and face-to-face education. In most cases in which a learning management system is involved, the student’s progress can be monitored and logged over the whole semester, offering plenty of data to analyse. The performed data analysis on logged data can be used to trigger early alarms regarding a possible failure or reveal the student’s learning progress. In most cases, the data are logged during a specific period (i.e., a semester) and then used in a machine learning process to address a particular task. Using e-Learning platforms and student logs in any education brings more knowledge and means of understanding regarding the students’ performance and how well they understand the courses. Of course, things are more straightforward in face-to-face education, and in distance learning, the input of machine learning algorithms can be more critical. Still, we can bring improvements and means for better student understanding in these two cases.
The proposed approach tackles the problem of finding the optimum moment to launch the classification process based on the data we can log from our e-Learning platform. The designed data analysis pipeline is generic and can be used on data provided by other e-Learning platforms. The environment used for experiments and data logging is Tesys [1], an e-Learning platform that was custom developed at the University of Craiova and designed to fulfil all the requirements for distance learning education. This platform offers functionalities such as adding courses and course chapters, setting up homework and quizzes, and several means of communication between users. The roles that are implemented in Tesys are student, professor, secretary and admin. Among the other functionalities implemented in Tesys, we have the exam-taking capabilities and the testing capabilities that can be set up for any course by the assigned professors. The quizzes can be correlated with the course chapter allowing students to take them based on questions relevant to each chapter so the quizzes can be chronologically taken. One of the main caveats in educational data mining is that, in many cases, we build models based on the actions collected from the previous year or even different years of study than the students on which we want to use the models. This approach may work in many cases, especially if the students from the current year are similar to the ones from the previous year, but this is not the case all the time. Furthermore, the similarity of cohorts of students from different generations (even consecutive ones) is very difficult to estimate or demonstrate and may not happen in real-life scenarios. Another issue is that in most cases, we need to wait to finish the final exam before we build the model or at least take all the actions necessary to build the proposed model, which makes the prediction very late.
The research issue we address in this paper refers to exploring which predictive machine learning model trained at a specific time will provide the optimum result using a stack of models built on the data collected during the tests taken across the semester. In our case, we define the optimum result as the earliest checkpoint in which we can obtain a result good enough to predict the student’s outcome or failure. Finding the earliest moment for predicting the final result is valuable for both e-learning and face-to-face education because it offers more time for students and professors to overcome a bad final grade.
The proposed approach can allow us to build a timeline for tests. This timeline allows us to create custom recommender systems and perform further analysis to predict the final results accurately. Regarding the experimental results, plenty of models can be used to predict the outcome based on our logged data as we can easily slice them at several checkpoints regarding the quizzes taken during the semester. Our aim in this situation is to find the proper checkpoint to build the model that predicts the final result with the best accuracy and as early as possible because both of these ingredients are important. Based on this approach, we will consider making an accurate model, but there are not so many opportunities to improve the situation very late in the semester. On the other hand, if we build a model too early without offering factual accuracy, it can predict false results. Over time the system can lose trust.
Another research issue that we usually tackle when dealing with educational data is that students differ from one year to the following year, making the past results and models irrelevant to the actual ones. Many external factors influence the motivation, knowledge and performance of the current year of study and these factors translate into differences between models. In this paper, we try to overcome the differences between years by building a system that can self-adjust as students take quizzes and does not depend on the final result because if we relate everything to the final result, which is the most relevant, we will lose the time available between the last quiz and the final exam. This period is valuable as it can be used for providing recommendations and support for improving learning performance and avoiding failure.
Section 2 of the paper presents specific related work that addresses the problem of dealing with multiple models and we offer several approaches and tools that address this issue in various contexts. Section 3 presents the system design and research context and the data analysis work. Section 4 presents the experimental results that were performed on a real-world dataset. Finally, the paper ends with a section giving conclusions and future works.
2. Related Work
The problem of building and analysing several machine learning models has been addressed in [2]. Still, the approach is classical in that it tries to improve the machine learning model’s accuracy by exploring different algorithms with different types of parameter tuning. Used algorithms are classical ones (i.e., J48 decision tree, support vector machines, random forest, rotation forest) and artificial neural networks. The study results were based on and influenced by different factors such as the number of schools in a specific region, enrolment, school locations, teachers, and availability of necessary facilities that contribute to learning performance. Their results showed that artificial neural networks outperformed other models and achieved an accuracy of 82.9% when the relief-F based feature selection method was used.
Building and using multiple models has also been addressed in [3] by trying to answer questions such as “Which models were built using incorrect features?” or “Which model performed best on American customers?” or “How did the two top models compare?”. The result consists of the later developed ModelDB [4] application which is a novel end-to-end system for the management of machine learning models. Their approach focuses on tracking machine learning models rather than finding the best moment to build a model based on a specific context, but this is impossible in all cases.
Regarding applications of using machine learning models, we mention early prediction of a student’s performance or dropout [5], which has an accuracy of 85–90% by using different subsets of student-related attributes in every time point. Each subset is used for building up a model for later use.
The same issue of predicting dropout early is addressed in [6] by using the interaction logs from an online learning environment as input data. The task has been modelled as a sequence labelling or time series prediction problem. From this perspective, the proposed approach is similar to our practice in this paper. We define quizzes that are taken over time and try to determine the model (from a pool of models) that has the best accuracy for the tackled task. The proposed models in [6] are Logistic Regression by adding a regularisation term and the Input-Output Hidden Markov Model (IOHMM). Results show an accuracy of 84% compared to the baseline of Machine Learning Models to predict the students at risk of dropping out.
Regarding the blended learning environment, another approach was applied in [7] using principal component regression to predict the student’s final result. Their experiments show that the student’s final grade could be expected when only one-third of the semester had elapsed, which is close to our approach as we can predict it when only five weeks out of fourteen passed.
Another approach for the early prediction of a student’s performance is presented in [8] which uses deep learning techniques (LSTM -long short-term memory more exactly) on time series built based on a student’s behaviour. To understand the potential of the deep learning techniques for this scenario, the authors compared LSTM networks with eight conventional machine-learning classifiers in terms of the prediction performance as measured by the area under the ROC (receiver operating characteristic) curve (AUC) scores. Their results revealed that using the deep learning techniques and time-series information about click frequencies successfully provided early detection of at-risk students with moderate prediction accuracy. They also found that the deep learning approach showed higher prediction performance and stronger generalizability than their explored machine learning classifiers.
Other early student prediction systems can be considered when building such a system; some of them try to predict academic success based on enrolment data as presented in [9]. The approach presented in cites kovacic2010early uses classification and regression trees with an accuracy of 60.5% to estimate the student’s success. Still, this approach uses more data about the students, making the system relevant only for the scenarios in which these data are available. The method hardly adapts from one year to another, building a rather general and robust design.
Comparing students’ final performance by using predictive models has also been addressed in [10]. The setup consisted of a blended course and generic features for which data have been logged during six weeks of the semester. The experimental results show that SVMs outperform other models in their context.
Still, in this area of early prediction, there are many deep learning/neural network approaches [11]. The highest accuracy for predicting finals’ outcomes for a single course is 91.07% with an ROC_AUC score of 0.88, while for midterm outcomes, the highest is 80.36% accuracy with an ROC_AUC score of 0.70.
The usage of neural network models for the early identification of students likely to fail has been addressed in [12] in a blended learning context. The results show that 25% of the failing students were correctly identified after the first quiz submission. After the mid-term examination, 65% of the failing students were correctly predicted. Compared to this approach, ours tries to simplify and produce an easily reproducible system that can be easily used in any learning environment that uses an e-Learning platform as the immediate environment or as just an add-on for learning resource management.
The usage of many trained models has been addressed by [13] in a distributed context. The proposed architectural approach involves setting up a dynamic set of backup workers and a custom-designed consensus algorithm showing linear speedup for experiments’ convergence. The experimental results are obtained on classical MNIST and CIFAR-10 datasets such that the proposed approach may be further tested on datasets from other application domains.
The problems of automatic GPU allocation, training status visualisation, handling model parameter snapshots, and comparison of performance metrics between models represent a task that has been addressed in [14]. The problem’s difficulty arises from the fact that researchers are constantly managing a pool of models. Therefore they have to tackle the issues of resource and data management or tracking the experiments during training. The proposed solution consists of a containerised system with a GUI for better interpretation and explanation of the results.
Leveraging a pool of Bayesian Optimisation models for finding the near-optimal parameter setting faster than the state-of-the-art approaches has been addressed in [15]. The key ingredients of the proposed approach regard parallelisation and auto-tuning by interaction with multiple models, handling categorical parameters and more.
In the area of application development, [16] proposes the What-If tool that may be used to probe, visualise, and analyse ML systems with minimal coding. The comparison of two or more models is among the most exciting features and allows direct and unambiguous evidence regarding the performance measures and visualisations of multiple models built. The tool enables the manual and automatic identification of counterfactual examples and provides capabilities for assessing and optimising validation metrics.
3. System Design
3.1. Context of Research
Our system is based on the data collected from the Data Structures and Algorithms course, collected during the whole semester. The students took ten quizzes which were listed chronologically at several checkpoints, so in our case, all the students that participated in the course and took quizzes for the test “n” at around the same time (2–3 days sooner or later as our platform allows us to do so and we wanted to provide flexibility). In our scenario, a group of 102 students participated, and the quizzes were from the Data Structures and Algorithms course and, more precisely, related to the graphs section. The reason for choosing ten quizzes was that the semester takes 14 weeks, and if they take one quiz per week, there will be enough time to recover the missing knowledge until they sit the final exam.
We had to wait until the semester ended, and the students took the final evaluation to validate the models, so we had a good class in our dataset. After obtaining the final grade, we tried to model our data to achieve a robust final result prediction. We had two options: model it as a regression problem or a classification problem. The regression could estimate the final grade, but this approach may not be considered because the grades distribution is not always relevant from one year of study to another, even if it is the same course and difficulty level. These variations may come from factors such as the COVID-19 pandemic or changing the admission to a faculty exam, independent of the course difficulty. Even a course and quiz difficulty adjustment based on the previous year of study may not be relevant for the next year, so we had to create a method that automatically adjusts to the current overall situation and can trigger a robust response. On the other hand, classification can provide a more robust and relevant approach. Still, the predicted label will differ from the regression approach having a small number of classes (one for each grade, or even binary classification resumed at the pass or fail) and a different type of data. Another difference between discretizing into categories and using regression in this problem is the variety of algorithms available, which can make a performance difference in many cases.
3.2. Data Analysis Workflow
The prepossessing dataset started from the necessity of having a relevant grade for the actual year of study, so we took the quizzes from each student and computed an average grade for them. Then we tried to normalize the values between 0 and 1 to have a significant scale in which 1 was the best student and 0 was the one with the lowest score; this way, we could have a good ranking among the students, thus, we could compare them. At this step, having continuous values between 0 and 1, the modelling approach for this situation was a regression problem that was not offering good and potentially not even relevant results because the result of such a model will involve a data analyst for a good understanding. We aimed to provide a tool that can offer a robust and precise result. Going further with data preprocessing, we considered discretizing the continuous values into three intervals: LOW from 0 to 0.32, AVERAGE from 0.33 to 0.66 and HIGH from 0.67 to 1. This approach provided pretty good accuracy, as will be presented in the results section with a strong meaning of the results as students classified as LOW would need more attention being at risk of failure in the final exam, students classified as AVERAGE should be further analyzed and maybe some recommendations could be made. HIGH students are doing good and most likely will not have any problems with the final result.
Figure 1 represents the central architecture of the system, which was built based on the quizzes taken in Tesys e-Learning system. The flow starts from the quizzes taken by the students, and based on their results stored in the database; we can create six primary datasets that consist of examinations from 1 to n, where n starts from 5 to 10. After we build the datasets, we perform a data selection which means we produce a more significant number of datasets that can be used for model training. In Figure 1 we detail the models computed using the datasets extracted from Dataset 6, but the same procedure is applied for each of the primary datasets. The main datasets (calculated directly from the database) will have different classes/labels. For each dataset, we compute the label as presented above (based on the grades obtained and the number of quizzes taken into consideration); then, for each primary dataset, we create several datasets equal to the number of quizzes starting from “n” quizzes then going back one step. For example, for a dataset based on five quizzes, we will have a dataset with five quizzes, then four quizzes, and so on until the last quiz is taken and the label is in it. For this scenario, we will have 45 datasets, each of them validating a different checkpoint (e.g., number of quizzes).
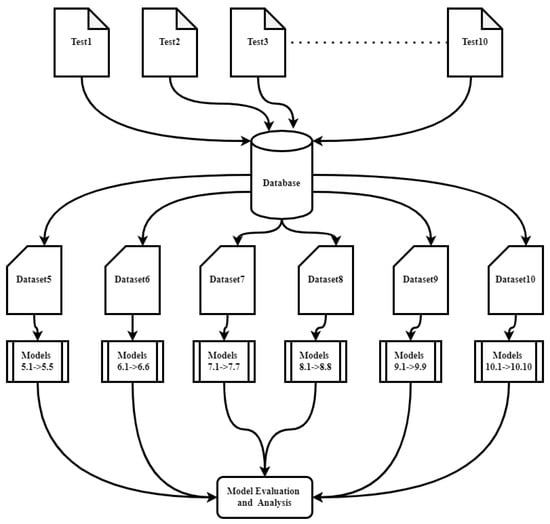
Figure 1.
The system’s pipeline.
In Figure 2 we define the quizzes and how the primary datasets are constructed depending on the number of quizzes taken by the students. On the OX axis, we have the quizzes taken (from 1 to 10), and we consider constructing the datasets starting from five quizzes and going to ten. On OX, we have the datasets in descending order beginning with those that can be generated using ten quizzes (datasets from 1 to 10). Then, as we go up on OY, we have fewer examinations that can be constructed. These datasets are significant in our system’s design because we can build our stack of models based on them. So for datasets D1, …, 10, we will have ten corresponding models with the same label but with different features.
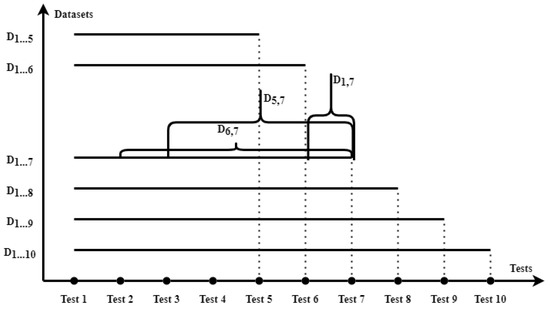
Figure 2.
Dataset computation.
To further clarify the approach described above and presented at a higher level in Figure 2, we add Figure 3, which details datasets created based on seven quizzes from Figure 2. Here, in Figure 3, we have the models built for seven quizzes taken starting from M1, which is created using all the quizzes and M7, which uses only the last quiz and the label. As we can see in Figure 3, we eliminate a test successively from the beginning (we prefer this approach because the latest quizzes may be more relevant for the final grade than the first ones). After each step, we produce a new model which can be evaluated.
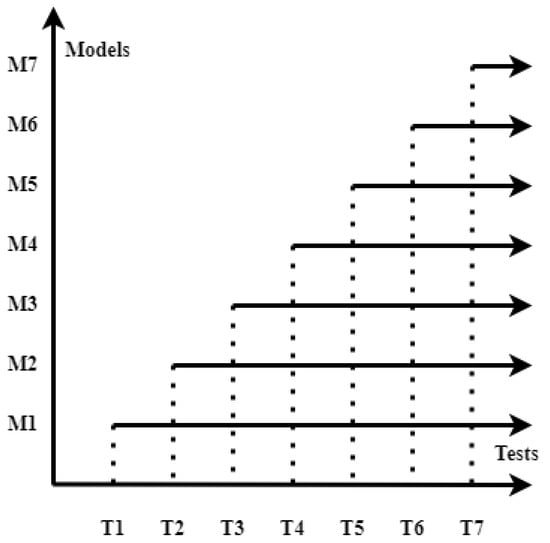
Figure 3.
Models built for 10 quizzes.
4. Experimental Results
Before going into the results and analysing them, a short example of the dataset is presented in Figure 4 which was built for the ten quizzes baseline. Based on the dataset, eliminating the quizzes recursively starting from T1, we obtain the rest of the datasets that can be built for a maximum of ten quizzes. In this case, AVGDN is the average grade discretised and normalised, computed as described in the previous section. For result replication, all the code and extracted datasets are publicly available in MultipleModelsAnalysis repository (Multiple Models Analysis, https://github.com/PPStef/MultipleModelsAnalysis.git (accessed on 24 March 2022)).
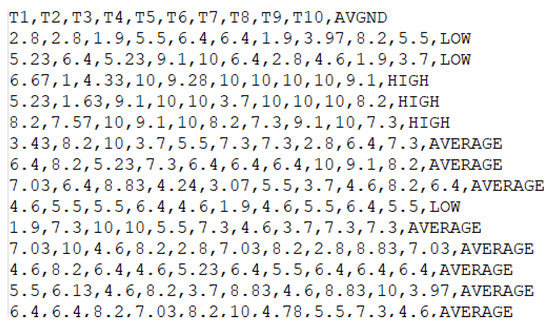
Figure 4.
Dataset snippet.
For the accuracy presented in the results below, we chose the Random Forest algorithm from the “sklearn” package using a small number of estimators (only 10) and a max depth of three, which allowed us to create very robust and generic models. The motivation for building such a model and this parameters configuration was that our focus is on exploring the results that vary in different models and finding the sweet spot for building the model. Using a standard algorithm without hyper-parameters tuning can bring more general results. The results can be easily reproduced with similar accuracy values in other contexts using the data collected from other e-Learning systems.
Figure 5 concentrates all the results based on our stacked models and datasets in a manner that allows us to observe the trends and system’s evolution. We define “ModelsBased5” as the green line representing the evolution of the models based on a maximum number of five quizzes taken, “ModelsBased6” as the dark blue line which uses the following number of quizzes and so on. An interesting comparison can be made between these two sets of models because adding just one more quiz (in this case, quiz number 6) influences the whole trend analysis producing a drop at quiz two and a short descent at the end of the trend for “ModelsBased6” and this is because adding just one quiz influences both the final label and every model created as we include quiz six in each of them. This also explains the necessity of eliminating quizzes from first to last and not from the last to the first one and creating more variate models. Going further with the trend analysis presented in Figure 4, we can see that each set of models has a different trend evolution obtaining an optimum accuracy at a different number of quizzes but mainly close to the maximum that could be used.
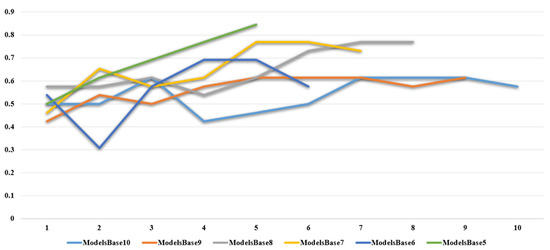
Figure 5.
Models’ accuracy comparison.
For better observation and analysis, we add Figure 6 which presents the accuracy values for the model. On the first line, we have the model that uses ten quizzes; on the second, the model uses nine quizzes until we reach only five quizzes. On each column, we have the number of quizzes used for building the model, so on the T1 column, we have the accuracy of the model constructed only with the last quiz, which for the first line is quiz number ten, for the second line is quiz number nine and so on. Analysing the accuracy values, we see that the number of tests used in the model increases the accuracy and increases achieving values around 80%. We can also observe that we get the best accuracy close to the maximum number of tests for each testing scenario, and we need at least five tests to obtain good accuracy. The accuracy interpretation should be made considering the usage of the Random Forest algorithm from the SciKitLearn package with the standard set of tuning parameters, and a better accuracy could be achieved. One conclusion which can be seen in any of the used scenarios is that we need at least four weeks in order to get a good accuracy and regarding the number of tests we obtain good results in the second half. The motivation for not adjusting the algorithm for better accuracy was that we needed a generic model that could replicate the results quickly in other contexts. Our main aim was to analyse the models’ evolution, not tune for a few more percentages regarding the accuracy value.
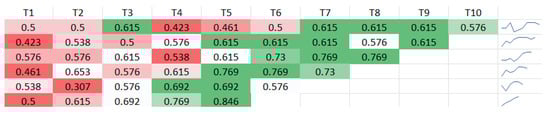
Figure 6.
Models’ performance evolution.
5. Conclusions
This paper presented a study and analysed how successively building models can help predict a student’s failure or success. This approach focuses on finding how to build the model to obtain the best results rather than standard approaches that evaluate which is the best algorithm for accomplishing the task. Based on the quiz set we collected, the results show that we can build our model two or three weeks earlier and obtain good accuracy. This accuracy should be interpreted according to the labels defined in the datasets, which represents the final grade which is discretised in three values and is relevant for this kind of scenario.
We evaluate our system for six scenarios designed to fit most situations where a learning scenario can be through the semester. This approach makes the results relevant for more cases and increases the results’ trust and reliability. Another benefit of this approach is that it makes it more useful as it can be used early enough to trigger alarms.
In future work, we plan to extend our models to more disciplines and years of study to evaluate if there are any differences and if we can adjust our system to fit them better. At this moment, our results look promising but they are relevant for our context so we need to extend our study in order to evaluate how general they are. The second direction for system improvement is the evaluation of other classical or deep learning algorithms that can improve the results. However, deep learning approaches need a more extensive dataset which is not currently available. In this paper, as we mentioned before, the focus was on evaluating the models with one general classifier. The usage of deep learning algorithms can also be mentioned in this direction of future work because by using them, we can obtain both reliable and accurate results. Still, this scenario may imply a distributed system because we need to use a significant amount of computing power to train many models. Finally, a speedup of the process may be investigated by building the pool models in parallel or distributed and then efficiently querying the appropriate model. Evaluation of the effectiveness of recommended quizzes for the student in terms of relevance represents the final goal of the system.
Author Contributions
Conceptualization, M.C.M.; methodology, M.C.M.; software, P.Ş.P.; formal analysis, M.L.M.; data curation, P.Ş.P.; writing—original draft preparation, M.L.M.; writing—review and editing, M.L.M. All authors have read and agreed to the published version of the manuscript.
Funding
This work was partially supported by the grant 135C/ 2021 “Development of software applications that integrate machine learning algorithms”, financed by the University of Craiova.
Institutional Review Board Statement
Not applicable.
Informed Consent Statement
Not applicable.
Data Availability Statement
The data and code are publicly available in https://github.com/PPStef/MultipleModelsAnalysis.git (accessed on 24 March 2022).
Conflicts of Interest
The authors declare no conflict of interest.
References
- Burdescu, D.D.; Mihaescu, M.C. TESYS: E-Learning Application Built on a Web Platform; ICE-B; INSTICC Press: Setúbal, Portugal, 2006; pp. 315–318. [Google Scholar]
- Alam, T.M.; Mushtaq, M.; Shaukat, K.; Hameed, I.A.; Sarwar, M.U.; Luo, S. A Novel Method for Performance Measurement of Public Educational Institutions Using Machine Learning Models. Appl. Sci. 2021, 11, 9296. [Google Scholar] [CrossRef]
- Vartak, M.; Subramanyam, H.; Lee, W.E.; Viswanathan, S.; Husnoo, S.; Madden, S.; Zaharia, M. ModelDB: A system for machine learning model management. In Proceedings of the Workshop on Human-In-the-Loop Data Analytics, San Francisco, CA, USA, 26 June–1 July 2016; pp. 1–3. [Google Scholar]
- Vartak, M.; Madden, S. Modeldb: Opportunities and challenges in managing machine learning models. IEEE Data Eng. Bull. 2018, 41, 16–25. [Google Scholar]
- Alcaraz, R.; Martinez-Rodrigo, A.; Zangroniz, R.; Rieta, J.J. Early Prediction of Students at Risk of Failing a Face-to-Face Course in Power Electronic Systems. IEEE Trans. Learn. Technol. 2021, 14, 590–603. [Google Scholar] [CrossRef]
- Mubarak, A.A.; Cao, H.; Zhang, W. Prediction of students’ early dropout based on their interaction logs in online learning environment. Interact. Learn. Environ. 2020, 1–20. [Google Scholar] [CrossRef]
- Lu, O.H.; Huang, A.Y.; Huang, J.C.; Lin, A.J.; Ogata, H.; Yang, S.J. Applying learning analytics for the early prediction of Students’ academic performance in blended learning. J. Educ. Technol. Soc. 2018, 21, 220–232. [Google Scholar]
- Chen, F.; Cui, Y. Utilizing Student Time Series Behaviour in Learning Management Systems for Early Prediction of Course Performance. J. Learn. Anal. 2020, 7, 1–17. [Google Scholar] [CrossRef]
- Kovacic, Z. Early Prediction of Student Success: Mining Students’ Enrolment Data. In Proceedings of the Informing Science + IT Education Conference, Cassino, Italy, 19–24 June 2010. [Google Scholar]
- Li, H.; Lynch, C.F.; Barnes, T. Early prediction of course grades: Models and feature selection. arXiv 2018, arXiv:1812.00843. [Google Scholar]
- Raga, R.C.; Raga, J.D. Early prediction of student performance in blended learning courses using deep neural networks. In Proceedings of the 2019 International Symposium on Educational Technology (ISET), Hradec Králové, Czech Republic, 2–4 July 2019; pp. 39–43. [Google Scholar]
- Sukhbaatar, O.; Usagawa, T.; Choimaa, L. An artificial neural network based early prediction of failure-prone students in blended learning course. Int. J. Emerg. Technol. Learn. (IJET) 2019, 14, 77–92. [Google Scholar] [CrossRef]
- Xiong, G.; Yan, G.; Singh, R.; Li, J. Straggler-Resilient Distributed Machine Learning with Dynamic Backup Workers. arXiv 2021, arXiv:2102.06280. [Google Scholar]
- Sung, N.; Kim, M.; Jo, H.; Yang, Y.; Kim, J.; Lausen, L.; Kim, Y.; Lee, G.; Kwak, D.; Ha, J.W.; et al. Nsml: A machine learning platform that enables you to focus on your models. arXiv 2017, arXiv:1712.05902. [Google Scholar]
- Roy, R.B.; Patel, T.; Gadepally, V.; Tiwari, D. Bliss: Auto-tuning complex applications using a pool of diverse lightweight learning models. In Proceedings of the 42nd ACM SIGPLAN International Conference on Programming Language Design and Implementation, Virtual, 20–25 June 2021; pp. 1280–1295. [Google Scholar]
- Wexler, J.; Pushkarna, M.; Bolukbasi, T.; Wattenberg, M.; Viégas, F.; Wilson, J. The what-if tool: Interactive probing of machine learning models. IEEE Trans. Vis. Comput. Graph. 2019, 26, 56–65. [Google Scholar] [CrossRef] [PubMed] [Green Version]
Publisher’s Note: MDPI stays neutral with regard to jurisdictional claims in published maps and institutional affiliations. |
© 2022 by the authors. Licensee MDPI, Basel, Switzerland. This article is an open access article distributed under the terms and conditions of the Creative Commons Attribution (CC BY) license (https://creativecommons.org/licenses/by/4.0/).