Article

Using Scratch to Improve Learning Programming in College Students: A Positive Experience from a Non-WEIRD Country

by
Jesennia Cárdenas-Cobo
1,
Amilkar Puris
2,
Pavel Novoa-Hernández
3,
Águeda Parra-Jiménez
4,
Jesús Moreno-León
5 and
David Benavides
6,*
1
Facultad Ciencias e Ingeniería, Universidad Estatal de Milagro, Milagro 091050, Ecuador
2
Facultad de Ciencias de la Ingeniería, Universidad Técnica Estatal de Quevedo, Quevedo 120503, Ecuador
3
Escuela de Ciencias Empresariales, Universidad Católica del Norte, Coquimbo 1781421, Chile
4
Departamento de Psicología Evolutiva y de la Educación, University of Sevilla, 41018 Sevilla, Spain
5
Programamos, 41089 Sevilla, Spain
6
Departamento de Lenguajes y Sistemas Informáticos, University of Sevilla, 41012 Sevilla, Spain
*
Author to whom correspondence should be addressed.
Electronics 2021, 10(10), 1180; https://doi.org/10.3390/electronics10101180
Submission received: 7 April 2021 / Revised: 3 May 2021 / Accepted: 6 May 2021 / Published: 15 May 2021
(This article belongs to the Special Issue Open Source Software in Learning Environments)

Abstract

:
Teaching computer programming is a real challenge in the State University of Milagro (UNEMI), located in one of the least-developed zones in Ecuador, a non-WEIRD country (WEIRD stands for Western, Educated, Industrialized, Rich and Democratic). Despite the application of various learning strategies, the historical pass rate does not exceed 43%. To solve this problem, we have relied on visual programming languages, specifically Scratch. Scratch is an open source software to learn programming that has a strong assumption of the benefits of community work. A quasi-experiment conducted with 74 undergraduate students during the first semester of CS showed that: (1) Both groups (control and experimental) are homogeneous in terms of their demographic characteristics, previous academic performance and motivation (expectations) concerning the course; (2) Scratch is strongly accepted by students in the experimental group and concerning the learning process, both groups showed similar levels of satisfaction; (3) the experimental group showed a pass rate four times higher than the control group; (4) in general, student success is associated with having learned programming with Scratch. While limited, our results are an important step in our road to improve the learning of programming in a low social status area of Ecuador.

1. Introduction

In today’s society, where most students are considered digital natives, knowing how to program is a necessary skill for future professionals in order to enhance thinking skills for problem solving [1]. Hence, numerous educational institutions have included this skill in their curricula, even at initial levels (i.e., K-12). However, most of the experiences reported in literature regarding this necessary initiative occur in well-educated countries, which are often referred to as WEIRD (Western, educated, industrialized, rich, and democratic) [2]. For Henrich et al. [2], the experimental results of the WEIRD communities should not be taken as standards for all populations. They believe that there is substantial variability, with frequent outliers. Within the domains reviewed by their study, we can highlight that spatial reasoning, reasoning styles, motivation, categorization and differential induction are domains that we consider should be developed within programming learning.
Latin America countries, and in particular Ecuador, have very different characteristics to WEIRD countries. Students from less-developed areas, from a socioeconomic point of view, tend to have a weak basis for solving problems in the field of mathematics and physics, which can make learning programming a complex task, even in university settings, according to [3,4,5].
This is also the case of students enrolled on the Computer Systems Engineering (CS) course at the State University of Milagro (UNEMI) from Ecuador. Milagro is one of the least-developed zones in Ecuador, where a large proportion of the population lives in the countryside. Students entering UNEMI come mostly from this social stratum. This low socioeconomic status might have a negative influence on academic performance, regardless of government initiatives to facilitate access to educational centers. In fact, the pass rate in the subject Fundamentals of Programming, which is taught in the Computer Systems Engineering program, does not exceed 43%. This causes a high degree of dropout in the career that usually leads to the student’s definitive abandonment of higher education.
Trying to overcome this situation, several strategies have been implemented in recent years without positive results. For instance, the most experienced lecturers were assigned to the early semesters. Likewise, the topics within Fundamentals of Programming were reorganized. Lastly, pre-university training courses were offered to help students catch up.
In the context of assisting programming learning, Visual Programming Languages (VPL) are powerful tools [6]. While Scratch was designed for children, there is evidence that it is useful in teaching programming concepts to students in the early stages of programming learning [7,8]. Based on these evidences, we considered Scratch suitable for enhancing the learning of programming in CS freshmen at UNEMI. Scratch is an open source tool under a BSD license that promotes the community work (see more in Section 2).
In this regard, this paper reports our findings related to an intervention with Scratch during the first 8 weeks of Fundamentals of Programming. The participants (74 students at UNEMI) were divided into two groups: the control group (with the traditional learning approach), and the treatment group (using Scratch). Results showed that students who were learning with Scratch had more chances of passing the midterm exam (applied at the end of the 8th week) than students from the control group. We also observed a high level of acceptance of Scratch in students from the experimental group.

2. Literature Review

According to [9], the learning of computer programming is a difficult process. Experience has shown that many students find it difficult to use programming languages. School failure suggest that traditional approaches to teaching and study methods are not the most appropriate. There are several reasons that cause this learning problem, such as the lack of problem-solving skills that many students possess (i.e., students do not know how to create algorithms).
Blocks-based Programming Languages (BBPL) were created aiming to counteract such obstacles during learning, since they avoid syntax errors; allow the student to develop logical and creative thinking, by performing various activities (for example, games); and enable the visualization of the execution of algorithms. These block programming environments have become a popular way of introducing coding and as a building block towards traditional languages based on text, although one can also use these environments to write real code [10].
Scratch is a popular choice within BBPL tool [11]. It is composed of a dynamic, attractive, colorful and simple graphical interface that allows to perform, animations, games, dialogues, simulations, diverse activities and interactive comics or other programs that often arise from the student’s own creativity and can be shared with other students or users of Scratch. Its environment uses menus, controls called color differentiated block palette that allow the design of the program created by the student, these controls come together as a puzzle in an orderly and logical way for the program to work properly [12]. One of the benefits of Scratch is that it is visually attractive and fosters learning in an active manner [13,14].
While initially was targeted at teenagers, i.e., a younger audience than that in the first year of college, interest in Scratch is increasing at university level as a way of introducing learning’s to difficult programming concepts [15].

2.1. Scratch for College Students

Scratch was presented by David Malan and Henry Leitner in an introductory programming course at Harvard [16]. The authors took advantage of the benefits of language to focus students on the logic of programming. While no evidence on a cognitive level of the impact of using this language was reported, they concluded that the vast majority (76%) of the students rated the experience as positive. Interestingly, all the students who were dissatisfied with Scratch knew another programming language prior to the study.
Based on the aforementioned experience at Harvard, the same authors got involved in a simple research project: [17]. Together, these authors proposed ideas for students to move more smoothly between Scratch and advanced programming languages such as C + + and Java. While it does not present experimental evidence, the paper presents some interesting pieces of advice.
Another paper on the use of Scratch in a university environment was presented by [18]. In this case, the programming language was used as an easier way to move students on to a text-based language. Students learnt to code with basic programming concepts (use of variables, conditionals, loops, etc.) using Scratch and then transcribe these blocks into lines of code. The authors used a set of questionnaires as their starting point, which is a good mechanism to introduce more advanced programming languages.
There are various techniques that, like Scratch, have been used as technological alternatives for teaching introductory programming courses. Xinogalos et al. [19] analyzed university students in their fourth year of an ICT course (studying Advanced Programming Skills) to identify positive and negative characteristics of alternatives such as: BlueJ; objectKarel; Scratch; Alice; and MIT App inventor. After developing a group of activities with each alternative and answering a questionnaire, it was identified, among other things, that Scratch was the most suitable strategy for providing introductory programming courses.
A literature review was conducted by [20] to identify countries that had incorporated techniques in order to improve programming skills in their curricula. According to the authors, the main efforts made were in Europe, the United States and Asia. In addition, higher education was the educational level that had received the most attention and Scratch was identified as one of the most widely used tools.
Another result of Scratch’s intervention in higher education was presented by [21]. They analyzed 52 second-year students studying Education in Information Technology, divided into two groups (control and test). The objective was to identify the benefits of Scratch for motivation and programming achievement. The experiment was conducted in two stages, each lasting 7 weeks. In the first stage, the basic concepts of programming were taught in the traditional way (flowchart) for the control group and Scratch was employed for the test group. In the second stage, both groups transitioned to the C language in the same way. The authors found that the test group had the highest levels of motivation and their performance (score on a final exam) was significantly higher than the control group. They concluded that Scratch is a good option for introducing basic programming concepts.
An interesting study highlighting the influence of Scratch on the cognitive development of university students was published by [6]. They analyzed the results of 10,000 students in introductory Computer Science courses at 118 universities in the United States, and found that the scores were higher for students who knew Scratch before starting university as opposed to those who knew a conventional programming language.
Finally, Tang et al. [22] carried out a state-of-the-art systematic review of more than 7000 articles published between 2013 and 2018. As part of the results, the authors identified Australia, Canada, China, Greece, the Netherlands, Spain, Turkey, the USA and the UK as the countries with the most publications on computational thought. They also determined that Scratch was the most commonly used programming tool among the published studies.
In short, it can be observed that:
  • Scratch has been used with positive results in the development of computational thinking.
  • No study has ever been performed regarding the impact of Scratch in a non-WEIRD community college environment.

2.2. Scratch and the Open Source Movement

All the source code of the latest version of Scratch, 3.0, is licensed under open source licenses: most components are under the BSD license while the Scratch Blocks component is licensed under the Apache License v2.0 (https://en.scratch-wiki.info/wiki/Scratch_Source_Code, accessed on 15 April 2021). In addition, all projects shared at the Scratch web repository are licensed under the Creative Commons Attribution Share-Alike license 2.0 (https://en.scratch-wiki.info/wiki/Scratch_Project_License, accessed on 16 April 2021).
The Scratch website promotes the idea of a community of learners that share their creations and learn from each other [23]. The website offers features to publish projects, to explore the repository searching and filtering by different criteria, to follow projects and users and get notifications of their activity, to share comments about projects, to participate in studios with other programmers and curators, and to create remixes (forks) of projects programmed by other users. The result is a vibrant community in which its members “learn to collaborate in many different ways. They give feedback through comments on projects, they work together on joint projects, they remix one another’s projects, they crowd-source artwork for their projects, they create Scratch tutorials to share their knowledge with one another” [24].
These features offer the possibility of learning about the social aspects of open software development. An example of such learning experience can be found in the Scratch forums, where multiple beginner programmers complain about other developers using their programs, claiming that their creations are being stolen (https://en.scratch-wiki.info/wiki/Remix#Controversy, accessed on 16 April 2021).
Nonetheless these social open source software possibilities are clearly beneficial in the long term, since Scratch users develop social skills related to programming and beyond. A recent investigation shows that more social activities users perform in the Scratch website is positively associated with bigger improvements in the sophistication of the projects they program [25]. In a similar vein it was found that “users who remix more often have larger repertoires of programming commands even after controlling for the numbers of projects and amount of code shared” [26].
In our intervention we tried to make the most of these social, open source features of Scratch. However, the specific impact of such features on the students’ learning outcomes is to be assessed in a future work.

3. Materials and Methods

The main objective of this research project was to test whether the use of Scratch can improve the learning outcomes of undergraduate students from communities that historically perform poorly. For this, we applied a quantitative and cross-sectional paradigm for analysis and data collection. A similar approach in a different setting was described by [27]. Figure 1 shows the process we followed in this study.

3.1. Participants

The study was carried out with students in their first semester of Computer Systems Engineering at the State University of Milagro in Ecuador. The study sample was composed of 74 students aged between 17 and 34. We divided the sample into two groups with common characteristics: the control group ( n = 38 ) and experimental group ( n = 36 ). For the control group, the contents were taught following the teacher’s previous strategy. The use of Scratch to support teaching and learning was incorporated into the experimental group.

3.2. Design and Data Collection

The experiment was carried out during the first 8 weeks of a 16-week course, with a frequency of 5 h per week. At that time, each group received the same programming concepts: variables and initialization, conditional and repetitions, and other introductory aspects of the subject.
We built several evaluation instruments to collect information at each stage of the project. The first instrument was a questionnaire, as shown in Table 1, and the last was a test to measure skills acquired in programming after the intervention.
The aim of the first questionnaire (Q1) was to discover some socioeconomic aspects and the students’ attitudes towards study. The results of this instrument were used to analyze the homogeneity of the groups at the beginning of the experiment. In the same way, we applied a second questionnaire (Q2) to find out levels of satisfaction with Scratch among students in the experimental group. And finally, we constructed a third questionnaire (Q3), which was applied to each group, to measure the students’ satisfaction with the teaching process. Both Q2 and Q3 were applied after the students had completed 8 weeks of study.To verify if questionnaires were consistent with the assessment, we performed a pilot test and we relied on experts for evaluating the questions.
Concerning the midterm exam, it can be seen as an independent variable that is manipulated at two levels (control and experimental) and a dependent variable that is measured by applying a post-test [28]. The teachers in charge of each group, designed 10 multiple-choice questions. The objective was to measure the knowledge acquired by students in both groups. Further details on the structure of the exam can be found in Table A1 (Appendix A). The main topics evaluated for both groups were variables, conditional structures, loops and algorithms. We believe that while a cognitive test will not absolutely capture the students’ learning [29], it does give us a rough enough measure to know the degree of assimilation of the content delivered during the first 8 weeks of the course. Finally, it is important to mention that both groups were taught the same topics (variables, conditional structures, etc.) and used flowcharts to represent their solutions theoretically. As for the practical activities, these were carried out using the Java programming language (control group) and Scratch (experimental group).
To verify differences between groups, we used Student’s t-test under the assumption of normal data distribution and variance homogeneity. We also fit of a decision tree [30] in order to identify which variables explain students‘ success in the midterm exam.

3.3. Research Questions

The following research question framed this study: Which teaching method is more effective in teaching the concept of programming using traditional activities only or using Scratch? Two sub-questions were framed:
RQ1: 
Do students perceive that Scratch helps them improve their skills in basic programming concepts?
RQ2: 
Are students’ grades improved with a Scratch intervention in the teaching- learning process?

4. Results

This section describes the results obtained to provide answers to the questions guiding the research. Before this, we have considered it necessary to show statistically that the groups under study (control and experimental) are homogeneous (Section 4.1). In this way, it will be verified that the assignment of individuals to these groups has been carried out with the least occurrence of bias. After that, Section 4.2 addresses the satisfaction of the Experimental group about Scratch and the satisfaction of both groups with respect to the teaching method, that is, after 8 weeks. Finally, Section 4.3 provides answers to question RQ2 through both univariate and multivariate statistical analyses.

4.1. Homogeneity of the Groups

To simplify the analysis of group homogeneity, the study was divided into two parts. First, we analyzed the six initial questions (A1…A6) of the Q1 questionnaire presented in Table 1, and in the second part, we will consider the pre-course motivation (items from A7 to A13).
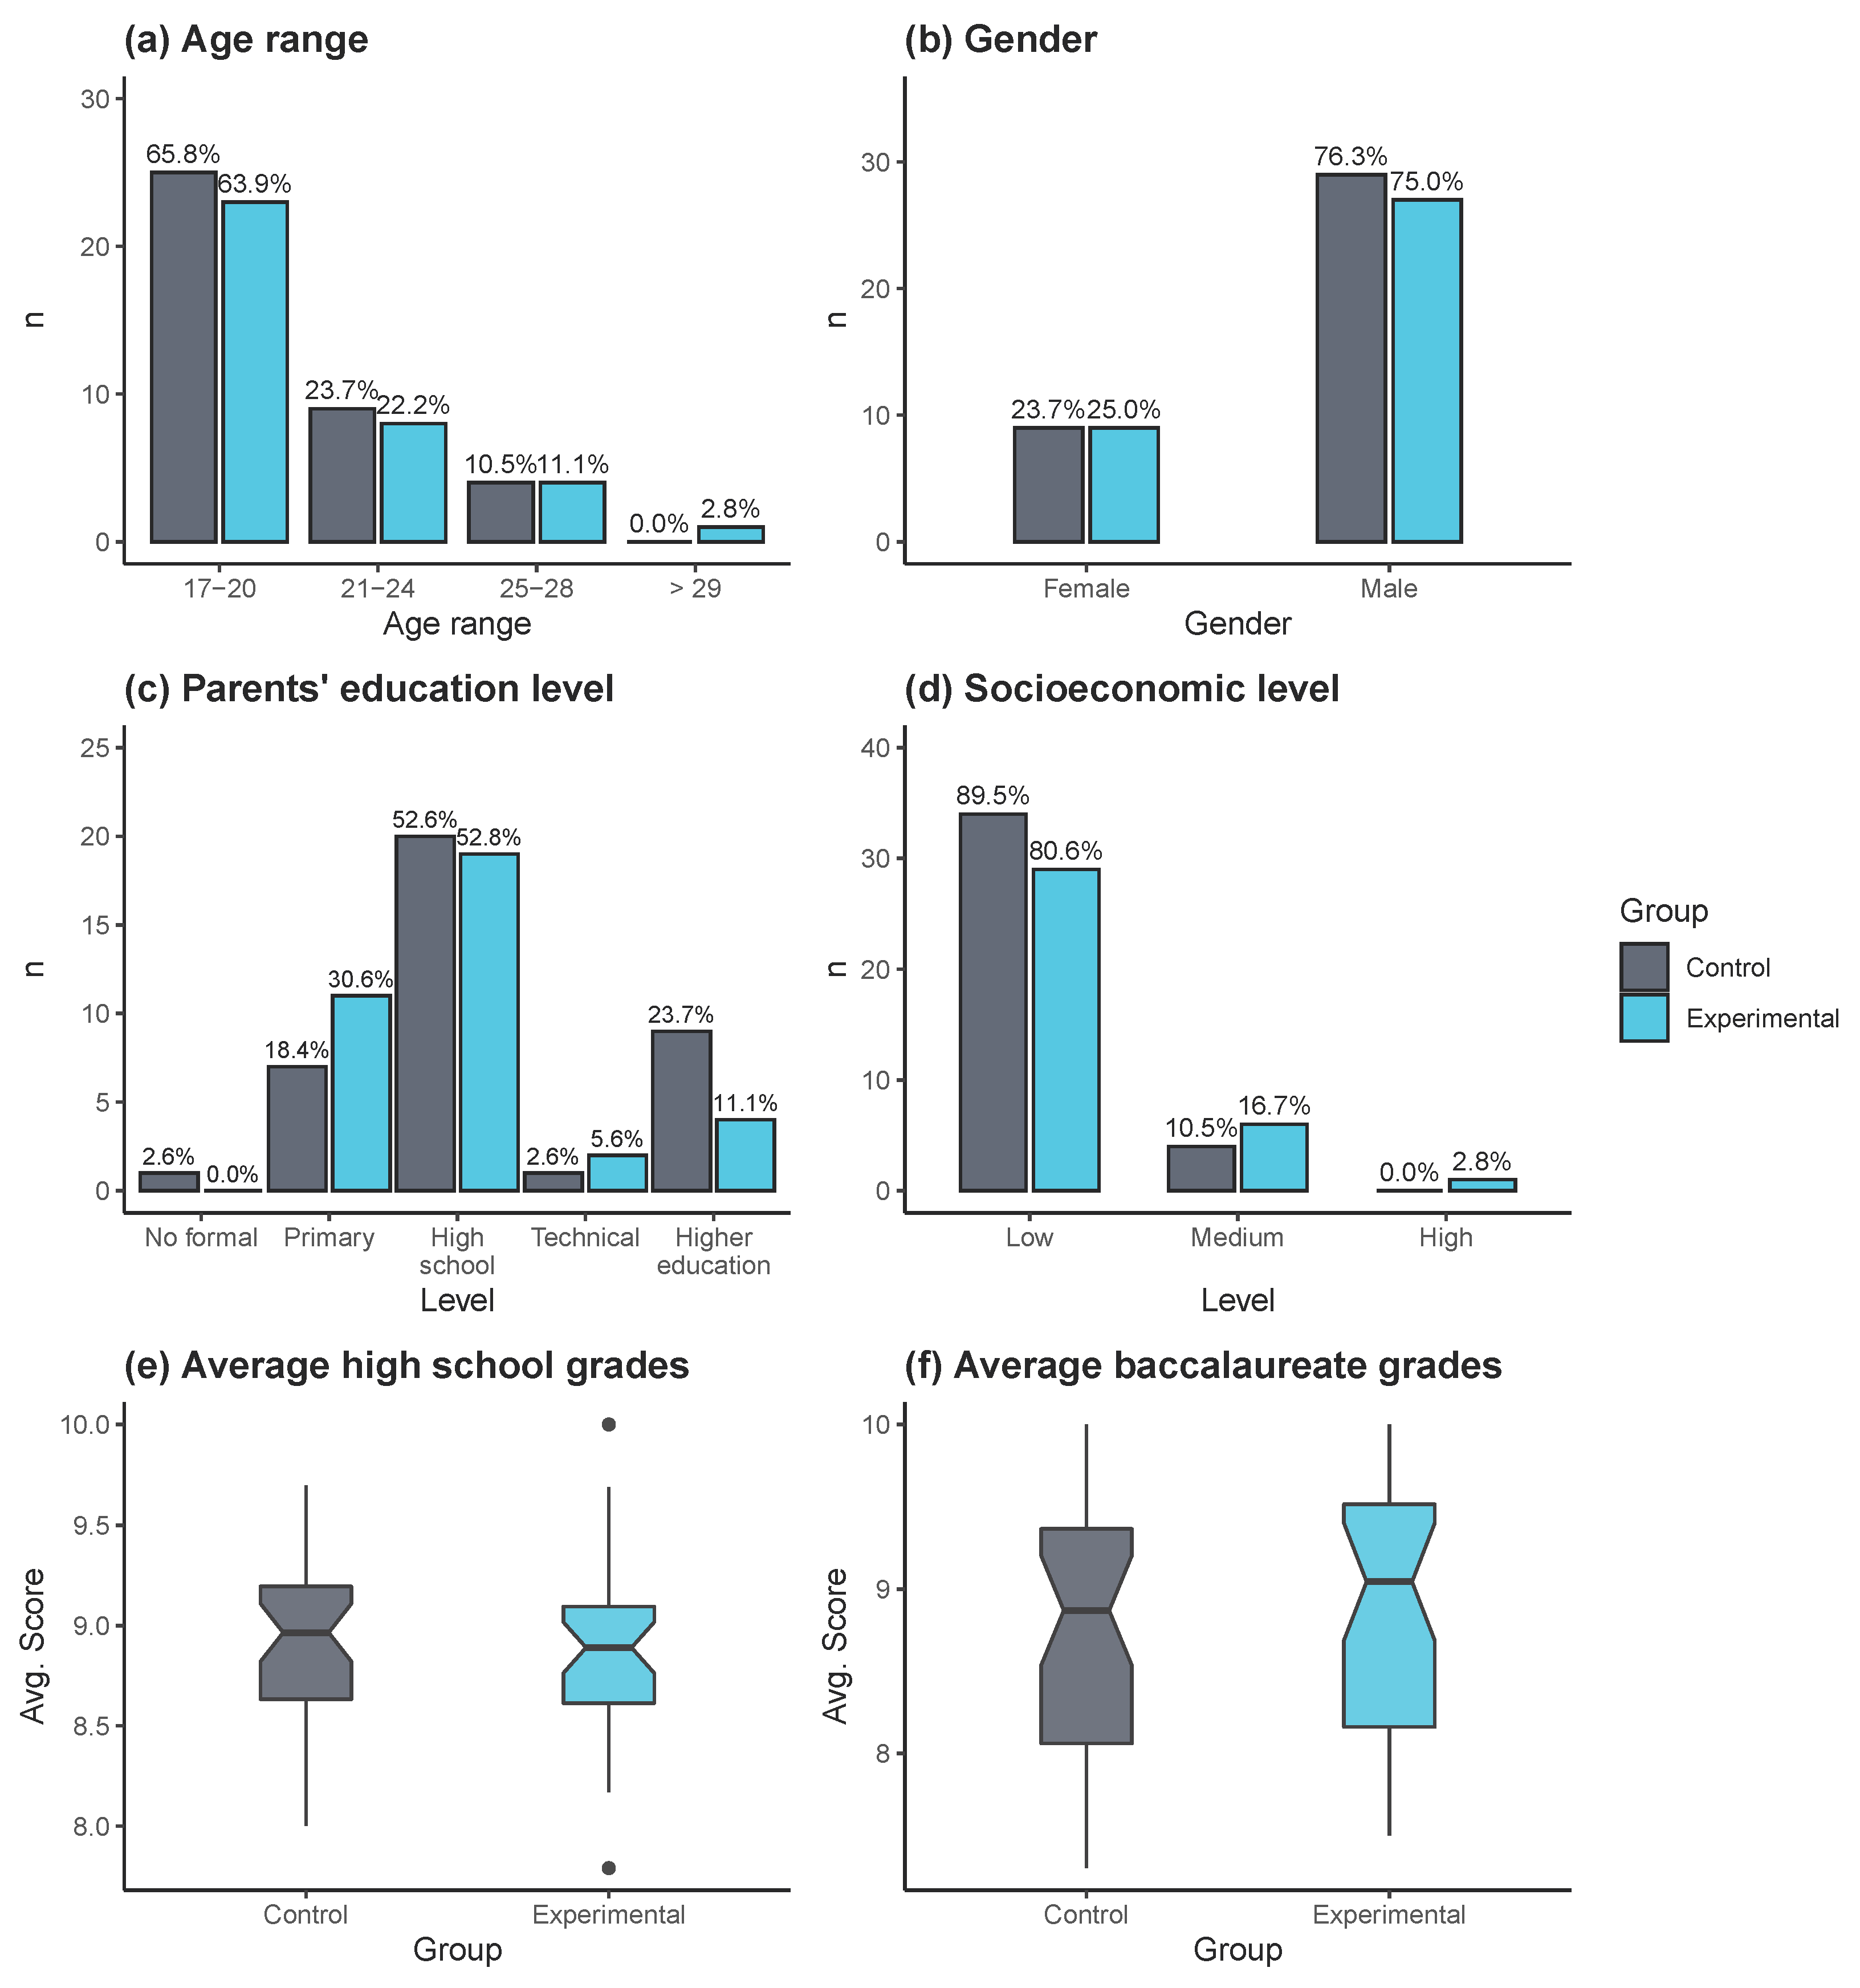
Figure 2 shows a descriptive summary of the variables that characterize the students. From these plots we can observe that students in both groups (control and experimental) present very similar characteristics. The majority are under 21 years of age (Figure 2a), are male (Figure 2a), with parents who studied up to high school (Figure 2c), and from families with low socioeconomic status (Figure 2d). Additionally, Figure 2e,f show that both groups are composed of students who obtained similar academic grades in both high school and baccalaureate. Overall, these features indicate that most of the students started the course in not very favorable conditions.
In order to formally confirm the homogeneity of the control and experimental groups, we proceeded with a statistical analysis. We relied on a t-test for equality of means. Table 2 shows that no significant differences exit between the experimental and control group in terms of age, parental education level, socioeconomic level of the family, average high-school grades, and average grades in the baccalaureate course (all p-value > 0.05 ).
In the second part of this study, we analyzed the existence of significant differences between the experimental and control groups regarding motivation. The operationalization of this variable was realized by means of the average of the perception on the degree of fidelity in the course, regularity, attendance, interest, intellectual capacity and expectation of passing Fundamentals of Programming.
Table 3 and Table 4 show the statistical summary and results of t-test. Under the test of normality and homogeneity of variance, the value of the t-test (p-value = 0.128 > 0.05 ) did not provide enough statistical evidence to reject the null hypothesis ( H 0 ). For this reason, there is no significant difference between students’ expectations at the beginning of the course.

4.2. Satisfaction Analysis (RQ1)

In this section, we will analyze the information obtained in the Q2 and Q3 questionnaires. Both were applied after 8 weeks of intervention.
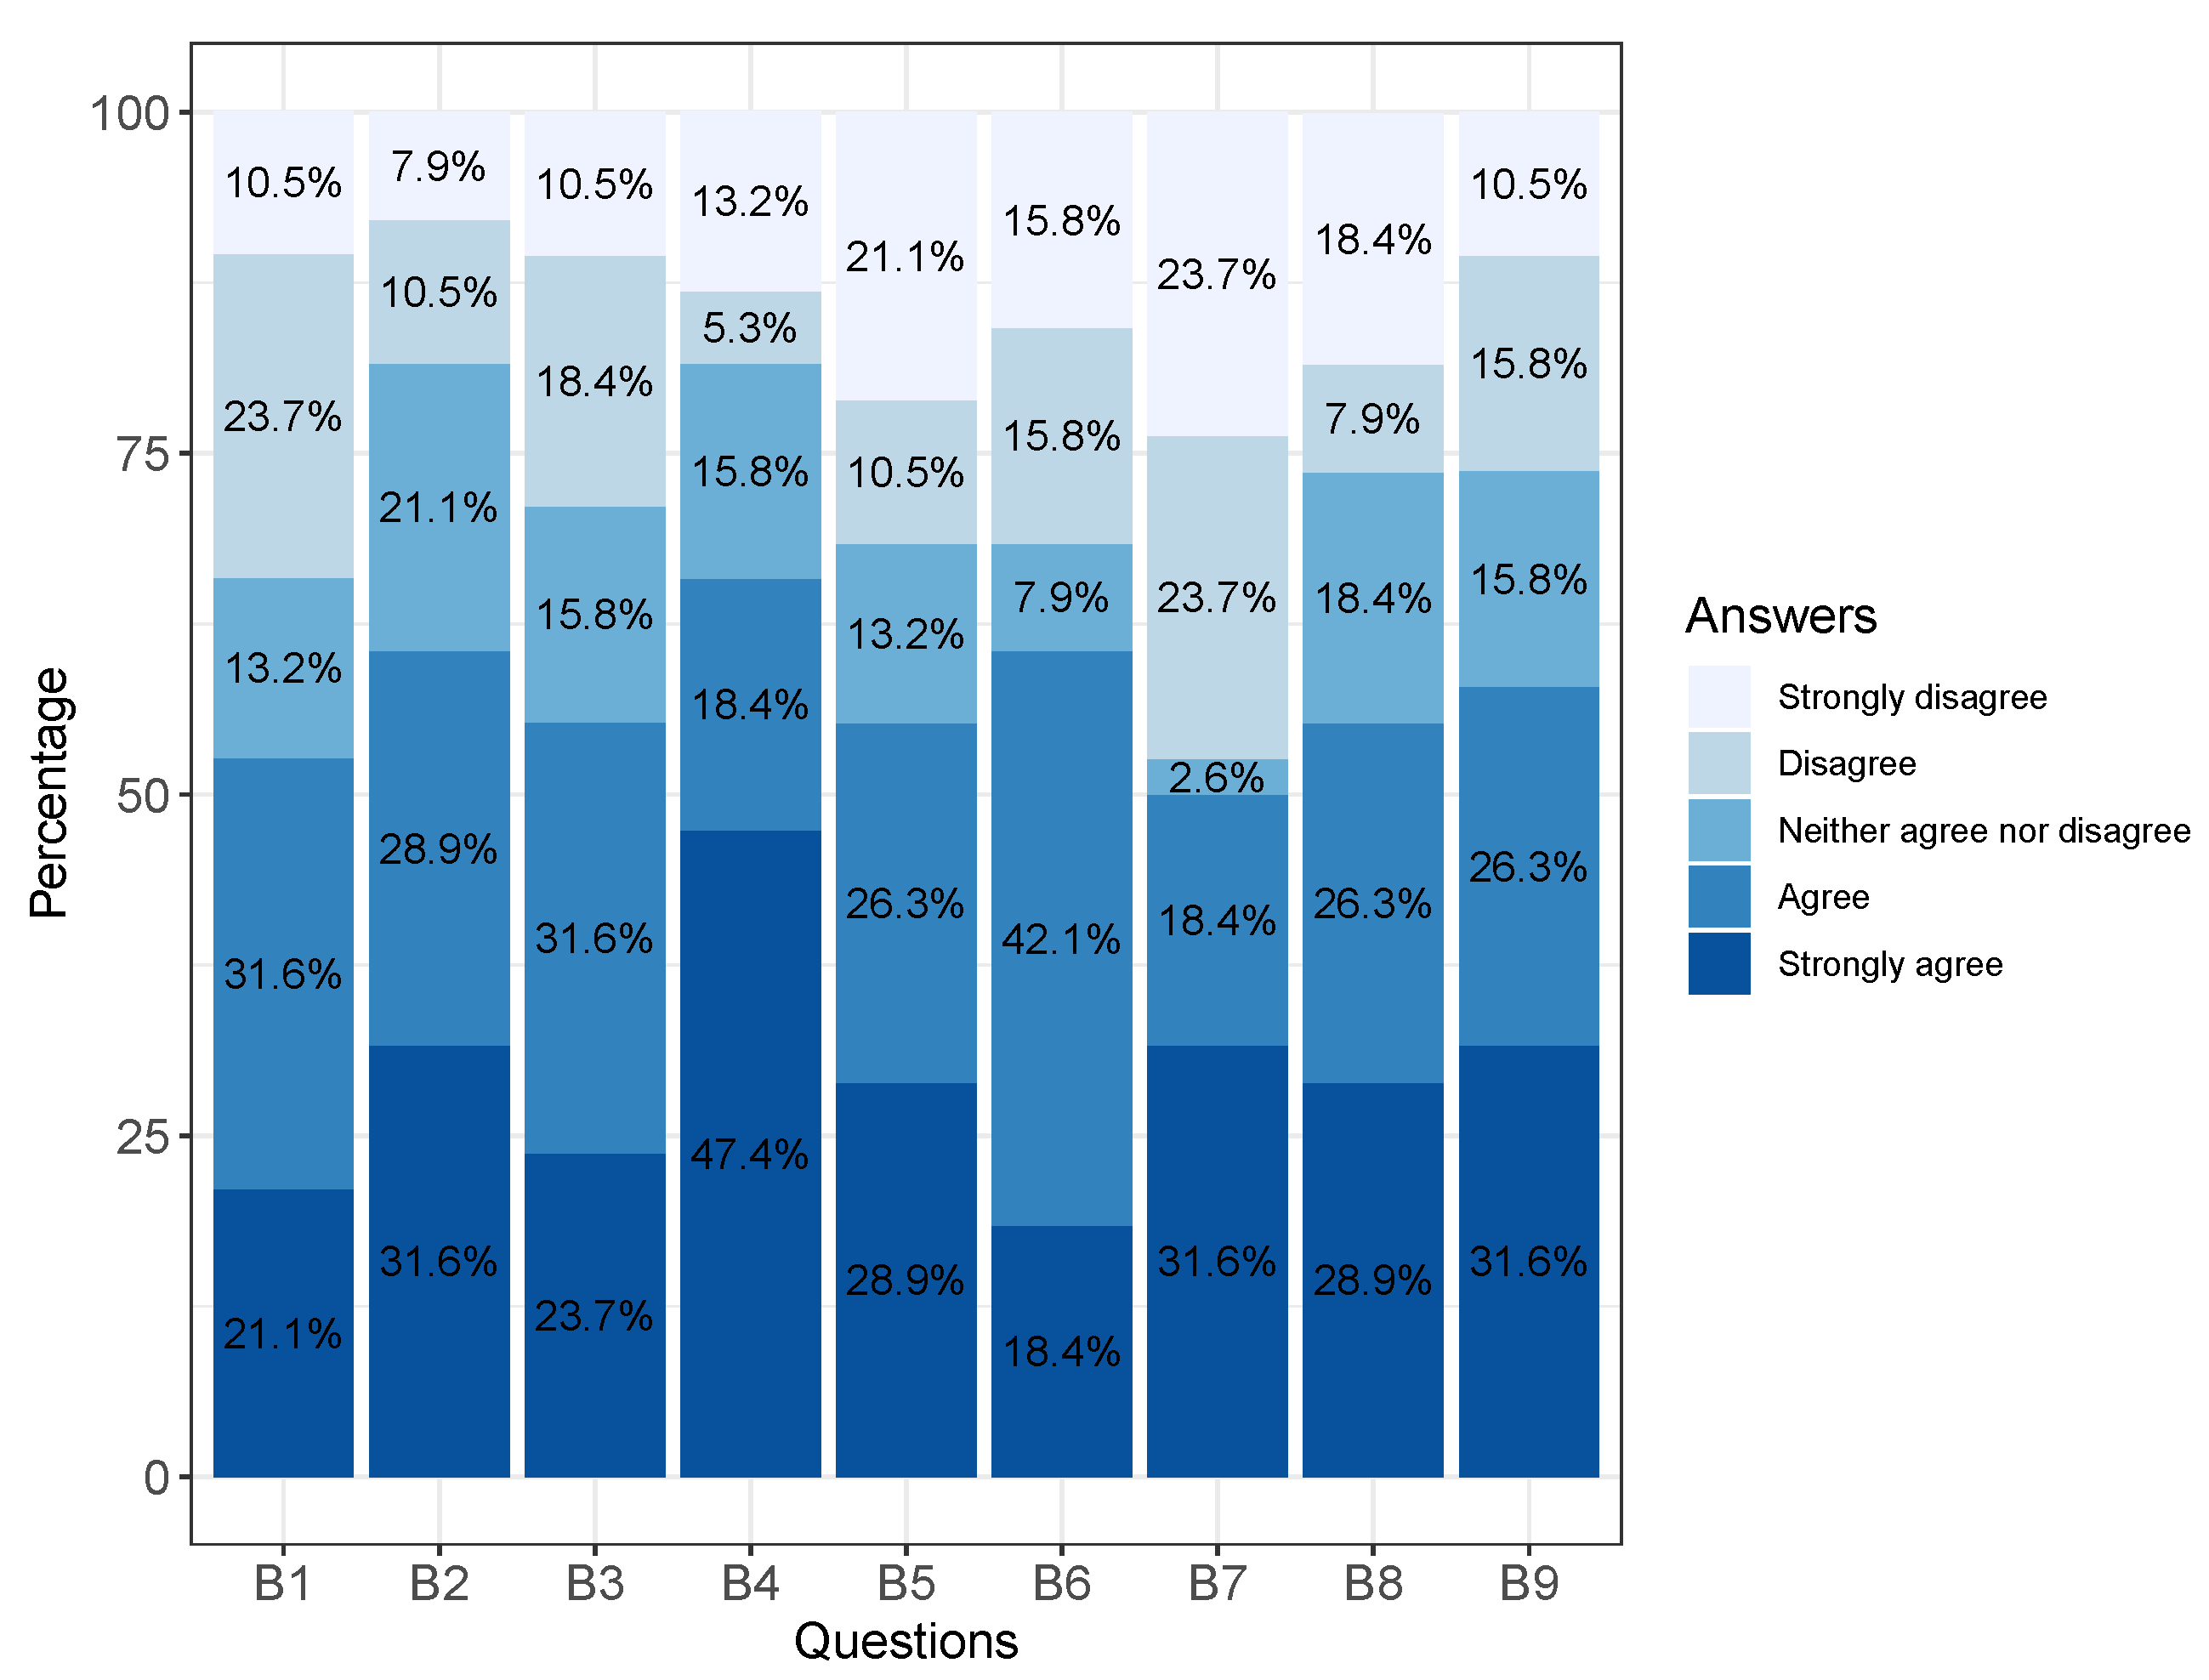
The objective of Q2 was to determine students’ satisfaction with Scratch tool and the impact it had on their learning. Figure 3 summarizes the results of this survey. It can be seen that the highest percentage of disagreement corresponds to question B7 (related to the perception that it is necessary to have prior programming knowledge to work with Scratch). In contrast, the largest percentage of agreement is achieved for question B4 (related to students’ intention to attend courses and learn Scratch).
In general, the results of this satisfaction survey show a higher proportion of positive (strongly agree and agree) than negative responses (fisagree and strongly disagree). Considering that this was the first time that students used Scratch, in our opinion the results were positive.
Finally, we determined if there was a significant difference between the two groups in terms of students’ perceptions (questionnaire Q3) about the learning process in Fundamentals of Programming. The variables related to the students’ perceptions about degree of learning achievement, ease, enthusiasm, interest, applicability, motivation and qualification were taken into account.
Table 5 shows the descriptive summary for each item from questionnaire Q3. The lowest mean value is reported for item C1, indicating that most students feel they have not yet completed the subject matter. This result is understandable considering that the experiment took place during the first 8 weeks of the course. As a consequence, only basic programming concepts were taught.
Here, we also proceed with t-test for comparing both groups regarding the questionnaire Q3. Table 6 shows that no significant difference exist for each question (p-values > 0.05). With this result we can conclude that both groups valued the learning process in a similar way. Given these results, we believe that the work carried out by the teachers who took part in the experimental group was meritorious. Specifically, their achievement was that levels of satisfaction with the teaching-learning method were at the same level in both the experimental group and the control group (in which teachers had more experience in the methodology employed).

4.3. Effect of Learning with Scratch (RQ2)

In this section, we report the results after presenting all the evaluations of the first midterm exam (after 8 weeks) regarding the students’ grades in the control group and the experimental group. In accordance with UNEMI regulations, the minimum grade to pass the course is 70.
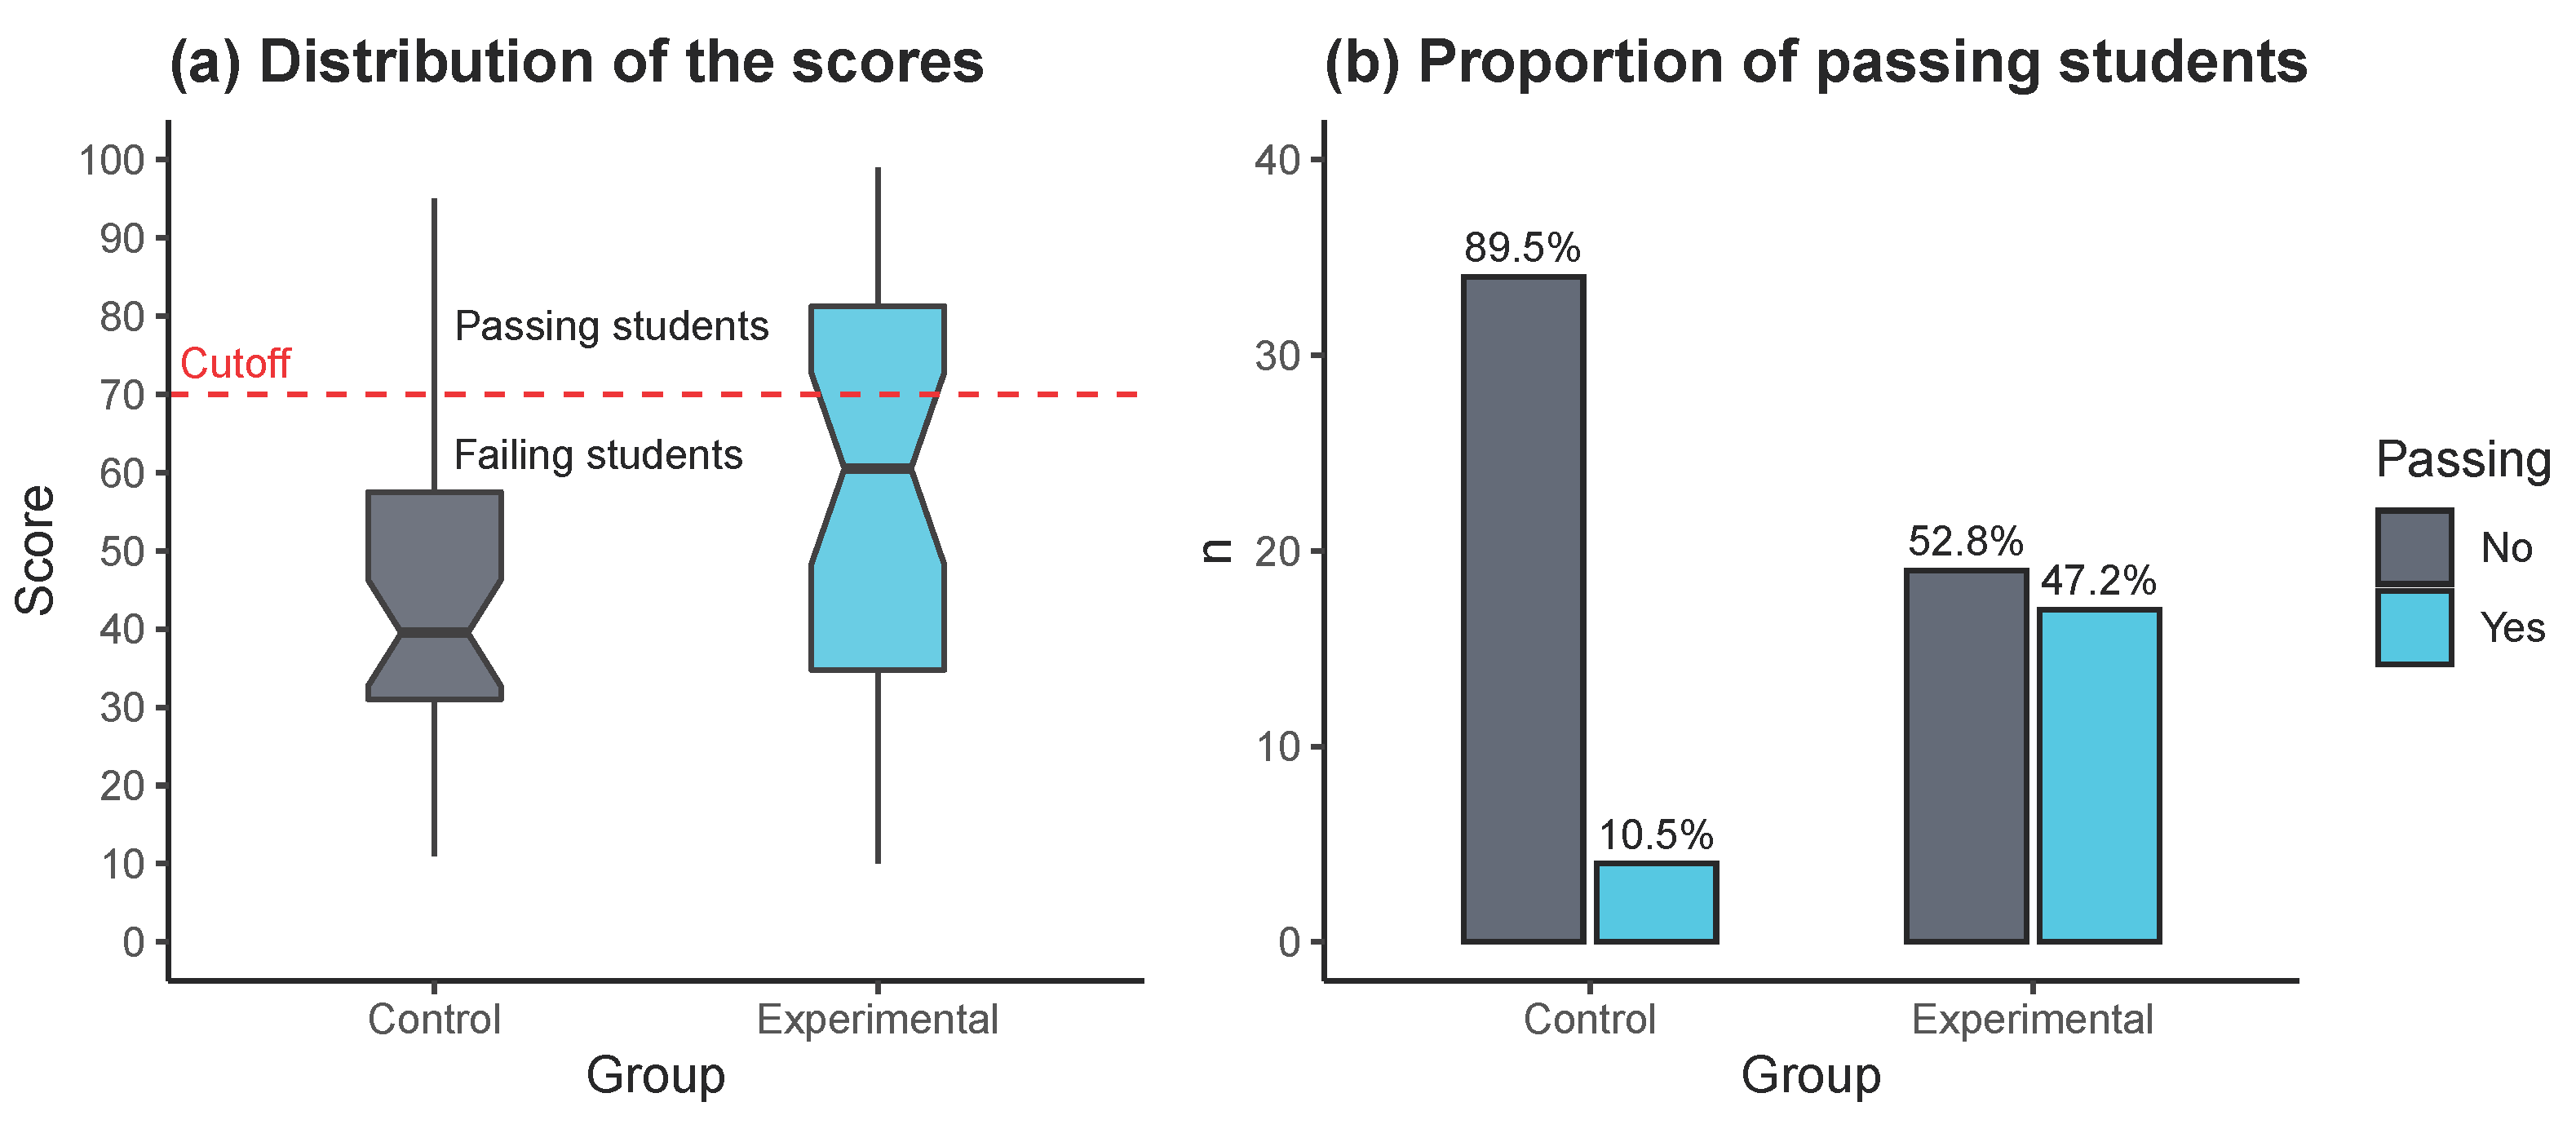
Figure 4 summarizes the results achieved by both groups in the midterm exam. Specifically, Figure 4a shows the score distribution through boxplots. In this case it can be observed that the control group has clearly inferior results compared to the experimental group. Notably, more than 75% of the students in the control group (quantiles 1, 2, and 3) achieve grades below the minimum necessary to pass (e.g., 70). This proportion is lower in the case of the experimental group. To complement this information, the bar chart in Figure 4b indicates that the experimental group improves the proportion of passing students of the control group by a factor of 4, i.e., from 10.5% to 47.2%.
We confirmed these observed differences through a t-test for equality of means (Table 7). Here, it is easy to see that the corresponding p-value (=0.021) is less than 0.05, so the null hypothesis (equality of means) can be rejected.
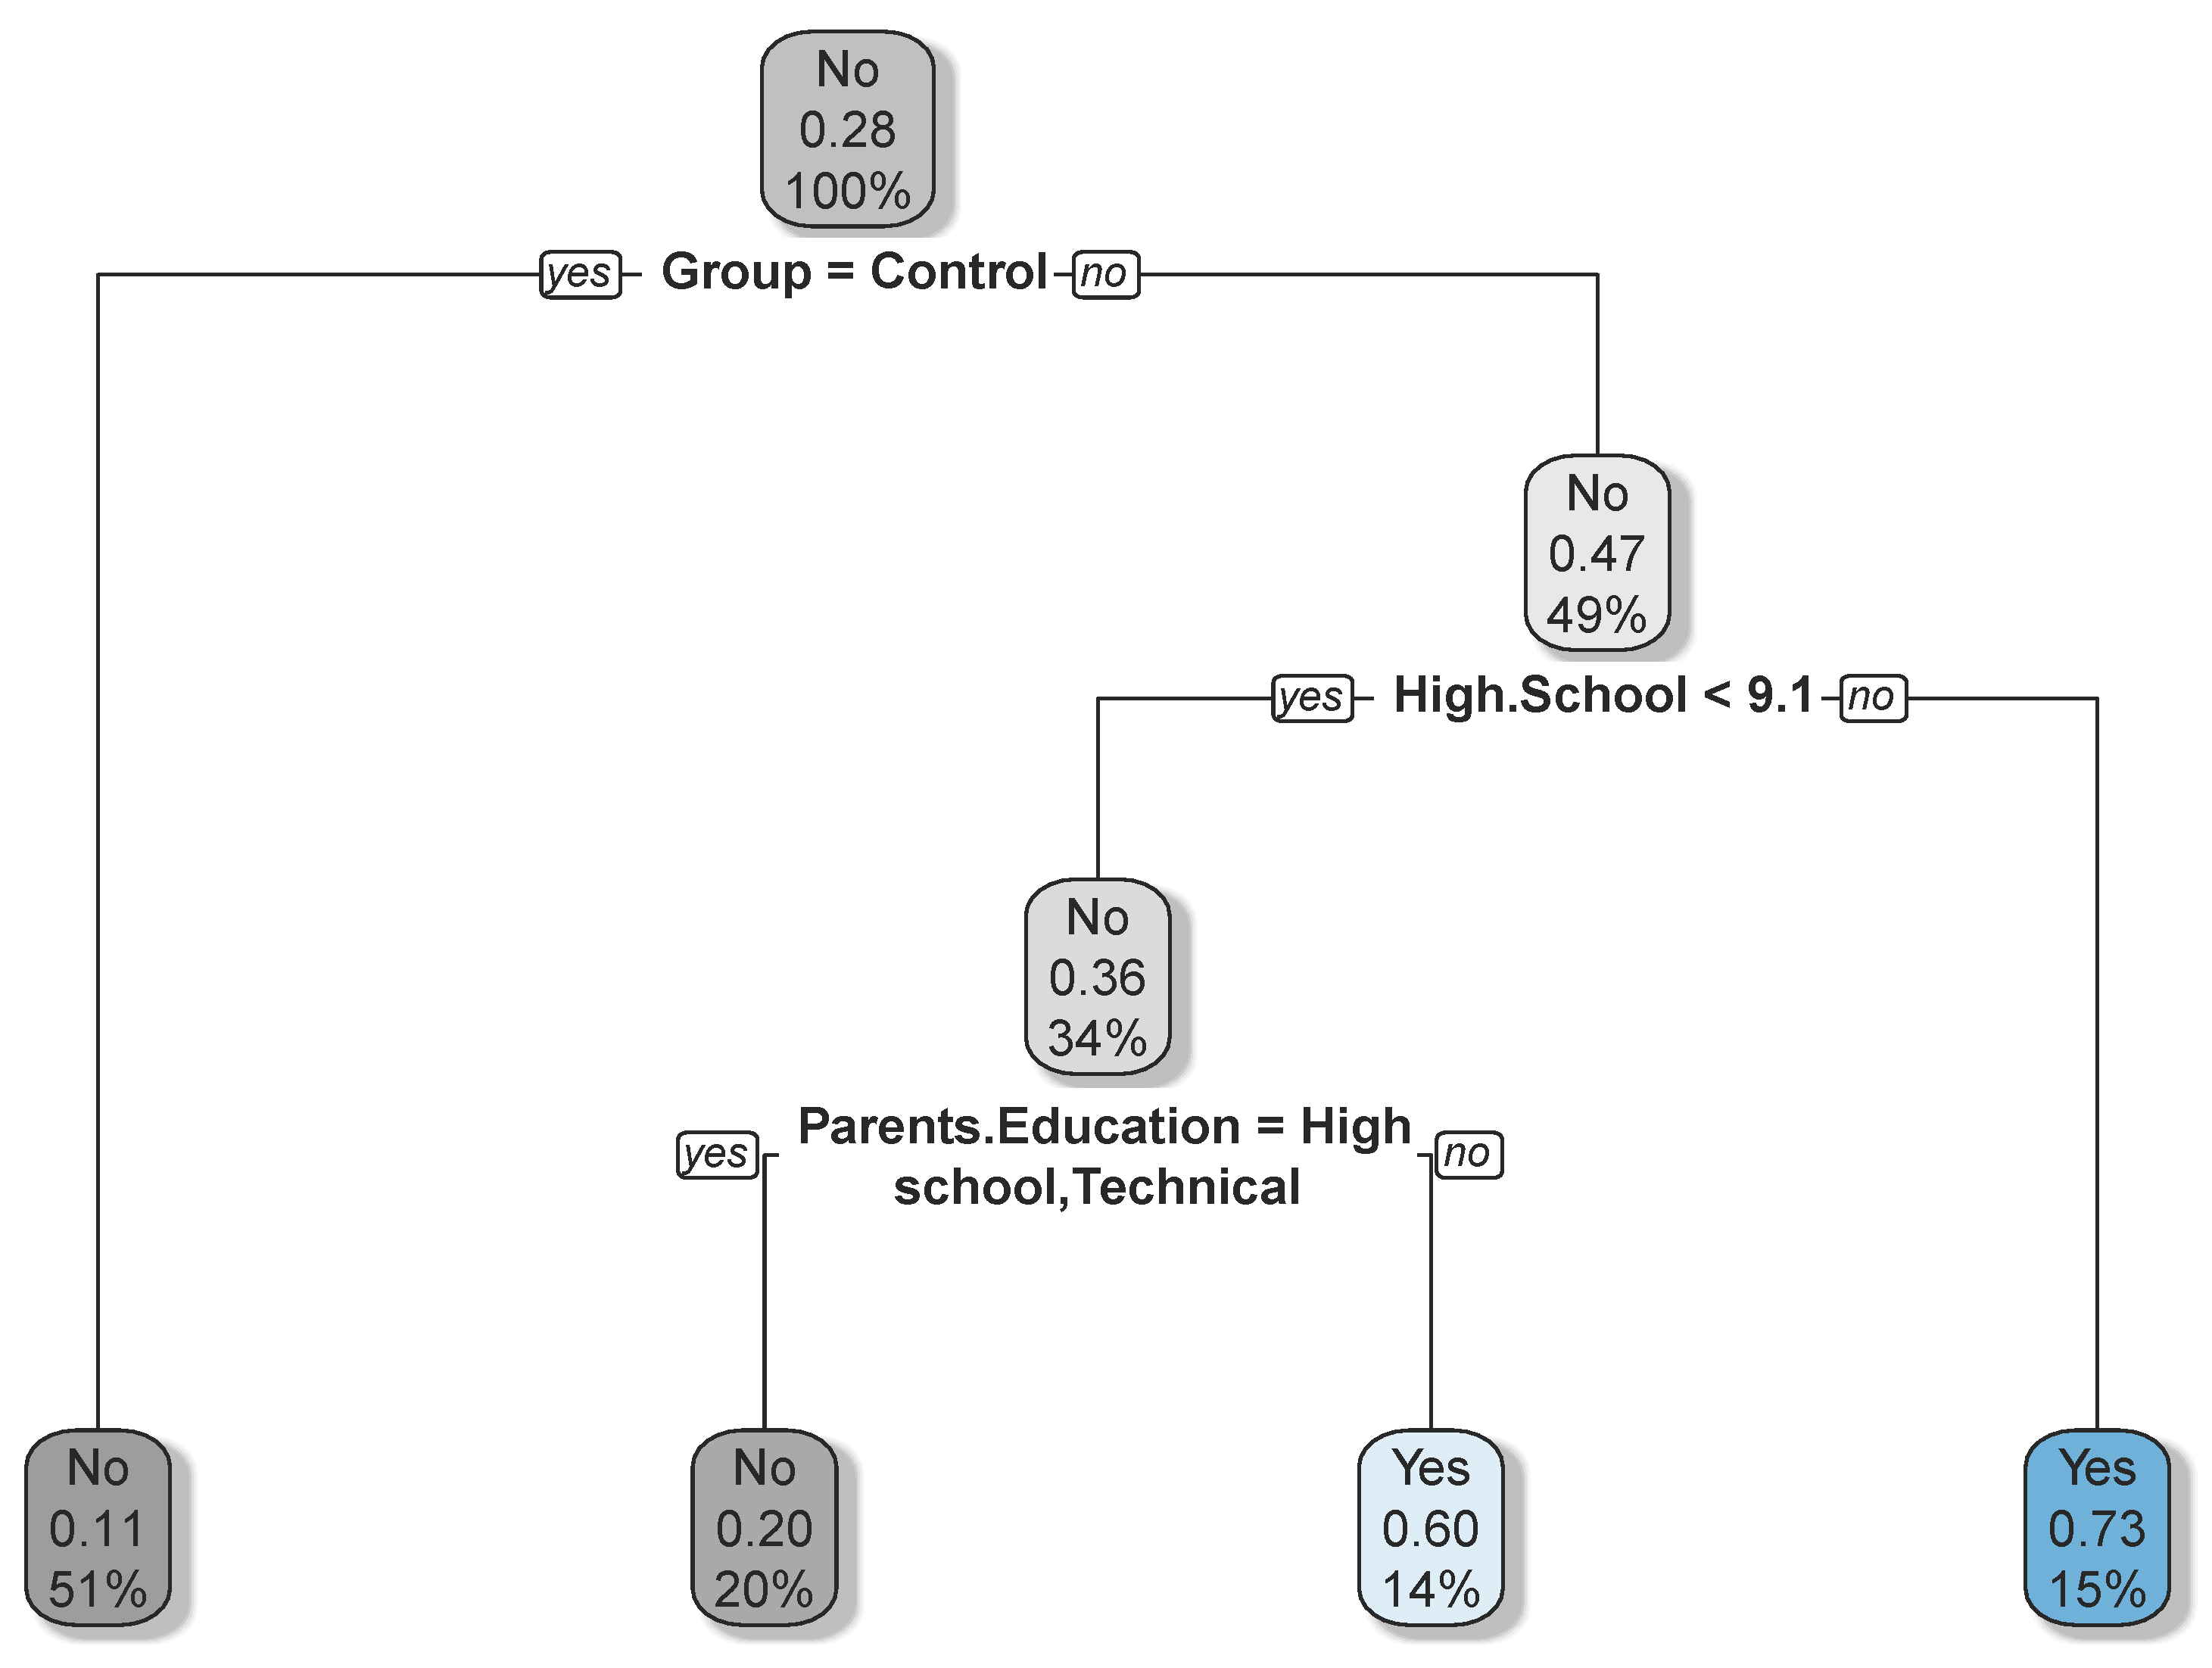
To better understand which student characteristics explain their success or failure in the midterm exam, we have conducted a multivariate analysis. Due to the small sample size (There are very few cases (students) per level configuration in each predictor variable), it is more appropriate to rely on nonparametric techniques. Specifically, we fitted a decision tree [30], in which the variables of questionnaire Q1 (e.g., age, gender, etc) were used as predictors of student success or failure. This success or failure has been modeled as dichotomous variable named Passing, so that a student with a score greater than or equal to 70 will be associated with Passing = Yes, while Passing = No, otherwise (e.g., the student fails). Figure 5 illustrates the tree obtained, in which each node contains three pieces of information: the most probable value with respect to the Passing variable (i.e., No or Yes), the probability that Passing = Yes, and the proportion of cases (students) that would be covered up to that node.
From the structure of the decision tree it is observed that, before attending the programming classes, the probability of passing is 0.28, that is, regardless of whether students take the course with or without Scratch. However, if students are taught with Scratch (Group = Experimental), the probability increases to 0.47. In this case, having a grade higher than 9.1 in high school is associated with a probability of success of 0.73. Otherwise, if the grade is lower than 9.1, success depends on the type of education achieved by the student’s parents. If the parents have a primary education or less, or are university graduates, the probability of passing the subject is 0.60. Interestingly, the fact that the parents have a secondary or technical education is associated with a probability of passing 0.20. Finally, note that the probability of passing if learning without Scratch (Group = Control) is associated with a probability of 0.11. The latter is consistent with the results reflected in Figure 4b where the pass rate for the control group case was 10.5%. Similarly, the probability of 0.47 associated with students being taught with Scratch is consistent with the pass rate in Figure 4b, that is, 47.2%. Another important aspect of these results is that only three variables (e.g., Group, High school grades, and Parents’ education) were found to be relevant in explaining students’ success or failure in the midterm exam.
The confusion matrix listed in Table 8 shows that the obtained decision tree has an accuracy of 0.811, 95% confidence interval [ 0.703 , 0.893 ] . From a one-side binomial test we found that the decision tree predicts better than chance (p-value = 0.0429 < 0.05 ). Besides, the MacNemar’s test p-value was greater than 0.05 indicating that the proportion of misclassified cases is statistically the same for both classes (e.g., Passing = No and Passing = Yes).

5. Conclusions

Improving the academic results of novice students of programming in non-WEIRD communities can be challenging for universities. We proposed a new pedagogical approach based on the Scratch tool to teach the subject in a more practical and didactic way, which was attractive to the majority of students. It allowed them to move faster through the contents and go deeper into fundamentals of programming.
Despite Scratch being a tool developed for children, the majority of UNEMI students come from a rural social context and have a low socioeconomic level, and therefore they benefit from starting with a friendly and simple tool (such as Scratch) in their first steps through programming. For that reason, this study represents an interesting initiative, given that there are no known papers focusing on communities with similar conditions of vulnerability. Specifically, most research projects have taken place in countries with more favorable educational conditions, as concluded by [20,22].
Moreover, our results showed an acceptable level of satisfaction in the group that used Scratch as a technological tool for learning. This is consistent with certain experiences reported by [16,19,21,31].
In terms of grades, the experimental group scored significantly better than the control group. A similar result was reported by [21], where students who used Scratch in the first weeks of the experiment were better able to transition to the C programming language and thus achieve higher grades. Another study related to this result was published by [6] and describes how the students who obtained the highest scores in an introductory programming course were those who knew Scratch before entering university. Furthermore, from a multivariate perspective we find that our proposal increases the probability of passing the midterm. Specifically, students who learn with Scratch are four times more likely to pass the exam than those who learn following the traditional method.
Based on these results, it can be concluded that incorporating Scratch into the Fundamentals of Programming classes would make a positive contribution to student performance. It also allows students to develop the concepts of programming logic and the use of certain basic control structures. However, it remains to be seen whether this effect will last long enough to ensure that students who learn with Scratch will be able to stay in the course and not drop out.
We are aware that this is just a first step towards improving the learning of programming with Scratch at Universidad Estatal de Milagro, an institution with a high dropout rate of students attending Fundamentals of Programming. Our future work will be oriented to monitor the effectiveness of this early intervention with Scratch and to develop other pedagogical alternatives that contribute to decrease this dropout rate. In this way, we aim to contribute to the United Nations Sustainable Development Goal 4 (Quality Education, https://www.un.org/sustainabledevelopment/education/, accessed on 21 April 2021), which aims, among other things, to ensure that the proportion of students who start higher education remains stable until the end of their studies.
Finally, it is important to note that our future work will be aimed at addressing the limitations of this study. On the one hand, we plan to test whether the results obtained here can be generalized to a larger sample of students. On the other hand, the technological acceptance of Scratch by students and teachers should be investigated as well. Based on similar experiences in the context of learning management systems such as Moodle [32,33], we plan to develop a study based on existing technology acceptance models to understand the determinants of such acceptance.

Author Contributions

Conceptualization, D.B. and Á.P.-J.; methodology, J.C.-C. and J.M.-L.; software, P.N.-H.; formal analysis, J.C.-C. and A.P.; investigation, J.C.-C. and P.N.-H.; resources, J.C.-C.; data curation, P.N.-H.; writing—original draft preparation, J.C.-C., A.P. and P.N.-H.; writing—review and editing, J.M.-L., Á.P.-J. and D.B.; visualization, A.P. and P.N.-H.; supervision, D.B. and Á.P.-J.; project administration, J.C.-C.; funding acquisition, J.C.-C. All authors have read and agreed to the published version of the manuscript.

Funding

This research received no external funding.

Informed Consent Statement

Informed consent was obtained from all subjects involved in the study.

Conflicts of Interest

The authors declare no conflict of interest.

Appendix A. Structure of the Midterm Exam Administered to the Students

Table A1. Structure of the midterm exam administered to the students. Each question was evaluated with a score of 10 points.
TopicLearning GoalQuestion StatementQuestion Type
VariableTo know the definitionChoose the option that best defines a variable:Multiple choice (one correct option)
To identify the use of the conceptSelect the options where the use of variables is justified:Multiple choice (more than one is correct)
ConditionalsTo know the definitionA conditional test is:Multiple choice (one correct solution)
To identify the use of the conceptSelect the options in which the use of a conditional structure is justified:Multiple choice (more than one is correct)
LoopsTo know the definitionA loop in programming allows:Multiple choice (one correct solution)
To identify the use of the conceptSelect the options that you consider appropriate for the application of a loop:Multiple choice (more than one is correct)
AlgorithmsTo know the definitionAn algorithm is:Multiple choice (one correct option)
To identify the use of the conceptConsider the following flowcharts and choose the one that is an algorithm:Multiple choice (more than one is correct)
IntegrativeTo apply the concepts learnedConsider that a Facebook user has 5 friends and you are required to simulate for the span of 100 days the functionalities of adding and removing friends. Each day 0 to 5 friends can be added/removed randomly. It is necessary to avoid that the number becomes negative, in which case you would have to start with 5 friends. At the end of the simulation you need to obtain the final number of friends, the highest number of friends reached during the 100 days, as well as the lowest. Select the flowchart that solves the problem correctly.Multiple options (one correct option)

References

  1. Kalelioğlu, F. A new way of teaching programming skills to K-12 students: Code.org. Comput. Hum. Behav. 2015, 52, 200–210. [Google Scholar] [CrossRef]
  2. Henrich, J.; Heine, S.J.; Norenzayan, A. Beyond WEIRD: Towards a broad-based behavioral science. Behav. Brain Sci. 2010, 33, 111. [Google Scholar] [CrossRef]
  3. Niess, M. Preparing teachers to teach science and mathematics with technology: Developing a technology pedagogical content knowledge. Teach. Teach. Educ. 2005, 21, 509–523. [Google Scholar] [CrossRef]
  4. Medeiros, R.P.; Ramalho, G.L.; Falcão, T.P. A Systematic Literature Review on Teaching and Learning Introductory Programming in Higher Education. IEEE Trans. Educ. 2019, 62, 77–90. [Google Scholar] [CrossRef]
  5. Byun, S.Y.; Meece, J.L.; Irvin, M.J. Rural-nonrural disparities in postsecondary educational attainment revisited. Am. Educ. Res. J. 2012, 49, 412–437. [Google Scholar] [CrossRef] [Green Version]
  6. Chen, C.; Haduong, P.; Brennan, K.; Sonnert, G.; Sadler, P. The effects of first programming language on college students’ computing attitude and achievement: A comparison of graphical and textual languages. Comput. Sci. Educ. 2019, 29, 23–48. [Google Scholar] [CrossRef]
  7. Malan, D.J.; Leitner, H.H.; Malan, D.J.; Leitner, H.H. Scratch for budding computer scientists. ACM Sigcse Bull. 2007, 39, 223–227. [Google Scholar] [CrossRef]
  8. Yoon, I.; Kim, J.; Lee, W. The analysis and application of an educational programming language RUR-PLE for a pre-introductory computer science course. Clust. Comput. 2016, 19, 529–546. [Google Scholar] [CrossRef]
  9. Gǿmes, A.; Méndez, A. An environment to improve programming education. In Proceedings of the International Conference on Computer Systems and Technologies-CompSysTech’07 Proceedings, Rousse, Bulgaria, 14–15 June 2007; Volume 40, p. 88. [Google Scholar]
  10. Bau, D.; Gray, J.; Kelleher, C.; Sheldon, J.; Turbak, F. Learnable programming: Blocks and beyond. Commun. ACM 2017, 60, 72–80. [Google Scholar] [CrossRef]
  11. Willem, J.; Alderliesten, D.; Guijt, A.; Doolaard, F.; Stegman, L.; Tilro, J. Identifying Characteristics of Block-Based Programming Languages Supporting Children in Learning Robotics Programming. 2017, pp. 1–18. Available online: https://casbuijs.nl/paper-storage/characteristics-bbpl.pdf (accessed on 21 April 2021).
  12. Jaramillo, E.D. Incidencia de la Implementación del Ambiente de Programación Scratch, en los Estudiantes de Media Técnica, Para el Desarrollo de la Competencia Laboral General de Tipo Intelectual Exigida por el Ministerio de Educación Nacional Colombiano. Master’s Thesis, Universidad Autónoma de Bucaramanga, Bucaramanga, Colombia, 2013. [Google Scholar]
  13. Koorsse, M.; Cilliers, C.; Calitz, A. Programming assistance tools to support the learning of IT programming in South African secondary schools. Comput. Educ. 2015, 82, 162–178. [Google Scholar] [CrossRef]
  14. Cárdenas-Cobo, J.; Puris, A.; Novoa-Hernández, P.; Galindo, J.; Benavides, D. Recommender Systems and Scratch: An Integrated Approach for Enhancing Computer Programming Learning. IEEE Trans. on Learn. Tech. 2020, 13, 387–403. [Google Scholar] [CrossRef]
  15. Maloney, J.; Peppler, K.; Kafai, Y.; Resnick, M.; Rusk, N. Programming by choice: Urban youth learning programming with scratch. In Proceedings of the 39th SIGCSE Technical Symposium on Computer Science Education, Portland, OR, USA, 12–15 March 2008; pp. 367–371. [Google Scholar]
  16. Malan, D.J.; Leitner, H.H. Scratch for Budding Computer Scientists. In Proceedings of the 38th SIGCSE Technical Symposium on Computer Science Education, Covington, KY, USA, 7–11 March 2007; Volume 39, pp. 223–227. [Google Scholar]
  17. Wolz, U.; Leitner, H.H.; Malan, D.J.; Maloney, J.; Wolz, U.; Leitner, H.H.; Malan, D.J.; Maloney, J. Starting with scratch in CS 1. In Proceedings of the 40th ACM technical symposium on Computer science education—SIGCSE’09, Minneapolis, MN, USA, 27 February–2 March 2009; Volume 41, p. 2. [Google Scholar]
  18. Simpkins, N. I scratch and sense but can I program? An investigation of learning with a block based programming language. Int. J. Inf. Commun. Technol. Educ. 2014, 10, 87–116. [Google Scholar] [CrossRef]
  19. Xinogalos, S.; Satratzemi, M.; Malliarakis, C. Microworlds, games, animations, mobile apps, puzzle editors and more: What is important for an introductory programming environment? Educ. Inf. Technol. 2017, 22, 145–176. [Google Scholar] [CrossRef]
  20. Uzunboylu, H.; Kinik, E.; Kanbul, S. An analysis of countries which have integrated coding into their curricula and the content analysis of academic studies on coding training in Turkey. TEM J. 2017, 6, 783–791. [Google Scholar] [CrossRef]
  21. Erol, O.; Kurt, A. The effects of teaching programming with scratch on pre-service information technology teachers’ motivation and achievement. Comput. Hum. Behav. 2017, 77, 11–18. [Google Scholar] [CrossRef]
  22. Tang, K.Y.; Chou, T.L.; Tsai, C.C. A Content Analysis of Computational Thinking Research: An International Publication Trends and Research Typology. Asia-Pac. Educ. Res. 2020, 29, 9–19. [Google Scholar] [CrossRef]
  23. Roque, R.; Rusk, N.; Resnick, M. Supporting diverse and creative collaboration in the Scratch online community. In Mass Collaboration and Education; Springer: Berlin/Heidelberg, Germany, 2016; pp. 241–256. [Google Scholar]
  24. Resnick, M. Mother’s day, warrior cats, and digital fluency: Stories from the scratch online community. In Proceedings of the Constructionism 2012 Conference: Theory, Practice and Impact, Seoul, Korea, 8–15 July 2012; pp. 52–58. [Google Scholar]
  25. Moreno-León, J.; Robles, G.; Román-González, M. Examining the Relationship between Socialization and Improved Software Development Skills in the Scratch Code Learning Environment. J. UCS 2016, 22, 1533–1557. [Google Scholar]
  26. Dasgupta, S.; Hale, W.; Monroy-Hernández, A.; Hill, B.M. Remixing as a pathway to computational thinking. In Proceedings of the 19th ACM Conference on Computer-Supported Cooperative Work & Social Computing, San Francisco, CA, USA, 27 February–2 March 2016; pp. 1438–1449. [Google Scholar]
  27. Manunure, K.; Delserieys, A.; Castéra, J. The effects of combining simulations and laboratory experiments on Zimbabwean students’ conceptual understanding of electric circuits. Res. Sci. Technol. Educ. 2019, 38, 289–307. [Google Scholar] [CrossRef]
  28. Valenzuela, J.; Flores, M. Fundamentos de Investigación Educativa; Editorial Digital del Tecnológico de Monterrey: Monterrey, Mexico, 2012; Volume 2, Chapter 1. [Google Scholar]
  29. Bandalos, D. Measurement Theory and Applications for the Social Sciences; Methodology in the Social Sciences; Guilford Publications: New York, NY, USA, 2018. [Google Scholar]
  30. Zaki, M.; Meira, W. Data Mining and Machine Learning: Fundamental Concepts and Algorithms; Cambridge University Press: Cambridge, UK, 2020; p. 779. [Google Scholar]
  31. Tangney, B.; Oldham, E.; Conneely, C.; Barrett, S.; Lawlor, J. Pedagogy and processes for a computer programming outreach workshop—The bridge to college model. IEEE Trans. Educ. 2010, 53, 53–60. [Google Scholar] [CrossRef]
  32. García-Murillo, G.; Novoa-Hernández, P.; Rodríguez, R.S. Technological Satisfaction About Moodle in Higher Education—A Meta-Analysis. IEEE Rev. Iberoam. Tecnol. Del Aprendiz. 2020, 15, 281–290. [Google Scholar] [CrossRef]
  33. García-Murillo, G.; Novoa-Hernández, P.; Rodriǵuez, R.S. Technological acceptance of Moodle through latent variable modeling—A systematic mapping study. Interact. Learn. Environ. 2020. [Google Scholar] [CrossRef]
Figure 1. Workflow followed in this research project.
Electronics 10 01180 g001
Figure 2. Descriptive summary of the students’ characteristics for variables: age (a), gender (b), parental education level (c), socioeconomic level (d), previous high school grades (e), and previous baccalaureate grades (f).
Electronics 10 01180 g002
Figure 3. Percentages of satisfaction with Scratch (questionnaire Q2, Table 1).
Electronics 10 01180 g003
Figure 4. Distribution of the scores achieved by the students in the midterm exam (a) and proportion of passing and failing students (b). A student is considered to pass when the corresponding score is greater than or equal to 70 (this cutoff is represented by the red dashed line in plot (a)).
Electronics 10 01180 g004
Figure 5. Fitted decision tree for explaining student passing (Yes) and failing (No) from demographics variables, previous grades and course motivation (items A1–A13, Table 1).
Electronics 10 01180 g005
Table 1. Questionnaires used in this research.
QuestionnaireCodeVariable/Item
(Q1) DemographicsA1Age.
A2Sex: {Female, Male}.
A3Parent’s level of education: {No formal education, Primary, High school, Technical studies, Higher education}.
A4Socioeconomic level of their parents: {Low, Medium, High}.
Previous gradesA5Average grades in secondary education.
A6Average baccalaureate grades.
Pre-course motivations A7I took lessons in Fundamentals of Programming at school.
A8If I could choose any degree, I would choose this one.
A9I regularly do all homework set by the teacher.
A10I regularly go to class.
A11I am interested in Fundamentals of Programming.
A12I think that I am intelligent enough to pass the Fundamentals of Programming course.
A13I think that I will pass the Fundamentals of Programming course.
(Q2) Satisfaction with Scratch B1I am more likely to be promoted if I use the Scratch teaching tool.
B2I believe that the Scratch tool will contribute towards improving my grades in Fundamentals of Programming.
B3I believe that Scratch can contribute to the methodologies used by the teacher of Fundamentals of Programming.
B4I would like to attend courses to learn the concepts and uses of the Scratch tool.
B5I would like Scratch software to be considered as a pedagogical tool to teach Fundamentals of Programming.
B6The inclusion of Scratch in the content of Fundamentals of Programming positively changed my perspective of the subject.
B7It was necessary to have previous programming knowledge in order to use the Scratch tool.
B8I think that using Scratch instead of other teaching methods can improve the students’ grades in the subject Fundamentals of Programming.
B9I think that using Scratch instead of other programming methods can increase students’ interest and motivation in Fundamentals of Programming.
(Q3) Satisfaction with the teaching method C1I believe that I have achieved solid and long-lasting learning in Fundamentals of Programming.
C2It has been easy to learn the subject.
C3I think what I have learned is applicable to other subjects of my degree.
C4I studied the subject with enthusiasm and interest.
C5I believe that what I have learned will apply to my professional future.
C6I am motivated to do activities outside the classroom to deepen or complement the knowledge I acquired in this subject.
C7I feel motivated to finish my degree.
C8I got good grades in the subject.
Measured using a Likert scale where Strongly disagree = 1, Disagree = 2, Neither agree nor disagree = 3, Agree = 4, Strongly agree = 5.
Table 2. Results of the t-test for equality of means (demographics variables).
Variabletdfp-ValueMean Difference
Age1.84374.00.2050.743
Parents’ education level1.78273.40.0730.441
Socioeconomic level0.62170.00.5510.054
Average high school grades0.57871.20.6210.052
Average baccalaureate grades0.31948.10.7620.091
Table 3. Students’ motivation from questions (items A7–A13, Table 1).
GroupnMeanSDSE
MotivationControl384.2350.8180.121
Experimental364.2740.5980.069
Table 4. Results from the t-test for equality of means (students’ motivation).
tdfp-ValueMeans’ Difference
Motivation0.76469.30.128−0.293
Table 5. Descriptive summary of items from questionnaire Q3 (satisfaction with the teaching method, Table 1).
ItemGroupnMeanSD.SE.
C1Control381.3320.4790.083
 Experimental361.3030.4620.061
C2Control383.3710.9700.157
 Experimental363.0320.9580.122
C3Control384.0510.9280.151
 Experimental363.842.8340.106
C4Control384.213.9630.156
 Experimental363.8420.8720.111
C5Control384.0511.2070.196
 Experimental364.1620.8720.111
C6Control384.0010.9860.160
 Experimental363.8910.8320.106
C7Control384.4720.9790.159
 Experimental364.3120.8790.112
C8Control382.9541.3350.216
 Experimental363.2121.1890.151
Table 6. Results of the t-test for equality of means. Questionnaire Q3 (satisfaction about the teaching method, Table 1).
Itemtdfp-ValueMean Difference
C10.343740.7330.035
C21.695740.0930.336
C31.193740.2360.214
C41.989740.0520.372
C5−0.521740.603−0.109
C60.613740.5410.113
C70.884740.3790.167
C8−1.022740.309−0.262
Table 7. Results of the t-test for equality of means. (Students’ scores in the midterm exam).
Variabletdfp-ValueMean Difference
Score−2.352740.02113.681
Table 8. Confusion matrix corresponding to the decision tree.
Reference (Data)
Prediction (Decision Tree)Passing = NoPassing = Yes
Passing = No467
Passing = Yes714
Publisher’s Note: MDPI stays neutral with regard to jurisdictional claims in published maps and institutional affiliations.