Article

Anti-Skin-Aging Effect of a Treatment with a Cosmetic Product and a Food Supplement Based on a New Hyaluronan: A Randomized Clinical Study in Healthy Women

1
R&D Department, Roelmi HPC SRL, Via Celeste Milani 24/26, 21040 Origgio, Italy
2
In Vivo Laboratory, Complife Italia SRL, Via Mons. C. Angelini, 21, 27028 San Martino Siccomario, Italy
*
Author to whom correspondence should be addressed.
Cosmetics 2022, 9(3), 54; https://doi.org/10.3390/cosmetics9030054
Submission received: 27 April 2022 / Revised: 23 May 2022 / Accepted: 24 May 2022 / Published: 27 May 2022

Abstract

:
Hyaluronic acid (HA) has long been used for its anti-age properties, as an ingredient in both topical applications and food supplements. In this study, a novel sodium hyaluronate, based on the innovative full spectrum technology, was administered as an ingredient of a cosmetic product and as the main constituent of a food supplement to evaluate its efficacy in counteracting skin ageing signs. Seventy-five female subjects were randomly assigned to the following treatments for 4 weeks: an active food supplement and a placebo cosmetic product, an active cosmetic product and a placebo food supplement, and a combination of the two products containing the active ingredient, that is, an “In&Out” treatment. The subjects used the placebo cosmetic product for another 14 days. Improvement of all the outcome measures (skin moisturization, elasticity, firmness and profilometry) was achieved by all treatments (p < 0.05); however, the combined treatment resulted in a further amelioration of the skin aging signs with respect to the two single active treatments (p < 0.001), and such effect lasted also after the follow-up period. In conclusion, such results confirmed that the concomitant administration of hyaluronans by these two different routes represents more than an interesting approach to counteract skin aging signs.

1. Introduction

The skin, the largest organ of the human body, like all other organs, physiologically undergoes aging, an unavoidable process due to intrinsic causes such as chronological, hormonal and genetic factors as well as to extrinsic factors, mainly ultra-violet irradiation (UVR) and exposure to pollution, since the skin represents the main barrier to the external environment [1,2]. Furthermore, diet and physical activity contribute to skin ageing, along with anxiety, stress and smoking habits [2]. As several modes of skin aging have been proposed in terms of their cellular and molecular mechanism(s) [3], reactive oxygen species (ROS) or free radicals resulting from UV rays are recognized as the main contributors of skin aging (photo aging) [1]. Skin aging signs, such as dryness, roughness, appearance of wrinkles and pigmented spots and decreased barrier function, are the main histological changes resulting from skin structural and functional alteration [4,5,6].
The main components of the skin are collagen and elastin, which form and maintain its 3D structure, and glycosaminoglycans (GAG), among which the most relevant is hyaluronic acid (HA), a major component of the extracellular matrix (ECM), which due to its high hydrophilic properties, preserves moisturization and firmness of the ECM [7,8]. The collagen and elastin content decreases with age, and the skin gradually loses its mechanical tension [4]. The HA content of the skin also decreases with aging: the HA amount in the skin of a 75-year-old person is less than one-quarter of that in the skin of a 19-year-old subject [8,9,10]. In senile skin, HA is still present in the dermis, while it entirely disappears in the epidermis [8,10] and also becomes more tissue-associated, a condition that may decrease its hygroscopic ability with the consequence of a loss of skin moisture [8,11].
HA, also called hyaluronan, is a linear, flexible, long-polymer-chain natural polysaccharide, composed of repeated disaccharide sequences of D-glucuronic acid and N-acetyl-D-glucosamine linked through alternating β-1,4 and β-1,3 glycosidic bonds [12].
It is synthetized mostly by mesenchymal cells [13,14] and undergoes a continuous degradation process mediated by hyaluronidases or oxidative damage [12,15], both of which reduce the original polymer size. It has been suggested that the balance of these synthesis/degradation processes of HA in the human body could have a relevant regulatory role, as the output of the process determines not only the amount of HA but also its size [16,17], indicating that the polymer size and the circumstances of its synthesis or degradation determine its biological actions [16,17].
HA has a potential important role in anti-aging skin treatments due to its ability to restore moisture in the cutaneous layers and to promote endogenous collagen synthesis through its physicochemical features, dermal fibroblasts stimulation and antioxidant effects, as well through the signaling properties of HA fragments [16,18].
HA has been used in cosmetic formulations for a long time, since it is reported to actively penetrate the corneum layer [19,20], improve hydration, smoothness and elasticity, and delay wrinkles and deep lines formation [21]; HA is also delivered in injectable formulas [22], and both approaches maintain, from the outside, the skin content of HA, which has a short-half life, of about 1–2 days, in the skin [16]. Furthermore, over the last years, several pieces of evidence have indicated that administering HA also by the oral route can achieve relevant results to counteract skin aging, thus improving its diffusion in nutricosmetics applications [8,9,16,23,24]. Therefore, considering that HA supplementation can improve physiological HA deficiency, the combination of cutaneous and oral HA administrations in a complementary and simultaneous “In&Out” treatment could represent, in the first instance, an innovative and effective approach to proactively prevent all clinical signs associated with skin aging, thus promoting a skin rejuvenation effect, moisturization and photoprotection [21]; furthermore, by modulating the range of the polymer size of HA used in the treatment, additional information about the biological effectiveness of hyaluronans could be achieved [21,25,26,27].
This present clinical study aimed at evaluating the skin anti-aging effect of a combined treatment consisting of a cosmetic product containing PrincipHYAL® Difference and a food supplement containing ExceptionHYAL® Star. Both ingredients contain hyaluronans based on Full Spectrum Hyaluronan (FS-HA), produced through a precise modulation of different steps of the fermentation process, resulting in a product which is characterized by HA polymers with a wide and specific spectrum of sizes [28]. The result is an ingredient which is similar to HA physiologically present in the skin, providing differentiation signals to cells and having a rheostat-like effect. The two ingredients were administered, alone and in combination, to healthy adult Caucasian female subjects in a double-blind, randomized, clinical study for a period of 4 weeks, with a 14-day follow-up period using only a placebo cosmetic product.
Instrumental parameters related to skin aging were evaluated every 2 weeks. A questionnaire was administered at the end of the treatments period and after the follow-up period in order to evaluate the tolerability of the products and the perceived efficacy.

2. Materials and Methods

2.1. Study Subjects

Seventy-five healthy adult female subjects (mean age 55.8 ± 7.3) were enrolled by a dermatologist according to the following main exclusion criteria: no intensive exposure to UV rays during the study period, no extensive exposure to UV rays in the 4 weeks prior to the study, not using products (cosmetic or food supplement) with activity comparable to that of the study products, not pregnant/breastfeeding and adopting an adequate contraceptive system, not under a local pharmacological treatment in the skin area monitored during the test or under treatment with food supplements that could interfere with the functionality of the test products.

2.2. Investigational Products

The following products were tested: an Active Food Supplement (AFS), consisting of capsules containing 200 mg of ExceptionHYAL® Star, L-ascorbic Acid, Gelatin, Maltodextrins, Magnesium salts of fatty acids, Silicon dioxide and Titanium Dioxide; a Placebo Food Supplement (PFS), consisting of capsules containing only excipients and colorants. AFS and PFS capsules were provided by Roelmi HPC SRL and showed the same aspect, size, color, and odor; an Active Cosmetic Product (ACP) containing 0.5% (w/w) PrincipHYAL® Difference and having the following qualitative composition as INCI (International Nomenclature Cosmetic Ingredient): Aqua, Helianthus Annus Seed Oil, Coco Caprylate /Caprate, Polyglyceryl-3 Methyl Glucose Distearate, Cetearyl Alcohol, Glyceryl Stearate, Sodium Hyaluronate, Caprylyl Glycol, Ethylhexyl Glycerin, O-Cymen-5-ol, Disodium EDTA, Parfum; a Placebo Cosmetic Product (PCP) having the same composition of ACP but without the Sodium Hyaluronate. ACP and PCP were provided by Roelmi HPC SRL and showed the same physicochemical characteristics; both products were placed in 50 mL anonymous PE jars.

2.3. Study Design

This single-center, double blind, randomized, clinical study was carried out at the Complife Italia SRL facilities in compliance with the Helsinki Declaration (1964) and amendments. Enrolled subjects were randomly assigned to 3 groups of 25 subjects each as follows: group G1 used PCP + AFS; group G2 used ACP + PFS; group G3 used the complete active treatment, i.e., ACP + AFS. Subjects were instructed to apply, for 28 days, a nutshell of the cosmetic product (PCP or ACP) in the morning on a clean face, massaging until complete absorption, and to swallow a capsule of food supplement (PFS or AFS) with a glass of water between meals. The subjects from all groups were then asked to apply a cosmetic cream (unknown to the subjects, but actually PCP) for further 14 days (follow-up). Clinical visits were planned at baseline (T0), after 14 (T14) and 28 (T28) days of use of both products, and 42 days (T42) after the additional period of PCP use. During the visits, study eligibility was assessed, and instrumental measurement were carried out; subjects were also asked to fill a self-assessment questionnaire. Written informed consent was obtained from all participants. The study protocol and the Informed Consent Form were approved on 4 September 2019 by the “Independent Ethical Committee for Non-Pharmacological Clinical studies” Genova, Italy (Ref: 2019/09). The Clinical study was pre-registered (ISRCTN-39211).

2.4. Sample Size

The sample size was calculated with a two-sided 5% significance level and a power of 80% taking into account a 20% variation of the primary endpoints due to both inter-individual human variability and error in the measurement techniques. The sample size was calculated using PASS 11 statistical software (version 11.0.8 for Windows) running on Windows Server 2008 R2 Standard SP1 64-bit edition (Microsoft, Redmond, Washington, USA). A sample size of 20 subjects per group was necessary, given an expected dropout rate of 20%.

2.5. Blinding and Randomization

The jars containing the cosmetic products and the tubes containing the food supplements were identical except for their batch numbers. A technician not involved in the study assembled the combination of the testing products according to their batch numbers, placing them in boxes identified by numerical codes. Assignment of the treatment to the subjects was carried out by a randomization list generated using an appropriate statistic algorithm (“Wei’s urn”), an urn design for sequential trials comparing m ≥ 2 treatments with equal allocations. The study adhered to established procedures to maintain separation between the investigator and its collaborators and the staff that delivered the intervention. Subjects, investigator, and collaborators were kept masked to products assignment. Investigator and its collaborators who obtained outcome measurements were not informed on the (masked) product group assignment. Allocation sequence was kept blank up to the data analysis.

2.6. Outcome Measures

Clinical and instrumental evaluations were carried out under controlled conditions (temperature 20 ± 2°C and relative humidity 50 ± 10%), by letting the subjects acclimatize for 15–20 min before each visit. Skin moisturization was measured on the face according to the Corneometer® method, using the Corneometer® CM 825 (Courage + Khazaka, electronic GmbH). The distribution of hydration on the skin surface was obtained by the MoistureMap MM 100, a device featuring a capacitance-based sensor that provides graphical information on the near-surface hydration distribution and the microtopography of the skin. The distribution of hydration on the skin surface is expressed in terms of the Grey Index, in which the presence of conductive material (e.g., water) is depicted, in the image, as darker pixels, while nonconductive material results in pixels on the lighter side of a grey-level scale; therefore, a higher value of the Grey Index means a higher moisture distribution.
Skin elasticity and skin firmness were evaluated with the Cutometer® MPA 580 (Courage + Khazaka Electronic, Köln, Germany). Skin elasticity was calculated as the R2 ratio (Ua/Uf), that is the ratio between the final deformation (Uf) and the total deformation recovery of the skin (Ua) and indicates the ability of the skin to return to its original state after a stressing event: the closer the value is to 1, the more elastic the skin. Parameter R0 = Uf, that has an implication for skin firmness, was as well evaluated: a reduction of such parameter indicates an improvement of the skin ability to oppose to the deformation imposed by the probe during the suction phase. Skin profilometry was assessed using Primos 3D (Canfield Scientific Europe, BV, Utrecht, Netherlands), a non-contact in vivo skin measurement device based on structured light projections that are capable of quantitatively evaluating skin surface properties (i.e., wrinkle depth, wrinkle volume, skin roughness, etc.); in this study, only wrinkle depth (Rv) and skin smoothness (Ra) were evaluated.

2.7. Self-Assessment Questionnaire

All participants received a copy of a 16-question self-assessment questionnaire related to products efficacy, specific characteristics (i.e., products compliance and agreeability) and tolerability; the dermatologist provided an exhaustive information about the questions and the 4-grade evaluation scale (agree, rather agree, rather disagree, disagree) to the participants. The questionnaire was filled by the participants during the 28th visit and was collected by the dermatologist. A new copy was provided to all participants who filled it after the follow-up period. The percentage of positive response (agree and rather agree) for each treatment was calculated, and it was assumed that the perceived efficacy was validated if at least 80% of the panel provided a positive feed-back

2.8. Statistics

Instrumental data were submitted to RM-ANOVA followed by the Tukey–Kramer test (intragroup analysis) and to Student’s t test for unpaired data (intergroup analysis). Variations were considered statistically significant when the p-value was <0.05. The statistical software used for statistical analysis was NCSS 10—PROFESSIONAL, vers. 10.0.7, released on 22 July 2015, running on Windows Server 2008 R2 Standard.

3. Results

3.1. Tolerability

All participants completed the study, and the tolerability of the cosmetic preparations and of the food supplements was very good according to their self-assessment. No serious adverse effect and no adverse effect were recorded throughout the whole study.

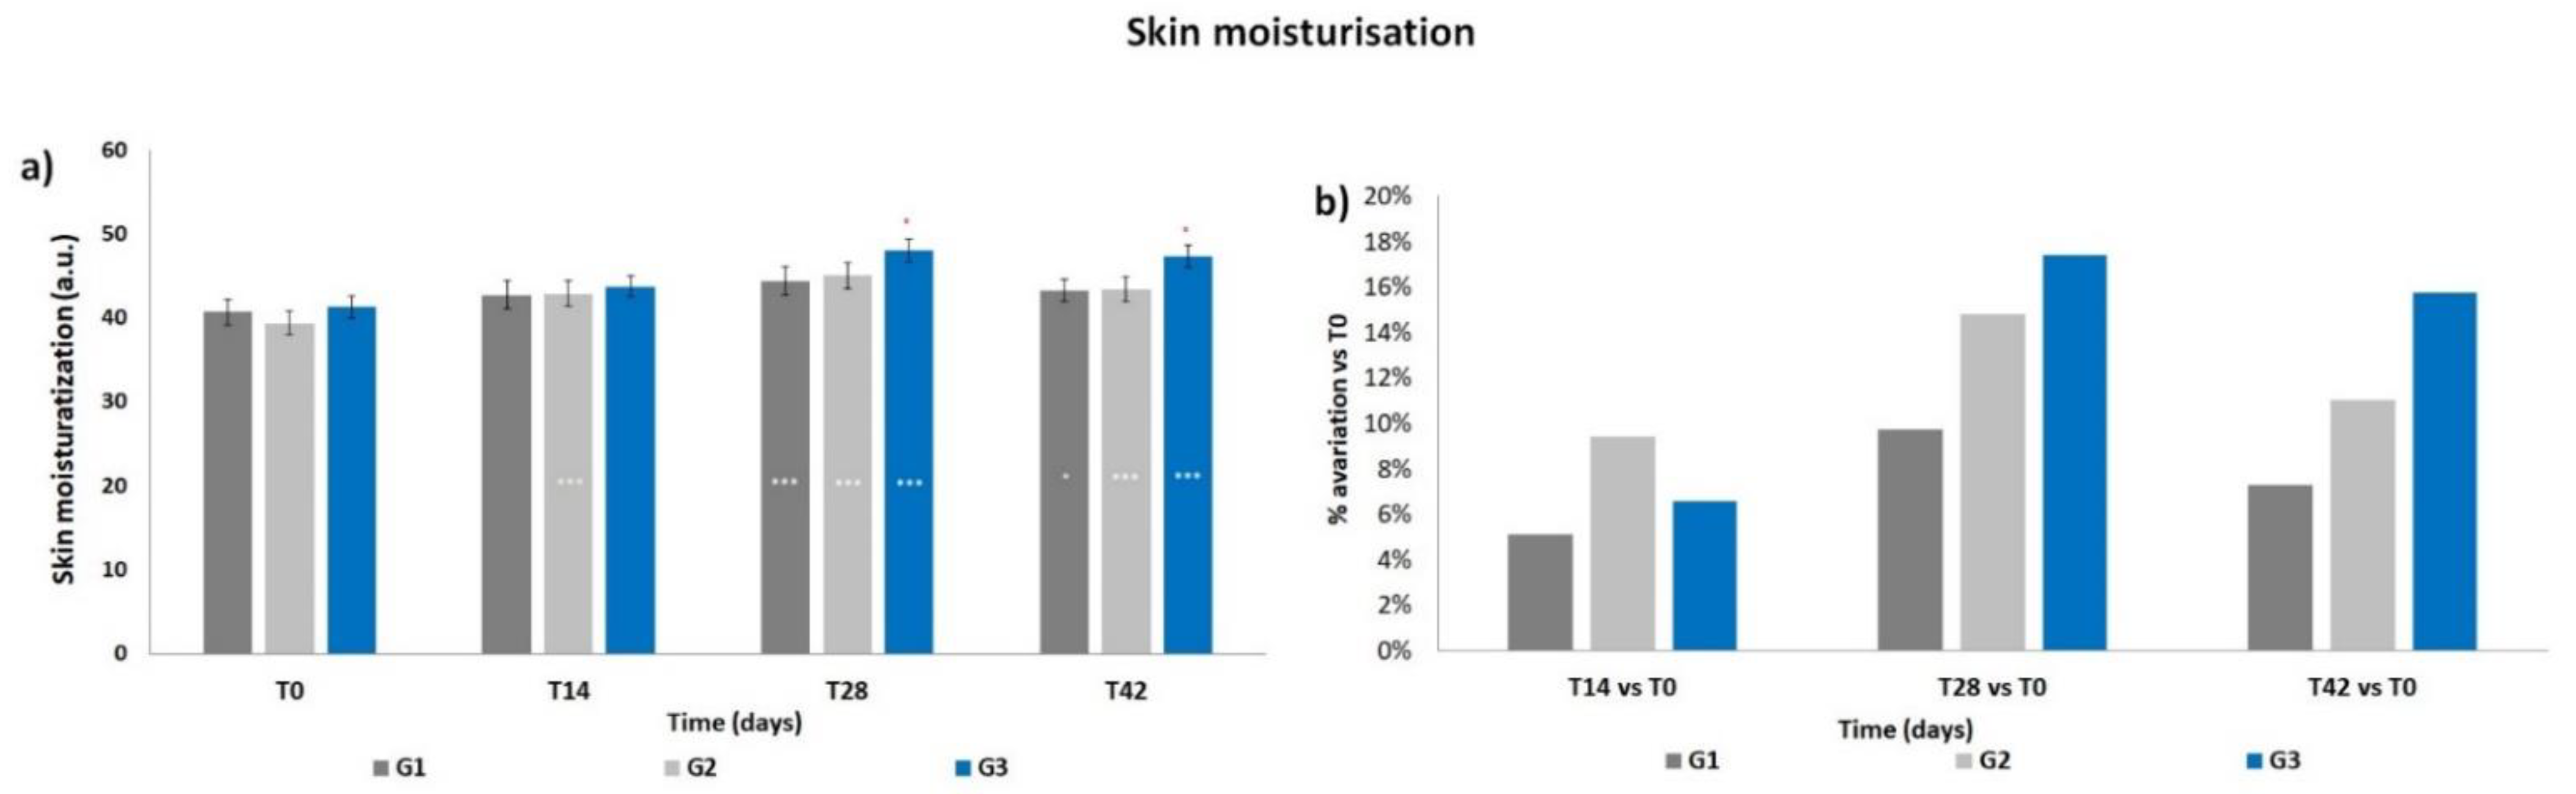
3.2. Skin Moisturization

The basal levels of skin moisturization showed a non-statistical difference between the three groups (Figure 1a). The corneometry results (arbitrary units) indicated a progressive increment in the mean skin moisturization throughout the products treatment period, that resulted significant at T14 for G2 (p < 0.001) and at T28 for all three groups (p < 0.001) with respect to T0. The moisturization levels decreased when measured after the follow-up period, i.e., after 14 days of using only PCP; however, such levels resulted statistically higher compared to those at T0 for G1 (p < 0.05) and for G2 and G3 (p < 0.001). A significant difference (p < 0.05) was observed for G3 vs. G1 at T28 and T42. Accordingly, all treatments induced an increment in terms of mean percentage variation of skin moisturization with respect to T0 (Figure 1b), reaching a peak at T28, then decreasing at T42. The G2 and G3 treatments, both containing ACP, resulted in a higher increment with respect to G1; the G3 treatment showed the maximal increment of mean percentage variation (+17.4% at T28).

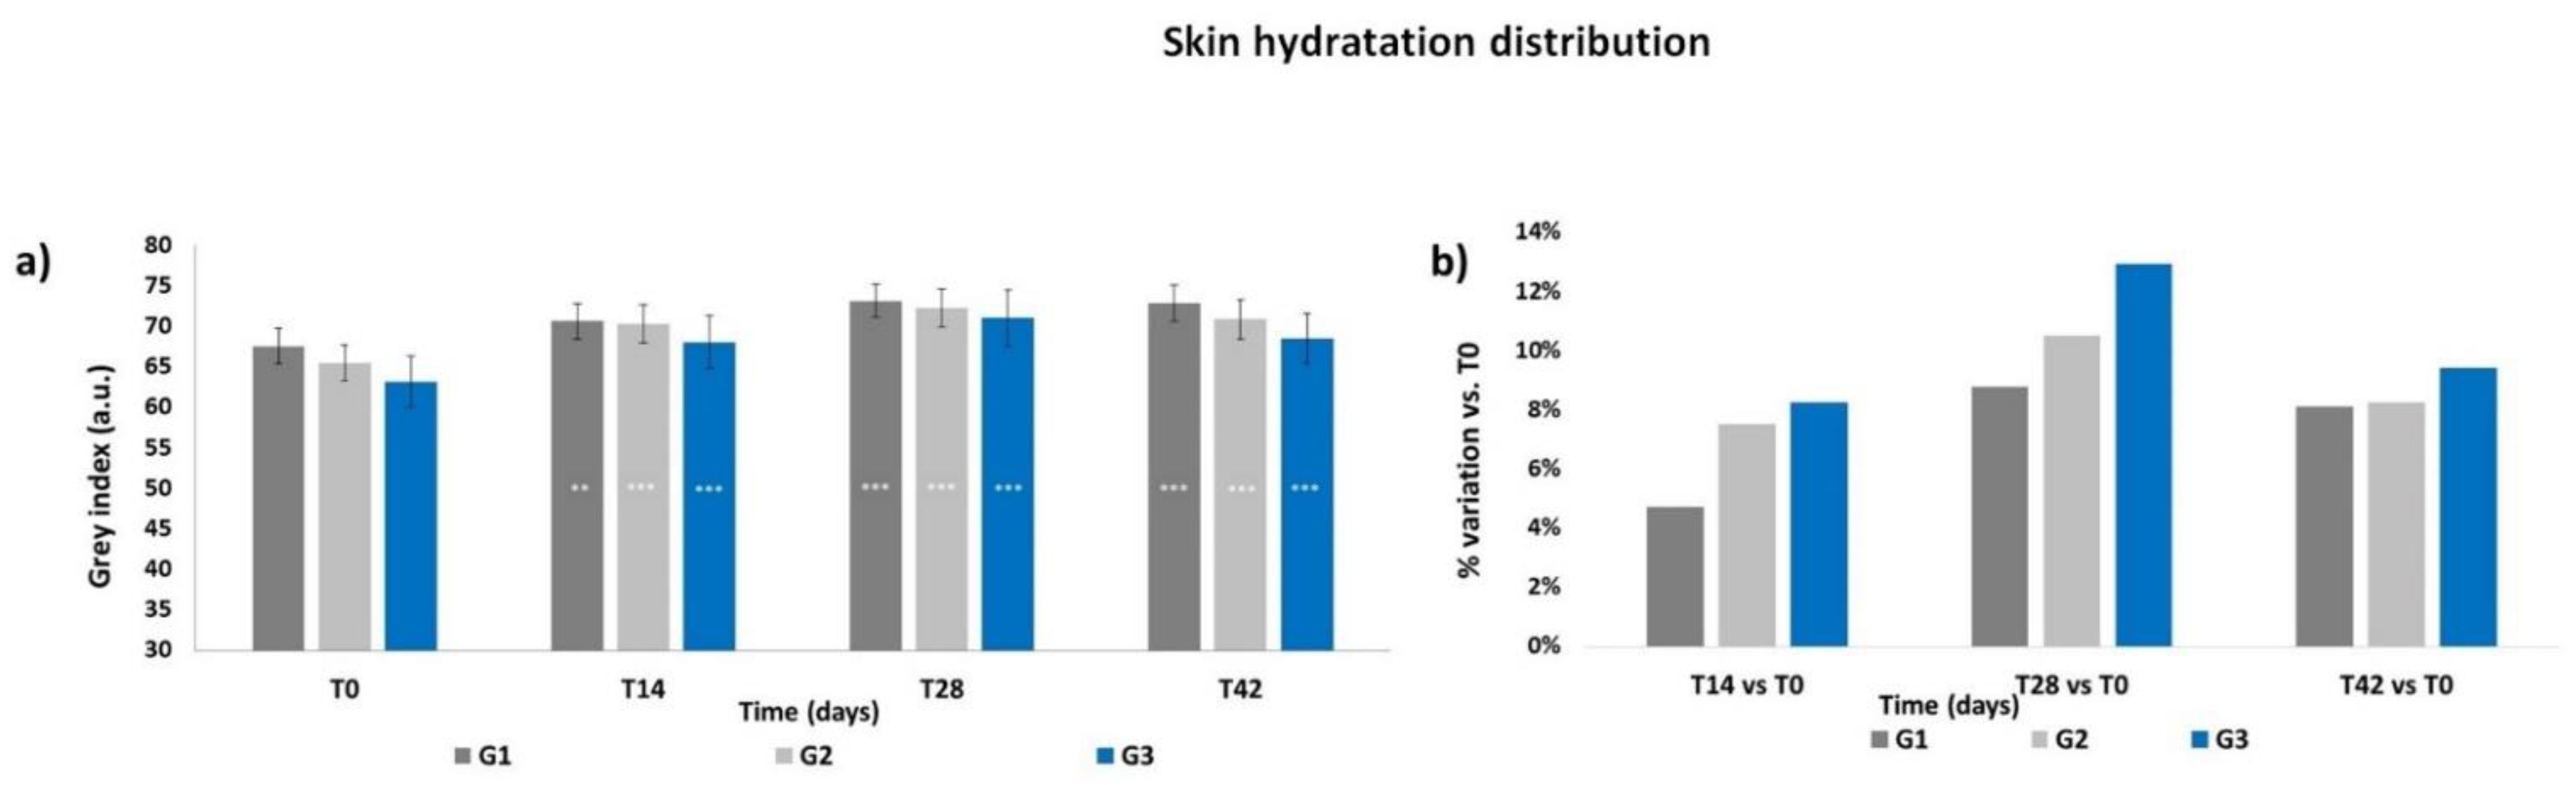
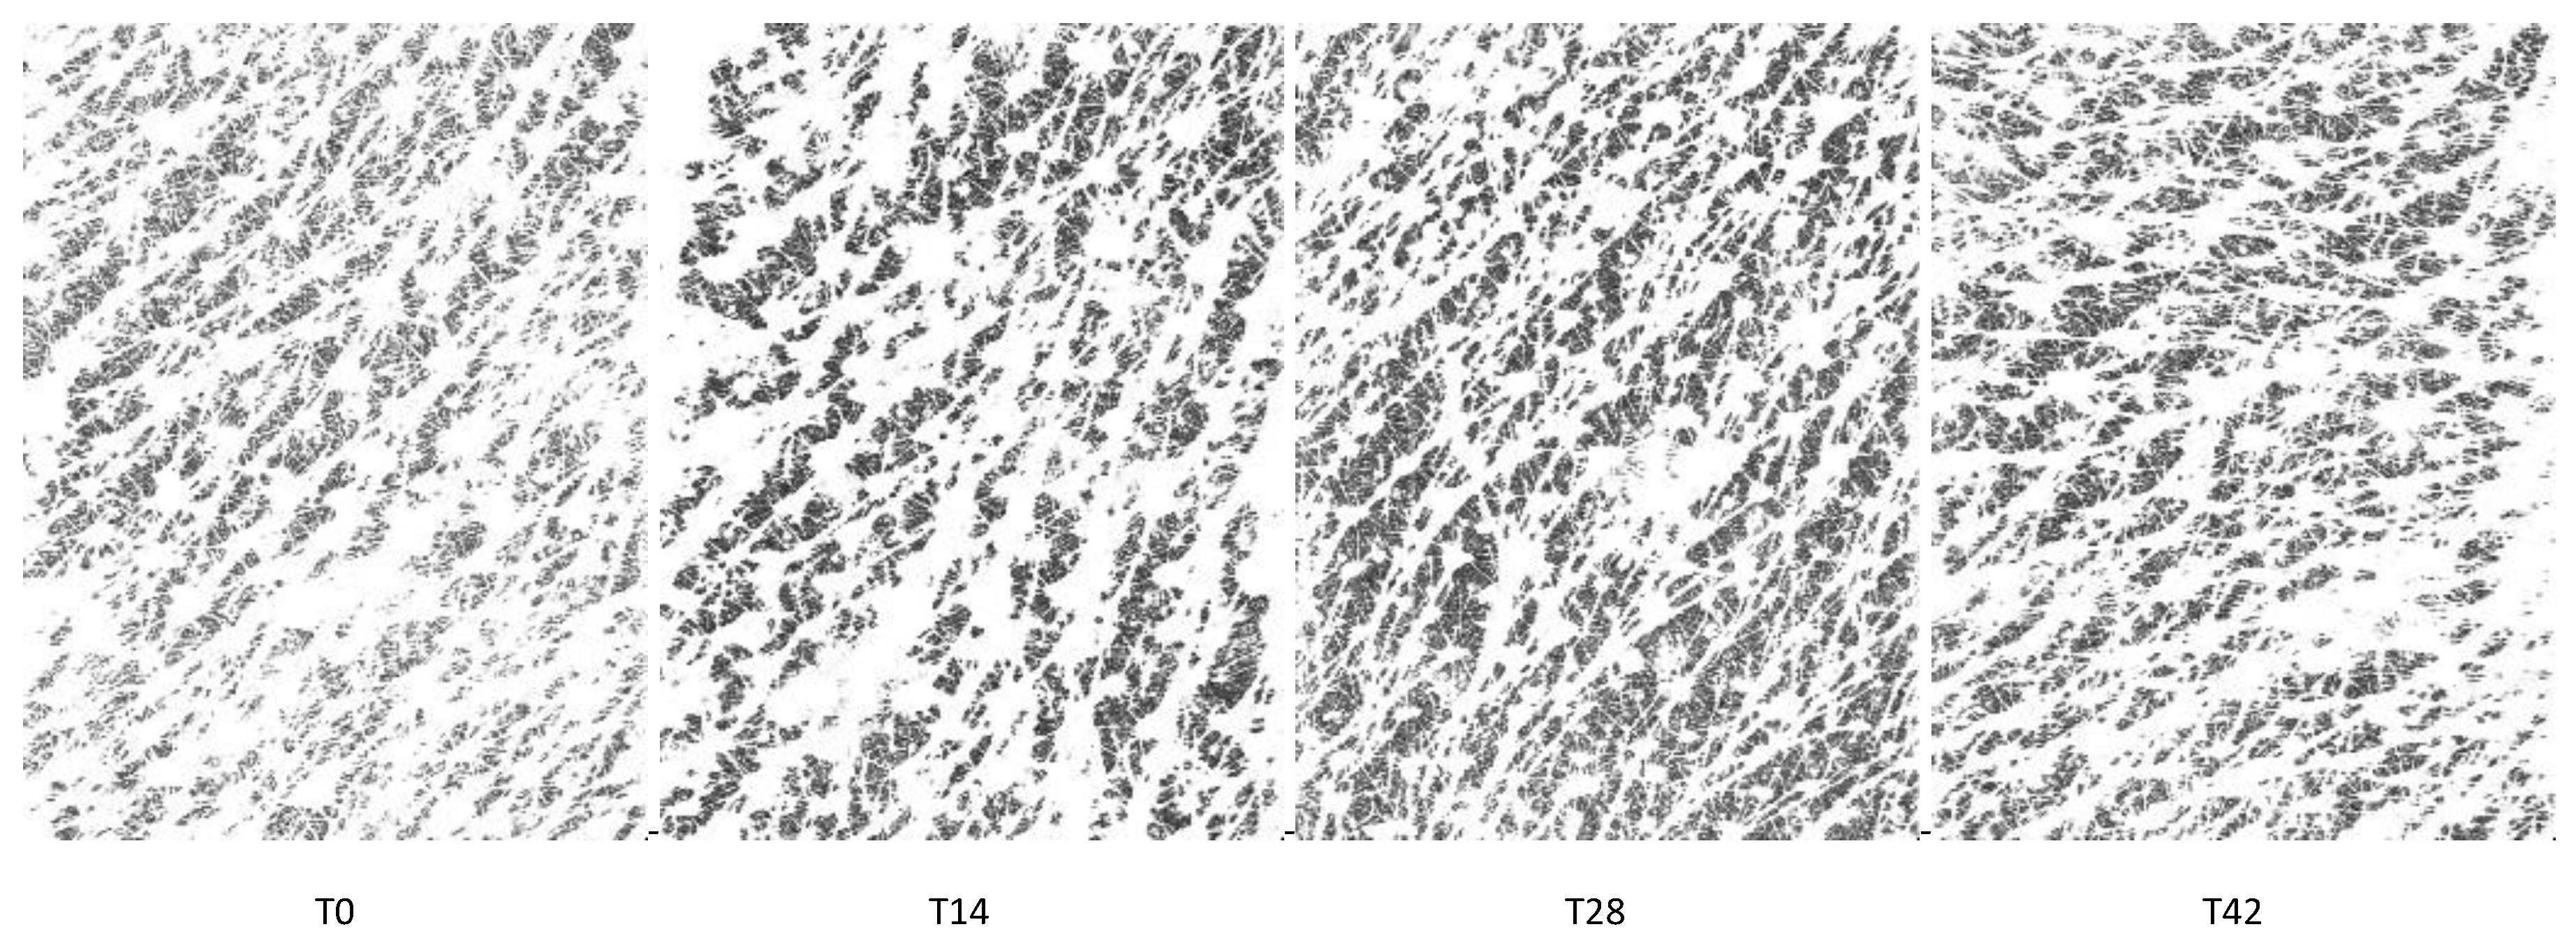
3.3. Skin Hydration Distribution

The Grey Index results showed a similar pattern as the skin moisturization results. At T0 (Figure 2a), the Grey Index did not show any significant differences between the groups, then a progressive increment of the mean Grey Index was recorded throughout the treatment period for all groups; the increase was already significant at T14 for G1 (p < 0.01) as well as for G2 and G3 (p < 0.001). The Grey Index decreased after the follow-up period; however, its levels at T42 were statistically higher for all treatments (p < 0.001) with respect to those at T0, with no significant intergroup differences. All treatments induced an increment in terms of mean percentage variation of the Grey Index with respect to T0, reaching a peak at T28 (Figure 2b), with the higher increment achieved by the G3 treatment (+12.9% at T28). Then, the Grey Index decreased at T42 but to levels that still were higher than those at T14. Moisturization Map images of a G3 subject throughout the study period are shown in Figure 3.

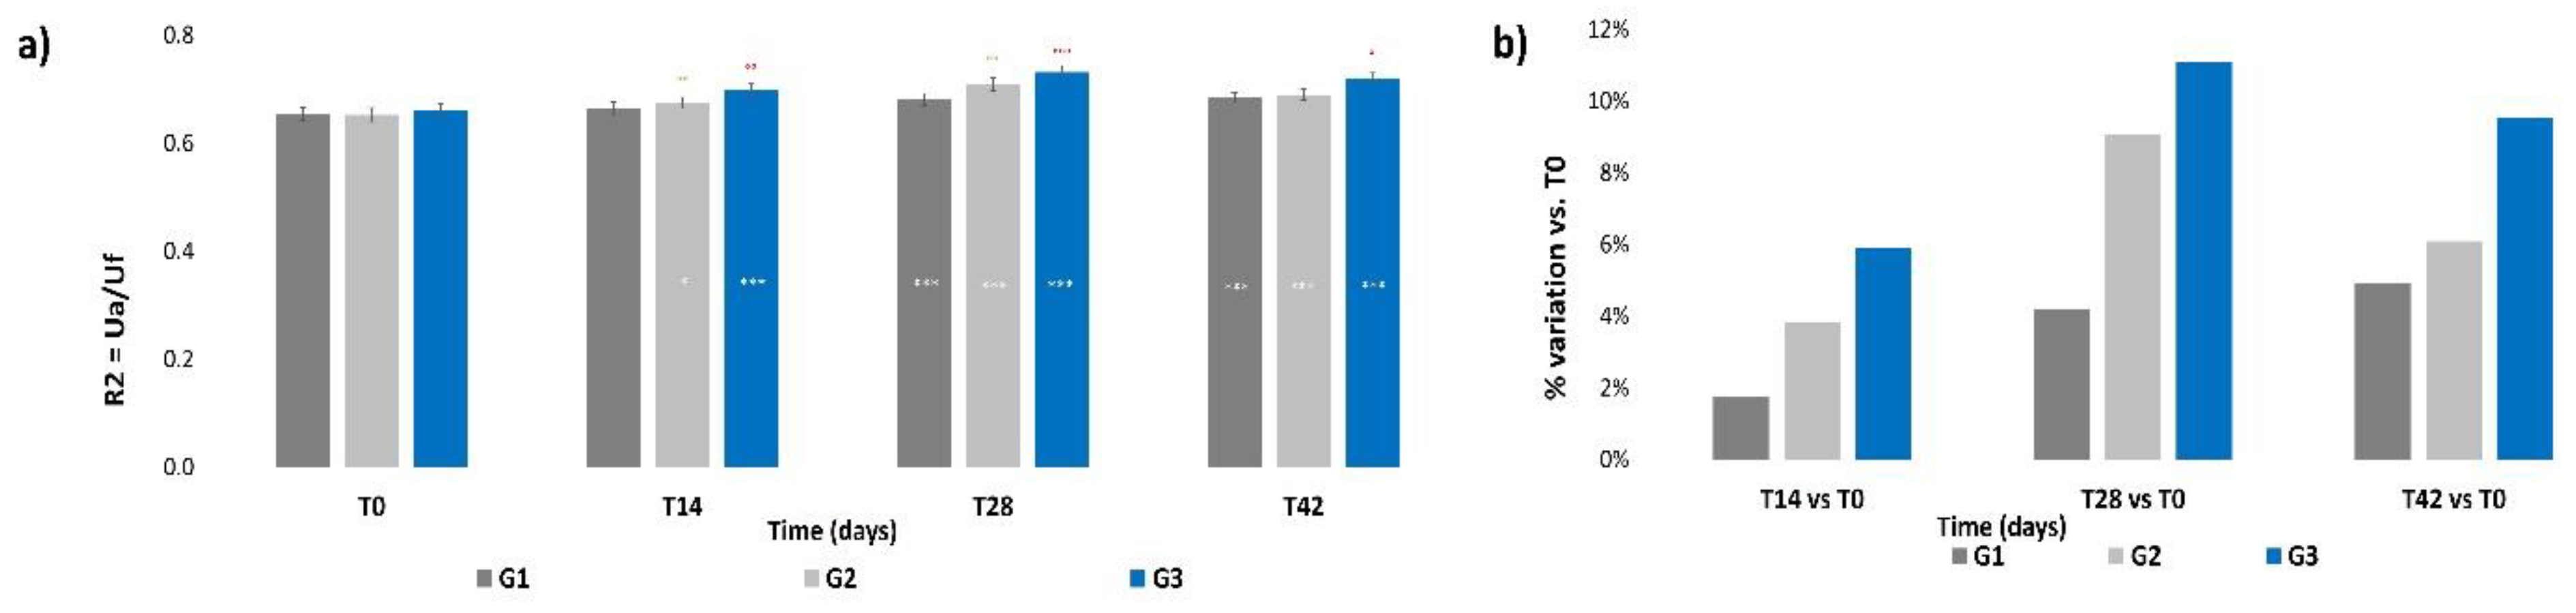
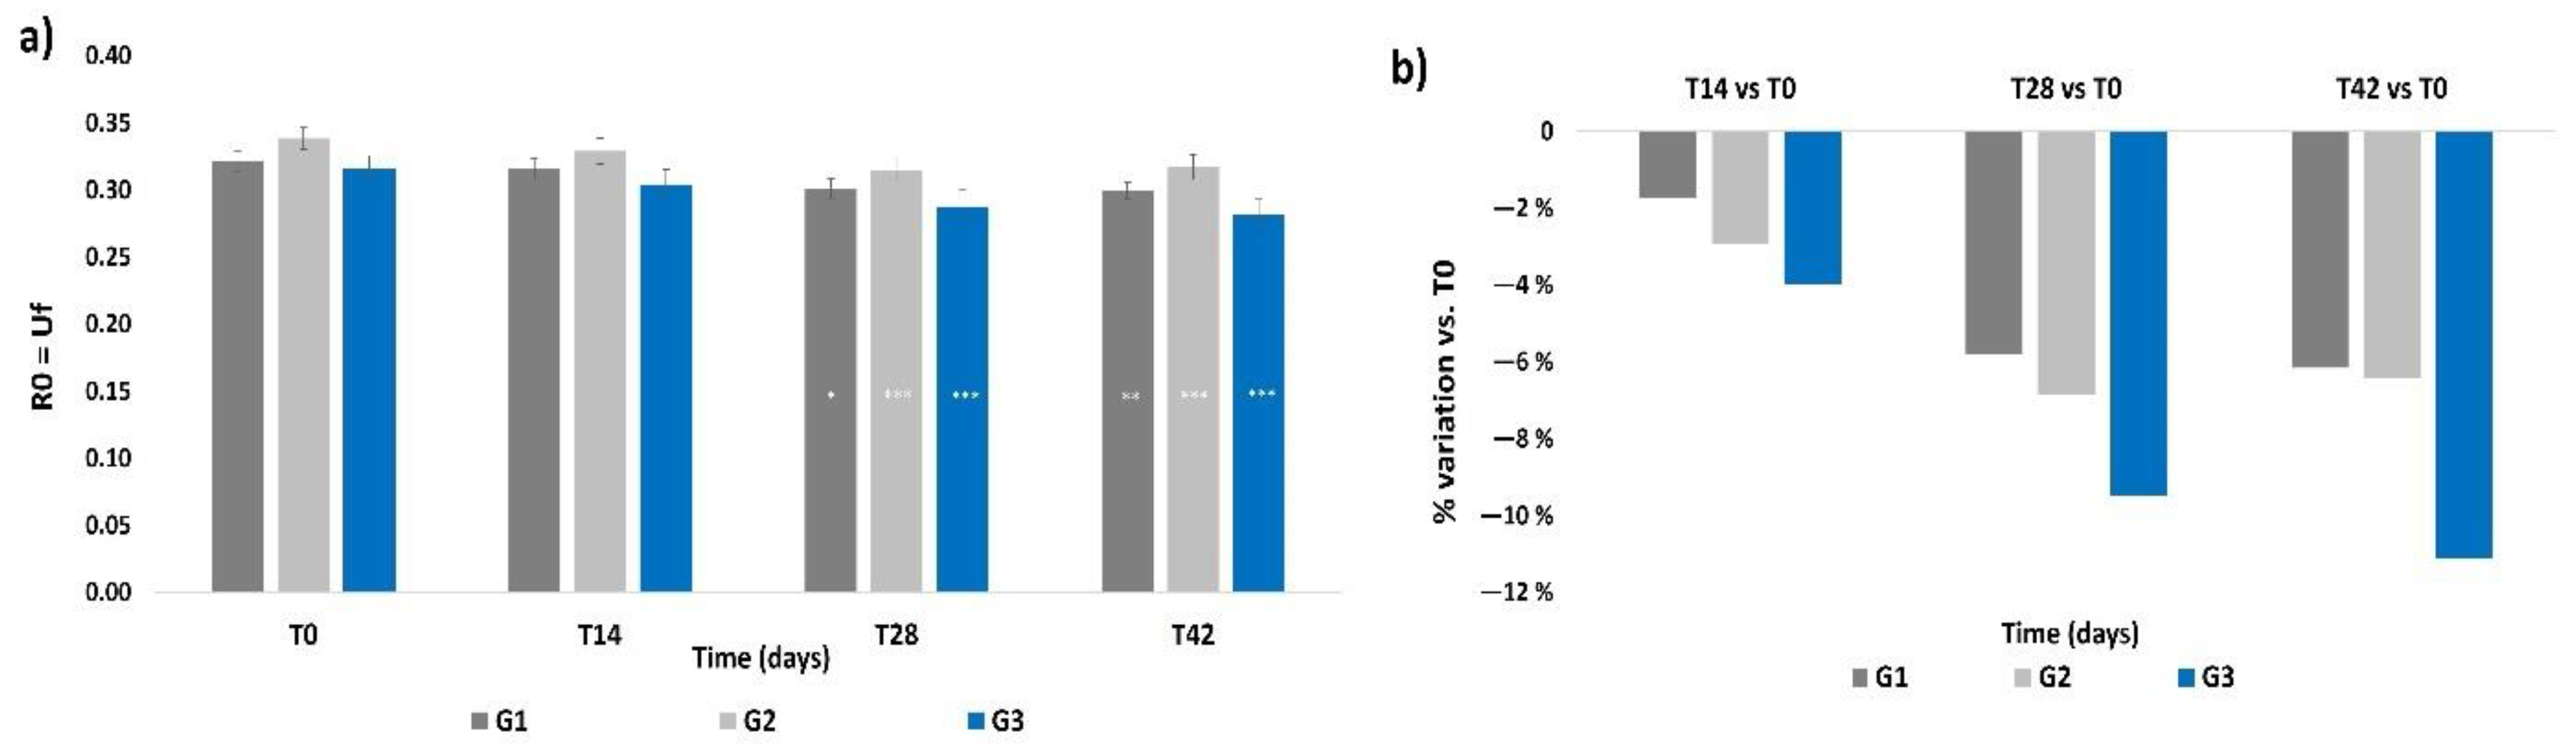
3.4. Skin Elasticity

No significant intergroup differences for the R2 parameter were calculated at T0 (Figure 4a); then, a progressive increment was recorded for all three groups throughout the treatment period, which was statistically significative already at T14 for G2 and G3 (p < 0.05 and p < 0.001 respectively) and at T28 for all groups (p < 0.001). The R2 value showed a slight decrement after the follow-up with respect to the previous value at T28, but still remained at levels that were significatively higher (p < 0.001) with respect to those at T0 for all treatments. Significant intergroup differences were calculated at all times for G3 vs. G1 (p < 0.05, p < 0.1, p < 0.001, respectively, at T14, T28 and T42) and at T28 for G2 vs. G1 (p < 0.01). Figure 4b shows that all treatments induced an increment in terms of mean percentage variation of skin elasticity with respect to T0; however, the G2 and G3 treatments, both containing ACP, resulted in the higher increment with respect to G1. The higher increment was achieved by the G3 treatment (+11.1%) at T28; then, the percentage variation decreased at T42 for all treatments, but to levels that were still higher compared to those at T14.

3.5. Skin Firmness

The R0 parameter did not show any significant intergroup difference at T0 (Figure 5a), and all treatments resulted in a significant reduction of the R0 parameter at T28 with respect to its basal values (p < 0.05 for G1, p < 0.001 for G2 and G3). The R0 values at T42 were almost the same as those at T28. No intergroup significant differences were observed during the treatment period. In terms of mean percentage variation of R0, the G3 treatment induced a higher decrement (−9.5%) with respect to G1 and G2 at T28, as shown in Figure 5b; then, the G3 treatment showed a further decrement of such value (−11.1%) at T42. Percentage variations in G1 and G2 subjects were almost similar to the T28 values and to levels that still were higher compared to those at T14.

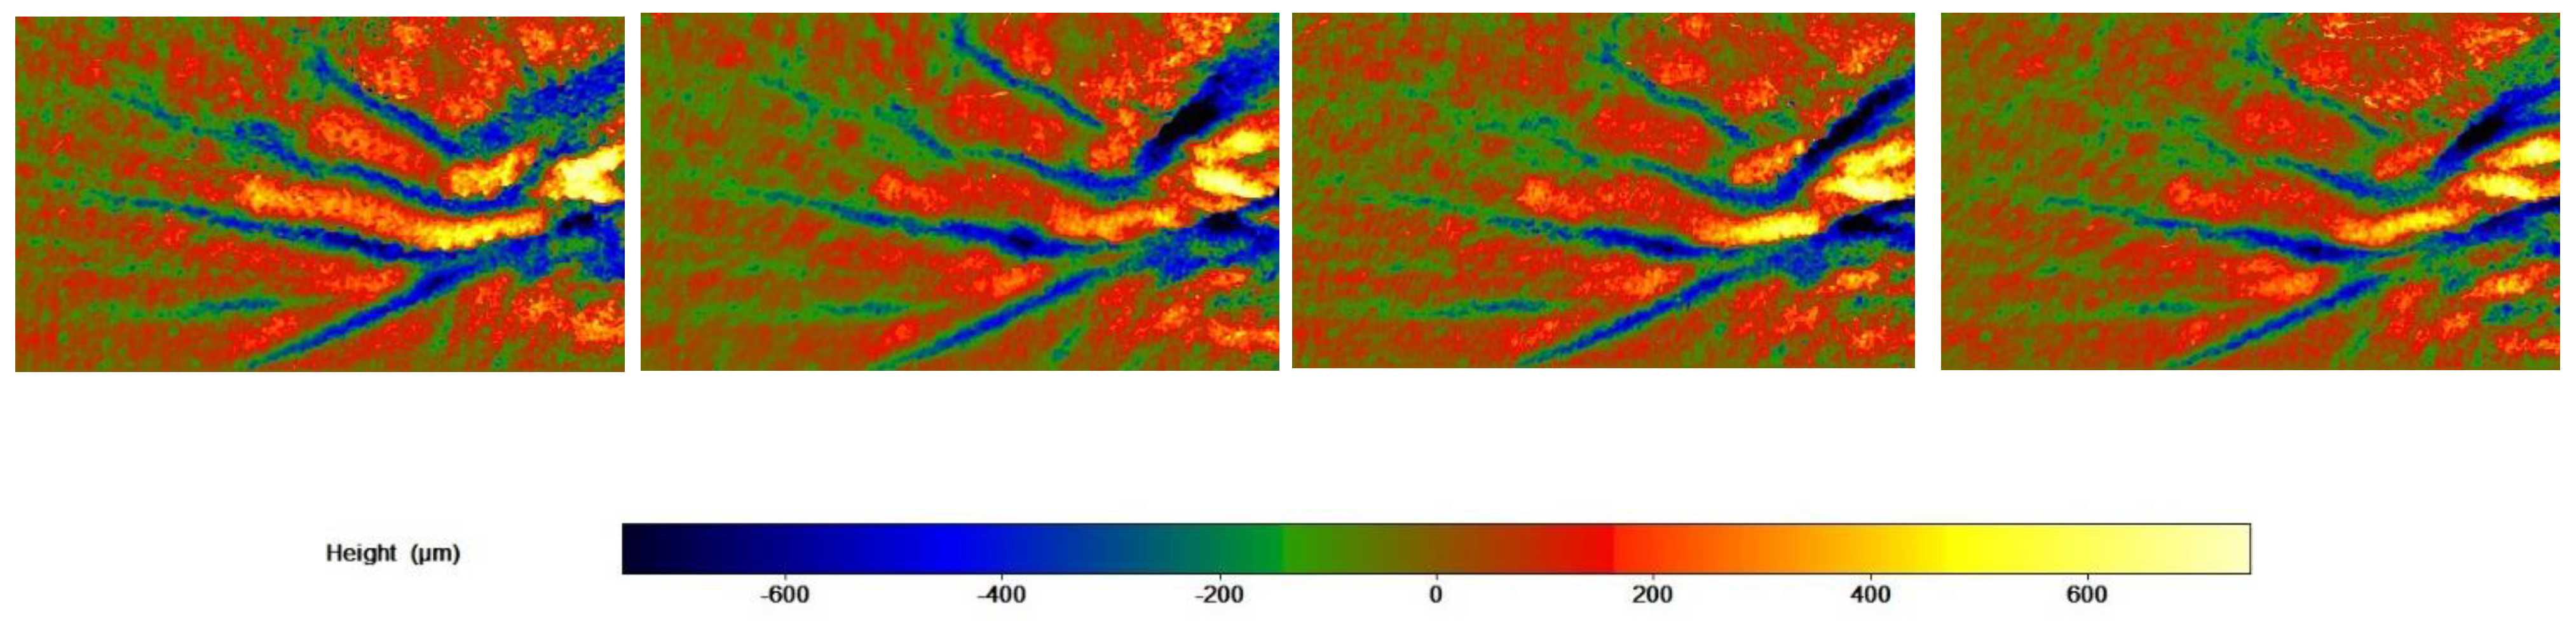
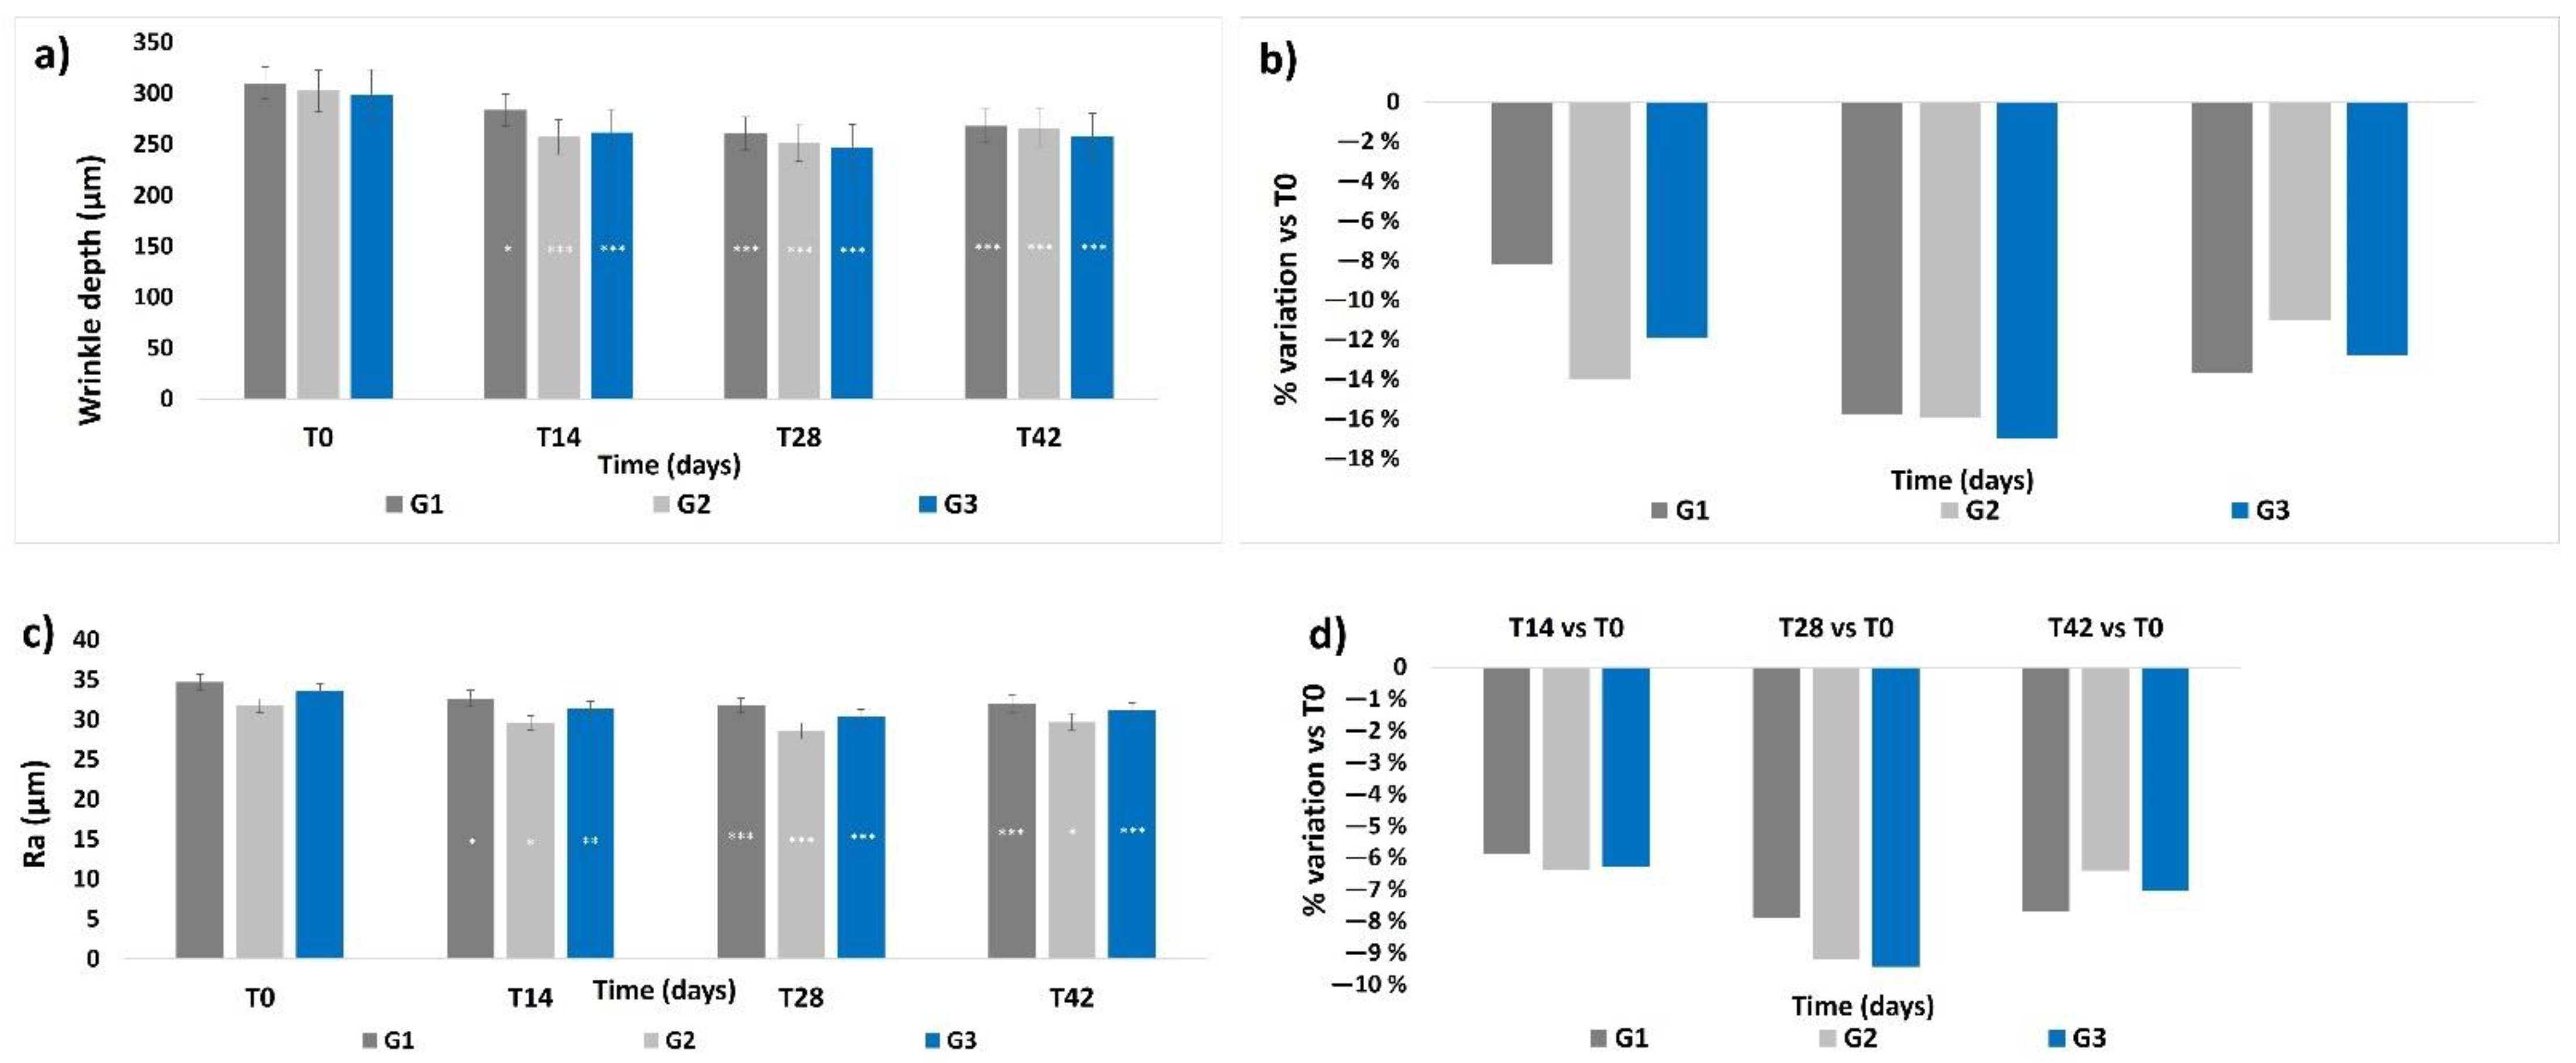
3.6. Skin Profilometry

Skin profilometry was evaluated in terms of wrinkle depth and skin smoothness (expressed as the Ra value): both parameters showed a similar profile throughout the study. The basal levels of wrinkle depth and Ra value did not show any significant differences between the groups (Figure 6a,c). A progressive and significant decrease in the mean wrinkle depth and in the Ra value was observed throughout the treatment period for all three groups, showing a peak at T28, (p < 0.001). At T42, the wrinkle depth values and Ra values showed a slight increase compared to their previous values at T28, but their levels were still statistically lower compared to those at T0, respectively, p < 0.001 for wrinkle depth for all groups, p < 0.05 for G2 and p < 0.001 for G1 and G3 for the Ra values. No significant intergroup differences throughout the whole study period were observed. The highest mean percentage variation of wrinkle depth and Ra value with respect to their T0 values (Figure 6b,d) was achieved at T28 for all treatments; then, the percentage variation decreased at T42, but to levels that were still higher with respect to those at T14 for G1 and G3, and lower for G2 at T42.
The skin profilometry of a G3 subject throughout the study period is shown in Figure 7.

3.7. Self-Assessment Questionnaire

The subjects reported almost 100% positive answers on the tolerability of the products and their peculiar characteristics.
The cut off was satisfied for 8 out of 10 questions relating to the products’ performance. The visibility of deep wrinkle in general resulted in less than 80% of the answer; only G1 reached the goal at T28. A rejuvenated skin appearance was perceived only by G3 participants, who gave more than 80% of positive answers both at T28 and at T42 (Table 1).

4. Discussion

The efficacy of HA, a well-known group of ingredients widely used in health and personal care [29,30], administered as ingredients of cosmetic formulations or as food supplements, in amelioration ageing clinical signs by enhancing skin moisturization, elasticity and roughness, has been largely reported in the last decades [8,9,21,24]. However, a full characterization of the polymer size of hyaluronans was not reported in the majority of studies. Indeed, it is generally recognized that the biological effects of HA are dependent on the polymer size [27,31], which leads to differentiated performances [25,26,27,28]. The Full Spectrum HA obtained by this novel technology [32] is able to mimic the human skin physiological composition and, consequently, the synergy naturally occurring in the skin.
The novelty of this clinical study also relies on the In&Out approach, i.e., a concomitant supply of the same active ingredient, hyaluronic acid, through two different routes: topical and oral.
This approach of using both a cosmetic product and a food supplement aims at two main goals: the first one is to achieve a prompt anti-aging effect due to the direct application of hyaluronan onto the skin, which, according to its physicochemical properties, replenishes its content in the ECM, improves skin hydration level, and ameliorates the aging signs; the second aims at a long-lasting effect on skin regeneration through the physiological responses elicited by signaling fragments generated from the metabolism of oral HA.
Indeed, both G1 and G2 treatments, containing a single active product, resulted effective in ameliorating the skin aging signs in a mature female population at the end of the product treatment, confirming the usefulness of the administration of the Full Spectrum HA either in a cosmetic product or as a food supplement, in an anti-skin-aging approach. In terms of mean percentage variation, the active cosmetic treatment resulted in a greater improvement of skin parameters with respect to the oral administration, according to the prompt availability of HA into the skin obtained through this route. The effect of cosmetic supplementation with the Full Spectrum HA lasted also after its substitution with the placebo cream, as measured after the follow-up period. G1 showed a similar/slightly higher effect with respect to G2 in skin hydration distribution, skin firmness and skin profilometry (wrinkle depth and skin smoothness) after the follow-up period, suggesting a different kinetics of activity for the oral treatment.
Accordingly, subjects receiving the combination of ExceptionHYAL® Star and PrincipHYAL® lasting showed, at T28, a significative improvement in all parameters with respect to the basal levels, and the mean percentage variation resulted higher with respect to the treatments based on a single active product; such levels remained higher after the follow-up period as far as skin moisturization, hydration distribution, elasticity and firmness were concerned.
Wrinkle depth and skin smoothness resulted to be positively affected by the oral treatment, as the percentage variation recorded for G1 at T28 was similar to that for G2 and G3, and, after the follow-up, both parameters for G1 showed a lower decrement at T42 with respect to the levels recorded for the other two treatments, resulting similar to those in G3.

5. Conclusions

Administration of Full Spectrum Hyaluronan, in a cosmetic product or in a food supplement, resulted in a significant improvement in the skin aging signs of a mature female population; a further amelioration of the skin conditions was achieved by using concomitantly the topical and the oral administration routes, i.e., the In&Out treatment. Results recorded after the follow-up period suggest that such approach could also have a lasting effect on skin aging conditions by replenishing the HA content through different routes and, therefore, mechanisms.
Although an aim of the study was to evaluate the efficacy of the In&Out treatment, i.e., administering the same active ingredient by two different routes, a limitation of the study could be seen in the lack of a “true” placebo treatment, that, in first instance, could affect the effective instrumental as well perceptive results mainly with respect to the treatment with ACP. The treatment period could also appear too short, mainly with respect to the oral treatment; in fact, a longer-term study would be appropriate to further elucidate the maximal effects on elasticity and profilometric parameters, but the protocol was developed according to the general acceptance of a skin treatment by consumers, who seek products that give immediate benefits and that demonstrate efficacy in a short period of treatment.

Author Contributions

F.C., A.M. and F.T. designed the study; G.R. enrolled volunteers and carried out the clinical evaluations and determination of the skin parameters; A.M and F.R. analyzed the data and carried out the statistical analysis; F.T. and A.M wrote the draft; all authors took part to the discussion for the final version of the paper and agreed to the published version of the manuscript. F.C. did not influence data interpretation. All authors have read and agreed to the published version of the manuscript.

Funding

This research was sponsored by Roelmi HPC SRL.

Institutional Review Board Statement

The study was conducted in accordance with the Declaration of Helsinki and approved by the Independent Ethical Committee for Non-Pharmacological Clinical studies” Genova, Italy (Ref: 2019/09, approved on 4 September 2019).

Informed Consent Statement

Informed consent was obtained from all subjects involved in the study.

Data Availability Statement

Data supporting the findings of this study are available from the corresponding author upon reasonable request.

Conflicts of Interest

Roelmi HPC sells ExceptionHYAL® Star and PrincipHYAL® Difference. Roelmi HPC did not influenced data collection or interpretation nor the paper writing.

References

  1. Tobin, D.J. Introducing to skin aging. J. Tissue Viability 2017, 26, 37–46. [Google Scholar] [CrossRef] [PubMed] [Green Version]
  2. Rittié, L.; Fisher, G.J. Natural and sun-induced aging of human skin. Cold Spring Harb. Perspect. Med. 2015, 5, a015370. [Google Scholar] [CrossRef] [PubMed]
  3. Lee, H.; Hong, Y.; Kim, M. Structural and Functional Changes and Possible Molecular Mechanisms in Aged Skin. Int. J. Mol. Sci. 2021, 22, 12489. [Google Scholar] [CrossRef] [PubMed]
  4. Genovese, L.; Corbo, A.; Sibilla, S. An insight into the changes in skin texture and properties following dietary intervention with a nutricosmeceutical containing a blend of collagen bioactive peptides and antioxidants. Ski. Pharmacol. Physiol. 2017, 30, 146–158. [Google Scholar] [CrossRef] [Green Version]
  5. Kawada, C.; Kimura, M.; Masuda, Y.; Nomura, Y. Orally administered hyaluronan affects skin dryness and epidermal thickening in photoaged hairless mice. Biosci. Biotechnol. Biochem. 2016, 80, 1192–1195. [Google Scholar] [CrossRef] [Green Version]
  6. Farage, M.A.; Miller, K.W.; Elsner, P.; Maibach, H.I. Intrinsic and extrinsic factors in skin ageing: A review. Int. J. Cosmet Sci. 2008, 30, 87–95. [Google Scholar] [CrossRef]
  7. Tanaka, M.; Yamamoto, Y.; Misawa, E.; Nabeshima, K.; Saito, M.; Yamauchi, K.; Abe, F.; Furukawa, F. Effects of aloe sterol supplementation on skin elasticity, hydration, and collagen score: A 12-week double-blind, randomized, controlled trial. Ski. Pharmacol. Physiol. 2016, 29, 309–317. [Google Scholar] [CrossRef]
  8. Göllner, I.; Voss, W.; von Hehn, U.; Kammerer, S. Ingestion of an oral hyaluronan solution improves skin hydration, wrinkle reduction, elasticity, and skin roughness: Results of a clinical study. J. Evid.-Based Complementary Altern. Med. 2017, 22, 816–823. [Google Scholar] [CrossRef]
  9. Oe, M.; Sakai, S.; Yoshida, H.; Okado, N.; Kaneda, H.; Masuda, Y.; Urushibata, O. Oral hyaluronan relieves wrinkles: A double-blinded, placebo-controlled study over a 12-week period. Clin. Cosmet. Investig. Dermatol. 2017, 10, 267–273. [Google Scholar] [CrossRef] [Green Version]
  10. Longas, M.O.; Russel, C.S.; He, X.Y. Evidence for structural changes in dermatan sulfate and hyaluronic acid with aging. Carbohydr. Res. 1987, 159, 127–136. [Google Scholar] [CrossRef]
  11. Stern, R.; Maibach, H.I. Hyaluronan in skin: Aspects of aging and its pharmacologic modulation. Clin Dermatol. 2008, 26, 106–122. [Google Scholar] [CrossRef]
  12. Marinho, A.; Nunes, C.; Reis, S. Hyaluronic Acid: A Key Ingredient in the Therapy of Inflammation. Biomolecules 2021, 11, 1518. [Google Scholar] [CrossRef] [PubMed]
  13. Jiang, D.; Liang, J.; Noble, P.W. Hyaluronan as an Immune Regulator in Human Diseases. Physiol. Rev. 2011, 91, 221–264. [Google Scholar] [CrossRef] [PubMed] [Green Version]
  14. Liang, J.; Jiang, D.; Noble, P.W. Hyaluronan as a therapeutic target in human diseases. Adv. Drug Deliv. Rev. 2016, 97, 186–203. [Google Scholar] [CrossRef] [PubMed] [Green Version]
  15. Bastow, E.R.; Byers, S.; Golub, S.B.; Clarkin, C.E.; Pitsillides, A.A.; Fosang, A.J. Hyaluronan synthesis and degradation in cartilage and bone. Cell Mol. Life Sci. 2008, 65, 395–413. [Google Scholar] [CrossRef]
  16. Fallacara, A.; Baldini, E.; Manfredini, S.; Vertuani, S. Hyaluronic acid in the third millennium. Polymers 2018, 10, 701. [Google Scholar] [CrossRef] [Green Version]
  17. Litwiniuk, M.; Krejner, A.; Speyrer, M.S.; Gauto, A.R.; Grzela, T. Hyaluronic Acid in Inflammation and Tissue Regeneration. Wounds A Compend. Clin. Res. Pract. 2016, 28, 78–88. [Google Scholar]
  18. Papakonstantinou, E.; Roth, M.; Karakiulakis, G. Hyaluronic acid: A key molecule in skin aging. Dermato-Endocrinology 2012, 4, 253–258. [Google Scholar] [CrossRef] [Green Version]
  19. Brown, T.J.; Alcorn, D.; Fraser, J.R.E. Absorption of hyaluronan applied to the surface of intact skin. J. Investig. Dermatol. 1999, 113, 740–746. [Google Scholar] [CrossRef] [Green Version]
  20. Essendoubi, M.; Gobinet, C.; Reynaud, R.; Angiboust, J.F.; Manfait, M.; Piot, O. Human skin penetration of hyaluronic acid of different molecular weights as probed by Raman spectroscopy. Ski. Res. Technol. 2016, 22, 55–62. [Google Scholar] [CrossRef]
  21. Bukhari, S.N.A.; Roswandi, N.L.; Waqas, M.; Habib, H.; Hussain, F.; Khan, S.; Sohail, M.; Ramli, N.A.; Thu, H.E.; Hussain, Z. Hyaluronic acid, a promising skin rejuvenating biomedicine A review of recent updates and pre-clinical and clinical investigations on cosmetic and nutricosmetic effects. Int. J. Biol. Macromol. 2018, 120, 1682–1695. [Google Scholar] [CrossRef] [PubMed]
  22. Sparavigna, A. Role of the extracellular matrix in skin aging and dedicated treatment—State of art. Plast. Aesthet. Res. 2020, 7, 14. [Google Scholar] [CrossRef]
  23. Kawada, C.; Yoshida, T.; Yoshida, H.; Matsuoka, R.; Sakamoto, W.; Odanaka, W.; Sato, T.; Yamasaki, T.; Kanemitsu, T.; Masuda, Y.; et al. Ingested hyaluronan moisturizes dry skin. Nutr. J. 2014, 13, 70. [Google Scholar] [CrossRef] [PubMed] [Green Version]
  24. Hsu, T.F.; Su, Z.R.; Hsieh, Y.H.; Wang, M.F.; Oe, M.; Matsuoka, R.; Masuda, Y. Oral hyaluronan relieves wrinkles and improves dry skin: A 12-week double-blinded, placebo-controlled study. Nutrients 2021, 13, 2220. [Google Scholar] [CrossRef]
  25. Pavicic, T.; Gauglitz, G.G.; Lersch, P.; Schwach-Abdellaoui, K.; Malle, B.; Korting, H.C.; Farwick, M. Efficacy of cream-based novel formulations of hyaluronic acid of different molecular weights in anti-wrinkle treatment. JDD 2011, 10, 990–1000. [Google Scholar]
  26. Michelotti, A.; Cestone, E.; De Ponti, I.; Pisati, M.; Tursi, F. Oral intake of a new Full Spectrum hyaluronan improves skin profilometry and ageing factors: A randomized, double-blind, placebo controlled clinical trial. Eur. J. Dermatol. 2021, 31, 798–805. [Google Scholar]
  27. Tavianatou, A.G.; Caon, I.; Franchi, M.; Piperigkou, Z.; Galesso, D.; Karamanos, N.K. Hyaluronan: Molecular size-dependent signaling and biological functions in inflammation and cancer. FEBS J. 2019, 286, 2883–2908. [Google Scholar] [CrossRef]
  28. Cicero, A.F.G.; Girolimetto, N.; Crescenzio Bentivenga, C.; Grandi, E.; Fogacci, F.; Borghi, C. Short-Term of a New Oral Sodium Hyaluronate Formulation on Knee Osteoarthritis: A Double-Blind, Randomized, Placebo-Controlled Clinical Trial. Diseases 2020, 8, 26. [Google Scholar] [CrossRef]
  29. Juncan, A.M.; Moisă, D.G.; Santini, A.; Morgovan, C.; Rus, L.L.; Vonica-Țincu, A.L.; Loghin, F. Advantages of hyaluronic acid and its combination with other bioactive ingredients in cosmeceuticals. Molecules 2021, 26, 4429. [Google Scholar] [CrossRef]
  30. Gupta, R.C.; Lall, R.; Srivastava, A.; Sinha, A. Hyaluronic acid: Molecular mechanisms and therapeutic trajectory. Front. Vet. Sci. 2019, 6, 192. [Google Scholar] [CrossRef] [Green Version]
  31. Cyphert, J.M.; Trempus, C.S.; Garantziotis, S. Size Matters: Molecular Weight Specificity of Hyaluronan Effects in Cell Biology. Int. J. Cell Biol. 2015, 2015, 563818. [Google Scholar] [CrossRef] [PubMed] [Green Version]
  32. Masi, S. The 2.0 Full Spectrum Hyaluronans Technology to improve bioavailability and efficacy performance. Agro. Food Ind. Hi-Tech 2020, 31, 21–25. [Google Scholar]
Figure 1. Skin moisturization. The graphs show data obtained at each monitored time for the three groups. (a) Data are reported as corneometric arbitrary units (mean ± SEM). (b) Data are reported as mean percentage variation with respect to T0. Legend = *** p < 0.001 vs. T0, * p < 0.05 vs. T0, ° p < 0.05 G3 vs. G1.
Cosmetics 09 00054 g001
Figure 2. Skin hydration distribution. The graphs show data obtained at each monitored time for the three groups. (a) Data are expressed in Grey Index arbitrary units (mean ± SEM). (b) Data are reported as mean percentage variation with respect to T0. Legend = *** p < 0.001 vs. T0, ** p < 0.01 vs. T0.
Cosmetics 09 00054 g002
Figure 3. Moisturization Map images of a G3 subject throughout the study period.
Cosmetics 09 00054 g003
Figure 4. Skin elasticity. The graphs show data obtained at each monitored time for the three groups. (a) Data are expressed as mean ± SEM of the R2 parameter (Ua/Uf). (b) Data are reported as mean percentage variation with respect to T0. Legend = *** p < 0.001 vs. T0, * p < 0.05 vs. T0, °° p < 0.01 G2 vs. G1, ° p < 0.05 G3 vs. G1, °° p < 0.01 G3 vs. G1, °°° p < 0.001 G3 vs. G1.
Cosmetics 09 00054 g004
Figure 5. Skin firmness. The graphs show data obtained at each monitored time for the three groups. (a) Data are expressed as mean ± SEM of the R0 parameter (Uf). This parameter indicates the skin ability to oppose to the deformation imposed by the probe during the analysis. A reduction of the R0 parameter indicates an improvement of skin firmness. (b) Data are reported as mean percentage variation with respect to T0. Legend = *** p < 0.001 vs. T0, ** p < 0.01 vs. T0, * p < 0.05 vs. T0.
Cosmetics 09 00054 g005
Figure 6. Skin profilometry. The graphs show data obtained at each monitored time for the three groups. (a) Wrinkle depth. Data are expressed in μm (mean ± SEM). (b) Wrinkle depth. Data are reported as mean percentage variation with respect to values at T0. (c) Skin smoothness. Data are expressed as mean ± SEM of the Ra parameter (μm). (d) Skin smoothness. Data are reported as mean percentage variation with respect to values at T0. Legend = *** p < 0.001 vs. T0, ** p < 0.01 vs. T0, * p < 0.05 vs. T0.
Cosmetics 09 00054 g006
Figure 7. Skin profilometry of a G3 subject throughout the study period. Image size: 21 h × 38 w.
Cosmetics 09 00054 g007
Table 1. Self-assessment questionnaire. Data are expressed as percentage of positive answers collected at the end of the treatment period (T28) and after the follow-up period (T42). At T42, questions about characteristics and tolerability were not asked again.
ItemQuestionG1G2G3
T28T42T28T42T28T42
EfficacyFine lines are reduced92%88%84%88%88%88%
Deep wrinkles are less visible80%72%76%76%72%74%
The general appearance of the skin is improved92%96%92%88%92%84%
The texture of the skin is redefined88%80%84%84%92%88%
The skin is smoother92%96%92%88%96%92%
The skin is deeply hydrated92%88%92%88%92%92%
The skin is more elastic92%92%88%84%92%96%
The skin is firmer and more compact92%88%84%80%92%88%
The skin complexion is more even and the skin is brighter92%92%88%84%88%96%
The skin looks like rejuvenated84%72%76%76%84%84%
CharacteristicsThe food supplement is easy to take100%-92%-100%-
The cream spreads easily96%-96%-96%-
The cream absorbs quickly and doesn’t leave any residues96%-96%-96%-
The cream has a good scent96%-92%-96%-
TolerabilityWas the food supplement well tolerated?96%-100%-100%-
Was the cream well tolerated?100%-100%-100%-
Publisher’s Note: MDPI stays neutral with regard to jurisdictional claims in published maps and institutional affiliations.

