Article

Physicochemical Properties of Cellulose Ethers

Ashland LLC, 1005 US HWY 202/206, Bridgewater, NJ 08807, USA
*
Author to whom correspondence should be addressed.
Cosmetics 2022, 9(3), 52; https://doi.org/10.3390/cosmetics9030052
Submission received: 27 April 2022 / Revised: 10 May 2022 / Accepted: 11 May 2022 / Published: 17 May 2022

Abstract

:
Cellulose ethers are naturally derived ingredients that are commonly used in personal care products as rheology modifiers, film formers, stabilizers, and sensorial agents. In this work, we investigated the physicochemical properties of various grades of hydroxyethylcellulose (HEC), hydroxypropylcellulose (HPC), hydroxypropylmethylcellulose (HPMC), methylcellulose (MC), and sodium carboxymethylcellulose (CMC). In addition, we also studied the influence of hydrophobic modification on the structure of HEC by carrying out experiments with cetyl hydroxyethylcellulose (HMHEC). Rheological, friction coefficient, dynamic vapor sorption (DVS), surface tension analysis, differential scanning calorimetry (DSC), and thermogravimetric analysis (TGA) data were generated for the cellulose ethers in order to obtain information about their viscosity, lubricity, moisture absorption, solubility in the bulk solution phase, physical properties, and thermal degradation profile, respectively.

1. Introduction

Cellulose is the most abundant polysaccharide on Earth and is the principal structural component of trees and plants [1]. It consists of repeating D-anhydroglucose units joined together by β-1-4-glycosidic bonds [2]. Figure 1 contains the structure of cellulose (when R=OH). Each anhydroglucose unit contains a hydroxyl group at the 2, 3, and 5 positions on the ring. In addition, cellulose is characterized by the reducing and non-reducing ends, which contain one and two hydroxyl groups, respectively [3].
Due to the shape of its backbone and structural stabilization by hydrogen bonding, cellulose contains elongated chains that form crystalline microfibrils [4]. The degree of polymerization of cellulose depends on its source and, of course, any subsequent treatments for its isolation. Due to its structural integrity, cellulose is insoluble in water. In addition, it is not metabolized in the human gastrointestinal tract due to the lack of the necessary enzymatic machinery to cleave the glycosidic β-1-4 bonds [5]. It is, however, an important component of dietary fiber.
Cellulose ethers are derivatives of cellulose that are used universally in many different industrial areas, including pharmaceutical, personal care, food and beverage, paints and coatings, paper, and oilfield applications [5,6,7,8]. The hydroxyl groups in cellulose at the 2-, 3-, and 5-position can be derivatized by etherification, which allows for the tailored design of molecules with specifically engineered properties, such as solubility, viscosity, etc. [4]. It is generally accepted that the reactivity of the hydroxyl groups at the 2 and 5 positions are greater than that found in the hydroxyl group at the 3-position due to steric effects.
Figure 1 contains the structural backbone of the cellulose molecule along with the derivatizations to the pendant hydroxyl groups that yield the various cellulose ether variants. HEC and HPC are characterized by substitution with hydroxyethyl and hydroxypropyl substituents, respectively, while HPMC is a mixed cellulose ether containing methoxy and hydroxypropyl groups. MC contains methyl substitution, while CMC possesses sodium carboxylate moieties. Finally, HMHEC is a hydrophobically modified analogue of HEC and contains a C16 chain extending from a small fraction of the available reactive sites on the anhydroglucose ring.
In addition to molecular weight, another important classification of cellulose ethers is the degree of substitution (DS) or molar substitution (MS). DS describes the number of hydroxyl group sites occupied by etherified substituent groups per anhydroglucose ring. For example, if there are a total of four substituent groups in place of the hydroxyl groups on both rings in Figure 1, the DS would be 4/2 = 2.
In the case of some cellulose ethers, there can be multiple groups linked together (chain extension) at the reactive hydroxyl sites. The MS parameter captures how many moles of each substituent are present per anhydroglucose ring. For example, if four of the available six sites on the two rings contain six groups, the MS would be 6/2 = 3. In contrast, the DS would be 4/2 = 2. In the case of HEC, HPC, and HPMC, longer chain lengths can be achieved since the substituent groups all contain a hydroxyl moiety, which can undergo further reactions with substituents. On the other hand, MC and CMC contain non-reactive groups, such as -CH3 and -COONa+, respectively, which prevent chain extension.
MS and DS are important from the standpoint of understanding the solution properties of cellulose ethers. Most commercially available water-soluble cellulose ethers have DS values in the range of 0.4 to 2.0, while water-insoluble derivatives generally range from 2.3 to 2.8. In contrast, MS values can range from 1.5 to 4.0 for hydroxyalkyl cellulose ethers [9].
Cellulose ethers have a long history of use in cosmetic products and have a good toxicological profile [10]. There have been a number of studies that have investigated the rheological, mechanical, degradation, and physical properties of the cellulose ethers [11,12,13,14,15,16]. In this text, we provide additional technical data from steady torsional measurements, LAOS measurements, sliding friction, surface tension, moisture sorption, and thermal studies offering insight into the use of these products in various personal care applications.

2. Materials and Methods

2.1. Tested Ingredients

A number of different cellulose ether ingredients were tested in this study, including molecular weight and DS/MS variants of HEC, HMHEC, HPC, HPMC, MC, and CMC. Table 1 contains a list of all the cellulose ethers investigated in this report along with their molecular weight and DS/MS.

2.2. Preparation of Solutions

Stock solutions of the cellulose ether variants were prepared at 2% (w/w) in deionized water. For solutions that required heating, the temperature was controlled using a temperature controller (I2R Therm-o-watch TCP3-1200; Instruments for Research and Industry; Cheltenham, PA, USA) and a Corning Hotplate Stirrer PC-351 (Corning, Inc., Corning, NY, USA). Stirring was accomplished using an IKA Werke RW16 Basic S1 overhead stirrer (IKA, Staufen, Germany) equipped with a 2 in. jiffy mixer blade to avoid air bubble formation. A preservative—aqua (water) (and) methylisothiazolinone (and) phenylpropanol (and) propylene glycol (Optiphen MIT Ultra, Ashland LLC, Wilmington, DE, USA)—was added to the beaker containing water and allowed to dissolve before the addition of the cellulose ethers. As indicated in a section below, no preservative was added to solutions that underwent surface tension measurements.
The MC and HPMC solutions were prepared by heating 1/3 of the total quantity of water to 80 °C. MC and HPMC, in the form of powders, were slowly added to the vortex while thoroughly mixing. After letting the polymers disperse in water for 10 min, the heat was removed from the solution, and 2/3 of the remaining water (maintained at 4 °C in a refrigerator) was added until a lump-free, clear solution was obtained while allowing it to cool to room temperature.
In the case of HEC and HMHEC, the polymer was added to water at room temperature and allowed to thoroughly mix for 10 min. Then, the solution temperature was increased to 80 °C to allow the polymer to fully dissolve. The solution was allowed to cool to room temperature with continued mixing, ensuring that a lump-free, clear solution was obtained. Similarly, stock solutions of the CMC variants were obtained by adding the polymer to water while mixing at room temperature. Again, the solution was allowed to mix until it became lump-free and clear.
For studies of salt tolerance, stock solutions of 2% (w/w) polymer and 4% (w/w) NaCl were blended at a 1:1 ratio to make up 1% (w/w) polymer and 2% (w/w) NaCl solutions. To investigate the surfactant tolerance of the various cellulose ethers, 1% (w/w) polymer in 6% (w/w) sodium laureth sulfate (SLES)—trade name: Jeelate SLES-60; obtained from Jeen International, Fairfield, NJ, USA—solutions were prepared. NaCl was obtained from Millipore Sigma, Saint Louis, MO, USA.

2.3. Evaluation of Solution Clarity

Digital photographs of 1% (w/w) polymeric solutions were subjectively evaluated for clarity by trained panelists. Essentially, the solutions were characterized either as clear or hazy. A Nikon D5200 SLR camera equipped with a 60 mm AF-S Micro Nikkor macro lens (Nikon, Tokyo, Japan) was used to capture digital photographs of the solutions in 4 oz. clear glass bottles. The digital photographs were viewed on a 27 in. LG Ultra HD 4K (model 27MU58-B) LCD manufactured by LG Corporation (Seoul, Korea).

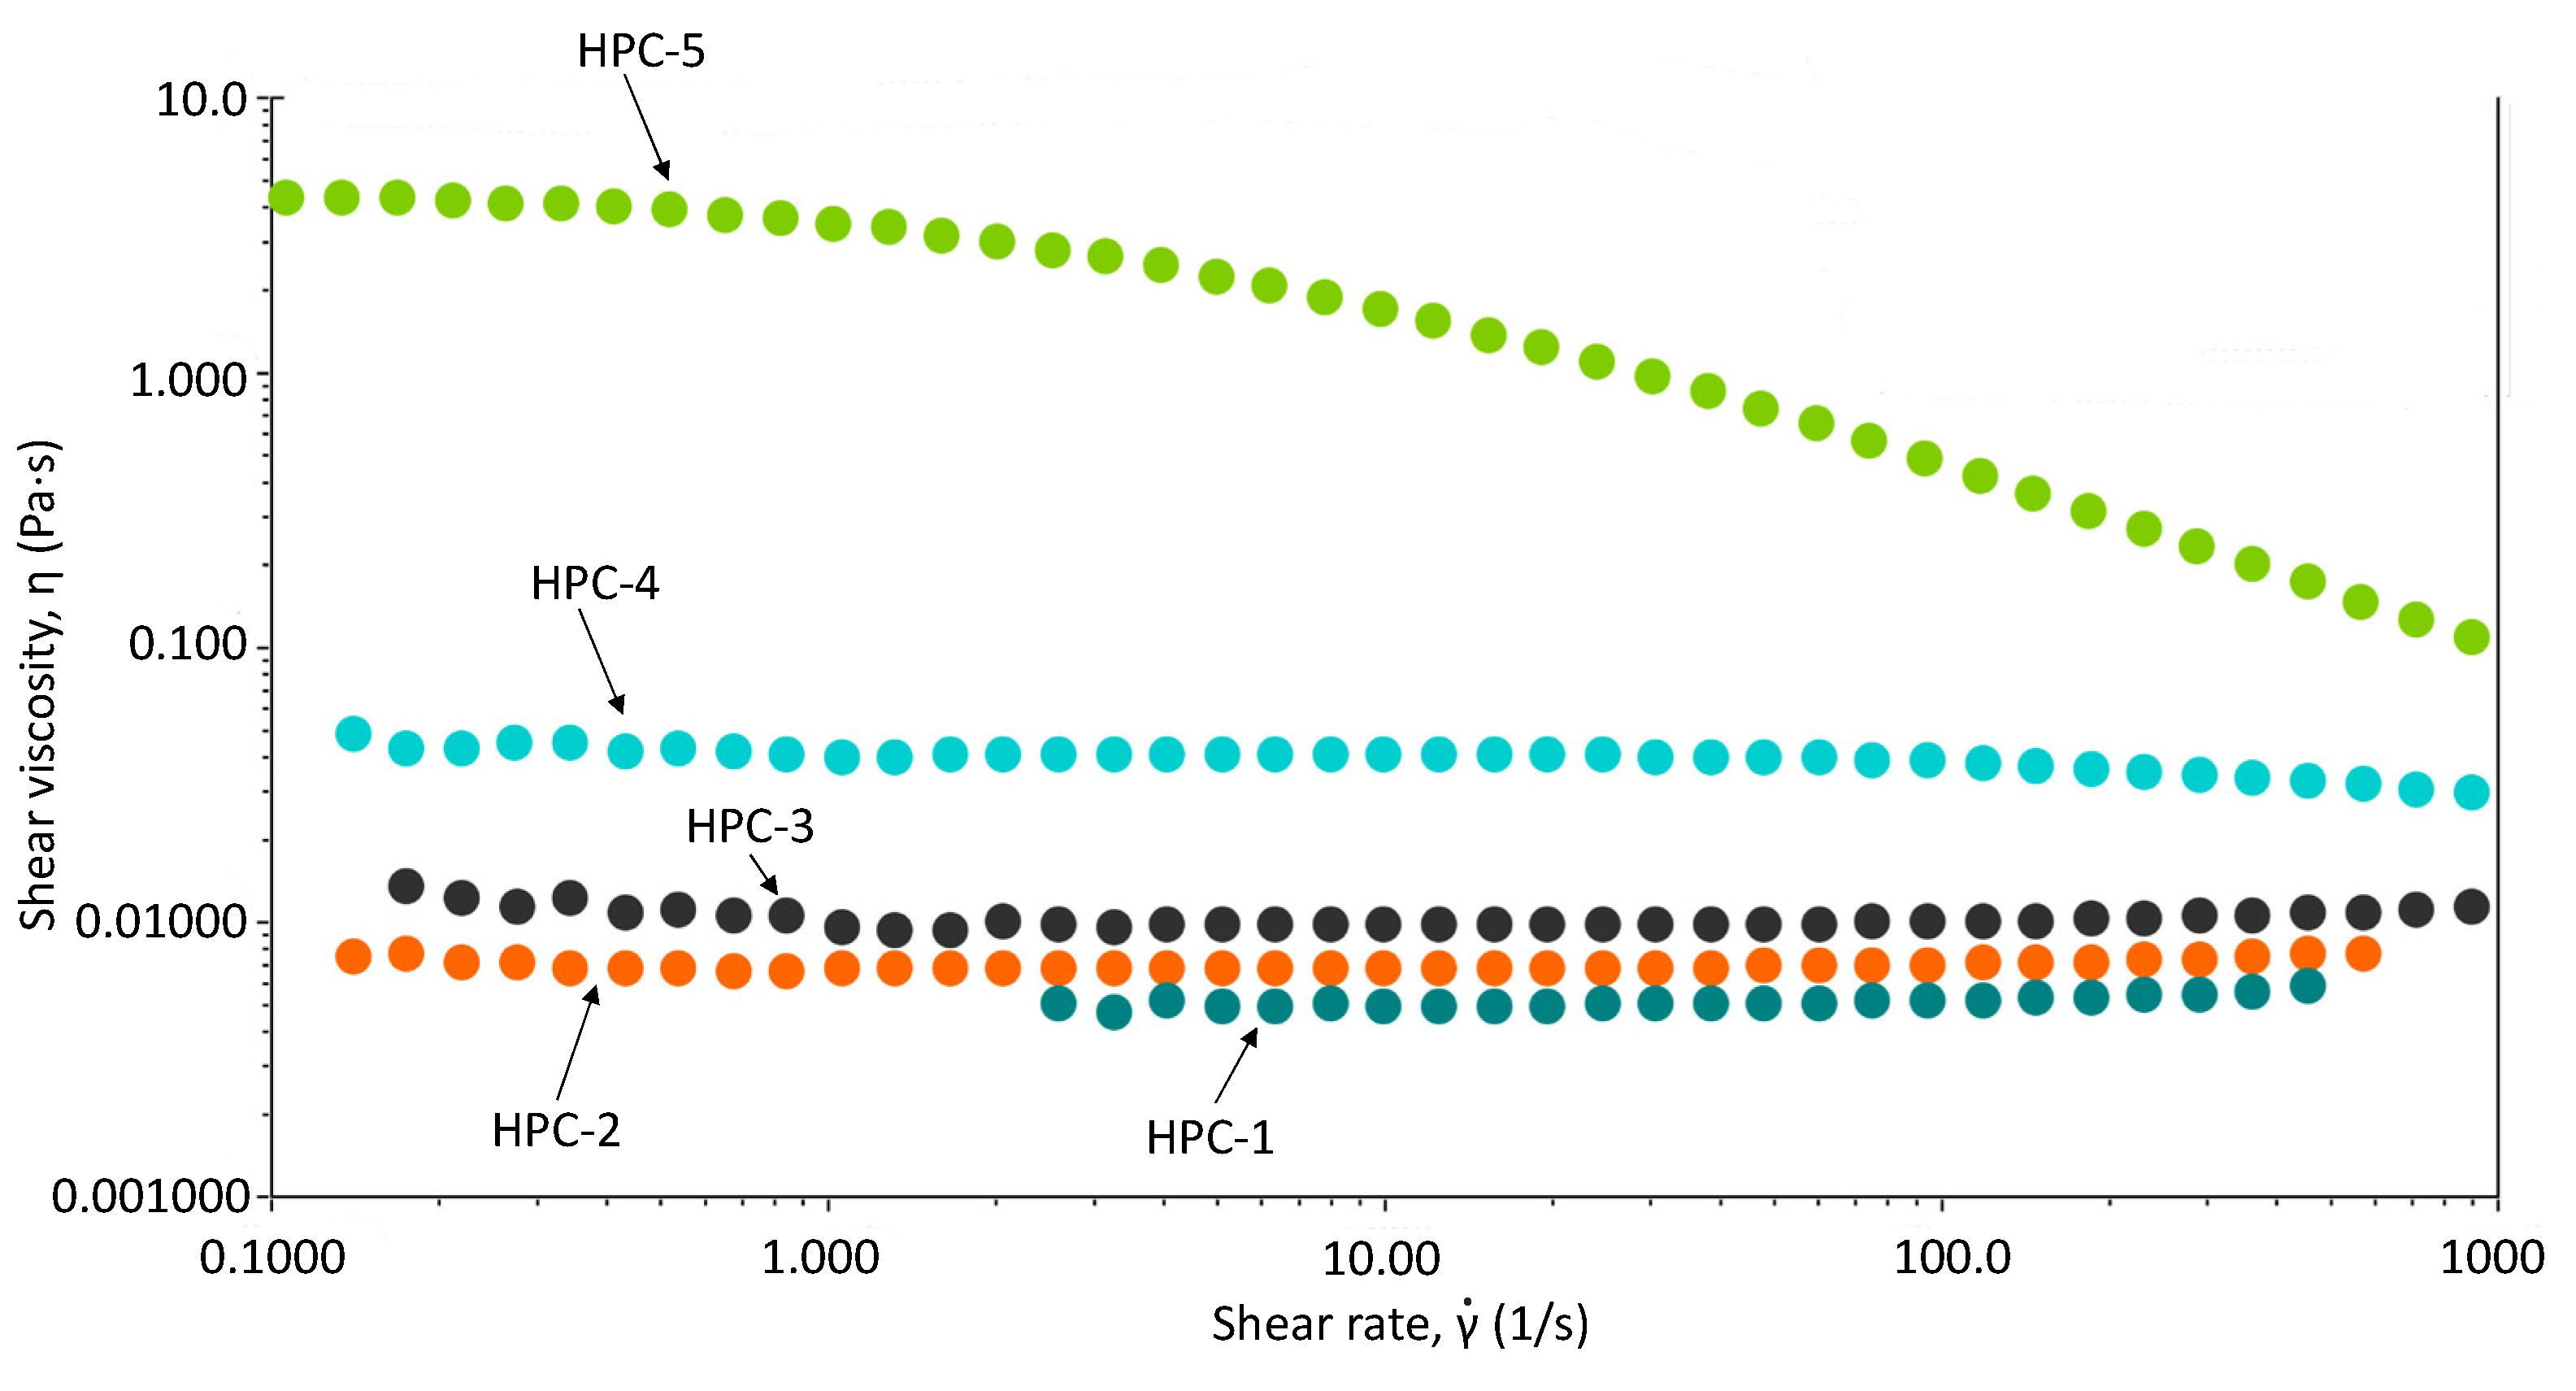
2.4. Rheological Studies of Solution Viscosity

Solution viscosities of neat and salt solutions of the cellulose ethers were measured with an AR-G2 rheometer (TA Instruments, New Castle, DE, USA). The HPC, HPMC, and MC samples were analyzed with a Couette flow setup while a 2° titanium cone and plate fixture were used to measure the rheological properties of HEC and CMC. A continuous shear ramp test was conducted at room temperature with a two-minute equilibration step. A solvent trap was used to impede evaporation. All of the tested cellulose ether samples exhibit shear thinning behavior; therefore, viscosity values at shear rates of 0.1 and 1000 s−1 were selected for comparison and normalization. Viscosity values of salt-containing solutions were normalized to neat polymer solution values to assess the effect of salt on the polymer viscosity. These results are reported as relative viscosity indices. Data were also generated for 1% (w/w) polymer in 6% (w/w) SLES solutions. Similar to the case of the salt solutions, relative viscosity indices are reported as the ratio of the viscosity of polymer plus surfactant solution to the polymer solution alone. Data analysis was performed with Trios software (TA Instruments).

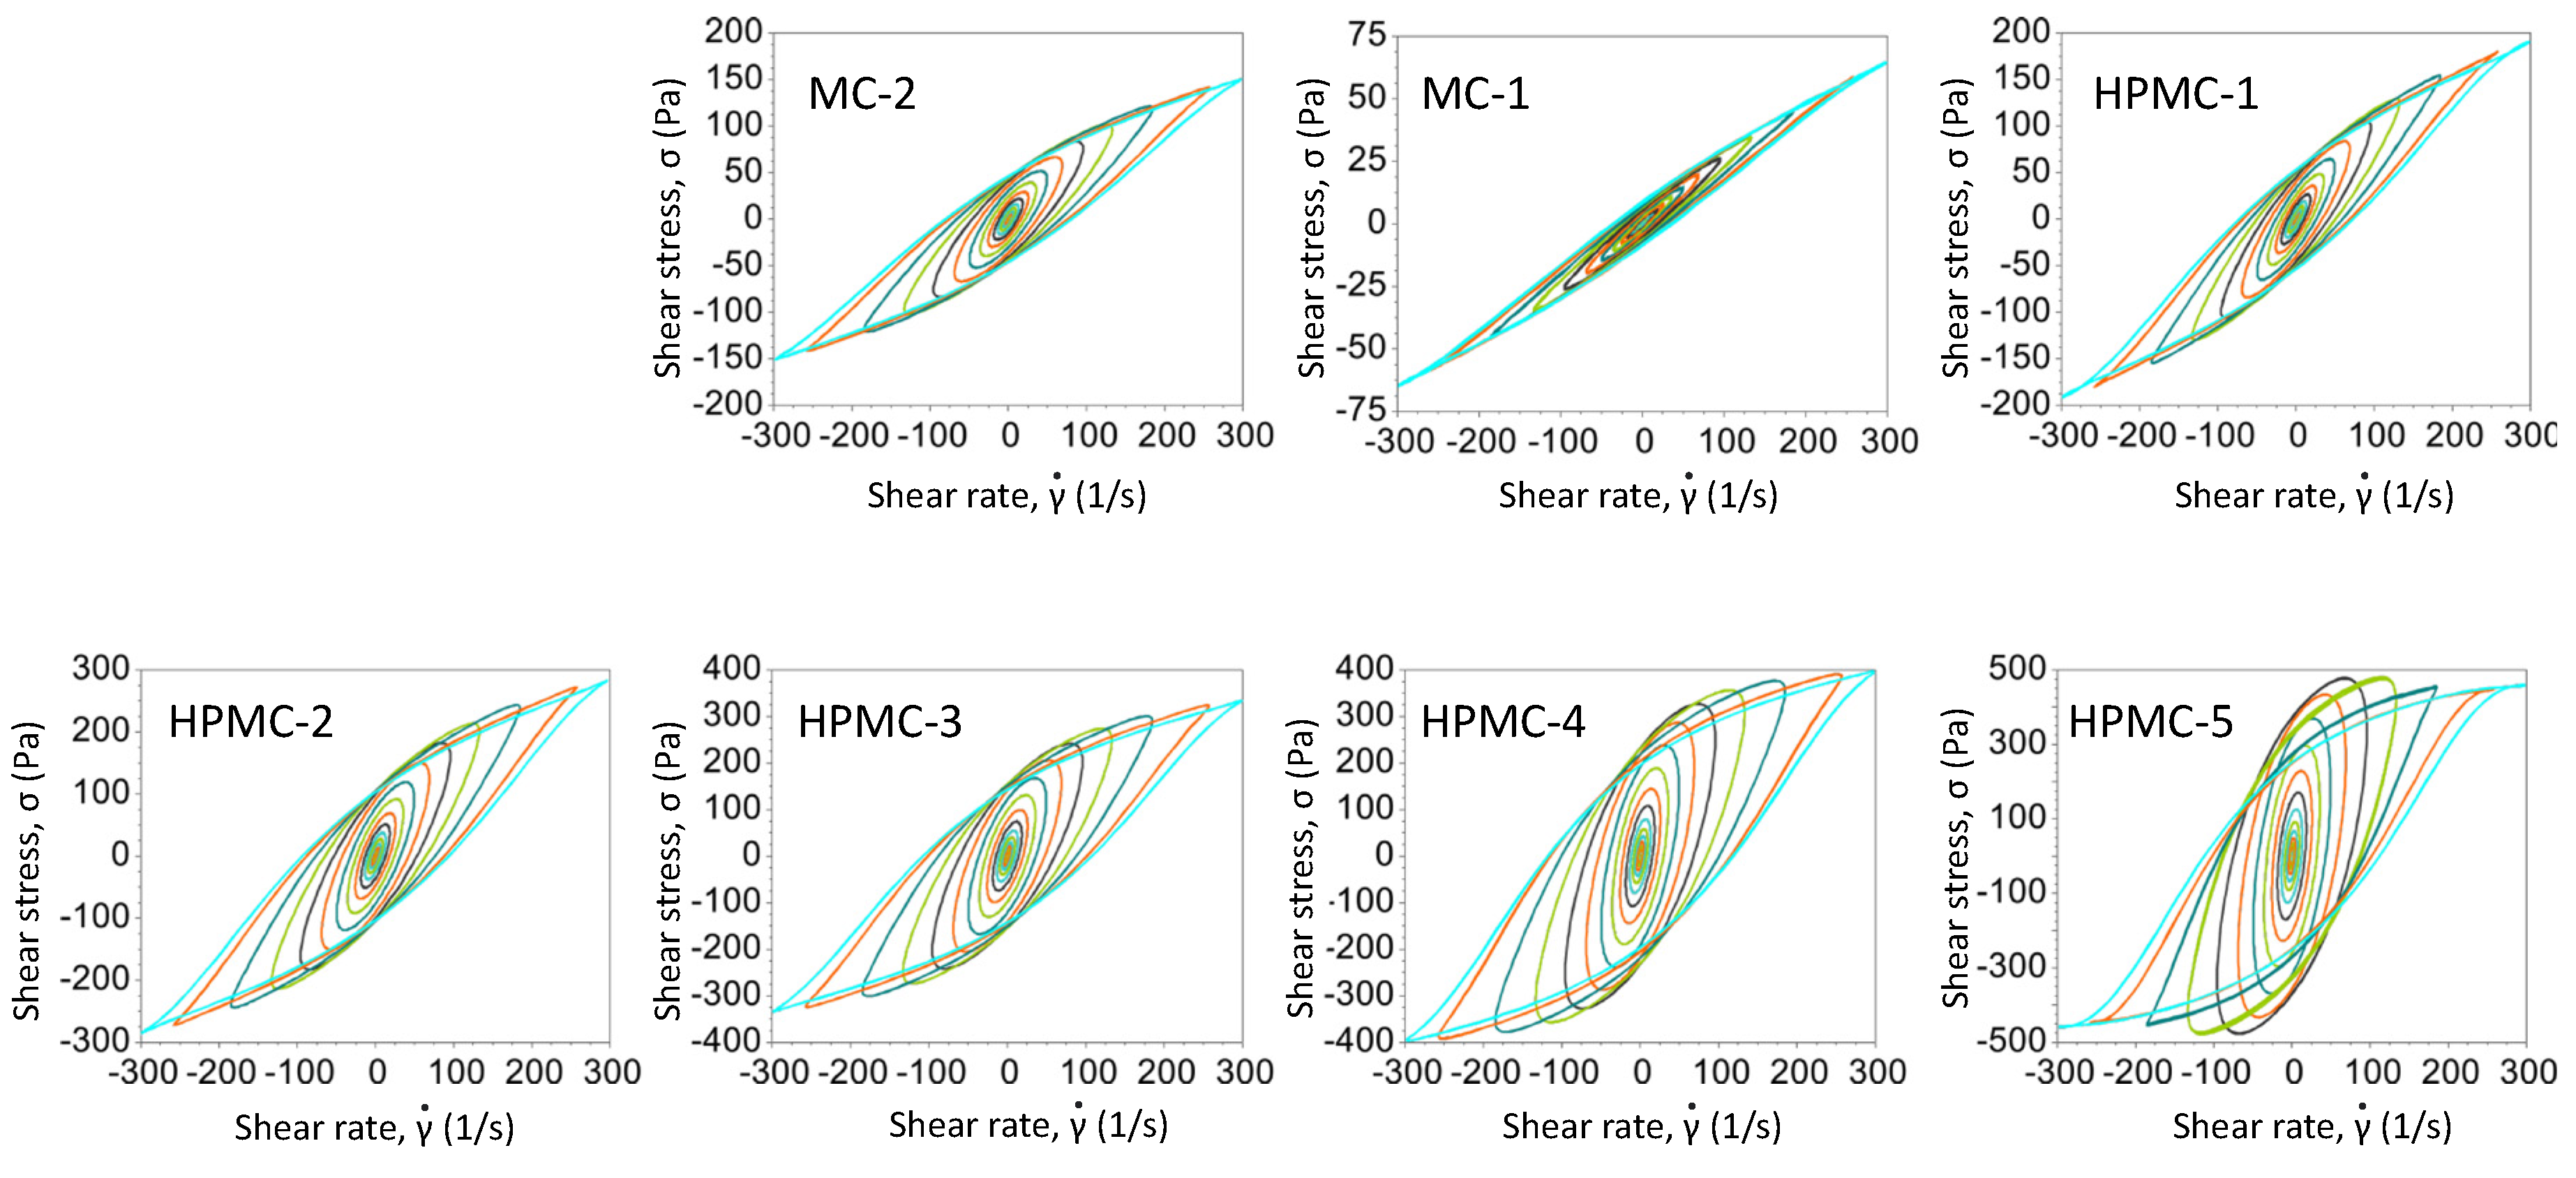
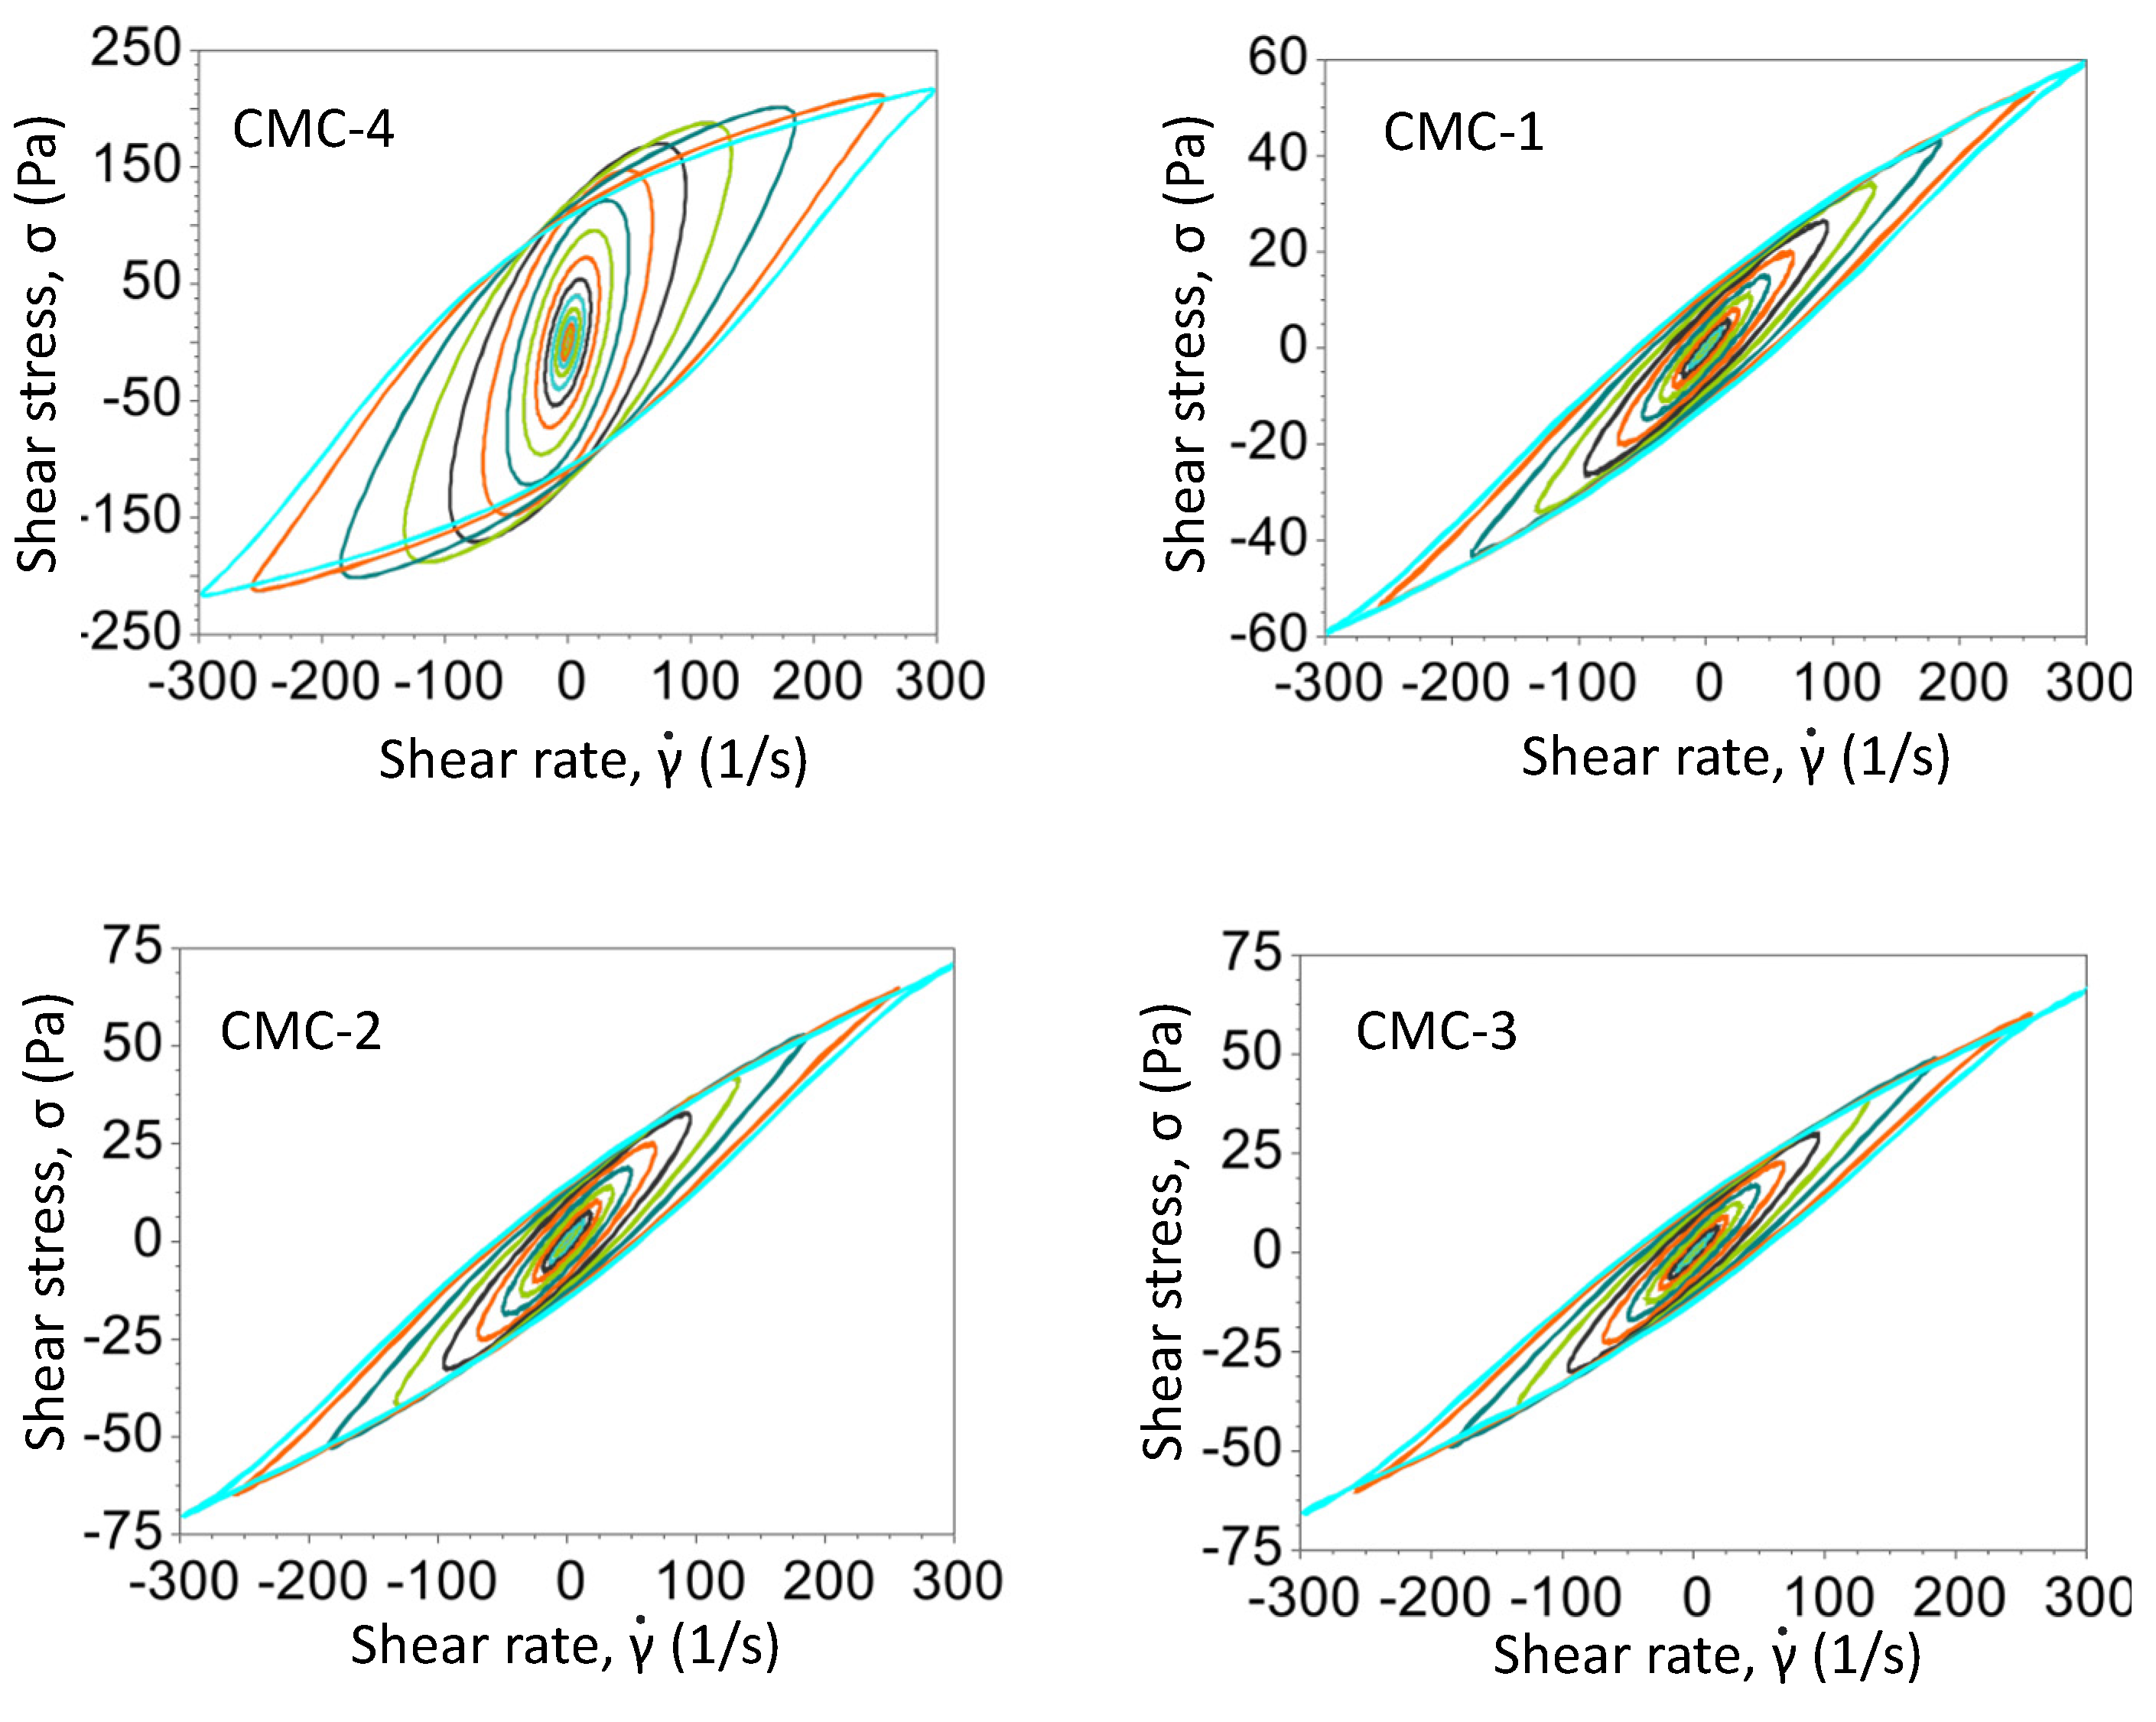
2.5. LAOS Tests to Evaluate Texture

To evaluate the texture of aqueous cellulose ether solutions, LAOS tests were conducted. LAOS fingerprints of cellulose ether derivatives were measured using 2% (w/w) solutions. An ARES-G2 rheometer (TA Instruments) with a 40 mm stainless steel cone and plate was used at room temperature to conduct measurements. Samples were equilibrated at room temperature for three minutes as a conditioning step. The data were collected at 50 radians per second (rps) frequency in the 0.1 to 600% strain range at room temperature. Data analysis was performed with Trios software (TA Instruments).

2.6. Friction Coefficient Measurements

Cellulose derivatives are used to modify the sensory profile of formulations due to their lubricity properties. We carried out friction coefficient measurements to assess the effect of chemistry, derivatization, and molecular weight on the tribological properties of these polymers. In these experiments, 1% (w/w) solutions of HEC, HMHEC, HPMC, MC, and CMC were evaluated. The evaluation of friction was carried out with an Imass SP-2000 slip/peel tester (Imass, Accord, MA, USA) with a 5 kg force transducer and 200 g sled containing a surface covered with a closed-cell neoprene sponge. The sled moves across a smooth glass surface containing the casted polymer film. The film was cast on the glass by applying 7 g of solution, which was spread using a drawdown bar to form a liquid film before placing the neoprene-coated sled on it. After each measurement, the sled and glass slide were washed and towel dried. Three measurements were taken for each cast polymer film. Two different films were cast for the same sample. Therefore, six measurements were taken for each sample. Test conditions were: sled weight—200 g; initial delay—0.2 s; average time—10 s; plate stop mode—test time; speed units—mm/s; testing speed—5 mm/s; slack removal force—0.05 g. Data were collected from the instrument with ComLink software.

2.7. DVS Measurements

Vapor sorption studies were carried out with a Q5000 SA DVS (TA Instruments). The cellulose ether samples, in the form of powder, were placed into pre-flamed 100 μL platinum TGA pans (TA Instruments). The instrument was operated with Universal Analysis 2000 software (TA Instruments). Each sample underwent a pre-conditioning step, where the sample was dried for 3 h at 60 °C and 0% RH. The actual vapor sorption test consisted of equilibrating the sample for 6 h at 25 °C and 90% RH. The % weight gain was recorded for each sample.

2.8. Determination of Surface Tension

Surface tension measurements were performed with an Attension Sigma 700 force tensiometer (Biolin Scientific, Gothenburg, Sweden) equipped with a standard platinum Wilhelmy plate. Measurements were performed at 22.0 °C with three replicates for each sample. The plate was washed and flamed between each sample run. Equilibrium surface tension measurements were carried out using the continuous Wilhelmy plate method with the following instrumental settings: probe—Wilhelmy plate (WL = 39.2800 mm); vessel—small vessel; light phase—air; heavy phase—water; speed up—20 mm/min; speed down—20 mm/min; wetting depth—6 mm; measurement depth—3 mm; measurement time—15 min; sample interval—1 s; stabilize—4 s; integrate—4 s; detect range—2 mN/m; start position—5 mm; reset speed—40 mm/min; zero when wet.
Sample results were compared to deionized water (measured at 72.6 mN/m). Measurements of the deionized water were conducted before and after the measurements of the cellulose ethers. Sample concentrations were 0.1% (w/w). Studies were completed on solutions of HEC, HMHEC, HPMC, MC, and CMC. The instrument was operated and data were collected with OneAttension software (Biolin Scientific).

2.9. Thermal Analysis

DSC measurements were carried out to determine the Tg and Tm of the various cellulose ethers using a TA Q2000 DSC manufactured by TA Instruments. Samples (powder form) were placed into Tzero aluminum pans with perforated Tzero aluminum lids (TA Instruments). The following experimental procedure was employed: ramp 10 °C/min to 105–120 °C; isothermal for 15–30 min; ramp 10 °C/min to −70 °C; isothermal for 15 min; ramp 10 °C/min to 200–250 °C. Dry nitrogen was used as the sample purge gas in all experiments at a flow rate of 50 mL/min. Note that the experimental method was tailored for each cellulose ether.
TGA measurements were performed to characterize the thermal decomposition of the cellulose ethers. A key parameter reported in this work is the pyrolysis onset temperature (Tp), which represents the onset in change of the weight-loss curve. The cellulose ether samples were placed directly (powder form) into 100 µL platinum HT TGA pans (TA Instruments). The following experimental protocol was employed for the TGA measurements: equilibrate at 40 °C; isothermal for 5 min; ramp 10 °C/min to 600 °C; sample purge flow with dry nitrogen at a flow rate of 25 mL/min. In both the DSC and TGA experiments, the average value represents three measurements for each tested cellulose ether derivative. Both instruments were operated and analyzed with Universal Analysis v4.5A software supplied by TA Instruments.

3. Results and Discussion

The physicochemical properties of HEC, HMHEC, HPC, HPMC, MC, and CMC were determined using a variety of techniques. The rheological properties (in the presence and absence of NaCl and SLES) were examined by conventional rheological techniques as well as LAOS to better understand their high shear behavior, which is commonly experienced during the application of personal care products to the skin and hair. Static and kinetic coefficient of friction data allowed us to make conclusions regarding the contribution of the chemistry and physical properties (i.e., molecular weight) of a cellulose ether variant to the sensorial properties of an ingredient. Further, other important data obtained from surface tension, vapor sorption, and thermal analysis studies were also generated.

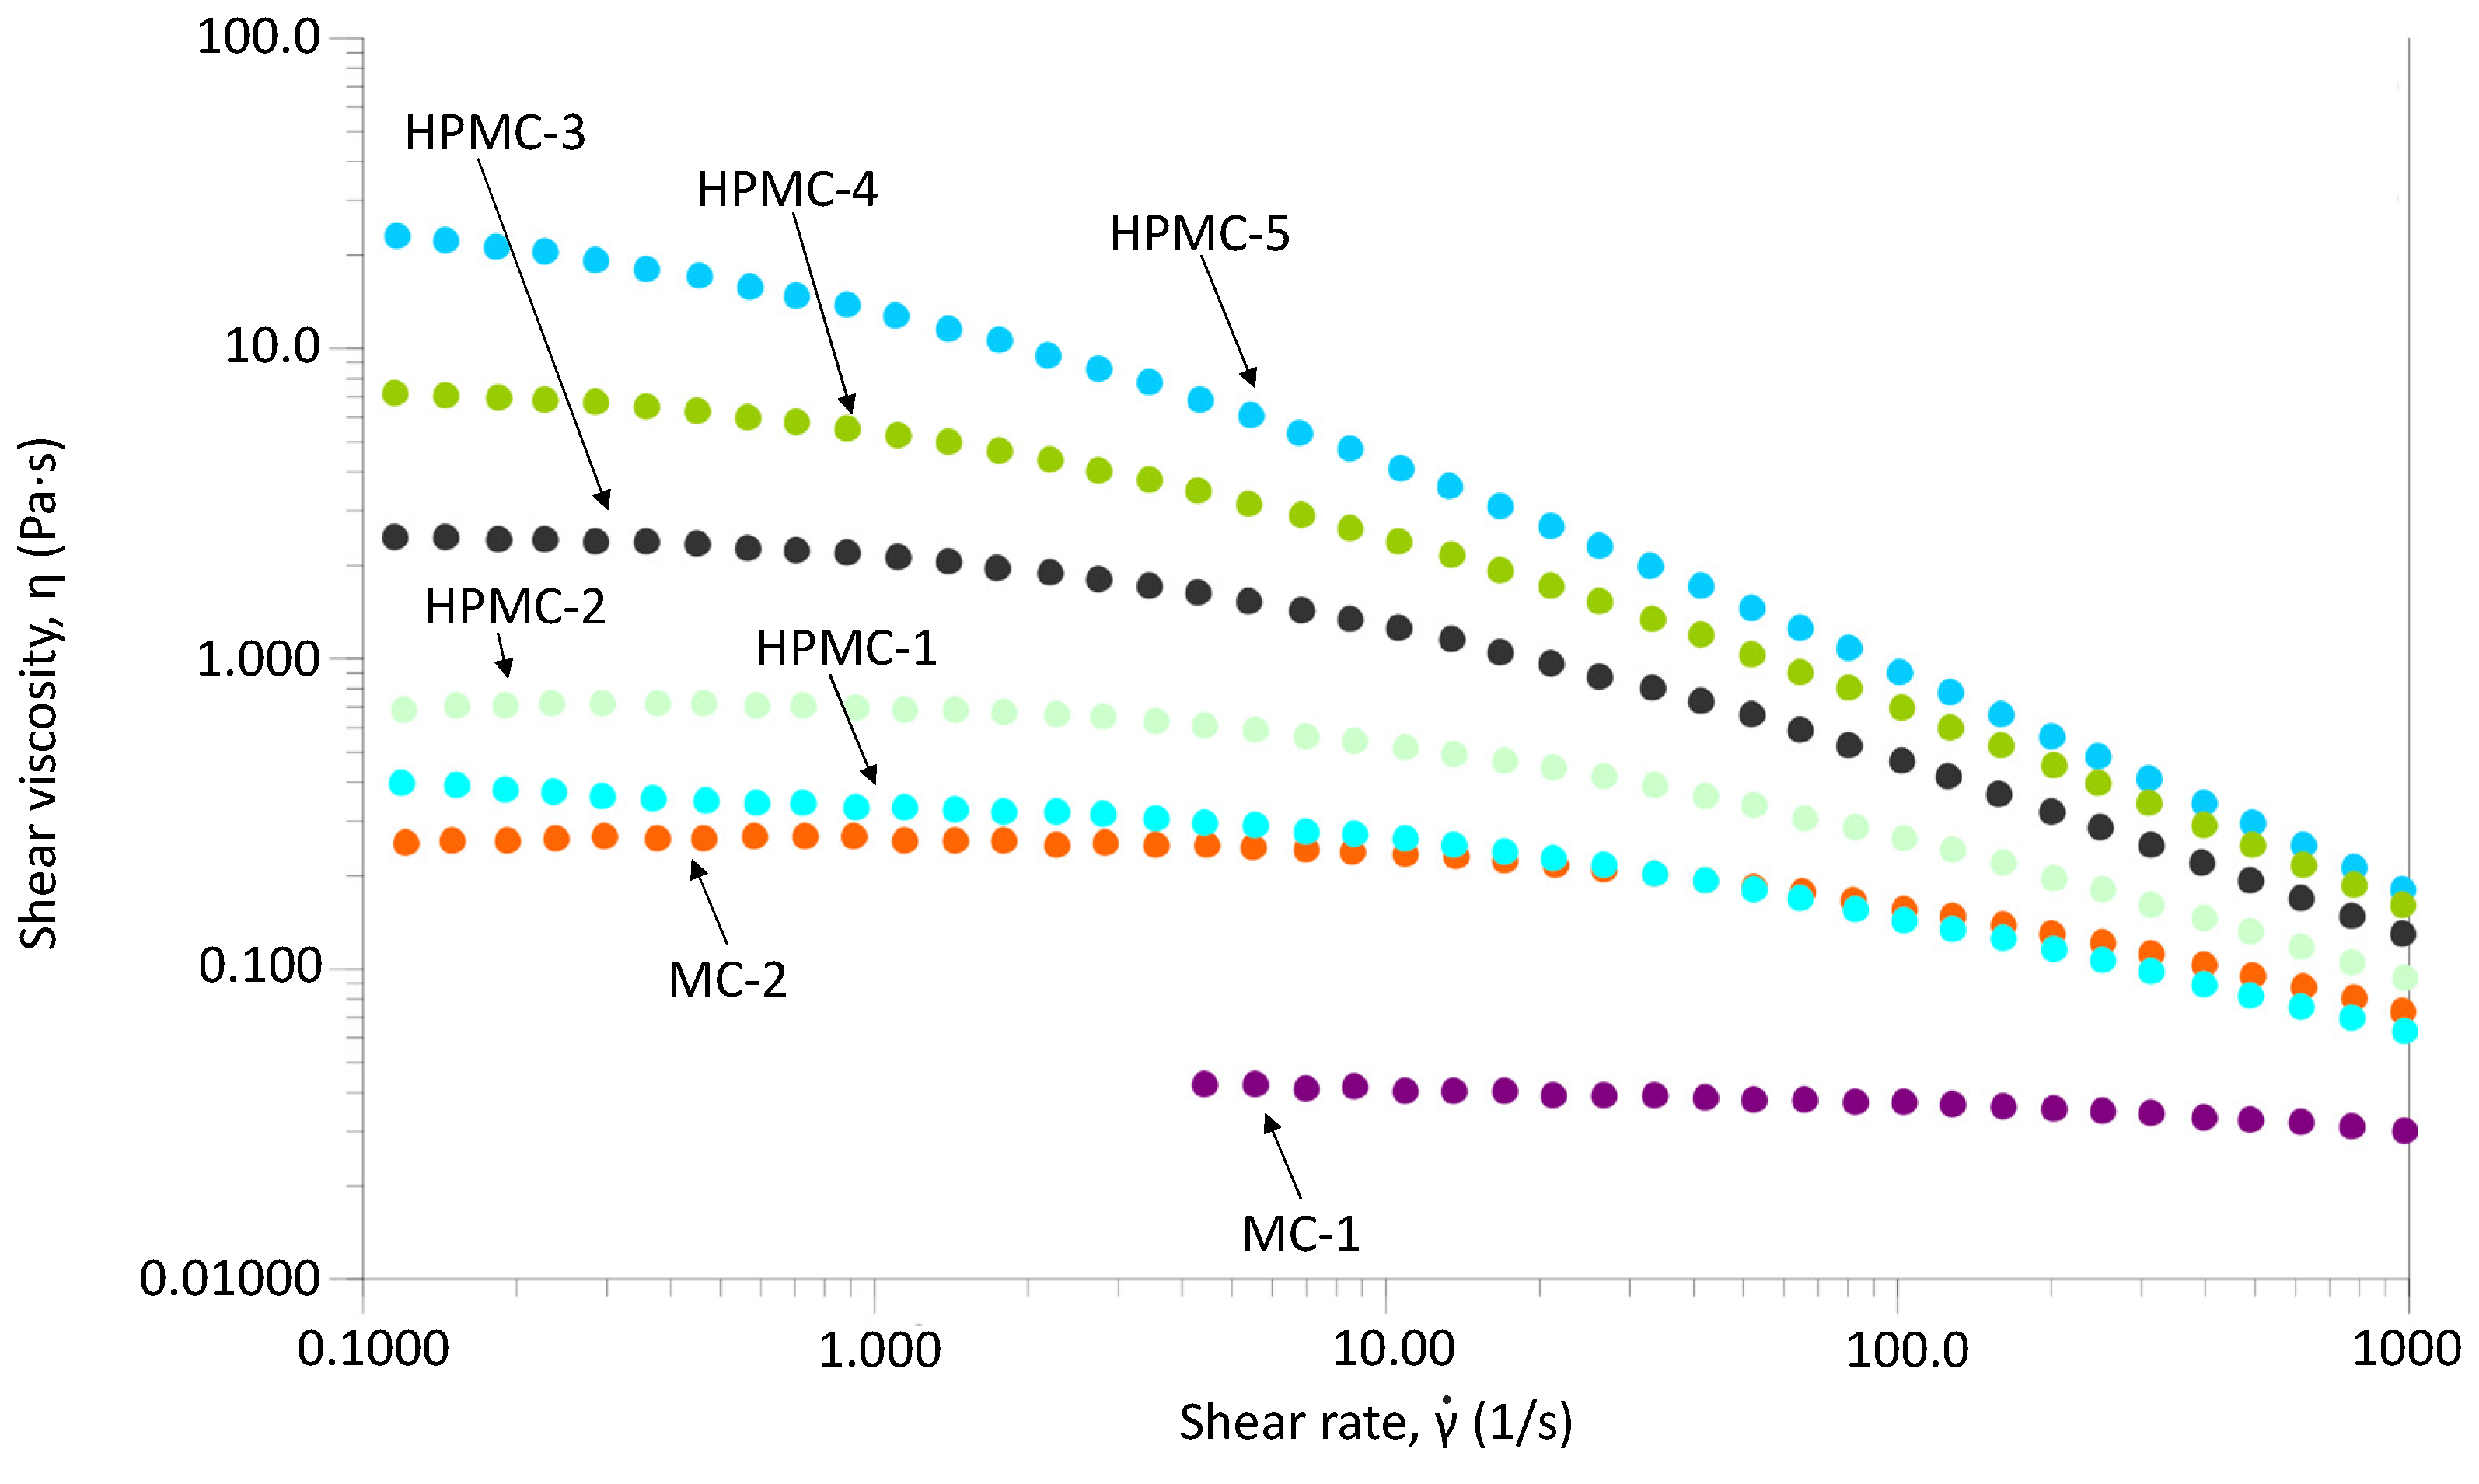
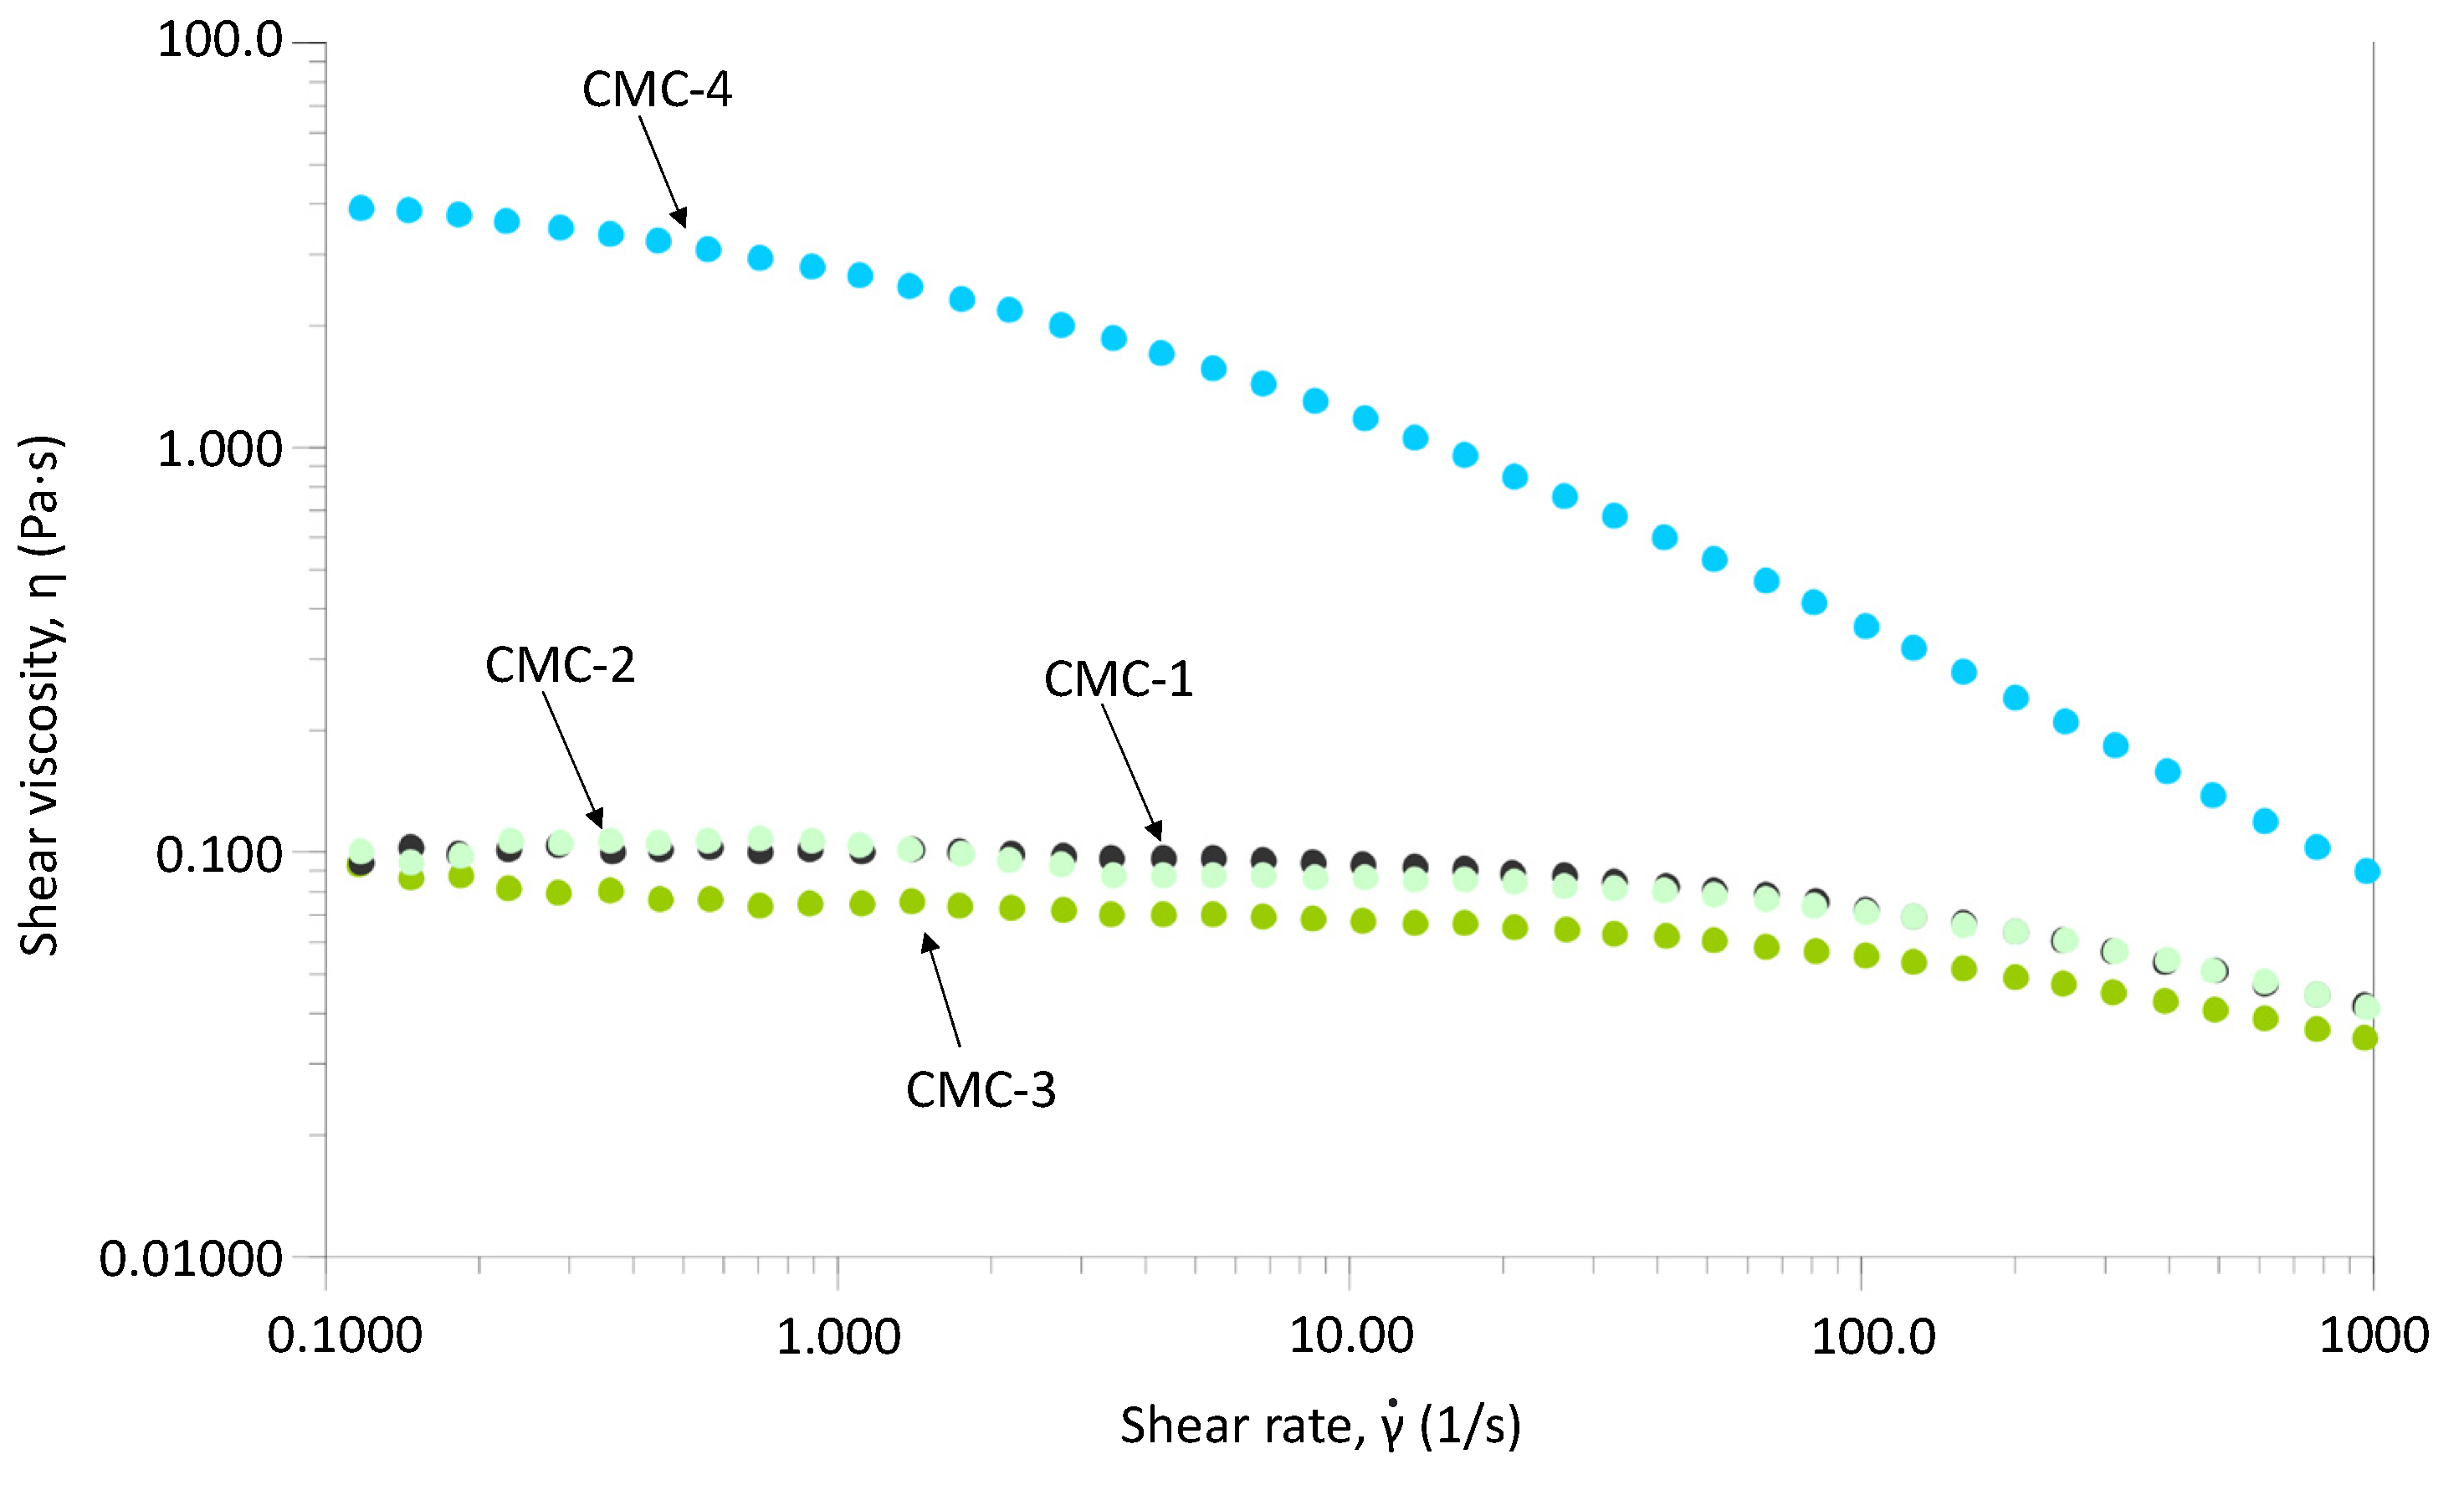
3.1. Solution Clarity, Viscosity, Salt Tolerance, and Surfactant Compatibility

The 1% (w/w) solutions were first evaluated for clarity by taking digital photographs followed by evaluation by a trained panelist to determine whether clear or hazy solutions were formed. Essentially, all of the cellulose ether derivatives formed clear aqueous solutions except for the hydrophobically modified analogues of HEC—HMHEC-1 and HMHEC-2—which produced slightly hazy solutions. There were no changes in the solution clarity when 2% (w/w) NaCl was incorporated into the solutions.
Rheological data were generated for the various grades of HEC, HMHEC, HPC, HPMC, MC, and CMC by conducting continuous shear ramp tests for each 1% (w/w) solution. Figure 2, Figure 3, Figure 4 and Figure 5 contain typical flow curves for the tested cellulose ethers. The viscosity of the variants depends on molecular weight and hydrophobic modification. For example, in all figures, it is clear that the higher molecular weight variants produce higher viscosity. In Figure 2, all of the HEC derivatives follow suit, where the viscosity of HEC-1 < HEC-2 < HEC-3 < HEC-4 < HEC-5.
Not surprisingly, hydrophobically modified HEC variants (HMHEC-1 and HMHEC-2) have higher viscosity than corresponding HEC analogues with similar molecular weight. For example, a good comparison would be HEC-1 (Mw = 90,000 kDa) and HEC-2 (Mw = 300,000 kDa) with HMHEC-1 (Mw = 350,000 kDa). Likewise, HMHEC-2 (Mw = 550,000 kDa) could be compared with HEC-4 and HEC-5, which have molecular weights of 1,000,000 and 1,300,000 kDa, respectively.
Flow curves for the HPC variants are provided in Figure 3. The shear viscosity of these variants is similar in magnitude to that obtained for the HEC analogues. The molecular weight range is similar for the tested HEC and HPC variants, which is the largest contributing factor to viscosity magnitude.
A comparison of the viscosity curves for several molecular weight grades of HPMC and MC is provided in Figure 4. Similar to the case of HEC and HPC, lower viscosities were found for lower molecular weight HPMC samples—HPMC-1 < HPMC-2 < HPMC-3 < HPMC-4 < HPMC-5—which ranged from 400,000 to 1,200,000 kDa. Similarly, higher molecular weight MC (MC-2) has a higher viscosity than lower molecular weight MC (MC-1).
Figure 5 contains flow curves for four CMC derivatives. CMC-1, CMC-2, and CMC-3 have similar molecular weights; however, their DS values are 0.7, 0.9, and 1.2, respectively. The viscosity values across all shear rates are not marginally distinct from one another. Therefore, the effect of DS on viscosity appears to be minimal. However, examining the higher molecular weight sample (CMC-4), we observed a large increase in viscosity.
In addition to viscosity, molecular weight also affects the shear thinning behavior of the cellulose ethers. The higher the molecular weight, the greater the degree of shear thinning. This phenomenon is clearly evident for all of the tested cellulose ethers (Figure 2, Figure 3, Figure 4 and Figure 5).
Salt tolerance was determined by taking the ratio of the viscosity of the polymer solution containing NaCl to the polymer solution without NaCl at two shear rates (0.1 and 1000 s−1). The two shear rates were chosen to represent the extremes of the rheology test and correspond to the low and high shear regions of the flow curves. Table 2 provides a summary of the data obtained for the various cellulose ethers. The HEC variants do not appear to be very affected by the addition of salt, regardless of the molecular weight. In the case of HPC, the majority of the samples (HPC-1, HPC-2, HPC-3, and HPC-4) were not affected very much by the addition of salt; however, the highest molecular weight variant (HPC-5) experienced decreases in viscosity at low and high shear rates as a result of the addition of NaCl. Similarly, higher molecular weight analogues of HPMC are more affected by the presence of NaCl than lower molecular weight species. Essentially, electrolytes can cause electrostatic shielding in the polysaccharide, which can impede the ability of the cellulose ether to form hydrogen bonds with water. As a result, the strength of the interactions of the polymer with water depends on the type of electrolyte as well as its size, charge, and the dimensions of the solvation shells formed by the electrolyte [17].
Moreover, when comparing HPMC with MC of similar molecular weight (HPMC-1 vs. MC-2), MC is more resistant to the addition of NaCl. The DS of the MC samples is higher (1.8 vs. 1.5), and the HPMC samples are derivatized with both hydroxypropyl and methyl groups, which means that more hydroxyl groups are available to interact with added electrolytes. Ultimately, the salt will have a greater impact on HPMC. Lower molecular weight variants of CMC—CMC-1, CMC-2, and CMC-3—are less salt-tolerant than higher molecular weight CMC (CMC-4). The DS also influences the salt tolerance of CMC, with high DS variants being more susceptible to viscosity losses.
Shampoo and body wash products typically contain a mixture of SLES and cocamidopropyl betaine (CAPB). The primary thickening mechanism of these ingredients is the formation of long tubular micelles due to the high surfactant concentration and the presence of salt. These long tubular micelles (also referred to as worms) act like giant polymer chains and form entanglements, leading to a significant viscosity increase in the system. Hydrophilic polymers may increase the entanglement density of the micellar system due to the space occupied by the polymer chains. In addition, the length of the tubules could be increased, allowing tubules to connect with each other and providing enhanced stability to the system. Overall, increased entanglement density results in increased viscosity and relaxation time. The addition of a polymer can also cause disorder to the tubules, especially at higher concentrations, which results in a breakdown of the surfactant network due to high molecular weight or pendant hydrophobic moieties [18].
Surfactant compatibility of the cellulose ethers was determined by taking the ratio of the viscosity of the polymer solution containing 6% (w/w) SLES to the polymer solution without SLES at two shear rates (0.1 and 1000 s−1). Table 3 contains the normalized viscosity measurements for all of the tested polymers. Examining HEC, it appears that there is a slight decrease in the viscosity ratio as a function of molecular weight (HEC-1 > HEC-2 > HEC-4 > HEC-5). Since the cellulose backbone is rigid, it stands to reason that it occupies more space than polymers with flexible backbones. As the length of the chain increases with increasing molecular weight, the polymer chain may occupy a larger volume, ultimately impeding tubular structure growth. Interestingly, the viscosity index values at both shear rates are similar.
In regard to hydrophobic modification, the viscosity of HMHEC is compromised to a greater extent by the addition of surfactant than HEC. In addition, the SLES interaction with HMHEC significantly affects its viscosity at the low shear rate (0.1 s−1), but does not appear to change it very much at the high shear rate (1000 s−1). Most likely, the pendant hydrophobic chains of HMHEC insert inside the surfactant assembly (tubular structure), which could disrupt the thermodynamic equilibrium of the tubules. As a consequence, the tubular structure would be markedly shortened or branched, resulting in a significant decrease in viscosity. Typically, at low shear, longer tubules yield higher viscosity. Increasing shear disrupts the tubules and transforms the surfactant assembly into shorter chains or spheres, and sometimes lamellar structures, which causes a reduction in viscosity.
In the case of HPC, the addition of SLES had a greater effect on the higher molecular weight samples. As observed in the case of HEC, there was not an appreciable difference between the effect of SLES on the low and high shear rates. Similar to HMHEC, the viscosity index values of HPMC are lower at the low shear rate as compared to the high shear rate. There is no clear trend on the effect of SLES for the various molecular weight grades of HPMC. At roughly the same molecular weight, MC is slightly more sensitive to the addition of SLES as compared to HPMC (MC-2 vs. HPMC-1). As already mentioned, some higher molecular weight cellulose ethers are more affected by the presence of SLES than their lower molecular weight counterparts (e.g., compare MC-1 vs. MC-2).
We also investigated the effects of SLES on CMC solution viscosity. Increasing the DS results in a decrease in the viscosity index, although this effect is more pronounced at the low shear rate (0.1 s−1) as compared to the high shear rate (1000 s−1). Such a result suggests that the -COONa+ functionality (as compared to -OH) does not interact favorably with surfactant micelles. Possibly, the carboxylate moieties interact electrostatically with the surfactant headgroup, causing destabilization of the tubular structures. Similar to the case of HMHEC and MC, the viscosity index of the CMC–SLES solution is lower at higher molecular weight (CMC-1 vs. CMC-4). Again, this could be due to increased destabilization of the tubular structures since the occupied volume of the cellulose derivative increases with increasing molecular weight.

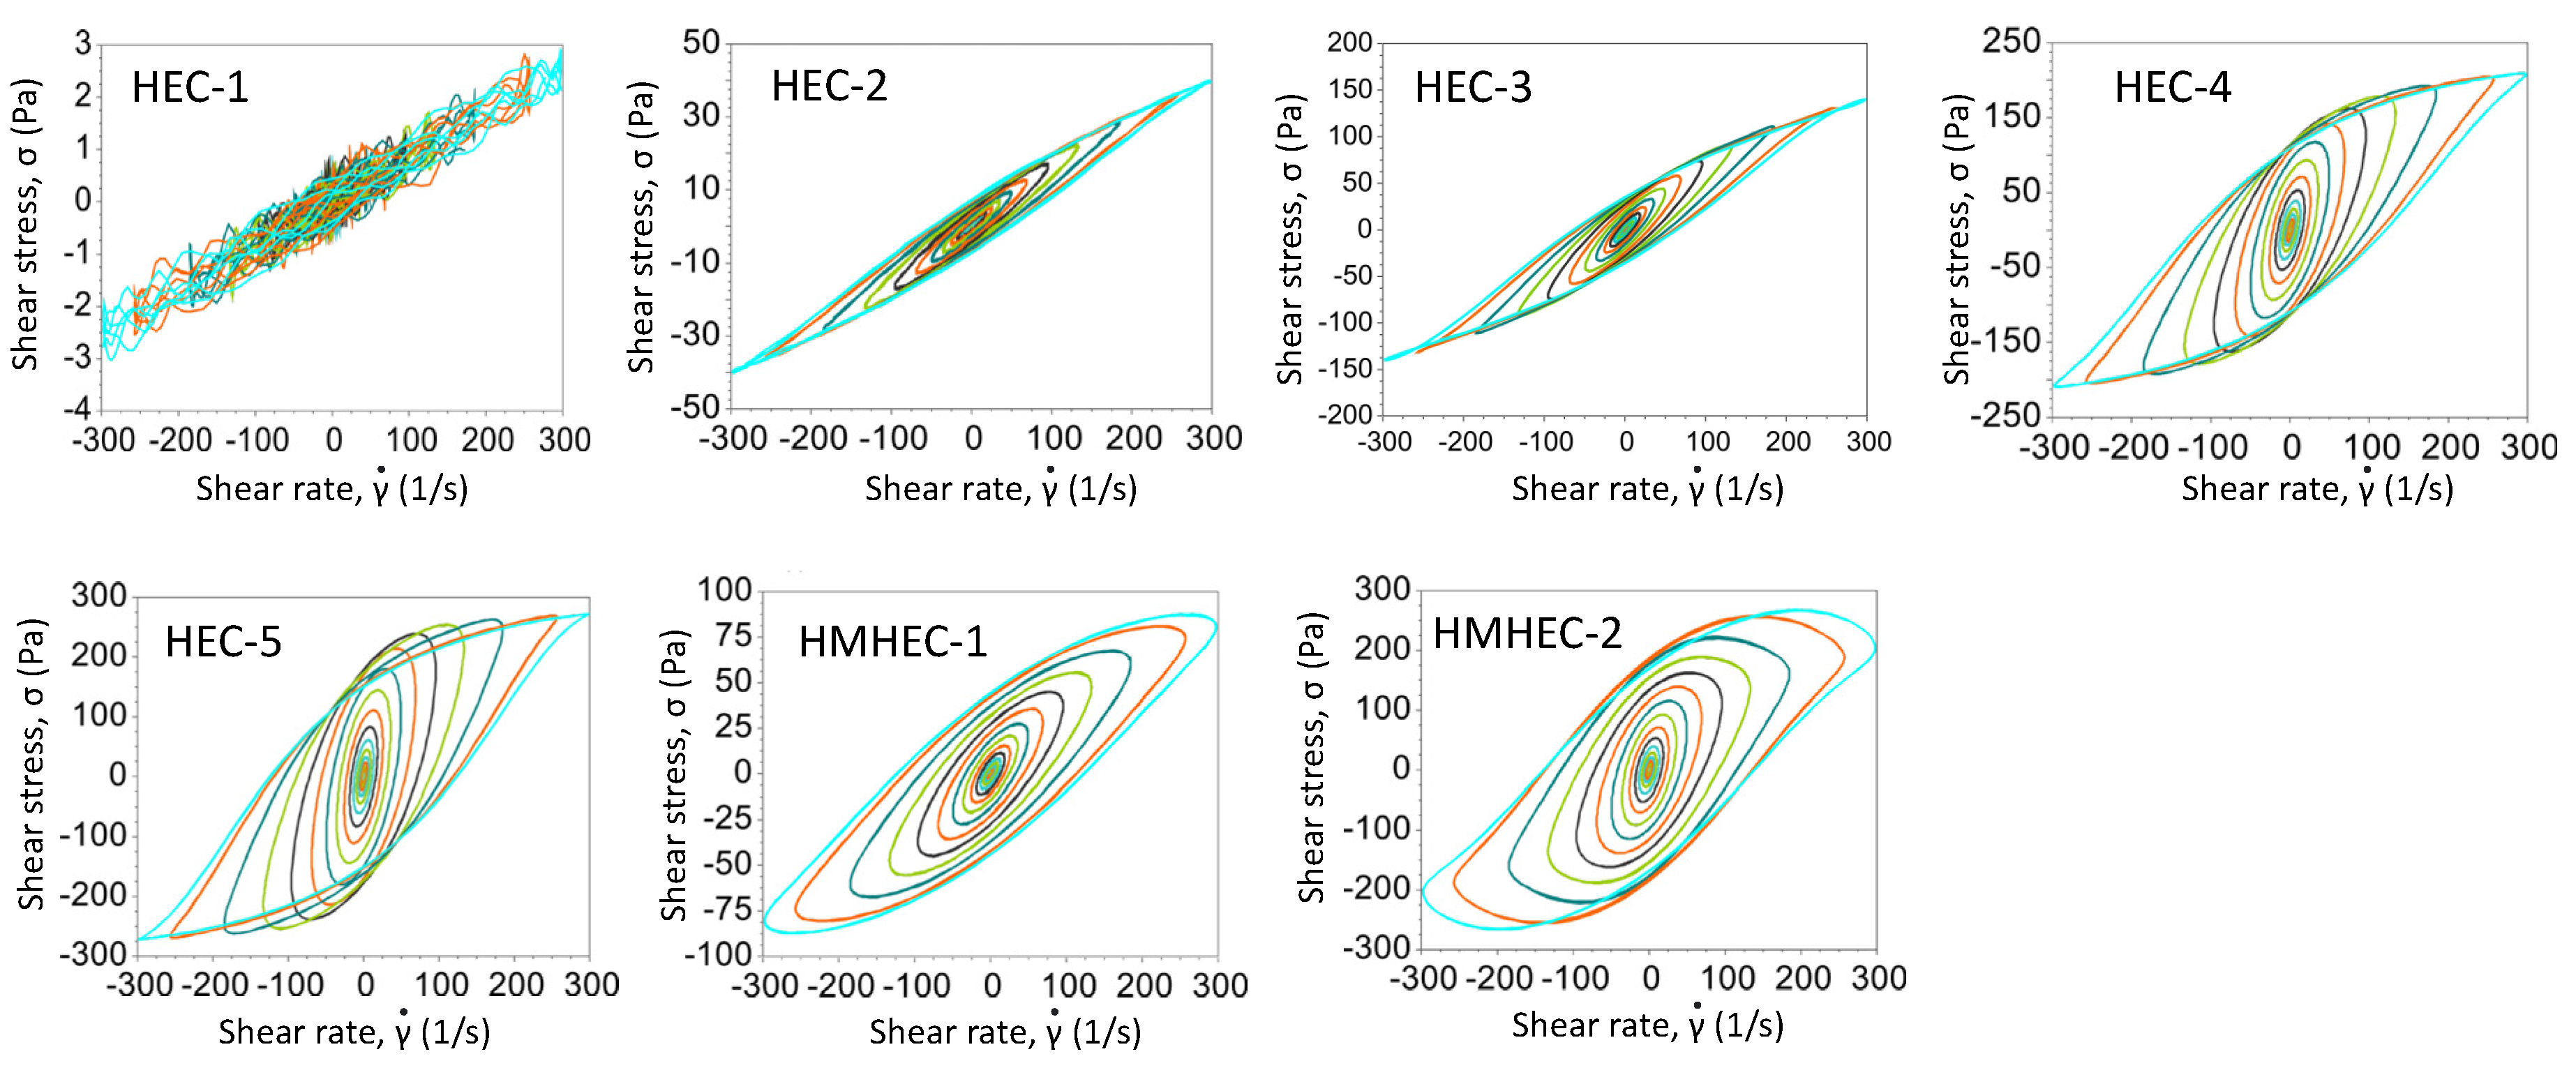
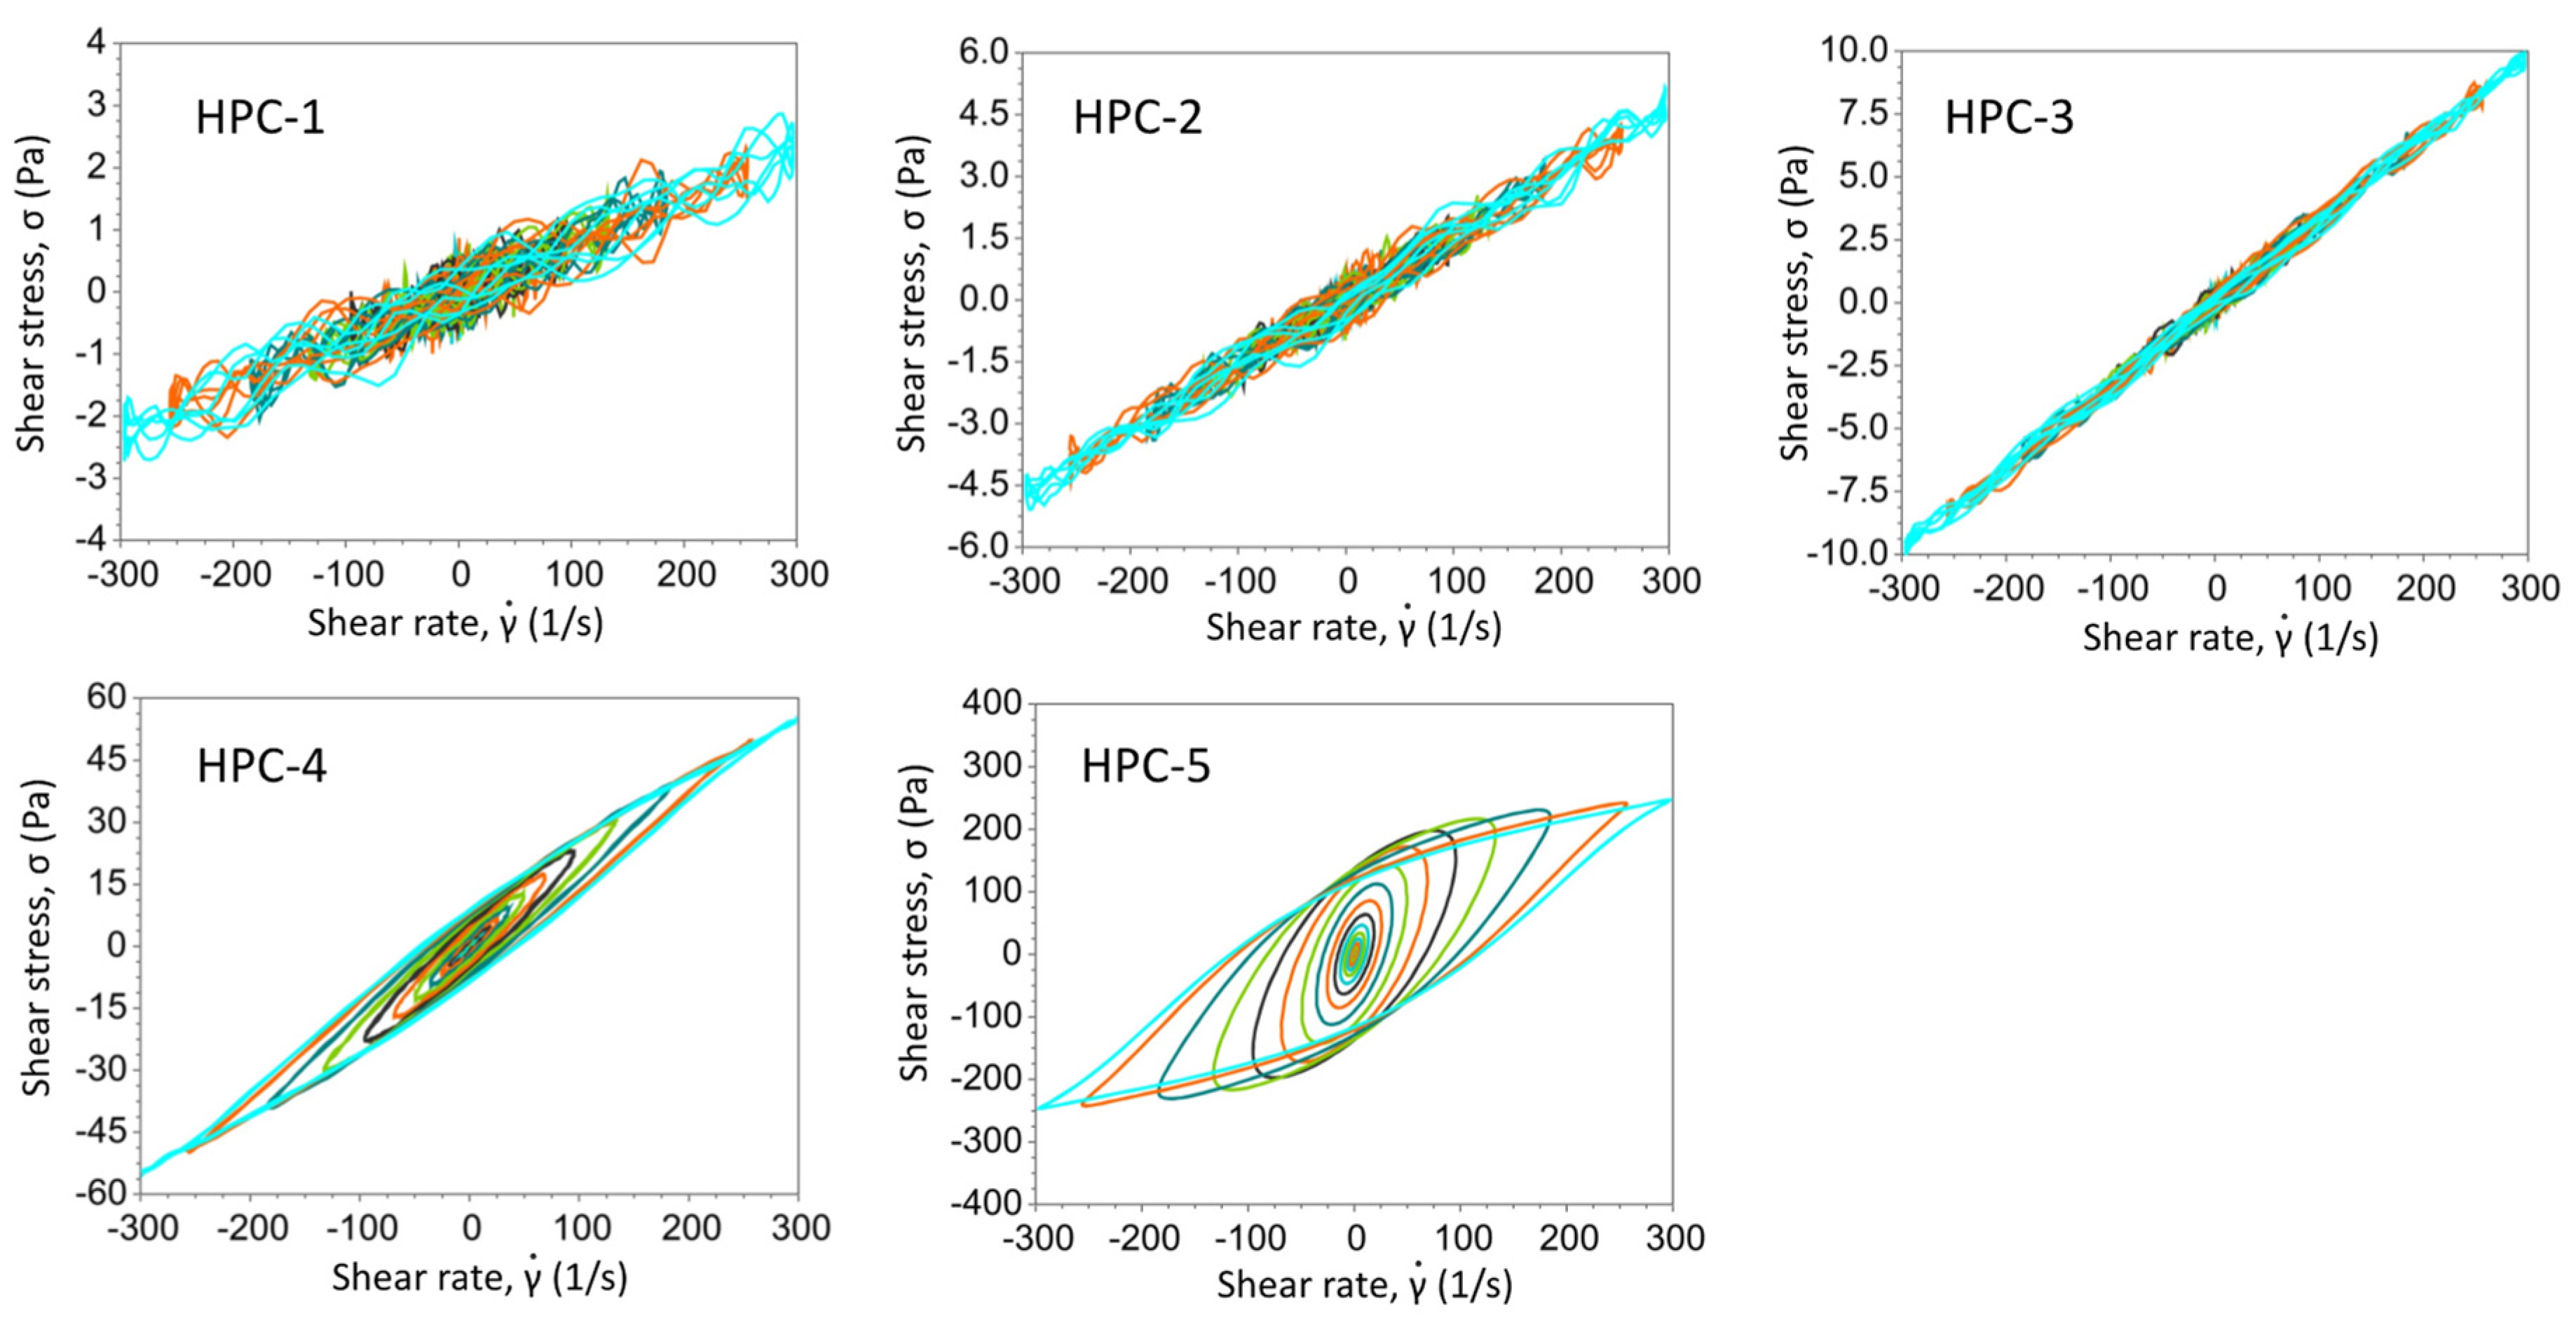
3.2. Textural Properties of the Cellulose Ether Solutions

In previous studies, we utilized a non-linear rheological technique termed LAOS to capture the textural expression perceived by consumers under large and fast deformations [19,20,21]. The LAOS test is a sinusoidal oscillatory flow experiment in which the amplitude of the strain input is selected to be large enough to deform the material beyond the linear viscoelastic limit. The large strain amplitude deforms and changes the formulation or solution architecture of the complex fluid. In practice, the sample is loaded between two parallel discs that are separated by a known gap. Lissajous–Bowditch curves are generated by starting the LAOS experiments with small deformations, which progressively increase with each twist of the parallel plates. In this work, LAOS studies were carried out on 2% (w/w) solutions of the various grades of cellulose ethers.
A linear σ vs. γ ˙ Lissajous–Bowditch plot indicates viscous behavior, while a circular plot suggests elastic behavior. Elliptical-shaped curves demonstrate viscoelastic materials. Figure 6 contains Lissajous–Bowditch curves for several molecular weight variants of HEC as well as the two HMHEC derivatives. The lower molecular weight HECs (HEC-1 and HEC-2) have a much larger viscous component, while the higher molecular weight HECs (HEC-4 and HEC-5) have a larger elastic component as indicated by the greater area occupied by the curves and the greater magnitude of stress encountered during the experiment. These data corroborate with previous work, which shows that, for a series containing various molecular weight samples of poly(ethylene) glycol (PEG) blended with laponite, there is an increase in the magnitude and area occupied by the curves in the Lissajous plot [22]. For further comparison, HMHEC-1 has a larger elastic component than HMHEC-2. If we compare HMHEC with HEC, we find that, for similar molecular weights (HEC-1 vs. HMHEC-1), HMHEC has a greater elastic component. Hydrophobic modification appears to contribute more to the elastic properties of the polymer solution than molecular weight.
Lissajous–Bowditch curves are provided in Figure 7 for the HPC derivatives. The lowest molecular weight derivatives (HPC-1, HPC-2, and HPC-3) primarily have a viscous component with very little elastic contribution, as indicated by the nearly linear Lissajous–Bowditch plots. With increasing molecular weight (HPC-5), we observed a greater elastic component, which is evident by the much greater magnitude of the shear stress scale and the greater ellipticity of the Lissajous–Bowditch curves.
Lissajous–Bowditch curves for HPMC and MC are provided in Figure 8. Again, we observe an increase in the elastic contribution to the overall rheological properties as a function of molecular weight. Comparing similar molecular weight variants of HPMC and MC (HPMC-1 vs. MC-2), there is little difference in the Lissajous–Bowditch curves for the two polymers.
LAOS experiments were also carried out for the CMC variants. Lissajous–Bowditch curves are provided in Figure 9 and demonstrate that the DS does not influence this aspect of rheological behavior (CMC-1 vs. CMC-2 vs. CMC-3). However, comparing the high (CMC-4) and low (CMC-1) molecular weight analogues of CMC (DS = 0.7), we find that the greater molecular weight contributes to the increased level of elasticity found in CMC-4.

3.3. Determination of Friction Coefficient

Due to their lubricious feel properties, cellulose ethers are often used in personal care formulations to modify the sensorial perception experienced by consumers during product application. Static and kinetic coefficients of friction were determined for 1% polymer solutions using a slip/peel tester. A liquid polymer film was applied to a glass substrate and a sled coated with neoprene was dragged across the surface while monitoring the resistance encountered. Static friction refers to the force required to move an object from its resting state by applying a force that is greater than the friction between the object and a surface. On the other hand, kinetic friction, which is often referred to as sliding friction, is the frictional force due to the opposing trajectories of two objects.
Table 4 contains static and kinetic friction coefficient data for the tested cellulose ether variants. Within the HEC derivatives, increasing the molecular weight of HEC results in a decrease in the static and kinetic friction coefficients. It is established in the polymer physics community that increasing polymer molecular weight reduces the friction of systems containing thin films at the interfacial region [23]. In general, molecular weight, molecular structure linearity (as opposed to branched structure), polymer concentration, molecular weight distribution, and molecular size affect the friction behavior of polymers [24]. Likewise, introducing hydrophobic modification to HEC also reduces both friction coefficients. We observed the same trend in friction coefficient reduction with increasing molecular weight for HPMC, MC, and CMC. Interestingly, when comparing similar molecular weight variants with different chemistries (e.g., HEC-2 vs. HPMC-1 vs. MC-1) we are unable to distinguish differences in the static friction coefficient of HEC, HPMC, and MC; however, there appears to be some differences in the kinetic coefficient of friction with the following order of increasing friction: HEC-1 < HPMC-1 < MC-1. The friction coefficients of comparable molecular weight CMC (CMC-4) are significantly lower than those obtained for the other cellulose ethers. Friction coefficient data are not provided for the HPC variants due to their low viscosity, as compared to the other samples, making it difficult to carry out the test. Overall, the friction coefficients increase with increasing hydrophilicity. Finally, changing the DS (CMC-1 vs. CMC-2 vs. CMC-3) does not result in any differences in the static friction coefficient.

3.4. Vapor Sorption Properties

Vapor sorption properties of the cellulose ethers were determined by DVS. After an extensive drying step, each sample was equilibrated for 6 h at 25 °C and 90% RH. The % weight gain at the end of the test is reported in Table 5 for all tested cellulose ether derivatives. Vapor sorption data can assist with predictive decisions about the water absorption and humidity resistance of cellulose ether films.
The data in Table 5 demonstrate the role played by chemistry in determining the vapor sorption behavior of the different ingredients. It was found that vapor sorption increased with increasingly polar pendant groups on the cellulose backbone: MC < HPC < HPMC < HEC < CMC. Not surprisingly, molecular weight does not affect the vapor sorption under the steady-state test conditions employed in this study. This is due to our extensive equilibration time of 6 h. Molecular weight may be a factor if shorter equilibration times were employed, which could shed light on kinetic and diffusivity behavior.
Contrary to what one might expect, hydrophobic modification of HEC did not alter its vapor sorption properties. More than likely, vapor sorption remained steady due to the extremely low degree of hydrophobic modification (DS~0.005) in HMHEC-1 and HMHEC-2. While such modification is sufficient to change the rheological properties of HEC, much higher degrees of substitution are required to change its vapor sorption behavior.
In the case of CMC, we found that the DS has an effect on its vapor sorption properties. As DS increases from 0.7 to 0.9, there is a slight increase in vapor sorption, while further extending the DS to 1.2 results in a rather large increase. Considering the hydrophilicity of the carboxymethyl groups in CMC, such a result is not surprising.

3.5. Surface Tension Measurements

In cosmetic chemistry, surface and interfacial tension are extremely important factors in determining the efficacy of products in many different applications. In this work, equilibrium surface tension measurements were carried out using the Wilhelmy plate technique. This test was carried out by immersing a thin platinum plate in the cellulose ether solutions and then measuring the force required to withdraw the plate from the solution.
Table 6 contains the surface tension data obtained for 0.1% (w/w) solutions of the cellulose ethers. As indicated by the data, chemical structure is the primary determining factor of surface tension values. Solutions of HPC produce the lowest surface tension values of the cellulose ethers reported in the table, with values approximating 41 mN/m. More than likely, this can be explained by the higher degree of substitution in the HPC samples. For example, collectively, one would expect HPMC and MC to be significantly hydrophobic (or less soluble in the bulk phase); however, since HPMC and MC have low degrees of MS, there are greater quantities of hydroxyl groups present on the polysaccharide backbone, which contributes to a higher surface tension (51–54 mN/m for HPMC and 56–57 mN/M for MC). Likewise, HEC surface tension data range from 46–49 mN/m, which are significantly higher than the HPC derivatives. This difference can be explained by the higher degree of MS of HPC (~4.0 for HPC vs. ~2.6 for HEC) and the greater contribution of the hydroxypropyl moiety, as compared to the hydroxyethyl group, to the hydrophobic character of the polysaccharide.
Comparing the data presented in this study with previously published results, a surface tension value of 43.6 mN/m was reported for a 0.1% (w/w) solution of HPC, which nicely parallels the value of 41.0 mN/m in this work [25]. Likewise, a study of a 2% (w/w) HPMC solution resulted in a surface tension determination of 52.88 mN/m, compared to 51–54 mN/m in this study [26]. On the other hand, the values we obtained for HEC, which range from 45–49 mN/m, are lower than values reported in the literature (66.8 mN/m) for a 0.1% (w/w) solution with MS = 2.5 [25]. This is due to minor amounts of surfactant additives, which help prevent anticaking of the selected cosmetic grades of HEC. Testing the corresponding surfactant-free samples results in surface tension values of 68.2 (Mw = 90,000 Da), 67.3 (Mw = 300,000 Da), 67.0 (Mw = 720,000 Da), 67.1 (Mw = 1,000,000 Da), 67.1 (Mw = 1,000,000 Da), and 67.4 (Mw = 1,300,000 Da) for 0.1% (w/v) solution at 20 °C [27]. These data indicate that there is not a significant surface tension dependence on molecular weight in the case of HEC. On the other hand, it has been shown that increasing the MS of HEC results in a slight decrease in surface tension [12].
The HMHEC samples produced surface tension values ranging from 58–60 mN/M, which are significantly lower than the surfactant-free HEC samples. Such a result suggests that the hydrophobic modification of HEC results in an increase in its surface activity, which is in agreement with studies comparing ethyl(hydroxyethyl) cellulose and hydrophobically modified ethyl(hydroxyethyl) cellulose [28].
In addition, the surface tension of a 1% (w/w) solution of CMC was previously reported to be 71 mN/m—also in line with the values in Table 6 [25]. These data suggest that CMC is very soluble in the bulk phase, and there is little migration to the air–water interface. For comparison, we measured the surface tension of deionized water, resulting in an average value of 71.479 ± 0.119 mN/m, which is consistent with the generally accepted values obtained for water.
The surface tension data presented thus far represent a single concentration point. By measuring surface tension at various concentrations, a plot can be constructed, allowing the critical aggregation concentration (CAC) to be determined. CAC is analogous to critical micelle concentration (CMC), which describes the bulk-phase concentration of a surfactant solution at which any additionally added surfactant will form micelles. Prior to reaching the CMC, the surface tension undergoes a sharp drop; however, once the CMC is reached, the surface tension remains steady with the added surfactant. While CMC is specific for micelle formation, CAC refers to the formation of any type of aggregate, regardless of its shape, and is commonly used to describe the behavior of polymer solutions. We measured the surface tension for two molecular weight grades of HEC (HEC-1 and HEC-3) at various concentrations and found the CAC to be 0.001% (w/w). A surface tension study of MC revealed a CAC of 0.001% (w/w), similar to our value obtained for HEC [29]. In agreement with our observations, the same researchers found that molecular weight does not affect the equilibrium surface tension or CAC of MC.

3.6. Thermal Analysis

DSC and TGA were carried out to characterize the influence of temperature on the physical and chemical structure of the cellulose ethers. In a DSC experiment, the heat flow of a sample is monitored as a function of temperature in a controlled environment. Thermal transitions that occur during the heating ramp can be endothermic or exothermic events. Amorphous (non-crystalline or semi-crystalline) materials have a characteristic Tg, which can be determined with DSC, whereas Tm represents the onset of melting for crystalline domains in the polymer. The Tg represents the inflection in the DSC heat flow curve, which indicates that sufficient energy has been provided to enable neighboring segments in the polymer to synchronously wiggle and vibrate. At the Tg, the volume and heat capacity of the glassy material increase, and the substance undergoes a physical transition to a rubbery state. The determination of Tg is important for pharmaceutical applications, such as spray drying and hot-melt extrusion, where polymers are used to enhance the solubility of active pharmaceutical ingredients [30]. It is also a key parameter that is used to characterize hair-styling ingredients, providing insight into the dissipative mechanical properties of film-forming polymers [31]. During a Tm transition, which involves a change in physical state, thermal energy scrambles the ordered chain segments. The increase in entropy dissolves the crystal lattice and abruptly increases sample volume while exchanging heat with its surroundings. After melting, film pliability and tack properties increase, and with additional heating, the polymer chains undergo translational flow.
Measuring the dry Tg of cellulose derivatives is not a trivial task. The inherent structural backbone of cellulose is rigid, meaning that the free rotation of chemical bonds around the chain axis is limited. Hence, at the glass transition, the change in heat capacity is minimal, making it difficult to observe a marked heat flow inflection. One simple solution to enhance the thermal transition sensitivity for cellulosic polymers is to increase the heating rate (e.g., from 10 to 20 °C/min); however, increasing the heating rate decreases thermogram resolution.
A second tactic involves using hermetically sealed DSC pans to retain physisorbed atmospheric moisture during heating. The added water increases the free volume surrounding the cellulose chains to provide a sharp but plasticized Tg, which emerges in the thermogram for most cellulose ethers in the first heat, between 40 and 70 °C. Note that using hermetically sealed pans and trapped ambient water vapor likely provides the best Tg value for predicting the mechanics of ambient film applications.
A third approach (used in this work) is to closely approximate the dry glass transition by using a controlled drying step (prior to the first heat) to leave residual bound moisture on the cellulose backbone, whereby the increase in free volume is sufficient to clearly resolve a heat flow inflection. Finally, to further complicate the success of a dry Tg measurement, bear in mind that MS, substituent blockiness, and consequential structural microheterogeneity tend to broaden otherwise sharp heat flow inflections, thereby rendering the assignment of precise dry glass transitions non-trivial.
Table 7 provides the Tg, Tm, and Tp data for each polymer. Immediately apparent are the differences in Tg and Tp for each category of cellulose ether. In general, chemistry, DS/MS, and molecular weight influence the value of the dry Tg. The chemistry of the cellulose ethers affects Tg since different pendant groups influence intrinsic polymeric hydrogen bonding and interactions with water vapor, which acts as a plasticizing agent and lowers the Tg. Hence, the drying steps in a DSC method influence the reported Tg, where polymers containing hydrophilic groups are expected to retain some residual moisture [32,33,34,35]. Typically, increasing polymer molecular weight results in an increase in Tg since a higher molecular weight polymer with longer chains is more entangled and has less free wiggle volume than a lower molecular weight polymer. As indicated in Table 7, this was observed for HEC and HMHEC.
Keep in mind that DS and/or MS influence free volume and, therefore, play an important role in the evaluated Tg of a cellulose ether. If DS and MS are very low, the polymer would be expected to display higher Tg values, approaching the Tg of cellulose fibers (190-250 °C) [36]. For example, HPC likely produces lower Tg values than HEC simply because the number and length of pendant chains in HPC are greater than those observed in HEC. The HPMC variants have Tg values higher than HEC, which conceivably stems from the introduction of methyl substitution (i.e., no pendant chain growth) and low hydroxypropyl MS. Interestingly, we see only slight differences in Tg when comparing the three CMC derivatives with various DS values (CMC-1, CMC-2, and CMC-3) and at higher and lower molecular weight (CMC-1 vs. CMC-4). The differences in DS may be too small to influence Tg. An alternative explanation could be that hydroxy and carboxy groups lead to similar plasticization of depolymerized cellulose linters. Moreover, molecular weight does not produce any differentiation in the Tg of CMC, and this may be related to the molecular weights chosen for the study (MW > 250 kDa). According to Flory and Huggins, for polymers of the same composition, the Tg is expected to plateau at a maximum value as the number average molecular weight (Mn) of the polymer increases (e.g., Mn > 50–100 kDa). Hence, thermal measurements provided poor differentiation for the various molecular weight grades of CMC.
The HPMC variants yielded the highest Tg values followed by HMHEC, MC, CMC, HEC, and HPC. Note that HPC is the only derivative with a measurable melting transition (173–179 °C; ΔHfus = 3–5 J/g), suggesting that HPC is approximately 15% crystalline [36]. Further, although not provided in Table 7, HPC also shows a secondary thermal transition that more closely parallels the characteristic cellulose ether transitions displayed in Table 7. As with other cellulose ether grades, the location of the transient 100–135 °C inflection is influenced by residual water and thermal history and is likely related to segmental vibrations of the plasticized cellulose backbone.
In TGA, the sample is heated above the pyrolysis temperature (Tp) of the material in an oxygen-free environment, and changes in the sample weight are continuously monitored as a function of increasing temperature. Tp is defined as the extrapolated onset of a mass loss event in the weight vs. temperature thermogram [37]. For cellulose derivatives, factors such as reactivity, porosity, and the type of atmosphere (i.e., air vs. nitrogen gas) affect the magnitude of Tp. The Tp for cellulose ethers is governed by chemical composition and is lowest for the CMC variants followed by (in increasing order): HEC, HMHEC, HPMC, MC, and HPC. Likely, the specific substituent and DS and/or MS influence the bond dissociation energy and stability of the physical polymer–polymer chain interactions. Based on the data, it is likely that Tp is not influenced by polymer molecular weight.

4. Conclusions

In this work, we monitored a number of important physicochemical properties of cellulose ethers commonly used in personal care products. The rheological behavior of these ingredients is predominantly controlled by molecular weight and hydrophobic modification. In addition to conventional flow curves, Lissajous–Bowditch curves were obtained from LAOS experiments to provide insight into the influence of molecular weight and chemistry to the sensorial/textural properties of these ingredients. Further, we found that surface tension is greatly influenced by DS/MS, which provides an overall indicator of chemistry for each cellulose ether analogue. The vapor sorption characteristics of the cellulose ethers closely parallel the results one would expect based on a molecule’s chemical composition, where cellulose ethers with more hydrophobic characteristics absorb less water. Finally, thermal analysis was carried out to determine key parameters, such as Tg, of the cellulose ether variants. In general, increasing the molecular weight leads to an increase in Tg. The chemistry of pendant groups on the anhydroglucose ring also influences the measured values of Tg with greater hydrophobicity correlating with a higher Tg.

Author Contributions

Conceptualization, R.L.M., S.O. and T.G.; methodology, R.L.M., S.O. and T.G.; software, R.L.M., S.O. and T.G.; validation, R.L.M., S.O. and T.G.; formal analysis, R.L.M., S.O. and T.G.; investigation, R.L.M., S.O. and T.G.; resources, R.L.M.; data curation, R.L.M., S.O. and T.G.; writing—original draft preparation, R.L.M., S.O. and T.G.; writing—review and editing, R.L.M., S.O. and T.G.; visualization, R.L.M., S.O. and T.G.; supervision, R.L.M.; project administration, R.L.M. All authors have read and agreed to the published version of the manuscript.

Funding

This research received no external funding.

Acknowledgments

The authors would like to express their gratitude to the Ashland LLC R&D management team for their support of this project. We would like to especially acknowledge Bert Kroon for his input and advice about the manuscript.

Conflicts of Interest

The authors declare no conflict of interest.

References

  1. Wertz, J.; Bédué, O.; Mercier, J. Cellulose Science and Technology; EPFL Press: Lausanne, Switzerland, 2010. [Google Scholar]
  2. Kamide, K. Cellulose and Cellulose Derivatives: Molecular Characterization and its Applications; Elsevier: Amsterdam, The Netherlands, 2005. [Google Scholar]
  3. Kongruang, S.; Han, M.; Breton, C.G.; Penner, M. Quantitative analysis of cellulose-reducing ends. Appl. Biochem. Biotechnol. 2004, 113, 213–231. [Google Scholar] [CrossRef]
  4. Wüstenberg, T. Cellulose. In Cellulose and Cellulose Derivatives in the Food Industry: Fundamentals and Applications; Wiley-VCH: Weinheim, Germany, 2015; pp. 91–141. [Google Scholar]
  5. Coffey, D.; Bell, D. Cellulose and Cellulose Derivatives. In Food Polysaccharides and Their Applications; Stephen, A., Ed.; Marcel Dekker: New York, NY, USA, 1995; pp. 123–153. [Google Scholar]
  6. Arca, H.; Mosquera-Giraldo, L.; Bi, V.; Xu, D.; Taylor, L.; Edgar, K. Pharmaceutical applications of cellulose ethers and cellulose ether esters. Biomacromolecules 2018, 19, 2351–2376. [Google Scholar] [CrossRef] [PubMed]
  7. Croll, S.; Kleinlein, R. Influence of Cellulose Ethers on Coating Performance. In Water-Soluble Polymers; Glass, J., Ed.; American Chemical Society: Washington, DC, USA, 1986; pp. 333–350. [Google Scholar]
  8. Liu, K.; Du, H.; Zheng, T.; Liu, H.; Zhang, M.; Zhang, R.; Li, H.; Xie, H.; Zhang, X.; Ma, M.; et al. Recent advances in cellulose and its derivatives for oilfield applications. Carbohydr. Polym. 2021, 259, 117740. [Google Scholar] [CrossRef] [PubMed]
  9. Brady, J.; Dürig, T.; Lee, P.; Li, J. Polymer properties and characterization. In Developing Solid Oral Dosage Forms; Qiu, Y., Ed.; Academic Press: London, UK, 2016; pp. 181–223. [Google Scholar]
  10. Final report on the safety assessment of hydroxyethylcellulose, hydroxypropylcellulose, methylcellulose, hydroxypropylmethylcellulose, and cellulose gum. J. Am. Coll. Toxicol. 1986, 5, 1–59. [CrossRef]
  11. Desmarais, A.; Wint, R. Hydroxyalkyl and ethyl ethers of cellulose. In Industrial Gums: Polysaccharides and Their Derivatives; Whistler, R., BeMiller, J., Eds.; Academic Press: San Diego, CA, USA, 1993; pp. 505–535. [Google Scholar]
  12. Klug, E. Some properties of water-soluble hydroxyalkyl celluloses and their derivatives. J. Poly. Sci. Part C 1971, 36, 491–508. [Google Scholar] [CrossRef]
  13. Lopez, C.; Colby, R.; Graham, P.; Cabral, J. Viscosity and scaling of semiflexible polyelectrolyte NaCMC in aqueous salt solutions. Macromolecules 2016, 50, 332–338. [Google Scholar] [CrossRef]
  14. DeButts, E.; Hudy, J.; Elliot, J. Rheology of sodium carboxymethylcellulose solutions. Ind. Eng. Chem. 1957, 49, 94–98. [Google Scholar] [CrossRef]
  15. Benyounes, K.; Remli, S.; Benmounah, A. Rheological behavior of hydroxyethylcellulose (HEC) solutions. J. Phys. Conf. Ser. 2018, 1045, 012008. [Google Scholar] [CrossRef]
  16. Prodduturi, S.; Manek, R.; Kolling, W.; Stodghill, S.; Repka, M. Water vapor sorption of hot-melt extruded hydroxypropyl cellulose films: Effect on physico-mechanical properties, release characteristics, and stability. J. Pharm. Sci. 2004, 93, 3047–3056. [Google Scholar] [CrossRef]
  17. Blažková, A.; Hrivíková, J.; Lapčík, L. Viscosity properties of aqueous solutions of hydroxethylcellulose. Chem. Papers 1990, 44, 289–301. [Google Scholar]
  18. Kwiatkowski, A.; Sharma, H.; Molchanov, V.; Orekhov, A.; Vasiliev, A.; Dormidontova, E.; Philippova, O. Wormlike surfactant micelles with embedded polymer chains. Macromolecules 2017, 50, 7299–7308. [Google Scholar] [CrossRef]
  19. Ozkan, S.; Alonso, C.; McMullen, R. Rheological fingerprinting as an effective tool to guide development of personal care formulations. Int. J. Cosmet. Sci. 2020, 42, 536–547. [Google Scholar] [CrossRef] [PubMed]
  20. Ozkan, S.; Gillece, T.; Senak, L.; Moore, D. Characterization of yield stress and slip behaviour of skin/hair care gels using steady flow and LAOS measurements and their correlation with sensorial attributes. Int. J. Cosmet. Sci. 2012, 34, 193–201. [Google Scholar] [CrossRef] [PubMed]
  21. Gillece, T.; McMullen, R.; Fares, H.; Senak, L.; Ozkan, S.; Foltis, L. Probing the textures of composite skin care formulations using large amplitude oscillatory shear. J. Cosmet. Sci. 2016, 67, 121–159. [Google Scholar] [PubMed]
  22. Sun, W.; Yang, Y.; Wang, T.; Liu, X.; Wang, C.; Tong, Z. Large amplitude oscillatory shear rheology for nonlinear viscoelasticity in hectorite suspensions containing poly(ethylene glycol). Polymer 2011, 52, 1402–1409. [Google Scholar] [CrossRef]
  23. Yu, K.; Hodges, C.; Biggs, S.; Cayre, O.; Harbottle, D. Polymer molecular weight dependence on lubricating particle-particle interactions. Ind. Eng. Chem. Res. 2018, 57, 2131–2138. [Google Scholar] [CrossRef]
  24. Matjukhov, A.; Mironov, B.; Anisimov, I. The influence of molecular mass distribution, size, and elasticity of macromolecules on friction reduction effect. In The Influence of Polymer Additives on Velocity and Temperature Fields; Gampert, B., Ed.; Springer: Essen, Germany, 1985; pp. 107–118. [Google Scholar]
  25. Majewicz, T.; Erazo-Majewicz, P.; Podlas, T. Cellulose ethers. In Encyclopedia of Polymer Science and Technology; Mark, H., Ed.; John Wiley & Sons: Hoboken, NJ, USA, 2002; pp. 507–532. [Google Scholar]
  26. Riedl, Z.; Szklenárik, G.; Zelkó, R.; Marton, S.; Rácz, I. The effect of temperature and polymer concentration on dynamic surface tension and wetting ability of hydroxypropylmethylcellulose solutions. Drug. Dev. Ind. Pharm. 2000, 26, 1321–1323. [Google Scholar] [CrossRef] [PubMed]
  27. Formulating Elegant Liquid and Semisolid Drug Products: Natrosol 250 Hydroxyethylcellulose (HEC); PHA18-101; Ashland LLC: Wilmington, DE, USA, 2018.
  28. Um, S.; Poptoshev, E.; Pugh, R. Aqueous solutions of ethyl (hydroxyethyl) cellulose and hydrophobic modified ethyl (hydroxethyl) cellulose polymer: Dynamic surface tension measurements. J. Colloid Interface Sci. 1997, 193, 41–49. [Google Scholar] [CrossRef]
  29. Nasatto, P.; Pignon, F.; Silveira, J.; Duarte, M.; Noseda, M.; Rinaudo, M. Interfacial properties of methylcelluloses: The influence of molar mass. Polymers 2014, 6, 2961–2973. [Google Scholar] [CrossRef] [Green Version]
  30. Newman, A.; Zografi, G. Commentary: Considerations in the measurement of glass transition temperatures of pharmaceutical amorphous solids. AAPS PharmSciTech 2020, 21, 26. [Google Scholar] [CrossRef] [Green Version]
  31. Rafferty, D.; Zellia, J.; Hasman, D.; Mullay, J. Polymer composite principles applied to hair styling gels. J. Cosmet. Sci. 2008, 59, 497–508. [Google Scholar] [CrossRef]
  32. Kubát, J.; Pattyranie, C. Transitions in cellulose in the vicinity of −30 °C. Nature 1967, 215, 390–391. [Google Scholar] [CrossRef]
  33. Salmén, N.; Back, E. The influence of water on the glass phase transition temperature of cellulose. Tappi 1977, 60, 137–140. [Google Scholar]
  34. Szcześniak, L.; Rachocki, A.; Tritt-Goc, J. Glass transition temperature and thermal decomposition of cellulose powder. Cellulose 2008, 15, 445–451. [Google Scholar] [CrossRef]
  35. Hancock, B.; Zografi, G. The relationship between the glass transition temperature and the water content of amorphous pharmaceutical solids. Pharm. Res. 1994, 11, 451. [Google Scholar] [CrossRef]
  36. ASTM E2550-21; Standard Test Method for Thermal Stability by Thermogravimetry. ASTM International: West Conshohocken, PA, USA, 2021.
  37. Rials, T.; Glasser, W. Thermal and dynamic mechanical properties of hydroxypropyl cellulose films. J. Appl. Polym. Sci. 1988, 36, 749–758. [Google Scholar] [CrossRef]
Figure 1. Molecular structure of the cellulose backbone for various cellulose ethers: cellulose, R=OH; MC, R=OH or CH3; HEC, R=OH or CH2CH2OH; CMC, R=OH or CH2COONa; HPC, R=OH or CH2CH(OH)CH3; HPMC, R=OH or CH3 or CH2CH(OH)CH3.
Cosmetics 09 00052 g001
Figure 2. Shear viscosity plotted as a function of shear rate for variants of HEC and HMHEC.
Cosmetics 09 00052 g002
Figure 3. Shear viscosity plotted as a function of shear rate for variants of HPC.
Cosmetics 09 00052 g003
Figure 4. Shear viscosity plotted as a function of shear rate for variants of MC and HPMC.
Cosmetics 09 00052 g004
Figure 5. Shear viscosity plotted as a function of shear rate for variants of CMC.
Cosmetics 09 00052 g005
Figure 6. Lissajous–Bowditch curves for HEC-1, HEC-2, HEC-3, HEC-4, HEC-5, HMHEC-1, and HMHEC-2.
Cosmetics 09 00052 g006
Figure 7. Lissajous–Bowditch curves for HPC-1, HPC-2, HPC-3, HPC-4, and HPC-5.
Cosmetics 09 00052 g007
Figure 8. Lissajous–Bowditch curves for HPMC-1, HPMC -2, HPMC-3, HPMC-4, HPMC-5, MC-1, and MC-2.
Cosmetics 09 00052 g008
Figure 9. Lissajous–Bowditch curves for CMC-1, CMC -2, CMC-3, and CMC-4.
Cosmetics 09 00052 g009
Table 1. Various commercial grades of cellulose ethers were investigated in this study. The polymers were obtained from Ashland LLC, Wilmington, DE, USA. Data were compiled from internal reports produced by the Measurement Science department at Ashland LLC. In addition to the abbreviations already introduced in the body of the text, the following apply in the table: HM = hydrophobically modified; Me = methyl; HP = hydroxypropyl.
Type of Cellulose Ether Abbreviation in This Article Approximate Molecular Weight (Mw, Daltons) Approximate DS/MS
HECHEC-190,0002.6 MS
HECHEC-2300,0002.6 MS
HECHEC-3720,0002.6 MS
HECHEC-41,000,0002.6 MS
HECHEC-51,300,0002.6 MS
HMHECHMHEC-1350,0000.005 HM DS
HMHECHMHEC-2550,0000.005 HM DS
HPCHPC-180,0004.0 MS
HPCHPC-295,0004.0 MS
HPCHPC-3370,0004.0 MS
HPCHPC-4850,0004.0 MS
HPCHPC-51,150,0004.0 MS
HPMCHPMC-1400,0001.5 Me DS
0.3 HP MS
HPMCHPMC-2575,0001.5 Me DS
0.3 HP MS
HPMCHPMC-3675,0001.5 Me DS
0.3 HP MS
HPMCHPMC-41,000,0001.5 Me DS
0.3 HP MS
HPMCHPMC-51,200,0001.5 Me DS
0.3 HP MS
MCMC-1140,0001.8 DS
MCMC-2370,0001.8 DS
CMCCMC-1250,0000.7 DS
CMCCMC-2250,0000.9 DS
CMCCMC-3250,0001.2 DS
CMCCMC-4725,0000.7 DS
Table 2. Ratio of the polymer solution containing salt (NaCl) to the polymer solution without salt at two shear rates for the tested cellulose ethers.
Cellulose Ether Salt/No Salt (0.1 s−1) Salt/No Salt (1000 s−1)
HEC-11.031.03
HEC-21.111.11
HEC-31.631.43
HEC-41.021.00
HEC-51.111.04
HMHEC-10.991.16
HMHEC-20.870.99
HPC-10.960.96
HPC-20.960.96
HPC-31.101.07
HPC-41.131.13
HPC-50.530.78
HPMC-10.951.00
HPMC-21.051.07
HPMC-30.970.99
HPMC-40.810.93
HPMC-50.780.97
MC-10.851.03
MC-21.051.08
CMC-10.710.74
CMC-20.640.71
CMC-30.450.60
CMC-40.800.93
Table 3. Ratio of the viscosity of the polymer solution containing surfactant (SLES) to the polymer solution without surfactant at two shear rates for the tested cellulose ethers.
Cellulose Ether SLES/No SLES (0.1 s−1) SLES/No SLES (1000 s−1)
HEC-11.351.35
HEC-21.441.33
HEC-30.671.04
HEC-41.291.07
HEC-51.161.02
HMHEC-10.321.16
HMHEC-20.041.09
HPC-10.960.96
HPC-20.840.84
HPC-30.280.38
HPC-40.700.70
HPC-50.010.35
HPMC-10.530.96
HPMC-20.460.98
HPMC-30.290.85
HPMC-40.340.87
HPMC-50.481.09
MC-10.851.14
MC-20.320.87
CMC-11.030.88
CMC-20.880.88
CMC-30.660.80
CMC-41.211.05
Table 4. Static and kinetic friction coefficient data of cellulose ethers.
Cellulose Ether Static Friction Coefficient Kinetic Friction Coefficient
HEC-10.64 ± 0.230.72 ± 0.04
HEC-20.58 ± 0.140.60 ± 0.05
HEC-40.22 ± 0.180.24 ± 0.11
HEC-50.10 ± 0.060.13 ± 0.04
HMHEC-10.12 ± 0.070.15 ± 0.02
HMHEC-20.03 ± 0.010.12 ± 0.02
HPMC-10.52 ± 0.260.81 ± 0.18
HPMC-20.30 ± 0.220.47 ± 0.21
HPMC-30.25 ± 0.190.38 ± 0.19
HPMC-40.20 ± 0.250.22 ± 0.11
HPMC-50.04 ± 0.030.12 ± 0.02
MC-10.69 ± 0.250.91 ± 0.10
MC-20.41 ± 0.260.65 ± 0.13
CMC-10.64 ± 0.190.82 ± 0.09
CMC-20.55 ± 0.230.70 ± 0.05
CMC-30.58 ± 0.200.71 ± 0.06
CMC-40.14 ± 0.120.23 ± 0.15
Table 5. Vapor sorption data of cellulose ethers.
Cellulose Ether % Moisture Content
HEC-152.42 ± 0.13
HEC-252.09 ± 0.24
HEC-351.00 ± 0.17
HEC-452.07 ± 0.42
HEC-550.50 ± 0.12
HMHEC-151.05 ± 0.10
HMHEC-249.35 ± 0.07
HPC-121.52 ± 0.10
HPC-221.41 ± 0.07
HPC-321.13 ± 0.04
HPC-421.07 ± 0.07
HPC-520.60 ± 0.15
HPMC-124.88 ± 0.14
HPMC-225.08 ± 0.16
HPMC-324.30 ± 0.11
HPMC-424.01 ± 0.17
HPMC-522.96 ± 0.03
MC-116.48 ± 0.01
MC-217.64 ± 0.08
CMC-160.57 ± 0.11
CMC-262.00 ± 0.26
CMC-372.95 ± 1.23
CMC-463.49 ± 0.40
Table 6. Surface tension data of 0.1% (w/w) solutions of the cellulose ethers at 22.0 °C.
Cellulose Ether Surface Tension (mN/m)
HEC-149.449 ± 0.252
HEC-249.341 ± 0.186
HEC-345.463 ± 0.361
HEC-448.312 ± 0.453
HEC-546.374 ± 0.294
HMHEC-158.499 ± 0.098
HMHEC-260.100 ± 0.085
HPC-141.672 ± 0.071
HPC-241.596 ± 0.079
HPC-341.481 ± 0.040
HPC-441.231 ± 0.018
HPC-541.102 ± 0.008
HPMC-151.110 ± 0.091
HPMC-252.514 ± 0.636
HPMC-353.443 ± 0.482
HPMC-454.154 ± 0.895
HPMC-551.515 ± 0.027
MC-157.821 ± 0.844
MC-256.104 ± 1.124
CMC-171.173 ± 0.107
CMC-271.131 ± 0.235
CMC-371.067 ± 0.197
CMC-470.502 ± 0.476
Table 7. DSC (Tg, Tm) and TGA (Tp) data for the cellulose ethers.
Cellulose Ether Tg (°C) Tm (°C) Tp (°C)
HEC-195 ± 3302 ± 2
HEC-2109 ± 1308 ± 1
HEC-3116 ± 1318 ± 1
HEC-4115 ± 1309 ± 1
HEC-5115 ± 1313 ± 1
HMHEC-1149 ± 2307 ± 1
HMHEC-2174 ± 1302 ± 1
HPC-115 ± 2173 ± 1347 ± 1
HPC-215 ± 1179 ± 1346 ± 3
HPC-313 ± 1183 ± 1344 ± 4
HPC-49 ± 0174 ± 1357 ± 2
HPC-512 ± 0194 ± 1362 ± 1
HPMC-1188 ± 1338 ± 1
HPMC-2193 ± 1335 ± 1
HPMC-3196 ± 1334 ± 2
HPMC-4192 ± 1339 ± 1
HPMC-5194 ± 1337 ± 1
MC-1135 ± 1337 ± 1
MC-2134 ± 2344 ± 1
CMC-1130 ± 1274 ± 1
CMC-2131 ± 1274 ± 1
CMC-3132 ± 1280 ± 1
CMC-4132 ± 1274 ± 1
Publisher’s Note: MDPI stays neutral with regard to jurisdictional claims in published maps and institutional affiliations.

