Article

The Antimicrobial Mode of Action of Maltol and Its Synergistic Efficacy with Selected Cationic Surfactants

Innovation Department, Sharon Laboratories Ltd., Ashdod 7898800, Israel
*
Author to whom correspondence should be addressed.
Cosmetics 2021, 8(3), 86; https://doi.org/10.3390/cosmetics8030086
Submission received: 23 August 2021 / Accepted: 6 September 2021 / Published: 9 September 2021

Abstract

:
Maltol, mostly used as a flavoring molecule, also has various potential applications as a biomedical compound. Despite its extensive use in the food industry, maltol’s antimicrobial activity was evaluated only briefly, and was suggested to be insufficient on its own. Recently, we have shown that maltol can be used in conjunction with cationic surfactant species to receive higher activity against contaminant microorganisms. In this paper, we have broadened the antimicrobial efficacy studies and evidenced maltol’s mode of action against Gram-negative, Gram-positive bacteria, and fungi. In addition, to increase its efficacy, blends of maltol and two selected cationic surfactants, dodecyl-dimethyl-ammonium chloride (DDAC) and polyquaternium 80 (P-80), were appraised for their activity. Broad efficacy studies revealed synergistic interactions between maltol and both cationic surfactants against most of the tested microorganisms. Electron microscopy images were used to evaluate the microorganisms’ morphology following treatment, pinpointing the specific cell wall damage caused by each of the compounds. Our findings indicate that maltol’s effect on the microbial cell wall can be complemented by catalytic amounts of selected cationic surfactants to enhance and extend its activity. Such a solution can be used as a broad-spectrum preservative for personal care products in cosmetic applications.

1. Introduction

Maltol, 3-hydroxy-2-methyl-4-pyrone (Figure 1A), a naturally occurring compound, can be isolated from various types of plants, such as bark and leaves of Larix deciduas, Evodiopanax innovans, Cercidiphyllum japonicum, Citharexylum spinosum, Passiflora incarnata, Panax ginseng, and different kinds of pine plants [1,2,3,4]. Few studies demonstrated that maltol can also be produced by some actinobacteria [5,6] and a mold species [7]. Maltol is a chelating agent, which binds hard metal centers, such as Fe3+ (Ferric maltol; Figure 1B), Ga3+, Al3+, and VO2+ [8]. Due to its solubility in aqueous solution, maltol was shown to increase the absorption of several essential metals in animal and human subjects, in comparison to hydrophobic chelating molecules [9,10,11,12]. Maltol is widely used in the food industry as a flavoring agent, food additive, and a food preservative. Maltol, known for its characteristic sweet smell, is used to create a sweet aroma in fragrances, freshly baked bread, and cakes. In addition to its extensive use in the food industry, maltol was found to have broad applications, such as a biomedical compound [1,13,14,15,16] and even used as a pest control agent [17]. Maltol is a promising candidate molecule for medical purposes and an important compound in the food industry; moreover, toxicity studies have determined that maltol is non-toxic and generally recognized as safe (GRAS) [7,18].
The antimicrobial activity of maltol, on the other hand, was only briefly investigated in several previous studies [4,19,20], while its efficacy was suggested mostly as insufficient on its own [19,21]. Recently, we discovered that maltol efficacy can be significantly increased by the addition of only small amounts of selected cationic surfactants [20]. In this study, we widened the efficacy studies to better understand the mode of action of maltol and its combination with two cationic surfactants, polyquaternium 80 (P-80), and didecyldimethylammonium chloride (DDAC). For this purpose, the antimicrobial mechanism of maltol and its cationic surfactant combinations were evaluated against the five pharmacopeia microorganisms, Escherichia coli, Staphylococcus aureus, Pseudomonas aeruginosa, Candida albicans, and Aspergillus brasiliensis, using multiple efficacy studies, morphological examination via electron microscopy imaging, and cell permeability assay. Finally, we provide an evaluation for an additional application of maltol as a natural preservative for cosmetic formulations.

2. Materials and Methods

2.1. Minimum Inhibitory Concentration (MIC) and Checkerboard Assay

The minimum inhibitory concentrations (MIC) of maltol, P-80, and DDAC, and a combination of maltol and cationic surfactants (Maltol:DDAC (95:5) and Maltol:P-80 (90:10)), were evaluated using broth microdilution assay against five pharmacopeia strains, as previously described [21]. Briefly, growth of E. coli, S. aureus, P. aeruginosa, C. albicans, and A. brasiliensis was evaluated following incubation with two-fold serial dilutions of maltol at concentrations of 0–8000 ppm, DDAC at 0–200 ppm, and P-80 at 0–2000 ppm, in Mueller Hinton (MH) broth for bacteria, and Sabouraud Dextrose broth for yeast and mold, using a 96-well plate (JET BIOFIL, Be’er Sheva, Israel). For the checkerboard assay, using a 96-well plate, decreasing concentrations of the cationic surfactants were added to the plate from right to left side of the plate, while increasing concentrations of maltol were added from bottom up of the plate. Maltol concentrations ranged from 0 to 4000 ppm, P-80 at 0–1000 ppm, and DDAC at 0–50 ppm. Wells were inoculated with 100 µL of test cultures with a final inoculum of 5 × 10⁵ CFU/mL of bacteria and 5 × 10³ CFU/mL of fungi. Bacteria inoculated plates were incubated for 24 h at 32 °C, while fungi inoculated plates were incubated at 23 °C for 48–72 h. Growth was evaluated by O.D.600 reads using Epoch Microplate Spectrophotometer (BioTek, Petah Tikva, Israel). Data were processed using Java TreeView 3.0 software (http://jtreeview.sourceforge.net/, accessed on 6 September 2021). Data are presented as average value based on at least three independent experiments, while the concentrations of the compounds were previously evaluated to reach the most accurate MIC values.

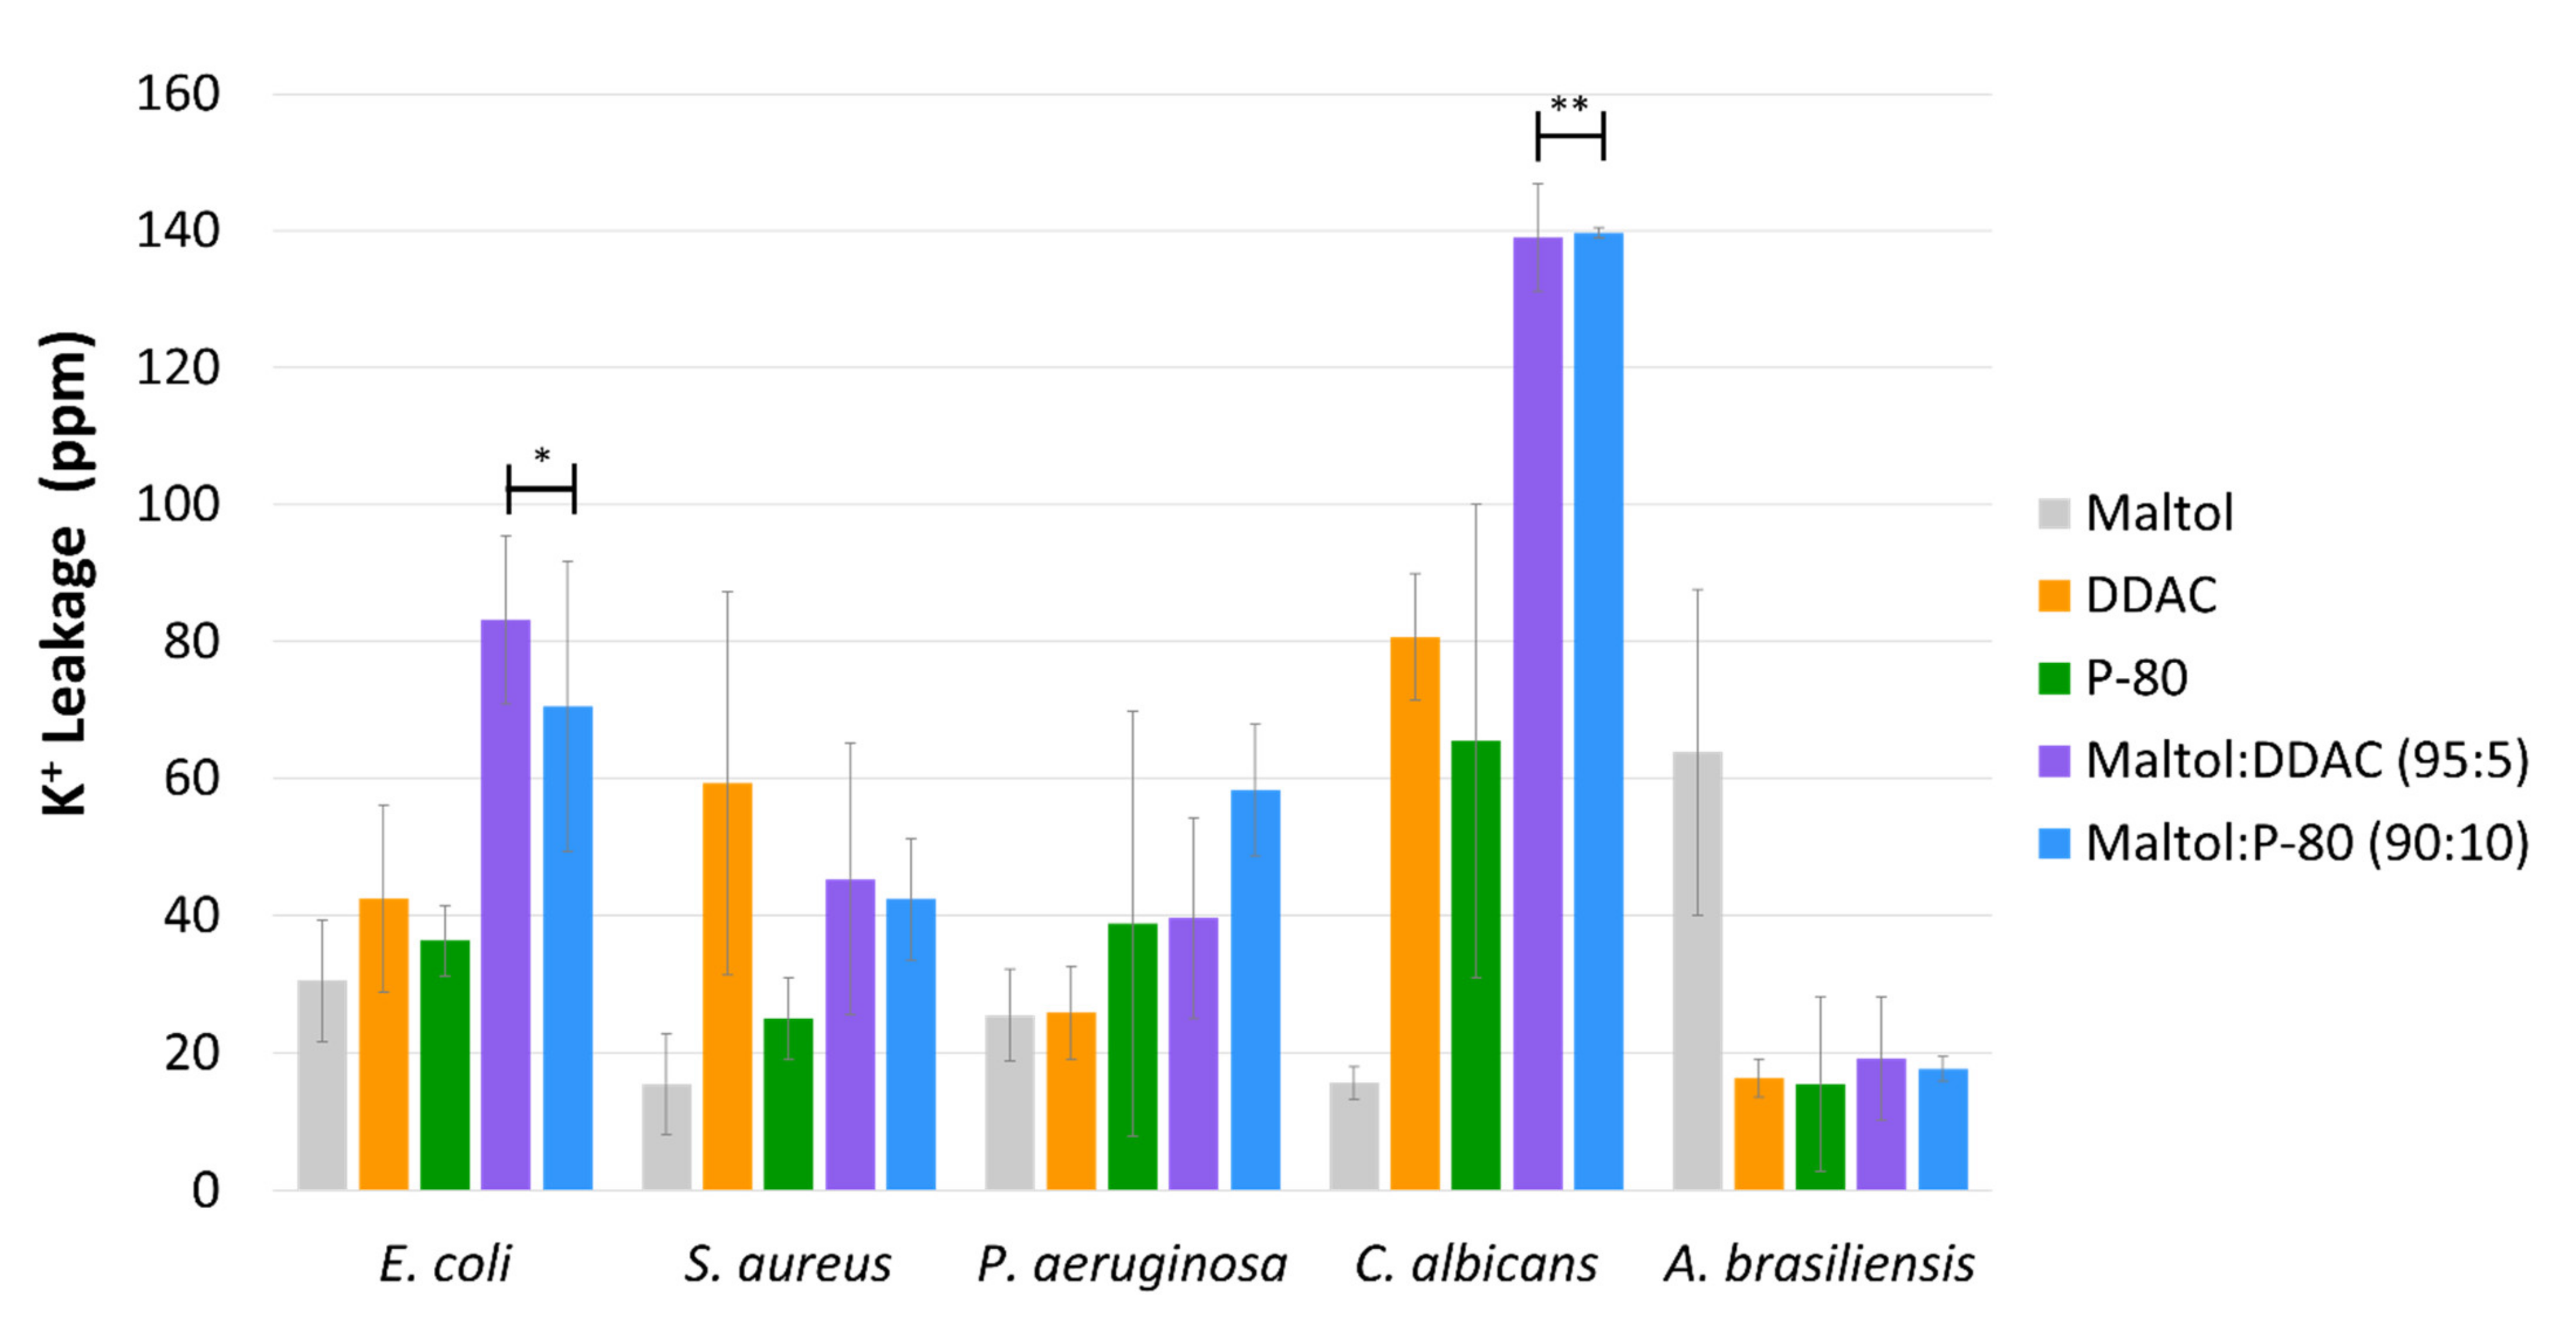
2.2. Potassium Leakage Assay

To measure intracellular leakage from treated microorganisms, a total of 300 mL of TSB media were inoculated with the test cultures of E. coli, S. aureus, P. aeruginosa, and C. albicans, and incubated ON with shaking at 32 °C for bacteria and 23 °C for C. albicans. Moreover, 1 mL of the culture was plated on TSA for viability count. Cultures were divided in to 50 mL tubes, centrifuged at 3500× g for 10 min and supernatant were discarded. Cells were washed twice with PBS and the biomass was weighed and recorded. Tested compounds, maltol, P-80, DDAC, and the blends of both maltol and the cationic surfactants were added in increasing concentrations to the tubes containing the microorganisms’ biomass. For A. brasiliensis, spores (at a concentration of 107 CFU/mL) were directly applied to the tubes containing the antimicrobial compounds. Solutions were mixed and incubated for 4 h when maltol was added alone, 1 h for the combined solution of maltol and cationic surfactants, and 10 min for the cationic surfactants. Solutions containing microorganism cells were filtered using 0.22 µM filter and were measured for potassium (K+) ions concentrations (ppm) using Sherwood flame photometer 410 (Spectro, Rishon Le-zion, Israel).

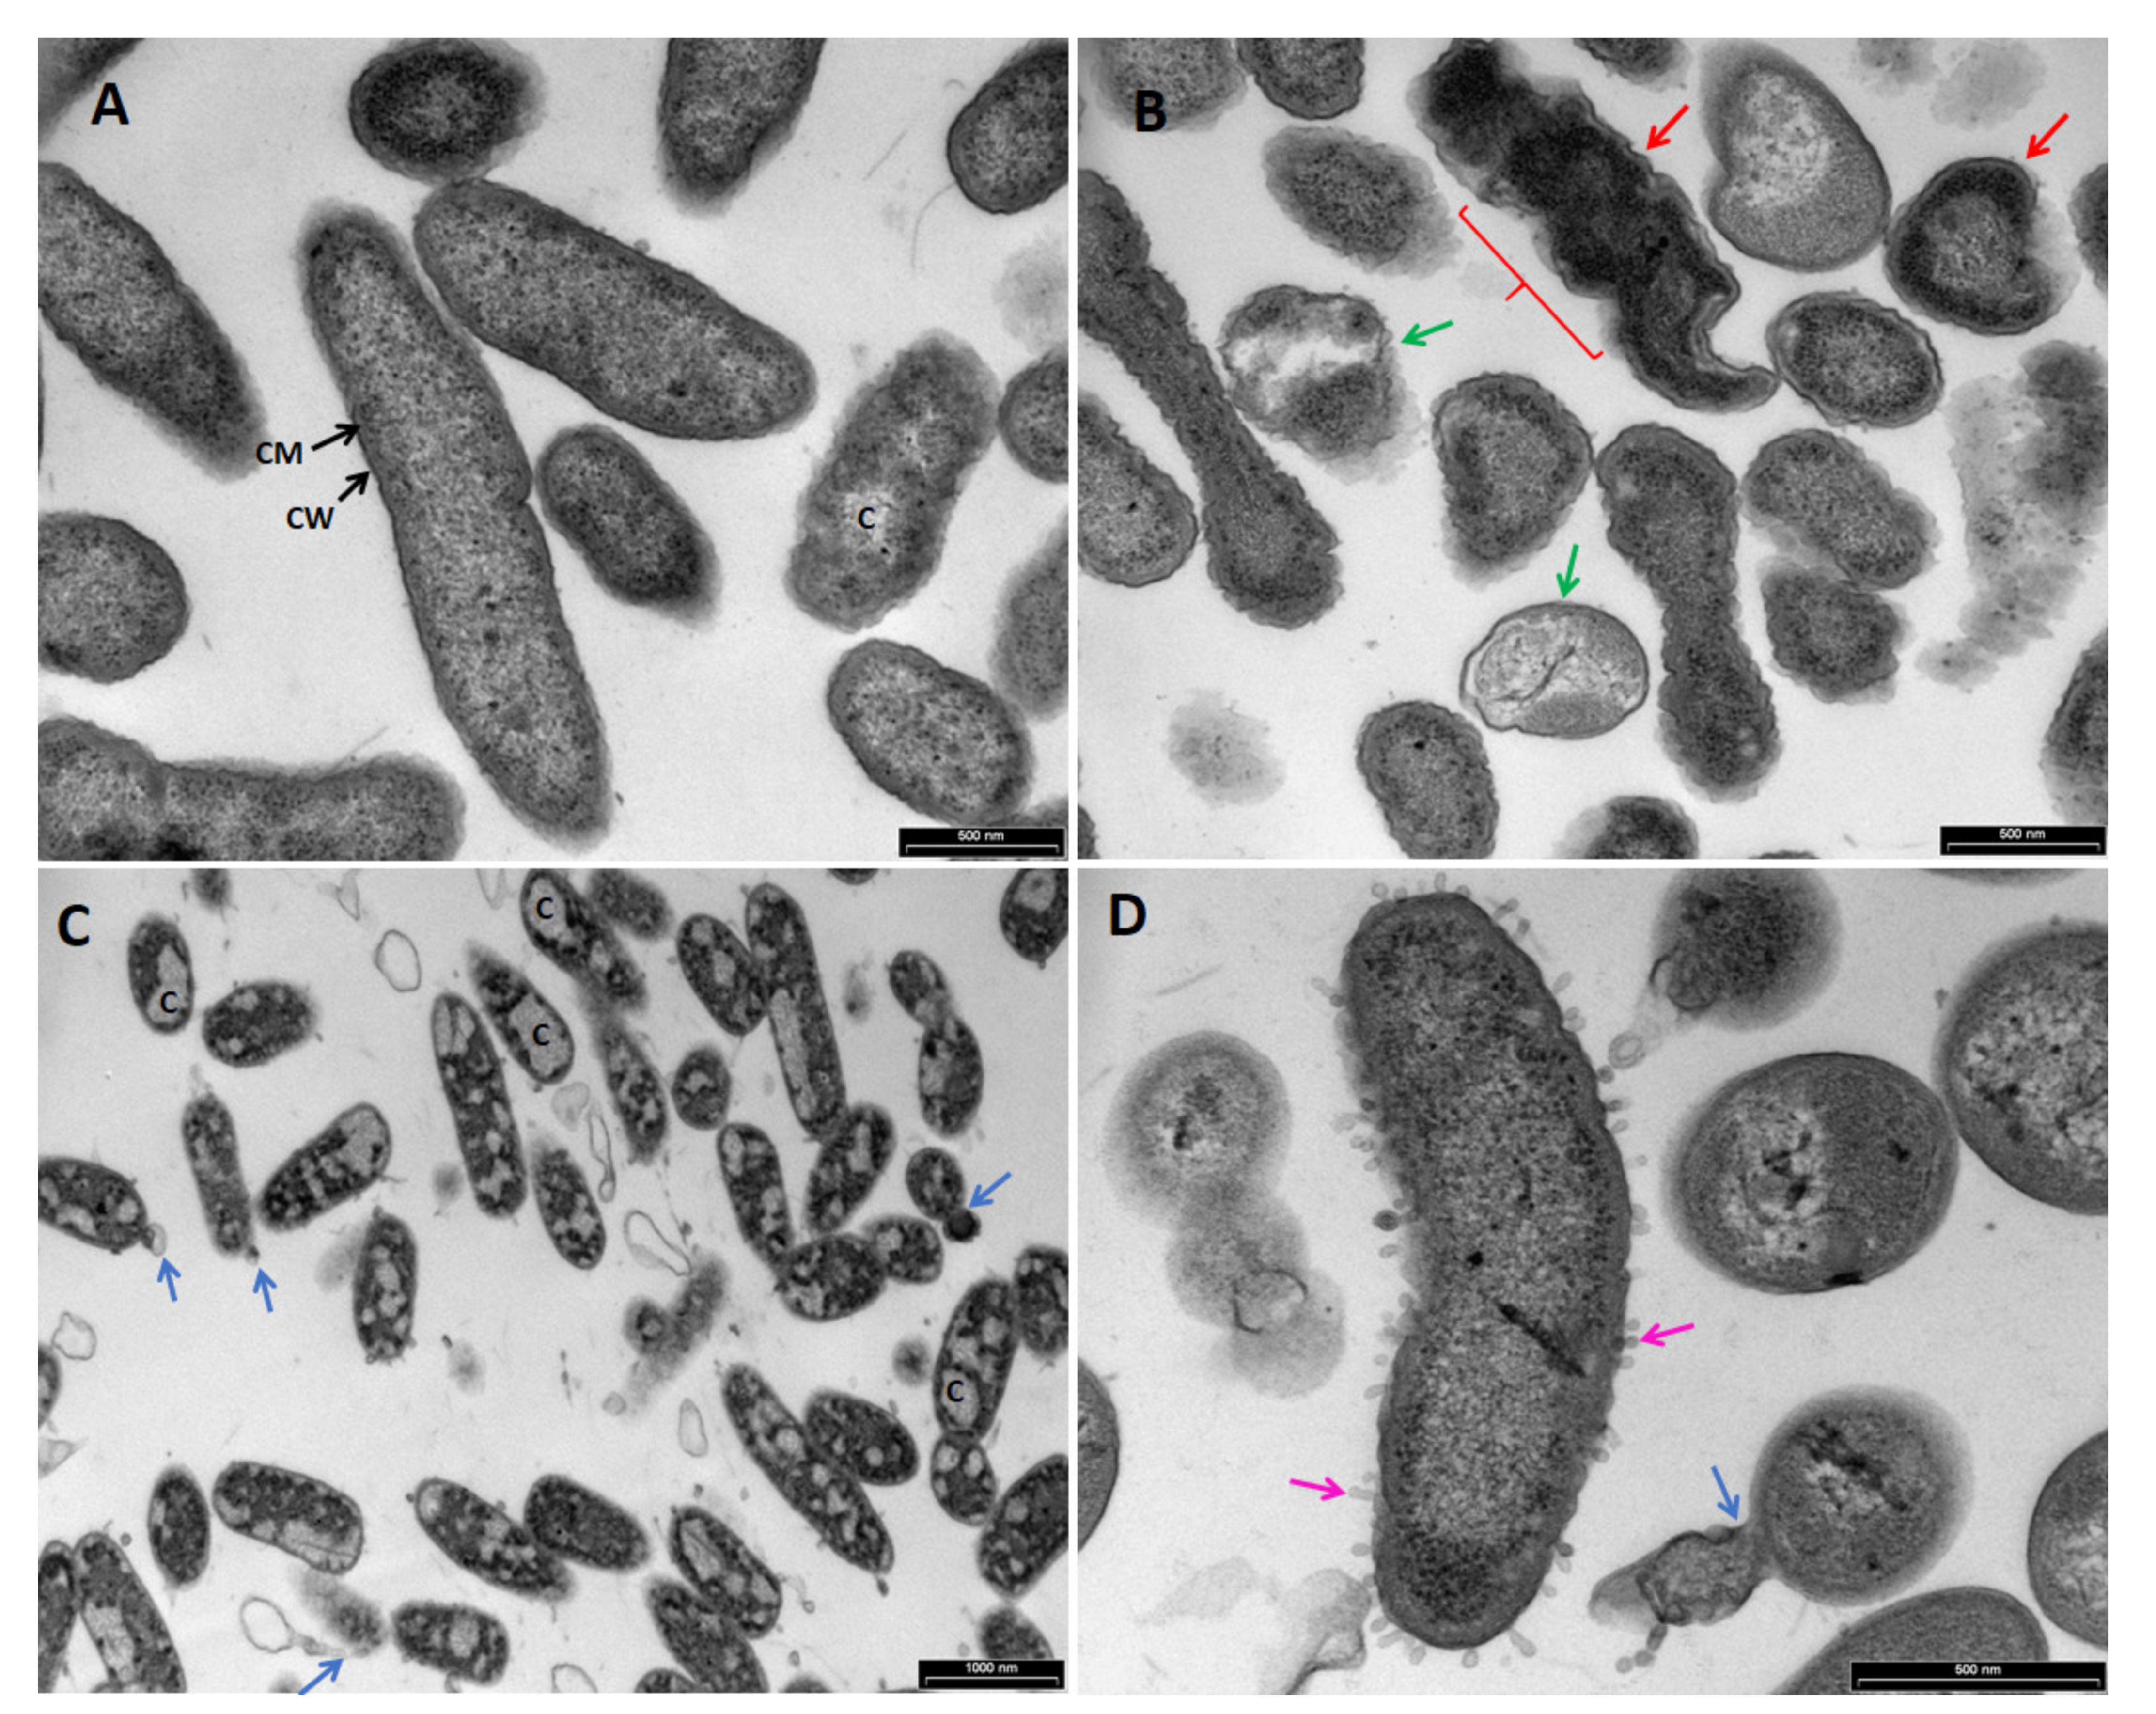
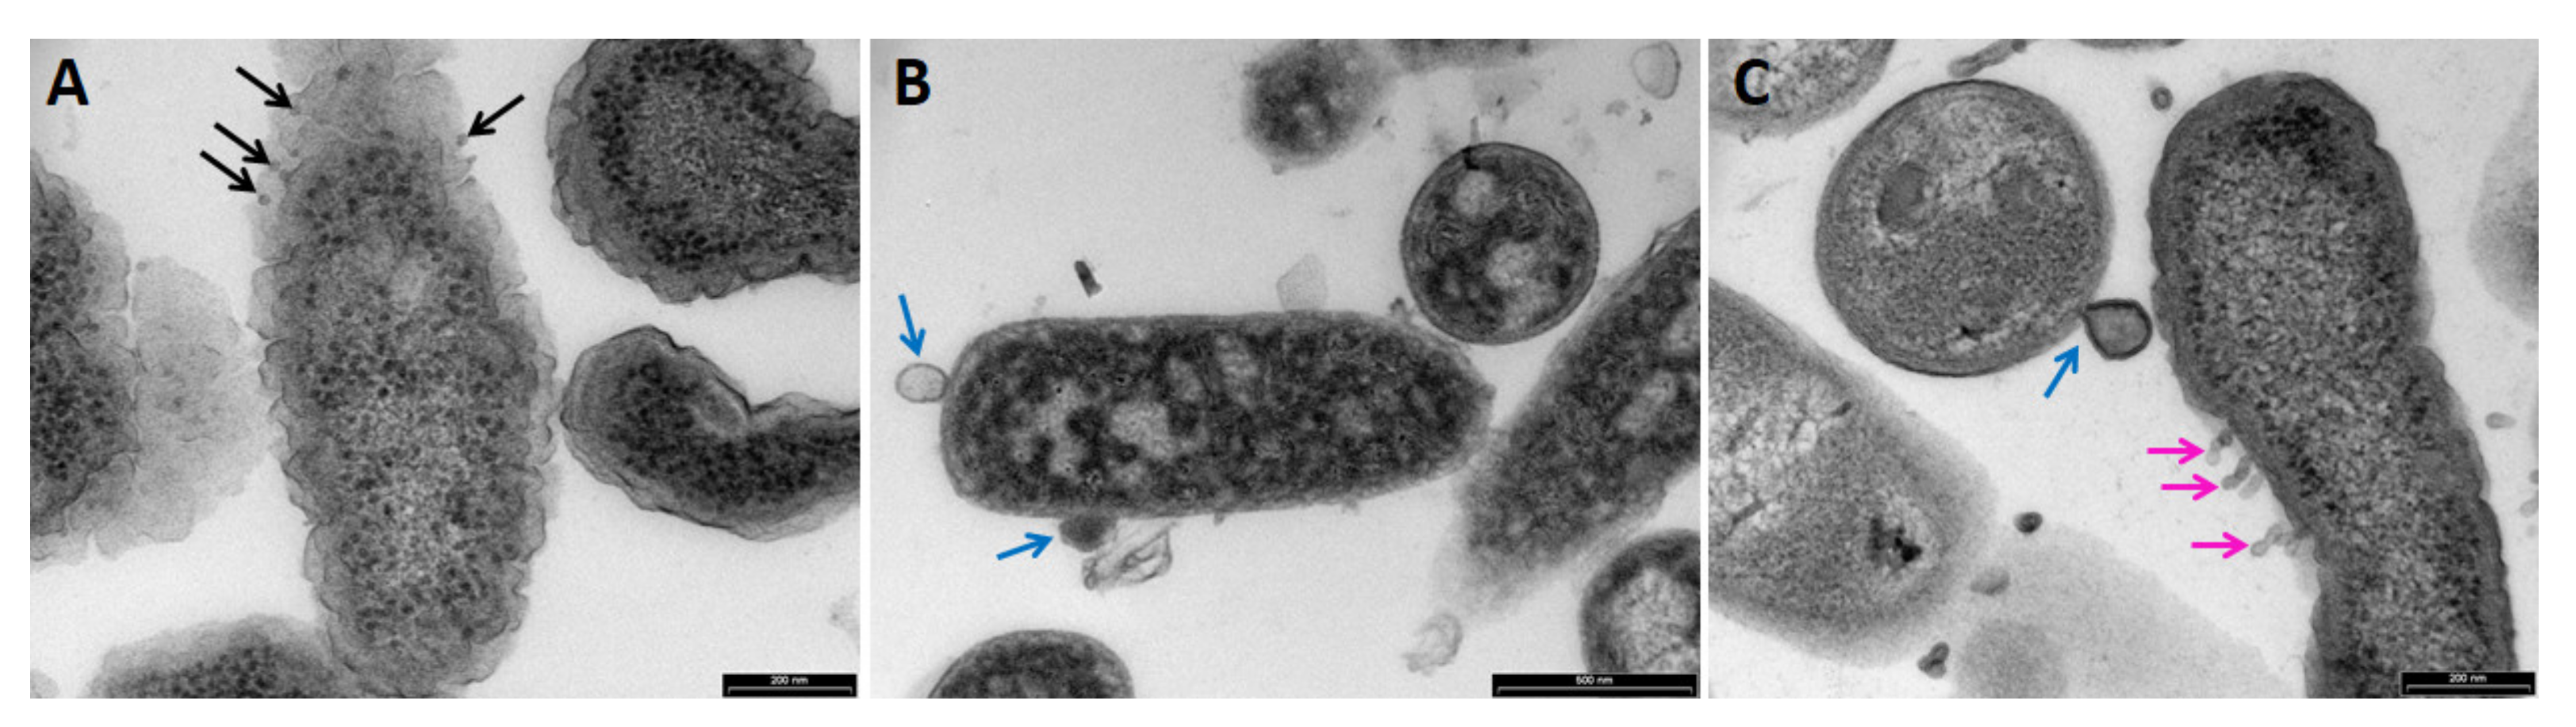
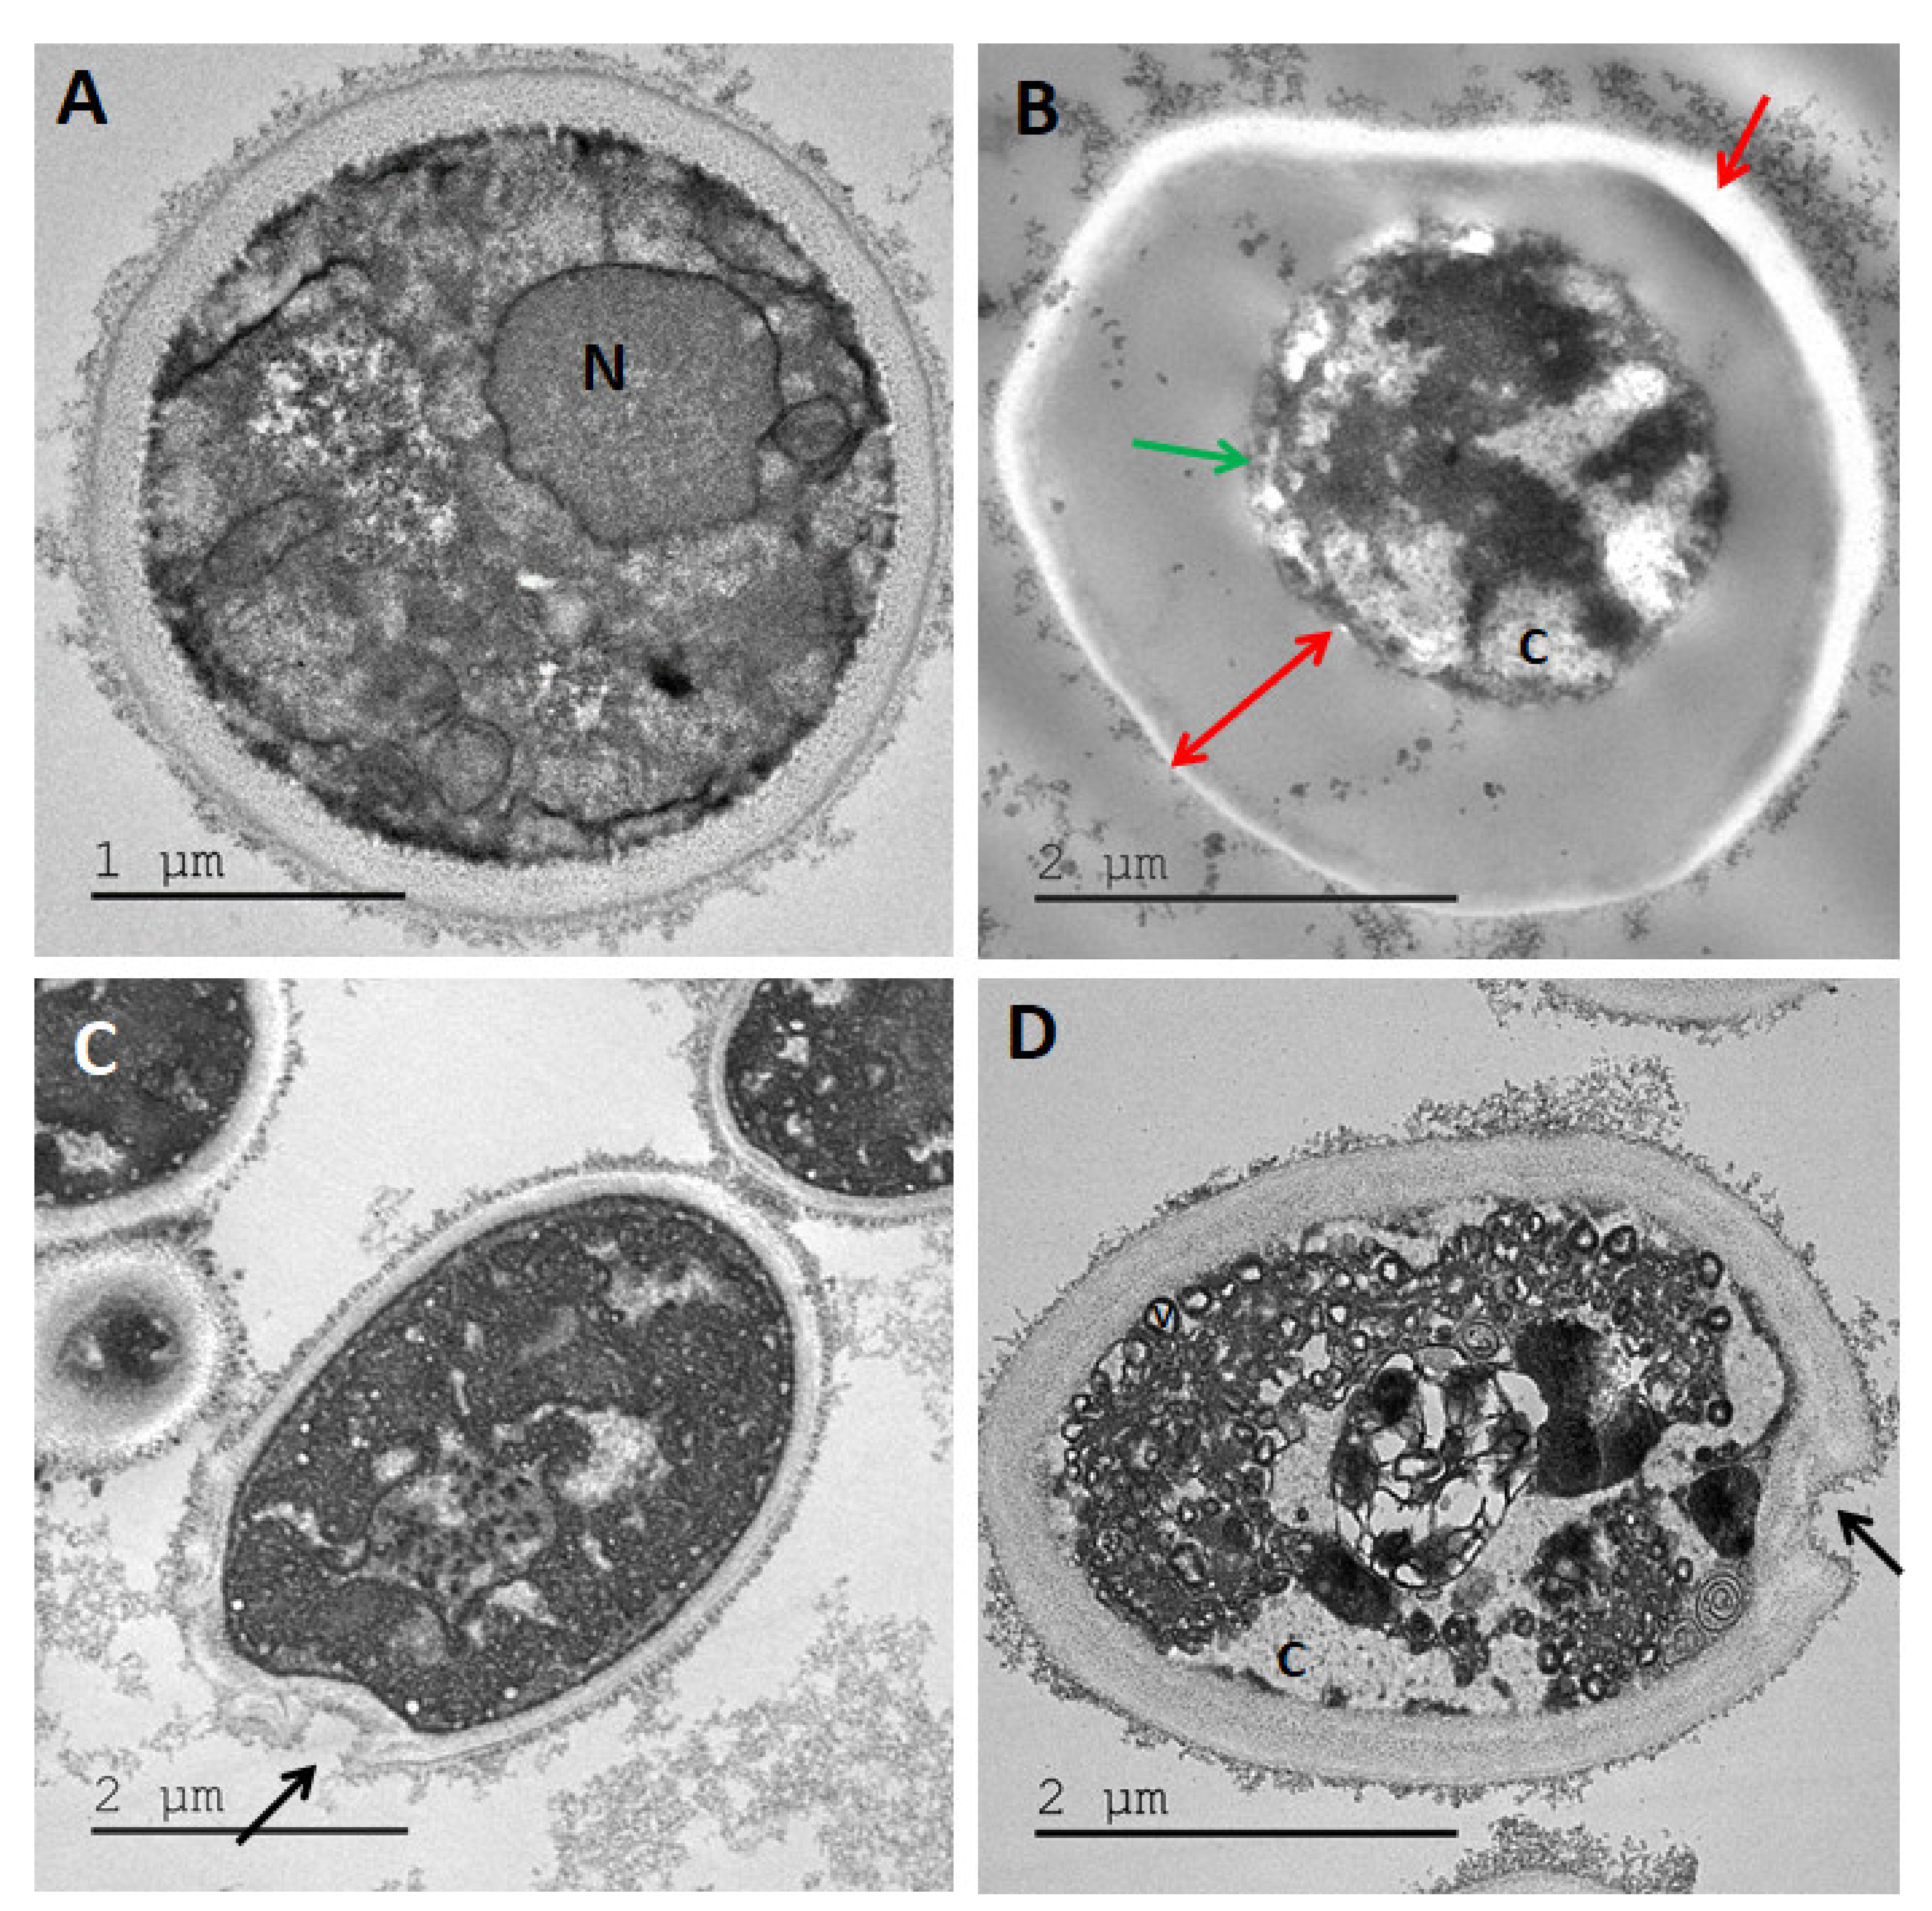
2.3. Transmission Electron Microscopy

Test cultures of E. coli, S. aureus, P. aeruginosa, C. albicans, and A. brasiliensis were treated with maltol at 4500 ppm, DDAC at 500 ppm and a blend of both maltol and DDAC (95:5) at 5000 ppm. Cultures treated with maltol alone were incubated at room temperature for 4 h, while cultures treated with DDAC or the blend of maltol and DDAC were processed without incubation. Following treatment, cells were centrifuged at 3500× g for 10 min, supernatants were discarded, and pellets were transferred to Eppendorf tubes. Cells were re-suspended in 500 µL 2.5% glutaraldehyde, 2% paraformaldehyde in 0.1 M cacodylate buffer (pH 7.4), and further incubated for 2 h at room temperature. Cells were then rinsed four times with cacodylate buffer, 10 min for each wash, post-fixed and stained with 1% osmium tetroxide and 1.5% potassium ferricyanide in 0.1 M cacodylate buffer for 1 h. Cells were washed again, 4 times in cacodylate buffer, followed by dehydration in increasing concentrations of ethanol consisting of 30%, 50%, 70%, 80%, 90%, and 95% for 10 min incubation during each wash, followed by three washes with 100% anhydrous ethanol for 20 min each wash. Then, cells were infiltrated with increasing concentrations of Agar 100 resin in ethanol, consisting of 25%, 50%, 75%, and 100% resin for 16 h each step. Cells were then embedded in fresh resin and incubated in an oven at 60 °C for 48 h. Embedded cells in blocks were sectioned with a diamond knife on a Leica Reichert UltraCut S microtome binocular microscope. Ultrathin sections (80 nm) were collected onto a 200 Mesh thin bar copper grids. The sections on grids were sequentially stained with uranyl acetate and lead citrate for 10 min each time, and viewed using JEOL JEM1400 Plus microscope (JEOL Ltd., Tokyo, Japan) equipped with Gatan camera (Gatan Inc, Pleasanton, CA USA). This part of the work was done by the Bio-imaging Unit of The Hebrew University in Jerusalem (Dr. Yael Friedmann).

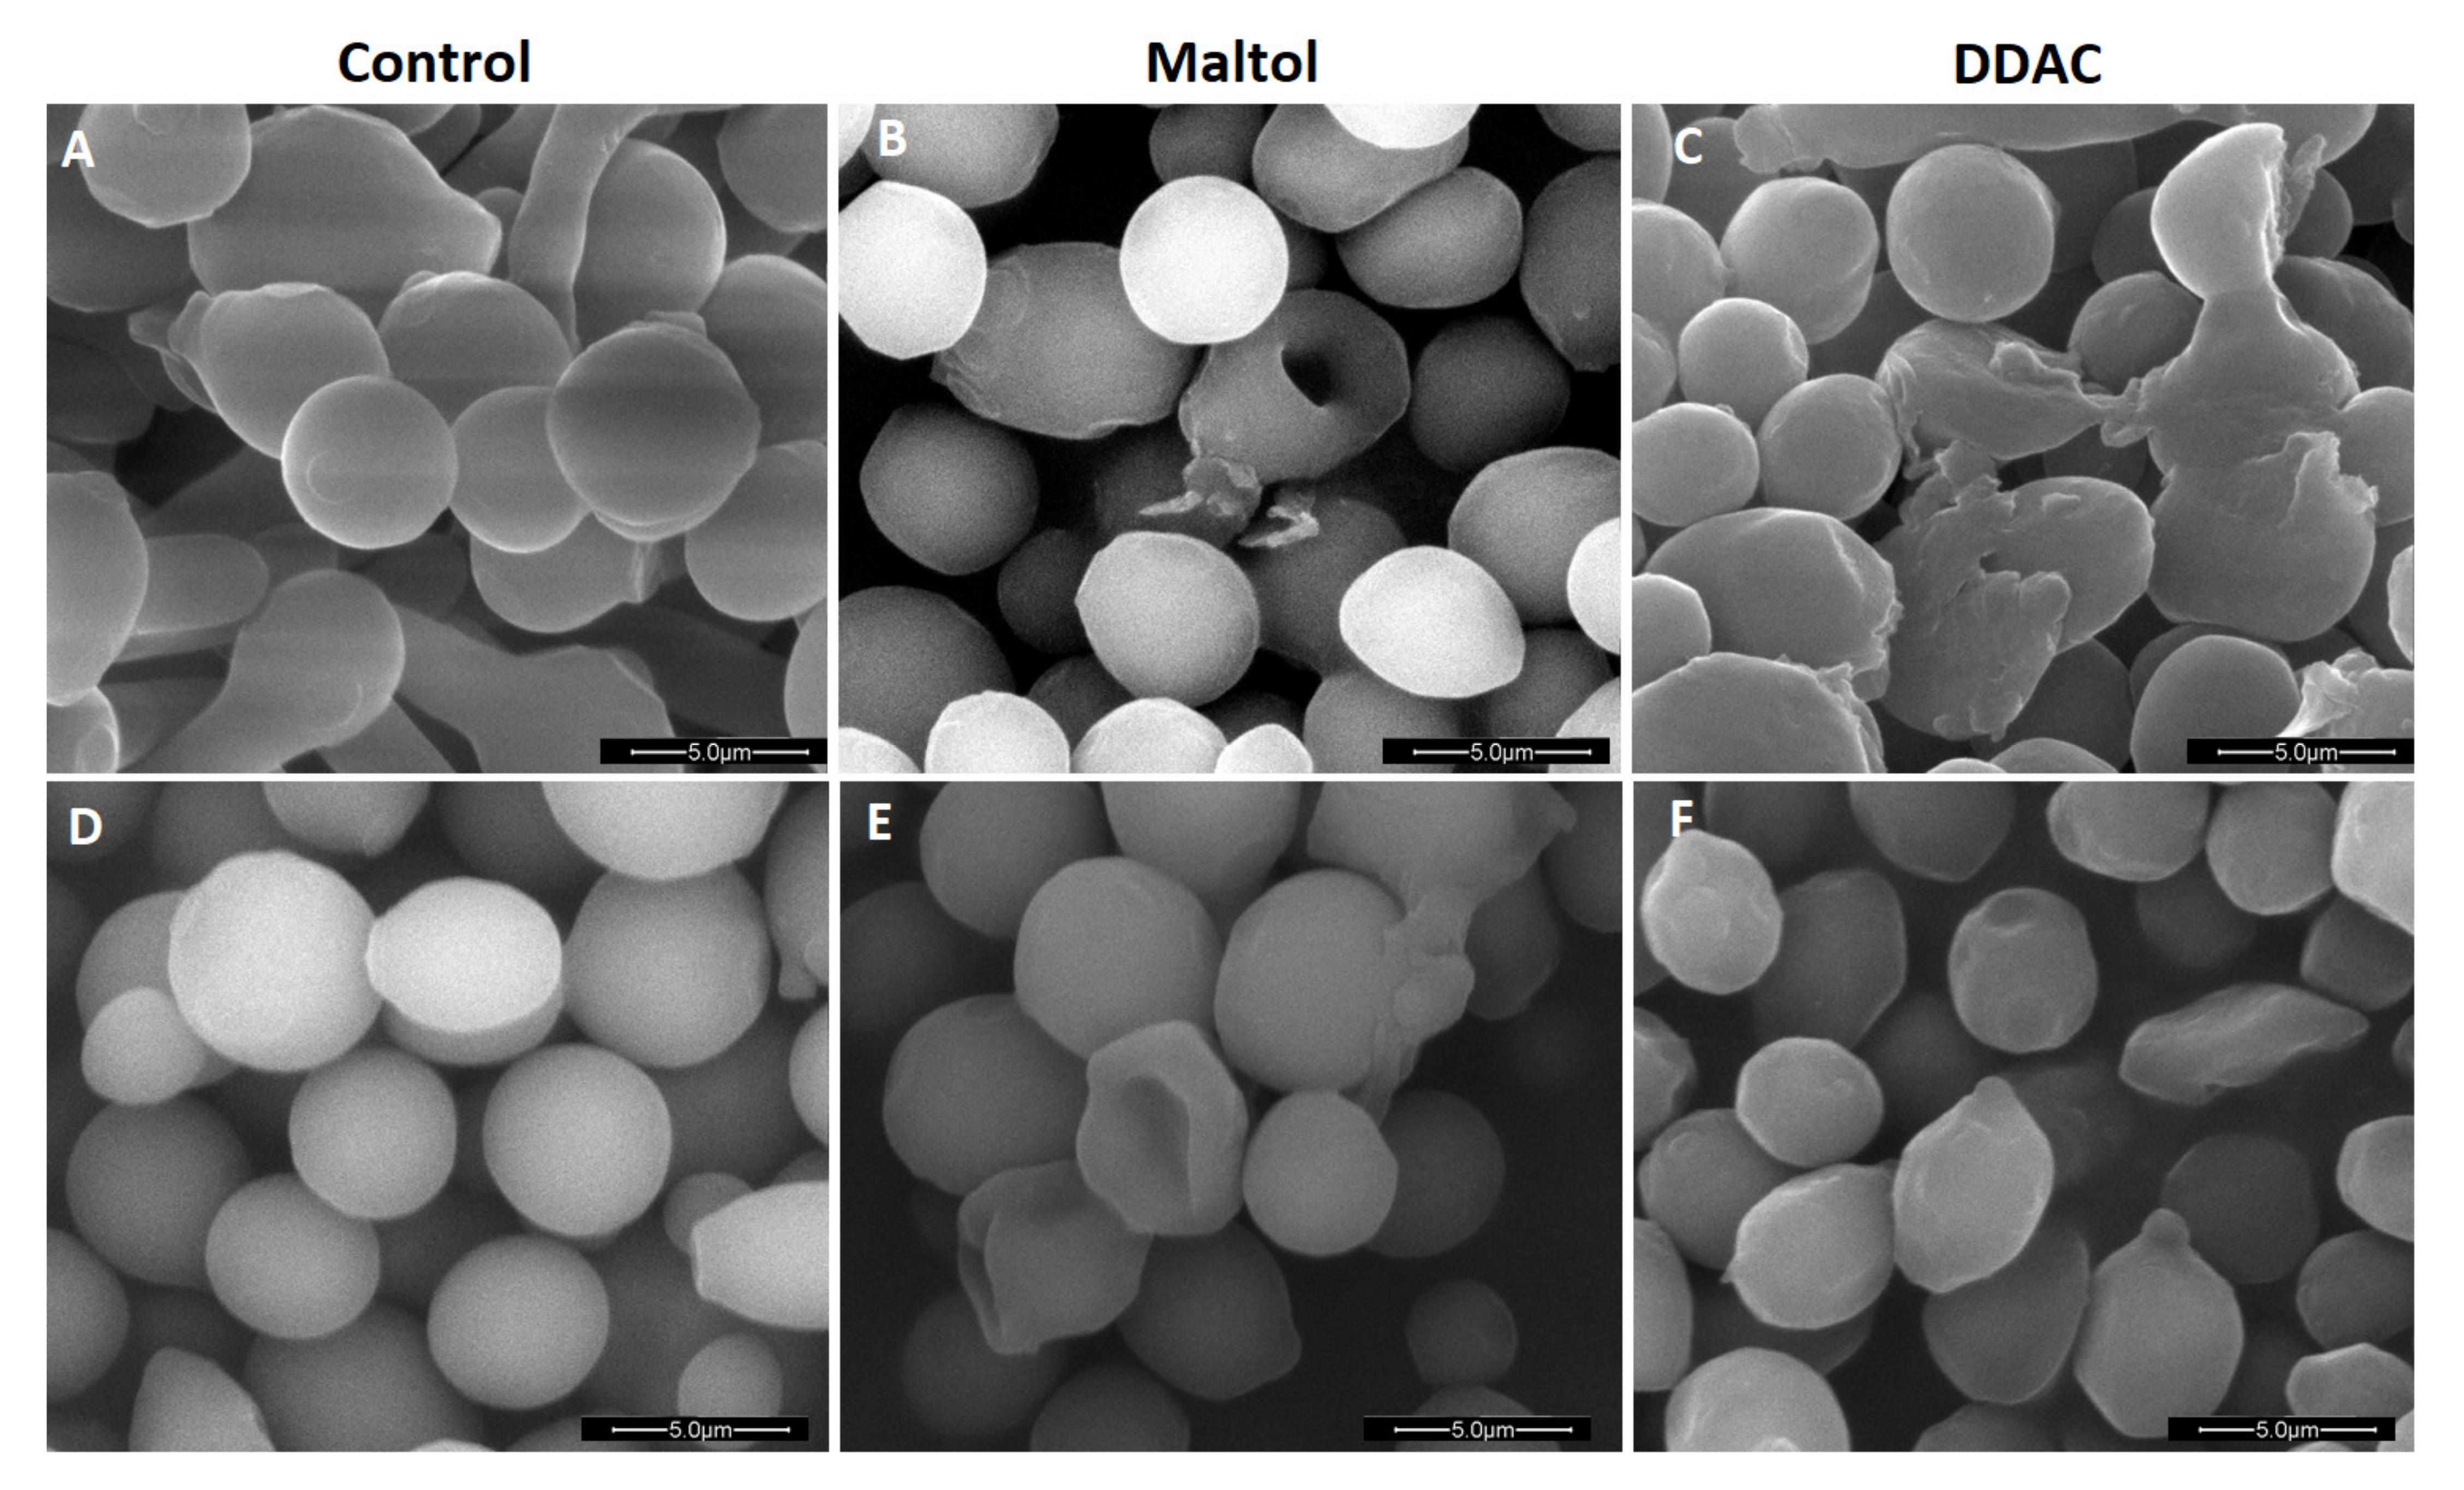
2.4. Scanning Electron Microscopy

Samples were fixed with the Karnovsky fixative (2% PFA, 2.5% glutaraldehyde in 0.1 M cacodylate buffer, pH = 7.4) for 4 h at room temperature, followed by ½ diluted the Karnovsky fixative overnight at 4 °C. Samples were then placed on a coverslip (coated by 0.1% of poly-l-lysine). Samples were post-fixed in 1% osmium tetroxide (OsO4) in 0.1 M cacodylate buffer for 2 h, dehydrated in a graded series of alcohols, followed by drying in CPD (Quorum Technology K850, Lewes, UK), coated by Pd/Au (Quorum Technology SC7620, Lewes, UK), and observed under SEM FEI Quanta 200 microscope. This part of the work was done by the EM Unit of the Core Research Facility of the Faculty of Medicine, The Hebrew University Jerusalem (Dr. Eduard Berenshtein).

2.5. FICI Synergy Model

The synergistic effects of maltol and the cationic surfactants were evaluated based on checkerboard MIC values using FICI model, described as the following equation FICI = (MICAcombi/MICAalone) + (MICBcombi/MICBalone). Synergistic effect was determined if FICI ≤ 0.5, simple additive effect was described if 0.5 < FICI < 4 and antagonistic effect was determined if FICI ≥ 4 [22].

2.6. Challenge Test

The challenge test for preservative efficacy, using a standard basic cream formulation, was performed as previously described [23], according to the ISO 11930 regulations. Briefly, samples were inoculated separately with each microorganism at a final concentration of 106 CFU/mL for bacteria and 105 CFU/mL for yeast and mold. The preservative efficacy was determined by sampling 1 g from the inoculated formulation at each time-point of 2, 7, 14, 21, and 28 days, while serial dilutions were made up to 10−4, and 1 mL were seeded in duplicates onto a petri dish with the appropriate media TSA/SDA (bacteria/yeast and mold, respectively). Plates were incubated at 32 °C for three days for bacteria, while yeast and mold were incubated at 22 °C for five days until the enumeration of viable microorganisms.

2.7. Statistical Analysis

MIC, checkerboard, and potassium leakage assays were repeated in three independent experiments. Potassium leakage data were analyzed using multiple t-test, while significance was determined using Holm–Sidak method with either alpha = 0.05 or 0.01. Statistical analysis was performed using GraphPad Prism v.8 (GraphPad Software, 2020, San Diego, CA, USA).

3. Results

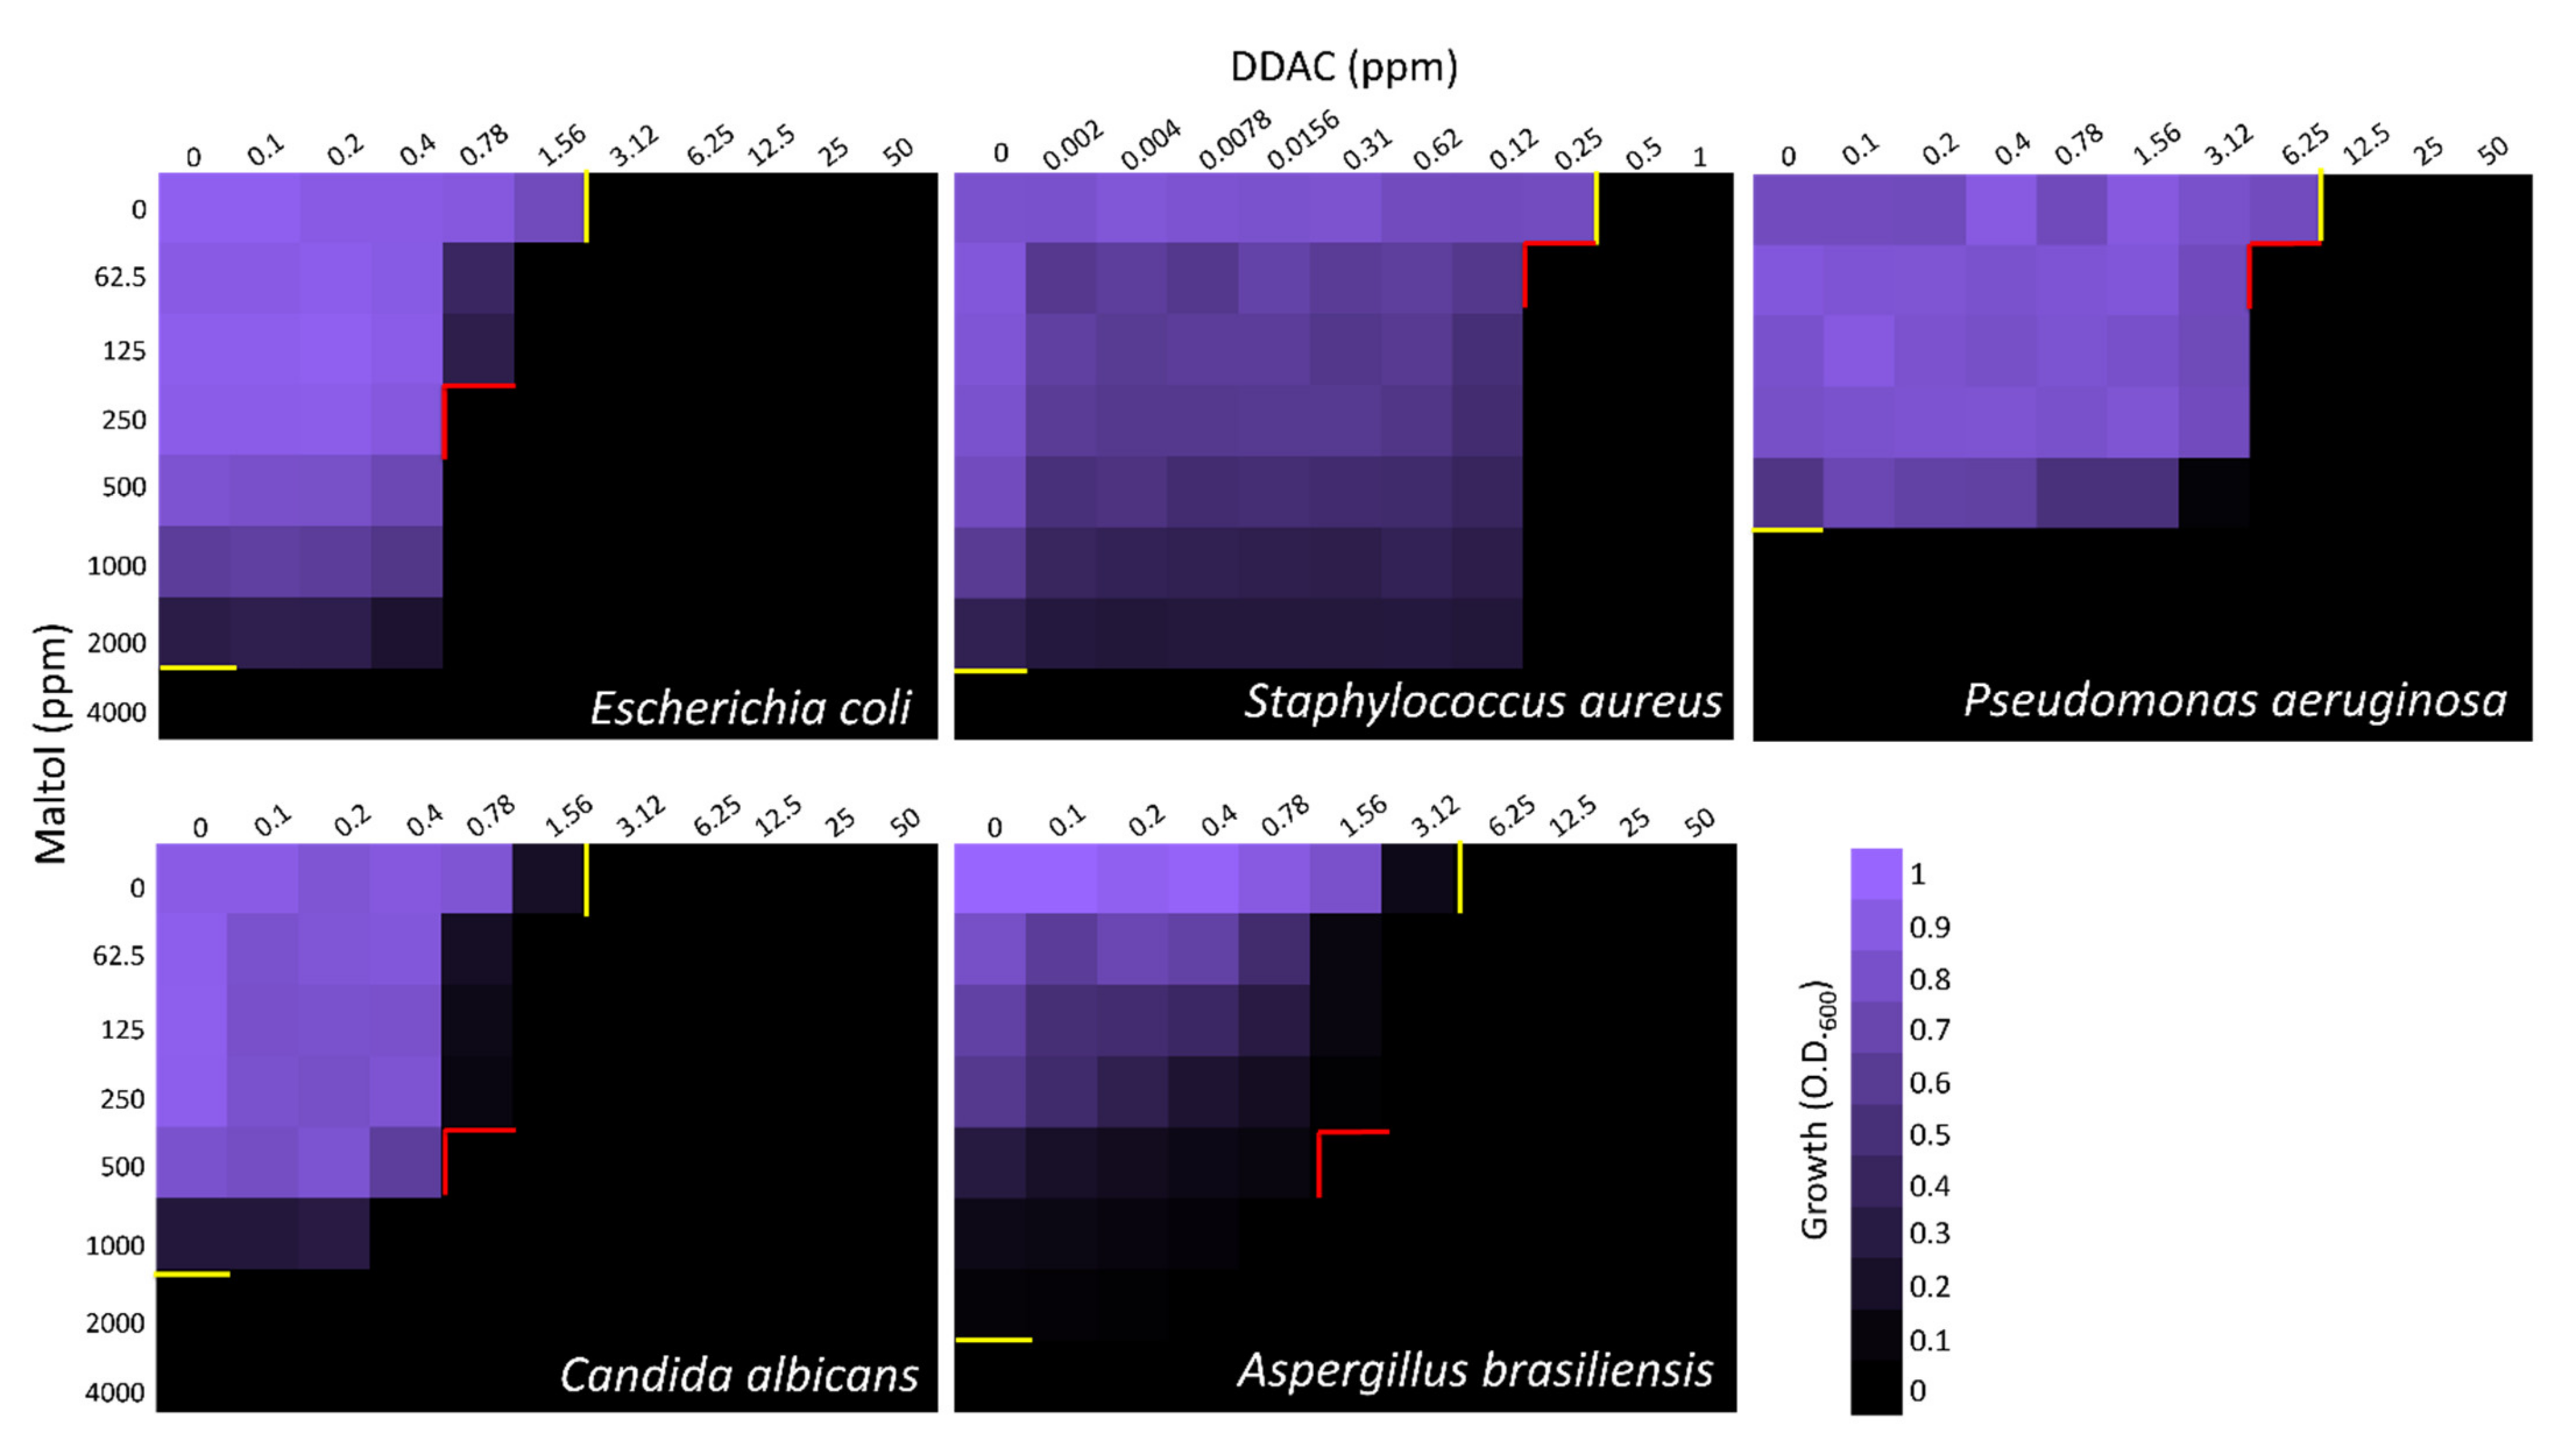
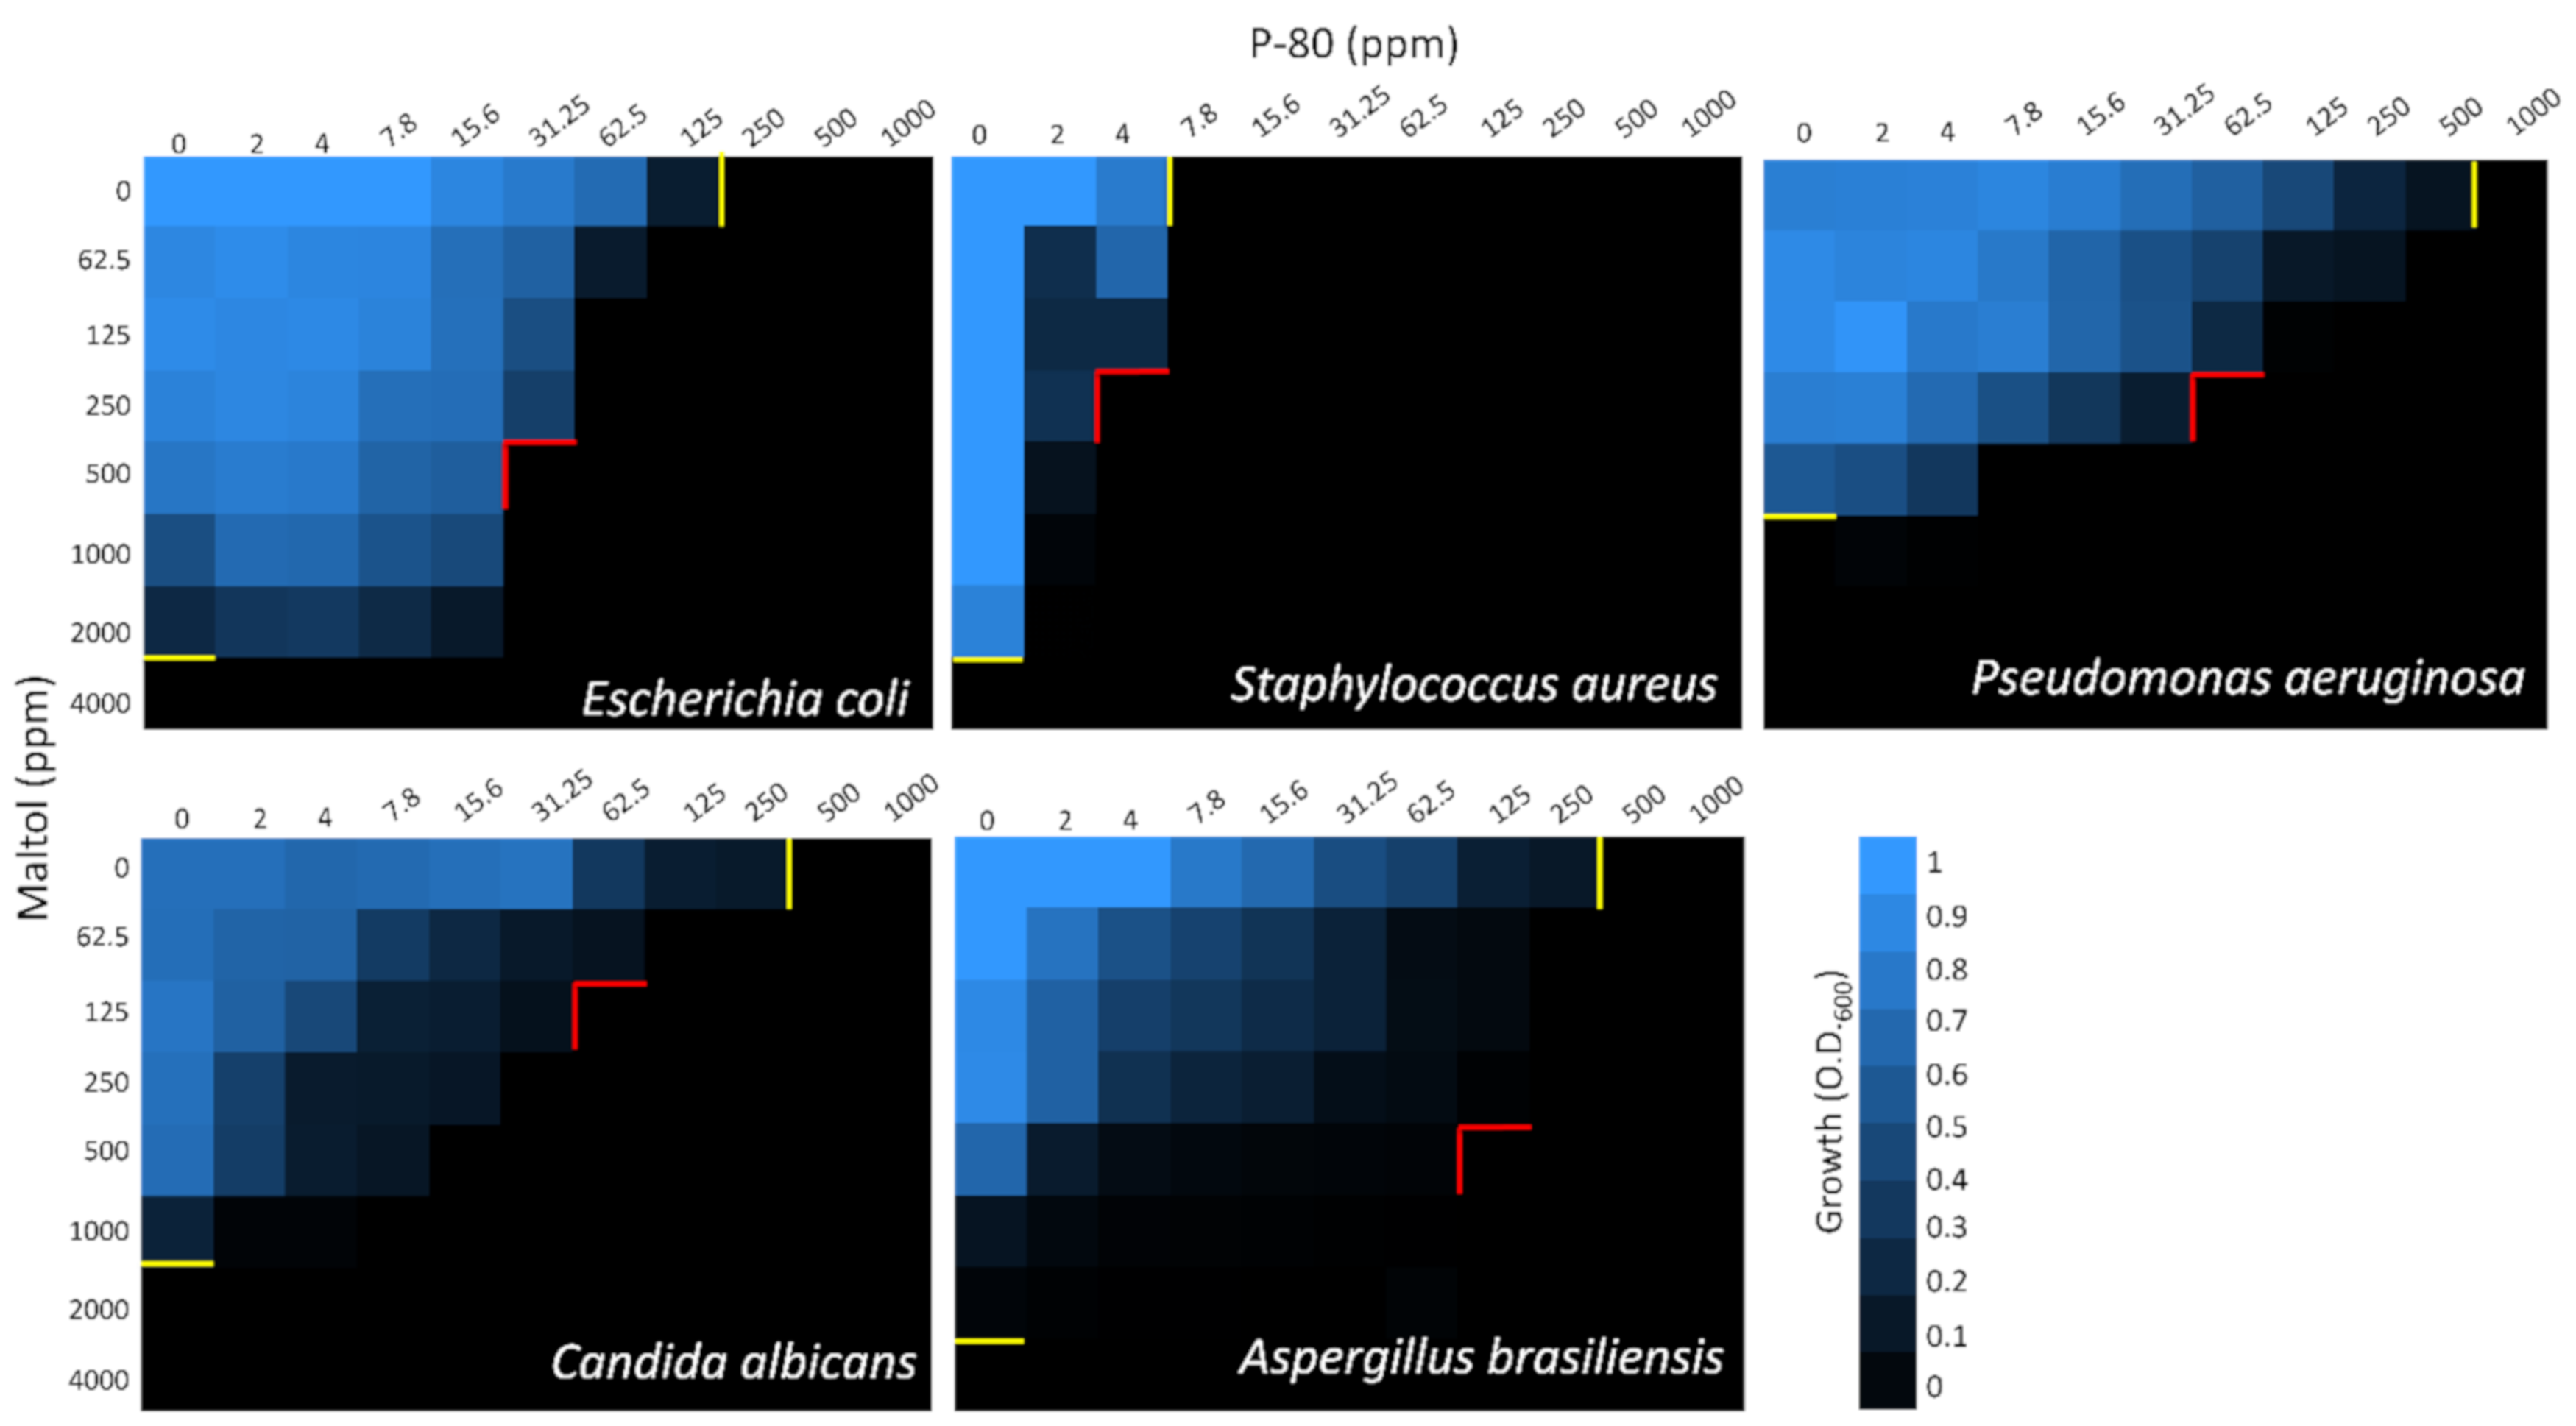
3.1. MIC and Checkerboard Assays

To evaluate the effect of maltol combined with either the cationic surfactants, checkerboard assays were performed (Figure 2 and Figure 3, and Figure S1), and FICI values were calculated (Table 1). MIC100 values of maltol ranged between 1000 and 4000 ppm, P-80 with 4–1000 ppm, and DDAC with 0.5–6.25 ppm. FICI values were calculated as (MICA combined/MICA alone) + (MICB combined/MICB alone), while synergy was defined as FICI ≤ 0.5, and an additive effect was defined as 0.5 < FICI < 0.1 [22]. In all microorganisms, synergistic effect with either one or two of the cationic surfactant blends was observed, except for Gram-positive S. aureus, which showed only additive antimicrobial effects of the compounds (Figure 2 and Figure 3 and Table 1). In P. aeruginosa, only the maltol blend with P-80 had a synergistic effect indicated by FICI value of 0.31, while in E. coli, C. albicans, and A. brasiliensis, the synergistic effect was observed in both blends (Figure 2 and Figure 3 and Table 1).

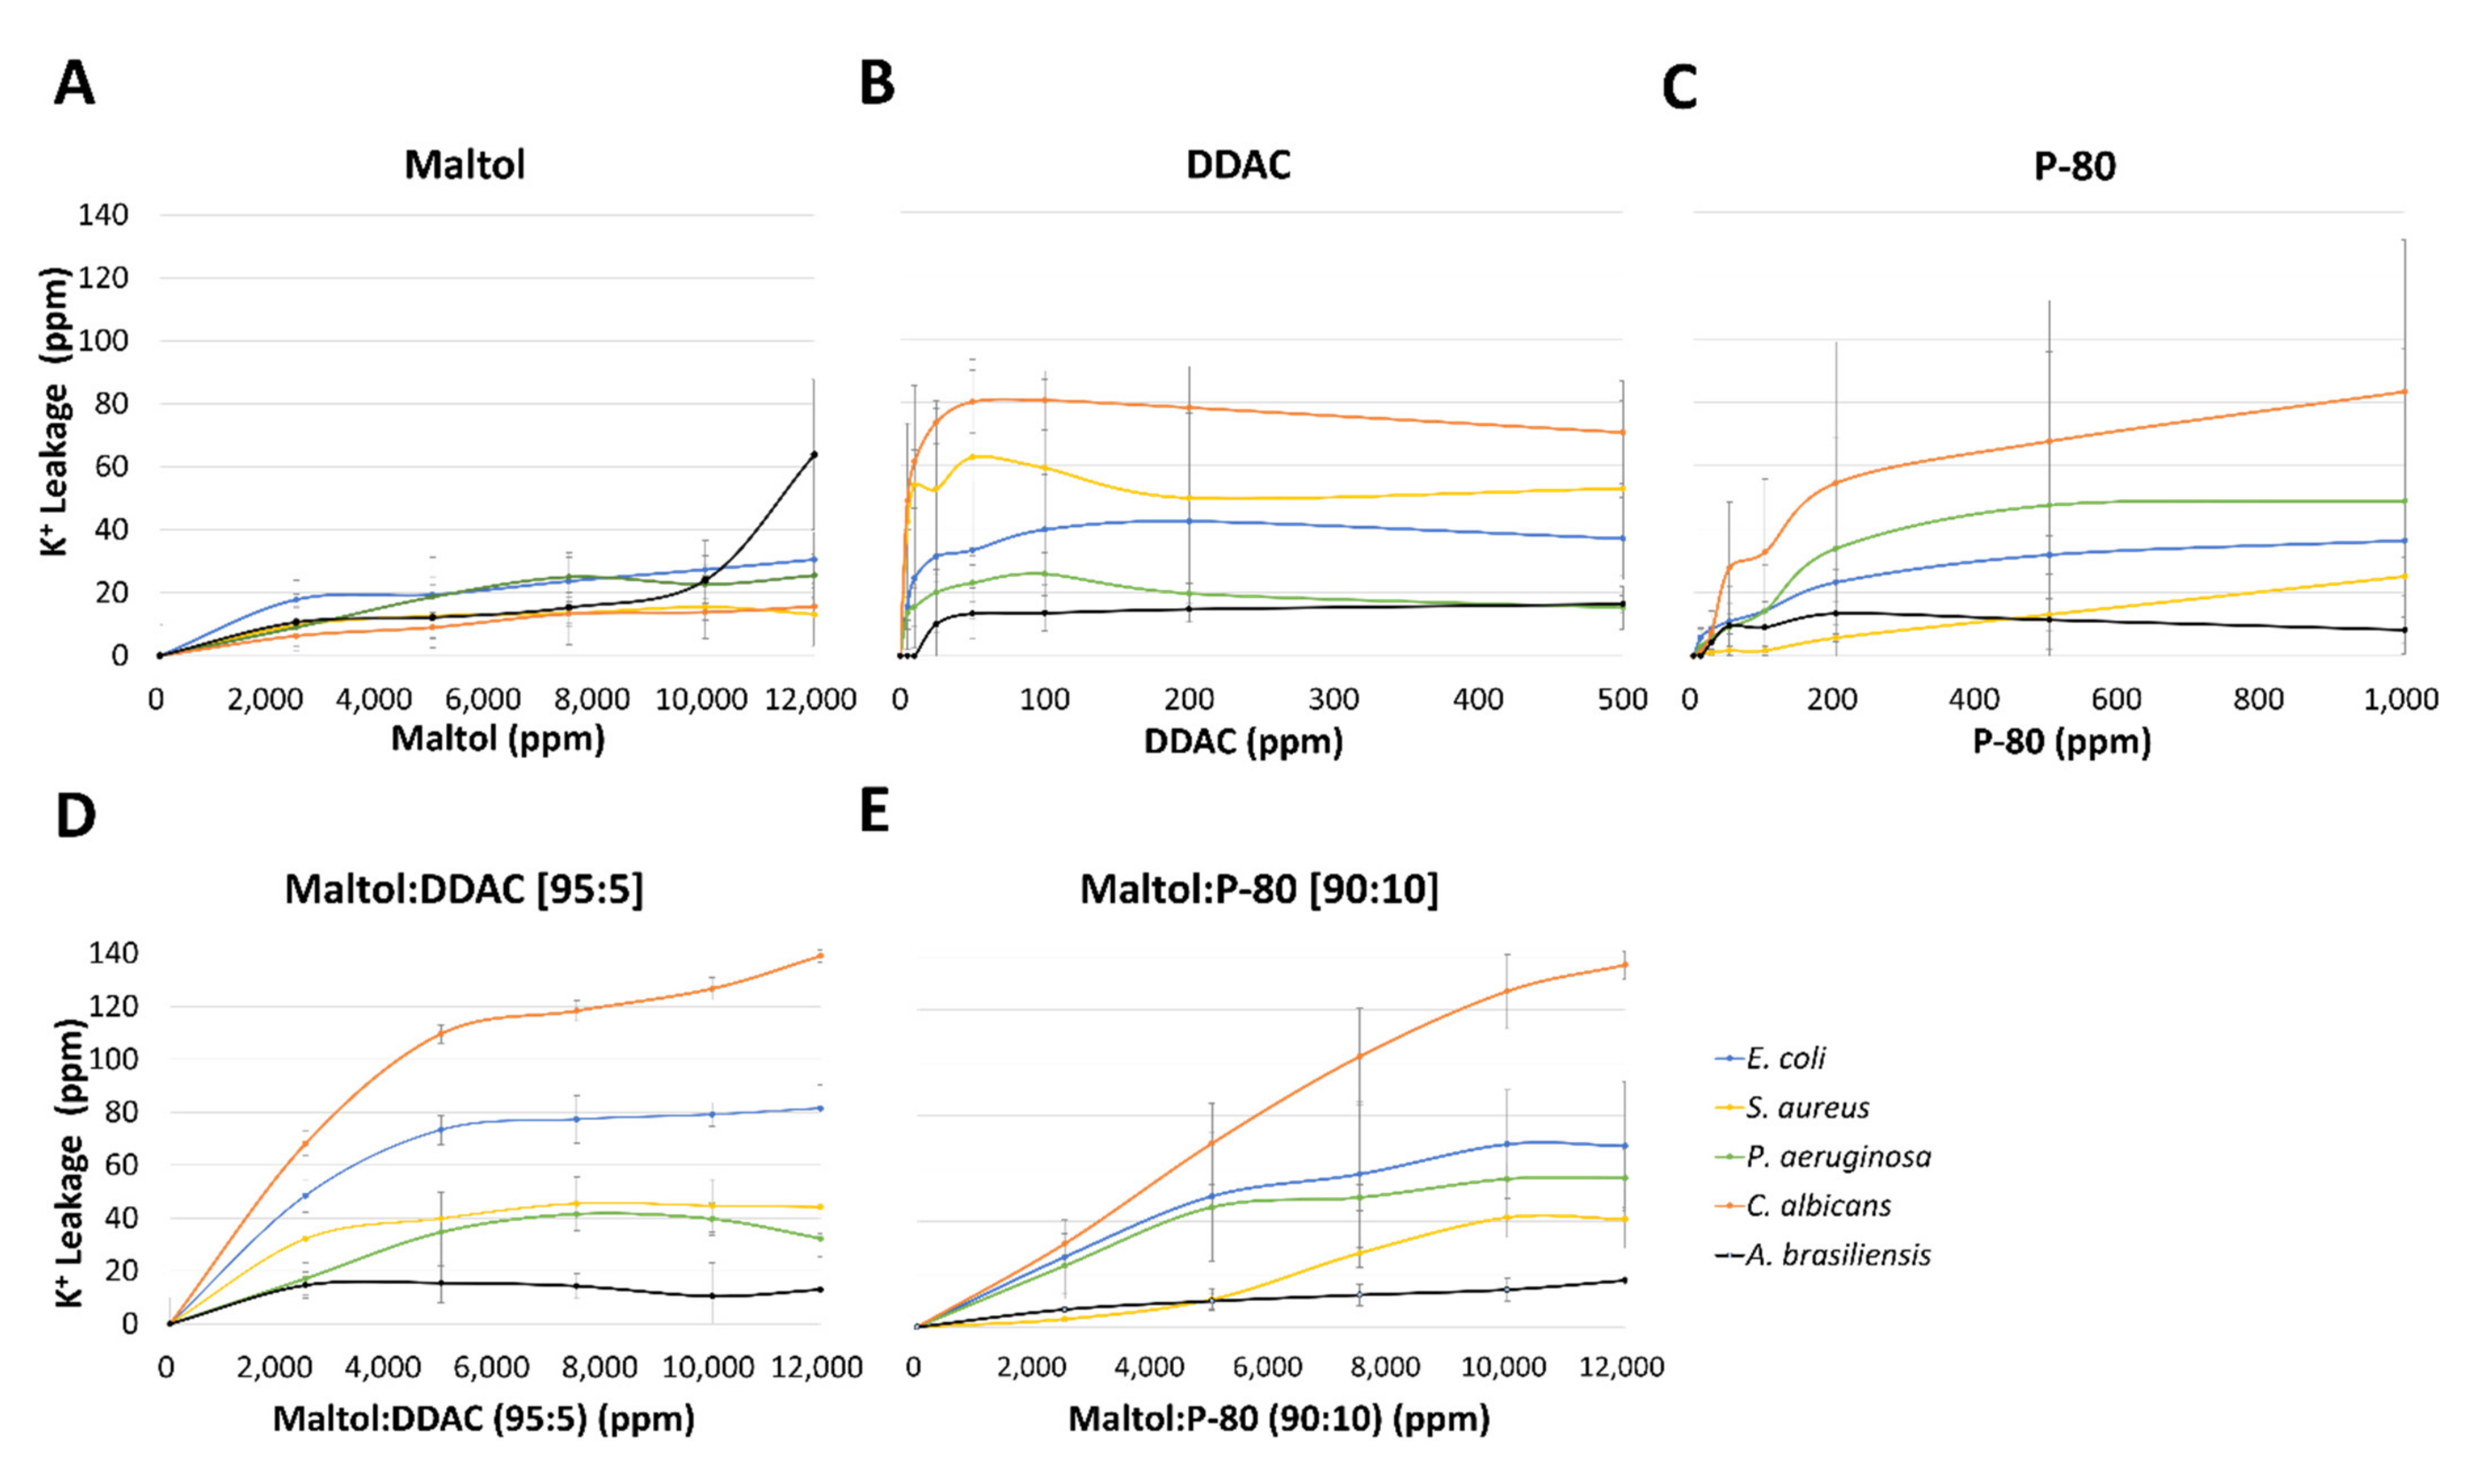
3.2. Potassium Leakage

Potassium leakage (ppm) was monitored from the five tested microorganisms, in response to increasing concentrations of maltol, DDAC, P-80, and blends of maltol and DDAC (95:5), and maltol and P-80 (90:10). Maltol caused the lowest effect in all microorganisms in comparison to any other treatment (Figure 4A), with the highest amount of K+ leakage of 64 ppm detected in A. brasiliensis, followed by 30.5 ppm in E. coli, and 25 ppm in P. aeruginosa. Gram-positive S. aureus and C. albicans were affected the least by maltol treatment with 13–16.5 ppm of potassium leakage. Cationic surfactants treatment of DDAC and P-80 caused higher K+ leakage reaching up to 80 ppm in C. albicans (Figure 4B,C). DDAC treatment was the most effective in lower concentrations up to 50 ppm, with a plateauing response afterwards. C. albicans and S. aureus were the most affected by DDAC treatment, followed by an intermediate response of E. coli, while P. aeruginosa and A. brasiliensis were the least affected (Figure 4B). In P-80 treatment, C. albicans was the most affected, followed by P. aeruginosa, E. coli, S. aureus, with the lowest effect observed in A. brasiliensis (Figure 4C). P-80 treatment caused a gradual increase in K+ leakage up to the final tested concentration of 1000 ppm (Figure 4C).
Compared with the individual maltol treatment alone, the blend of maltol with either the cationic surfactants, DDAC or P-80, induced a significantly higher potassium leakage; E. coli with p value < 0.005 for DDAC blend and p value < 0.1 for P-80 blend, C. albicans with p value < 0.001 for both blends, and S. aureus with p value < 0.1 for DDAC blend (Figure 5). In C. albicans for example, potassium leakage caused by maltol and cationic surfactants blends reached 137–139 ppm, while the individual compound treatments reached 78–83 ppm for the cationic surfactants and 15 ppm for maltol. E. coli reached 71–83 ppm of potassium leakage caused by the maltol blends treatments, in comparison to only 30–42 ppm in the individual compound treatments alone (Figure 5).

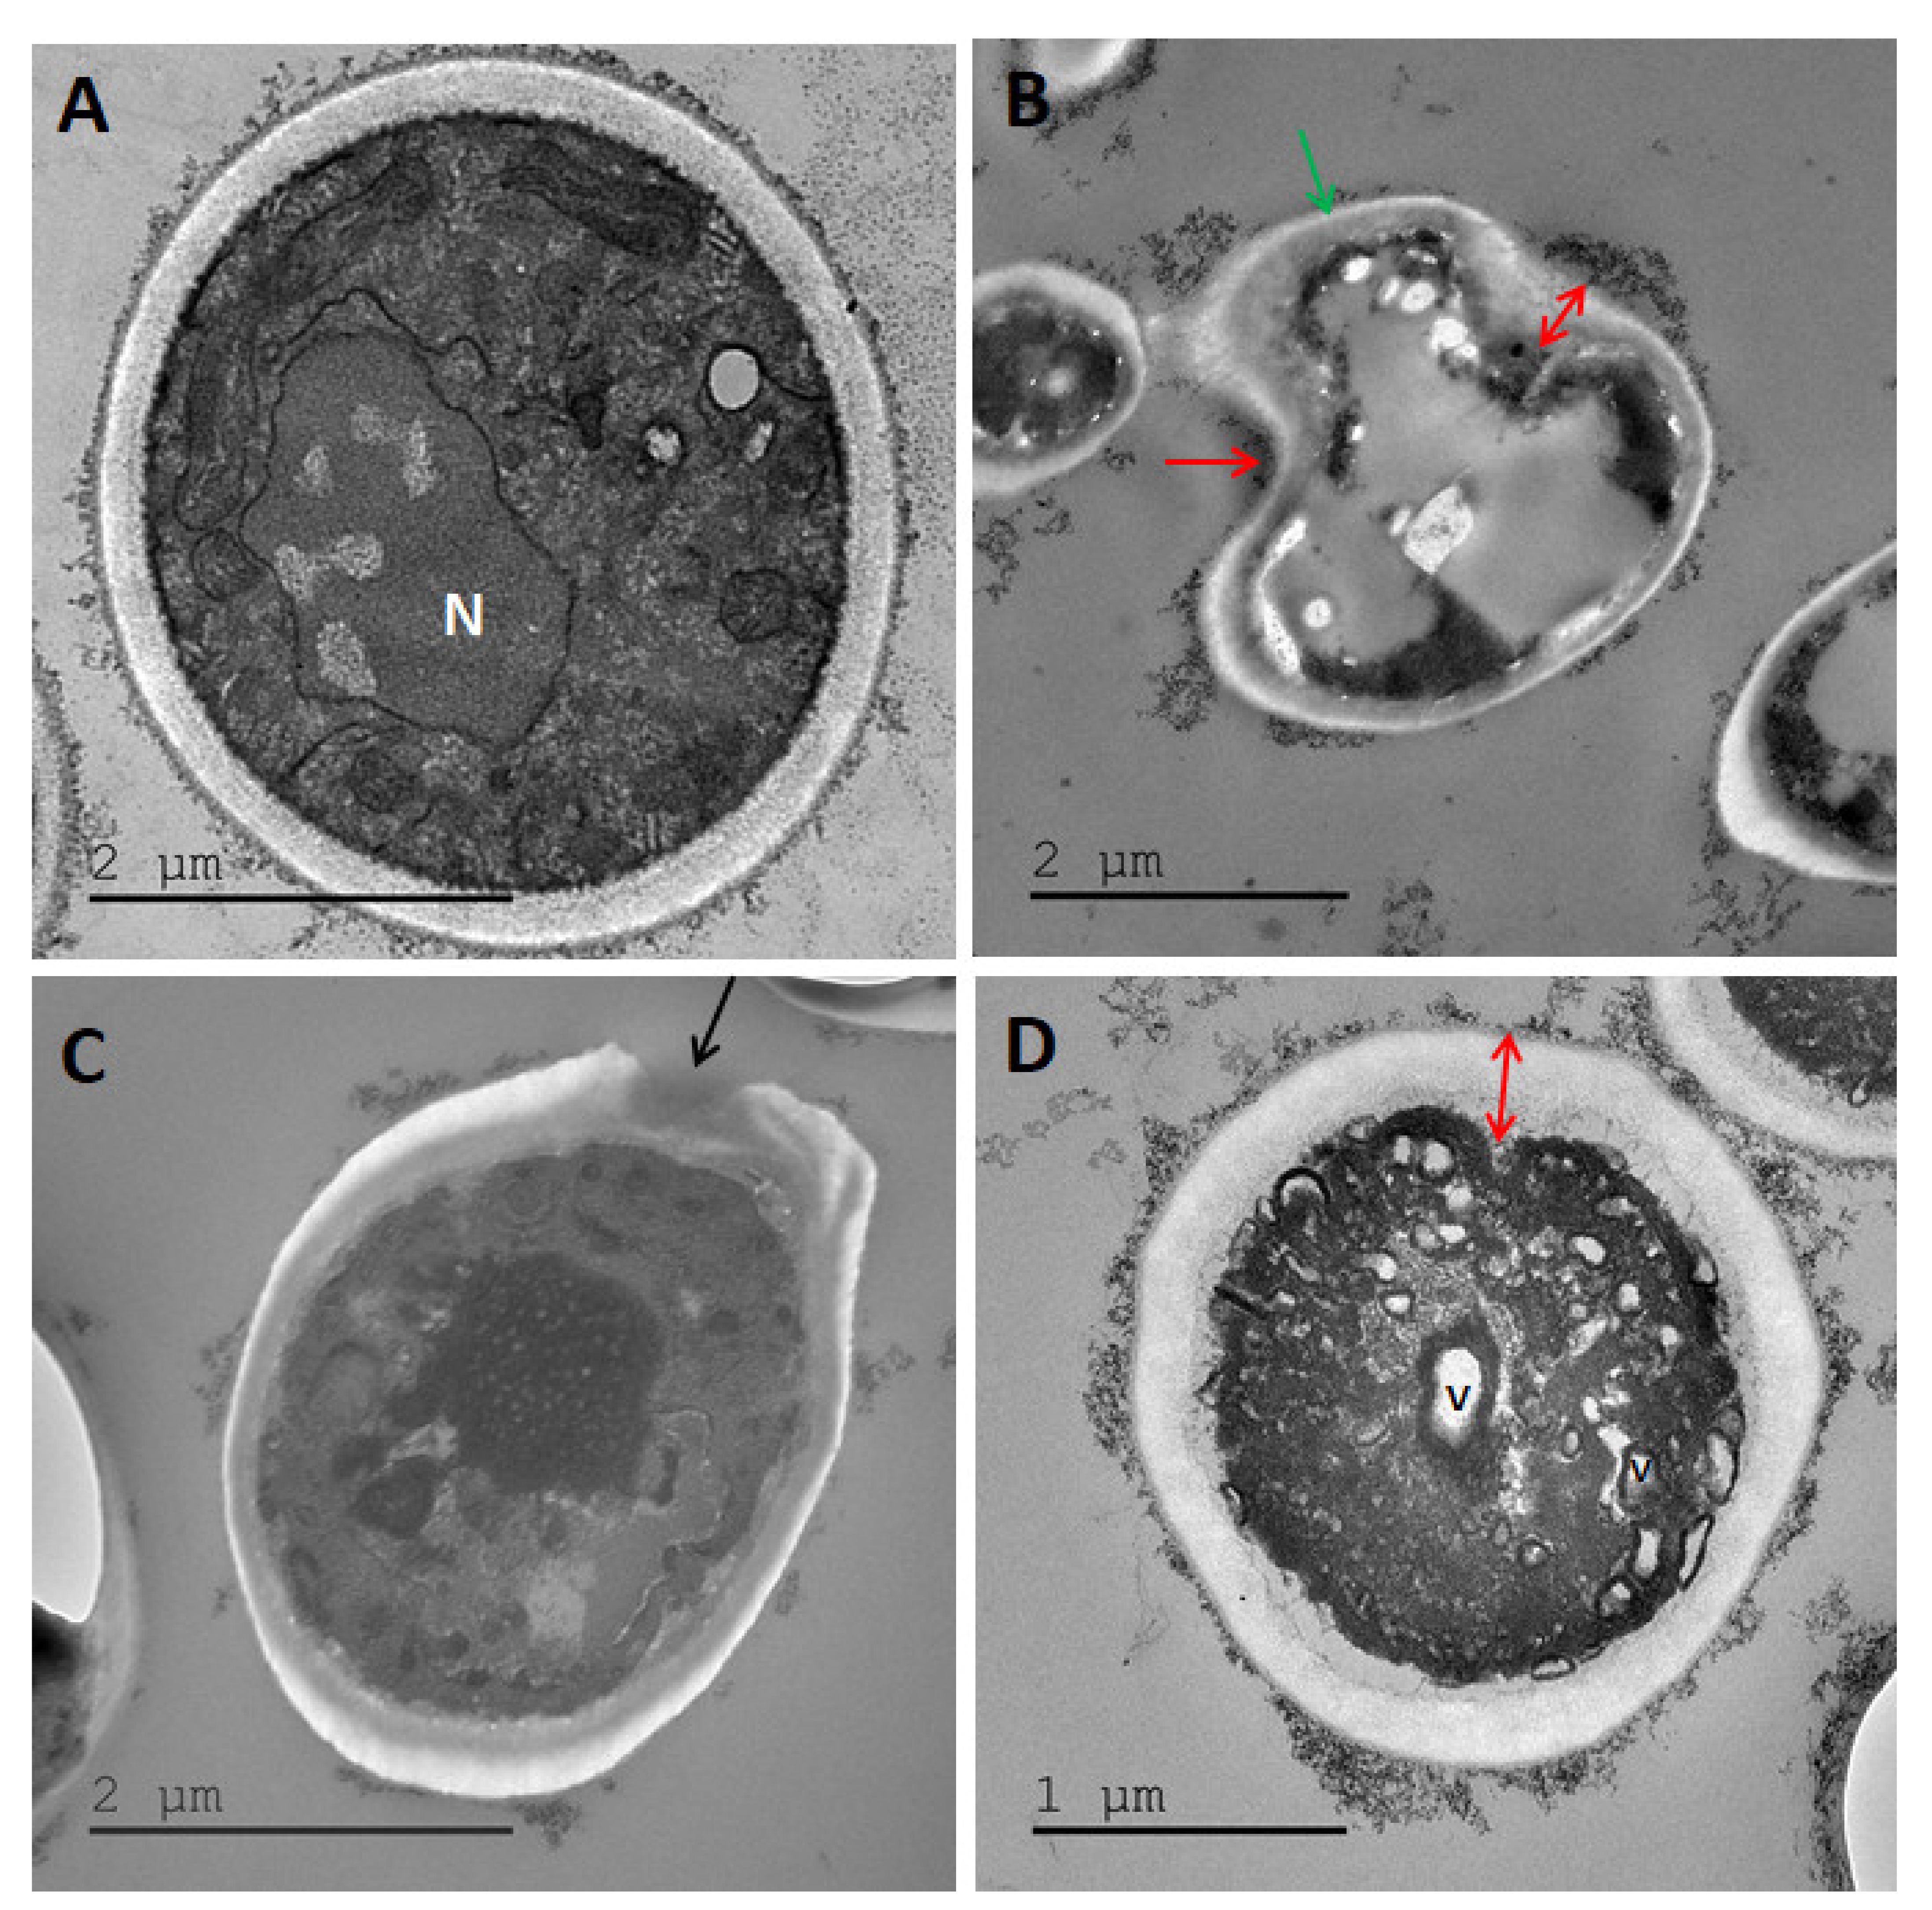
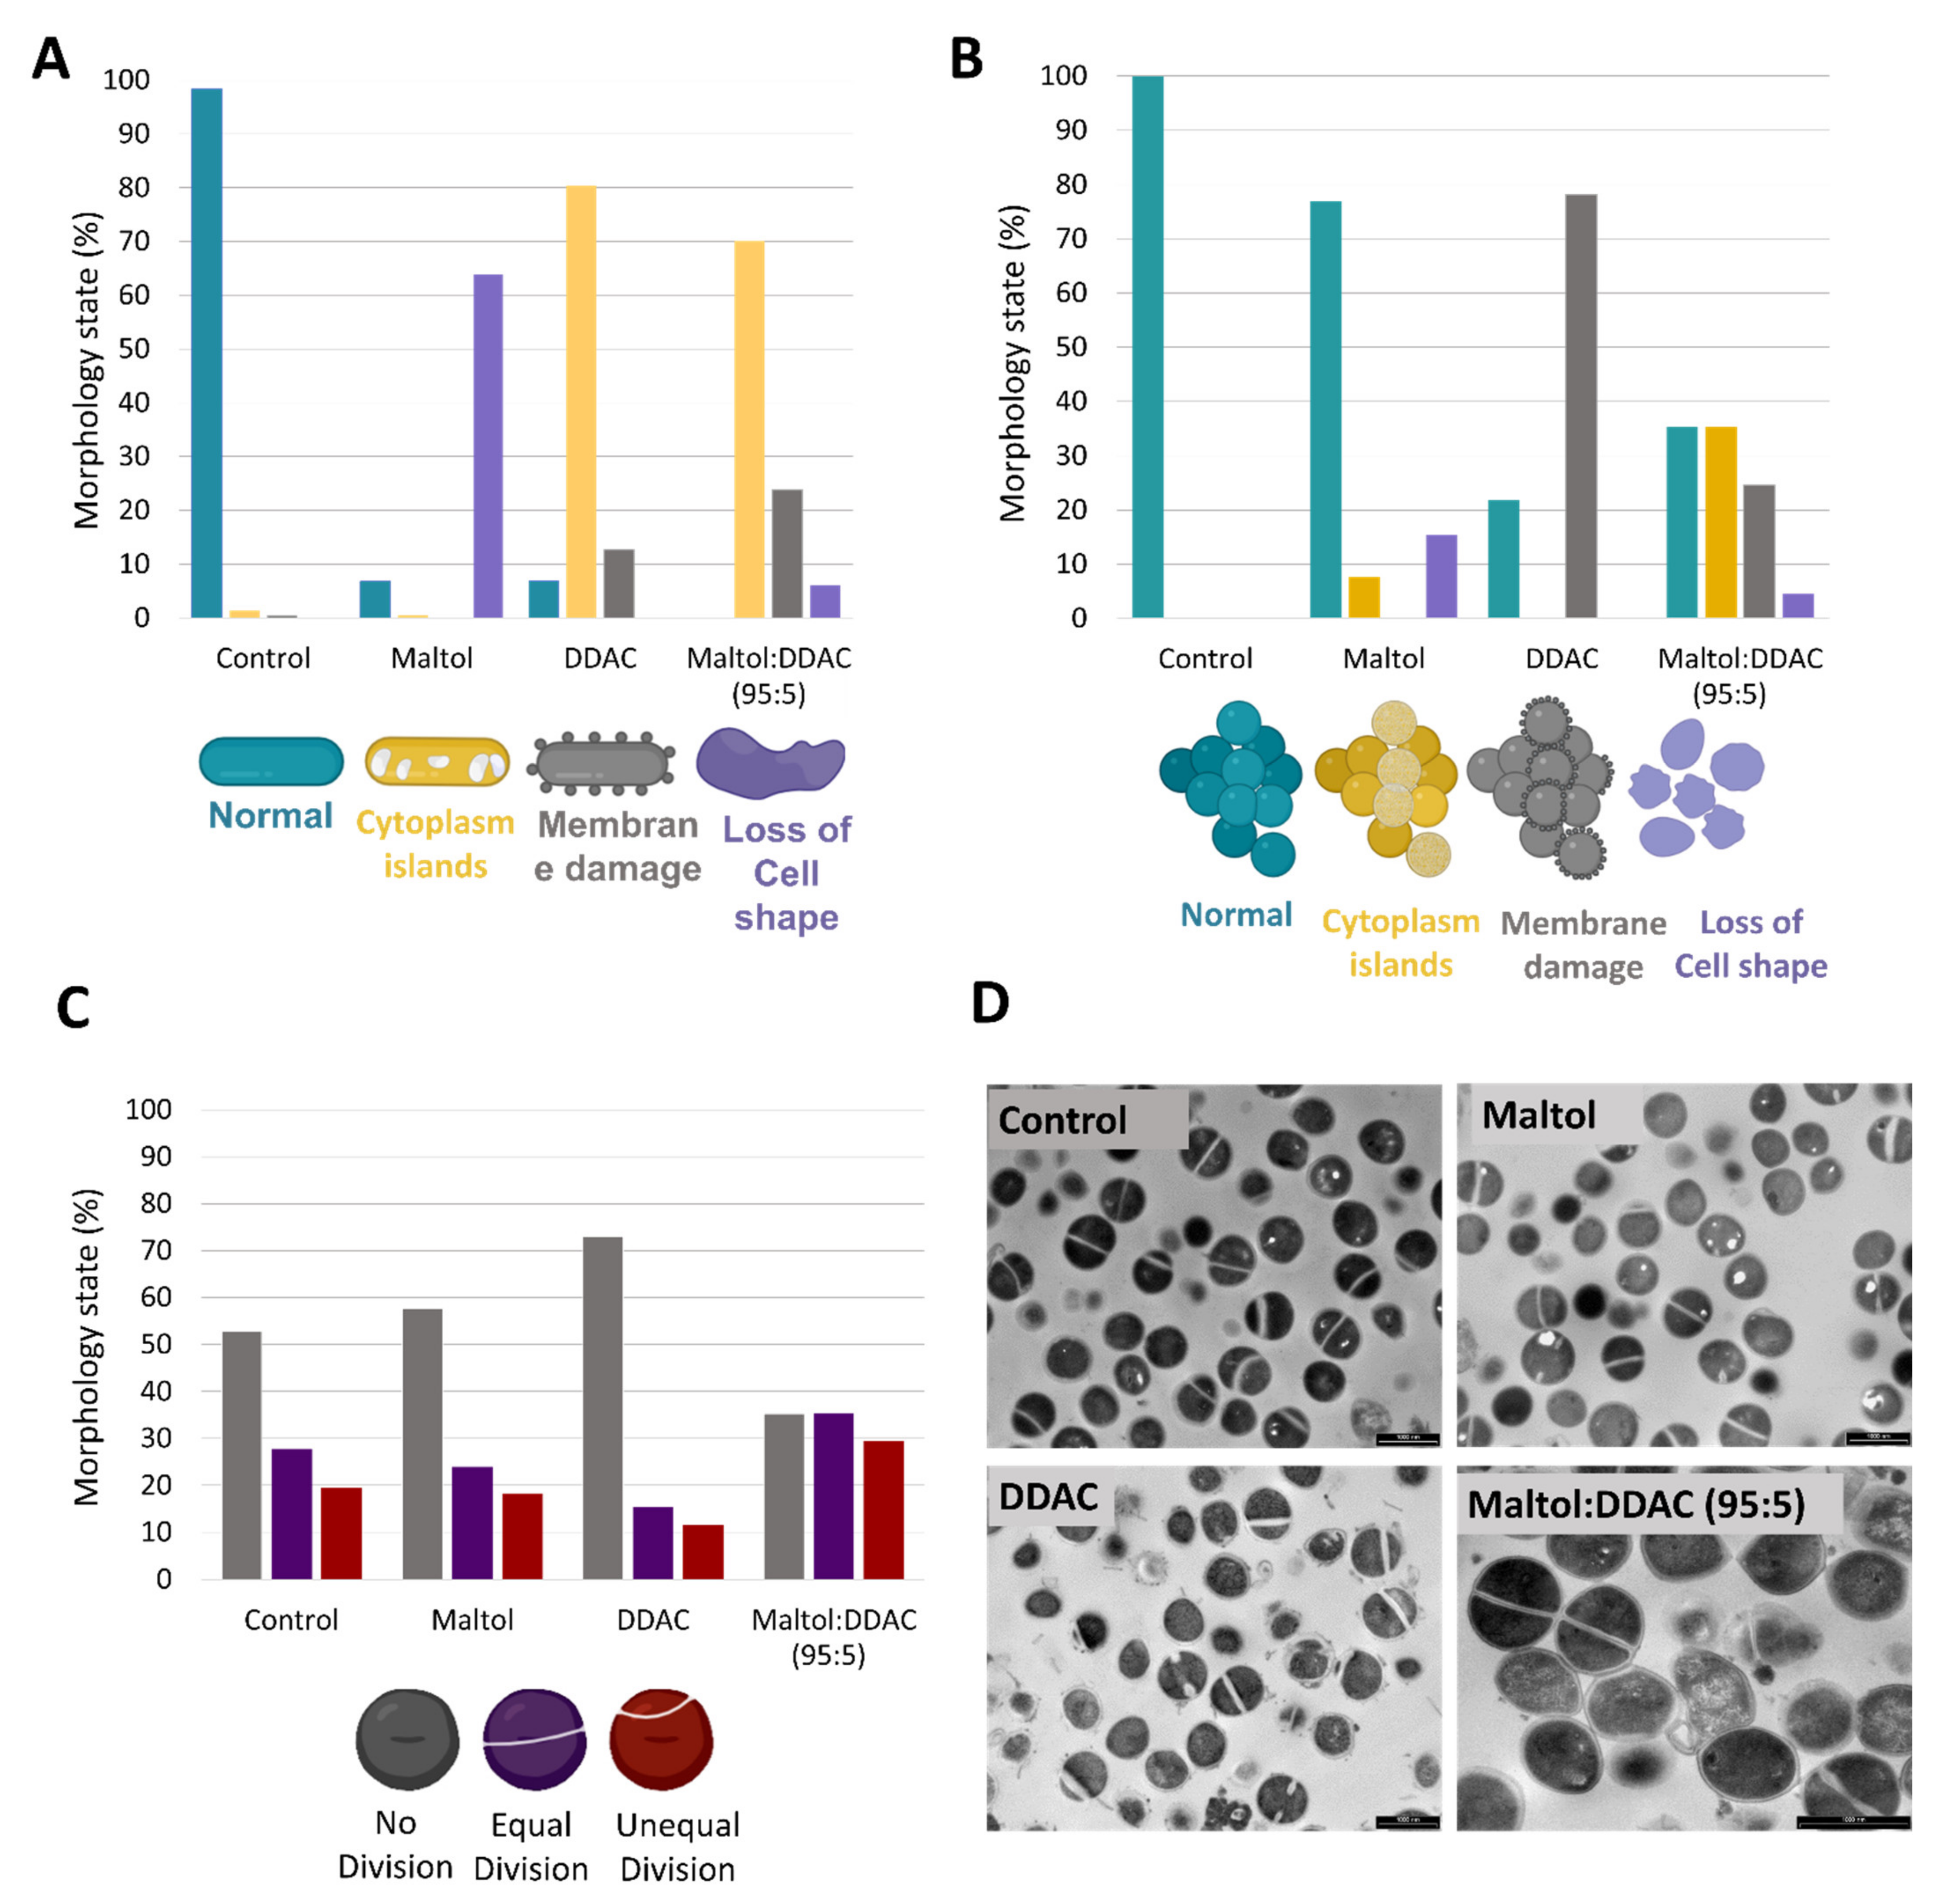
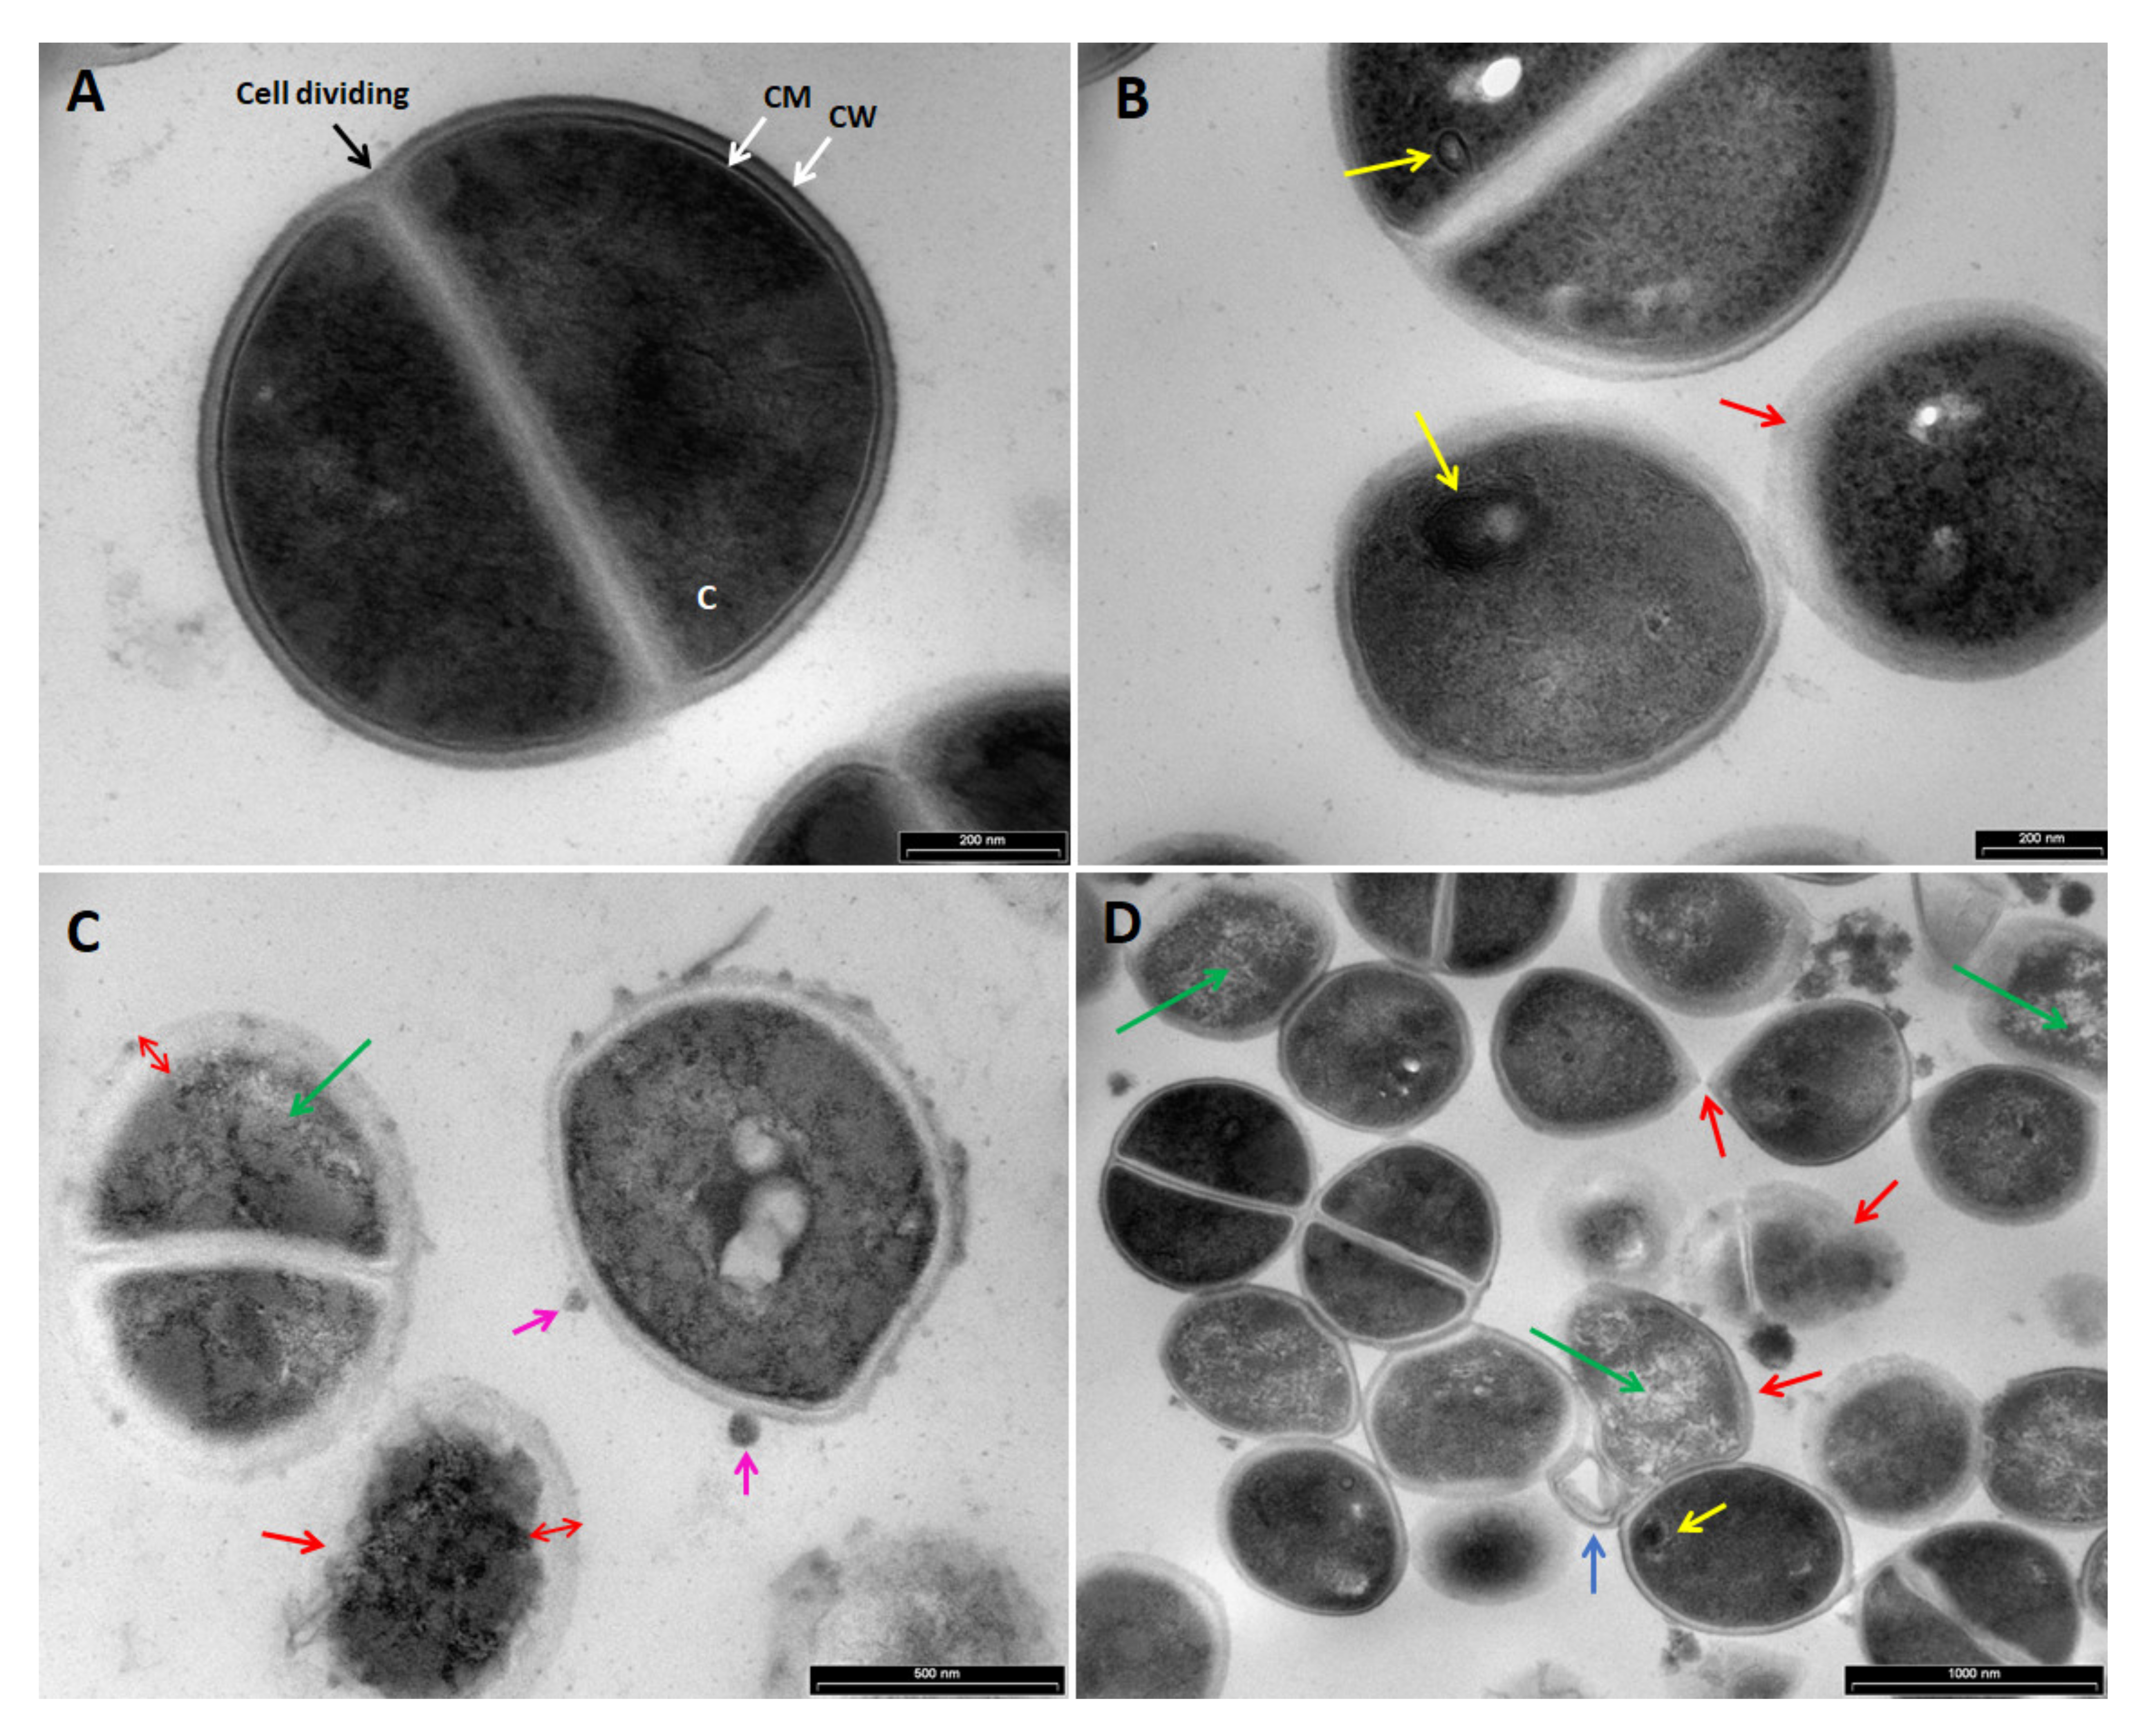
3.3. Transmission Electron Microscopy (TEM)

TEM images of P. aeruginosa (Figure 6 and Figure 7), S. aureus (Figure 8), C. albicans (Figure 9), and A. brasiliensis (Figure 10) were taken, following treatment with maltol, DDAC, and a blend of maltol and DDAC combined (95:5). All treatments induced morphological changes to the tested microorganisms. In P. aeruginosa treated with maltol at 4500 ppm (Figure 6B), over-folding of the membrane (red line) and loss of rod shape, replaced by irregular structures (red arrows) were observed, in comparison to the no-treatment control (Figure 6A). Some of the cells seemed more condensed, while others appeared as they lost their intracellular material (green arrows). In some cases, thickening and detachment of the outer cell wall from the inner cell membrane was detected. DDAC treatment (Figure 6C and Figure 7B) caused severe leakage of intracellular material, observed by islands of cytoplasm (C), with many of the cells observed having a membrane bound segments extending from the cell membrane (blue arrows). Treatment with the maltol and DDAC blend (Figure 6D and Figure 7C), caused bleb-like vesicles burgeoning from the bacterial surface (pink arrows), while the segments extending from the cell wall observed in the DDAC treatment were present in the blend treatment as well (blue arrows).
In S. aureus, the maltol treatment induced an appearance of mesosome-like structures (Figure 8B; yellow arrows), non-membrane enclosed bodies (not shown) and irregular cell division (not shown). In addition, in some cases, cell wall appeared blurry as it was losing its integrity (red arrow). The DDAC treatment (Figure 8C) caused an intracellular material leakage appearing as bleb-like vesicles burgeoning from the bacterial surface (pink arrows), loss of intracellular material (green arrows), widening, and detachment of the cell membrane from the cell wall, while cell wall appears blurry (red arrows). The maltol and DDAC blend treatment (Figure 8D) included both individual compounds effects, mesosome like structures, irregular cell division and intracellular material leakage. In addition, increased effect of cocci shape loss was observed (red arrows).
The maltol treatment in C. albicans and A. brasiliensis (Figure 9B and Figure 10B) caused a severe alteration of the cell wall structure, which appeared distant from the intracellular material with receding cell membrane (red arrows), lysis of the cell organelles and intracellular material (green arrow). The DDAC treatment in both yeast and mold species (Figure 9C and Figure 10C) caused cell wall damage observed as holes in the membrane (black arrows). The cell wall seemed to keep its original rounded shape, while the intracellular material appeared intact. The maltol and DDAC blend (95:5) (Figure 9D and Figure 10D) caused vacuoles formation (V) and the appearance of empty islands of cytoplasm (C), specifically in C. albicans (Figure 9D). In addition, cell wall thickening was observed with slight changes in the characteristic rounded cell shape.
SEM images of C. albicans and A. brasiliensis (Figure 11) supported that the maltol treatment caused a sever alteration of the intracellular material of the cells, observed by hollowed structures of cells, which remained empty (Figure 11B,E). As opposed to maltol, the DDAC treatment appeared to only damage the outer cell wall in A. brasiliensis (Figure 11F), while C. albicans cells appeared severely damaged with a loss of structure (Figure 11C).
In addition to the qualitative morphology changes observed in the TEM and SEM images, a quantitative approach was taken to quantify the various changes in the bacterial cells as a response to the antimicrobial compound treatment. TEM image analysis was performed by defining the type of alteration in the microorganism cells, calculating the percentage of the cells with the observed phenomenon (Figure 12). For representation of the results, analysis was performed on P. aeruginosa (Figure 12A) and S. aureus (Figure 12B–D) TEM images.
In P. aeruginosa (Figure 12A), the maltol treatment mainly induced the loss of characteristic rod membrane shape (64%). DDAC treatment induced the leakage of intracellular material observed as areas of cytoplasm empty from the intracellular material (80.4%). The blend of maltol and DDAC treatment (95:5), induced mostly the loss of intracellular material observed by 70% of the cells having cytoplasm islands, followed by 24% of cells with membrane damage, and finally a low number of cells, which have lost their membrane structure (6%). As a comparison, in the control images, 98% of the cells appeared normal. In S. aureus (Figure 12B), the treatment with maltol caused only 15.4% of the cells to lose their cell shape, 7.7% lost some of their intracellular material, while most of the cells looked normal (77%). The DDAC treatment on the other hand, caused mainly membrane damage in 78% of S. aureus cells. The blend of maltol and DDAC (95:5) treatment caused the most intracellular material loss (35.4%) in comparison to any other treatment in S. aureus, followed by membrane damage (24.6%) and loss of cell shape (4.6%). In both bacterial species tested (Figure 12A,B), the maltol and DDAC blend induced the morphology that was observed by the individual compound treatments separately. In S. aureus, cell division was significantly altered due to the maltol and DDAC blend treatment (Figure 12C,D), with cells showing unequal cell division being 10 and 18% higher in comparison to all other treatments. The DDAC treatment, on the other hand, inhibited the S. aureus cell division, as shown by the fact that 73% of the cells were not dividing.

4. Discussion

Maltol is mainly used as a flavoring molecule and a preservative in the food industry. Despite the wide usage of maltol, a broader investigation of its antimicrobial mode of action is still needed. In the literature, the antimicrobial efficacy of maltol was evaluated in several studies [4,20,21]. According to the most detailed study, which took place in 1984, maltol inhibited only 10 out of 39 organisms at pH 6, and 5 of 39 organisms at pH 8, and was ineffective against fungi at either pH tested [19]. Mar and Pripdeevech discovered that C. spinosum flowers had a strong antimicrobial activity and suggested this was attributed to the presence of maltol, which was the main compound in the extract [3]. F. Schved et al. found that maltol, at 20 mmol/L (equal to 2522 ppm), resulted in 0.6 log reduction in CFU/mL of E. coli. However, when added in a combination with nisin, which caused only 0.6 log reduction on its own, they yielded 5.5 log reduction in CFU/mL [20]. In their study, they postulated that maltol destabilize the outer membrane of the Gram-negative E. coli by chelating the positively charged Mg2+ and Ca2+ ions, and as a result, permeabilized the cell membrane to enhance the efficacy of nisin.
Recently, we have shown that maltol can be used in conjunction with only catalytic amounts of cationic quaternary surfactants species, in order to receive higher activity against contaminant microorganisms [21]. In this paper, we broadened the antimicrobial efficacy studies of maltol along with selected cationic surfactants, P-80 and DDAC. We found that maltol alone, only at high concentrations of 4000 ppm, was able to eradicate the growth of all five pharmacopeia strains (MIC100, Figure S1). In order to use a molecule as a preservative compound for cosmetic applications, the final product requires up to four times higher concentration than the MIC in a broth microdilution method. Therefore, maltol as a stand-alone compound could not be used as a preservative in a cosmetic product to efficiently inhibit the growth of the five pharmacopoeia strains using the challenge test procedure according to ISO 11930 (Figure S2A). We hypothesized that maltol, combined with a low concentration of selected cationic surfactants, could yield an enhanced antimicrobial effect (Figure S2B,C).
Cationic surfactant were shown to display a high affinity to the negative net charge of the microbial cell wall interface, causing their clustering, ruptures, and leakage [24,25]. The most common hypothesized mechanism of action of cationic surfactants involves the replacement of the positive cations stabilizing the membrane; thus, attaching to the polar surface with their hydrophobic alkyl chain, embedded into the phospholipid bilayer [25,26]. This leads to tendency of the membrane to cluster into segments, which are released from the cell [25].
In our study, TEM images of both P. aeruginosa and S. aureus treated with DDAC showed membrane bound segments being pulled out and released from the membrane (blue arrows: Figure 6C, Figure 7B and Figure 8C). This phenomenon was observed in a previous study using TEM, showing blebs of fibrous substances on the cell surface of E. coli treated with DDAC [27]. In our TEM image analysis, DDAC treatment in P. aeruginosa induced mainly the loss of intracellular material observed by cytoplasm islands and membrane damage (Figure 12A; yellow and gray graphs respectively). While in S. aureus, DDAC mainly caused membrane damage (Figure 12B). Maltol treatment, on the other hand, elicited different morphological changes in the tested bacteria. In P. aeruginosa, it caused significant changes in cell shape (Figure 12A) with folding and contraction of the cell wall (Figure 6B). In Gram-positive S. aureus images, loss of cell shape was observed during maltol treatment however, the number of normal cells was greater (Figure 12B). Similar to the bacterial morphological analysis, eukaryotes C. albicans and A. brasiliensis treated with DDAC (Figure 9C and Figure 10C), although exhibiting cell wall damage as observed by the presence of holes in the membrane (black arrows), were able to maintain their rounded cell wall shape. On the other hand, maltol caused significant alteration in cell shape, receding of the plasma membrane, and severe degradation and lysis of intracellular material (Figure 9B and Figure 10B). SEM images of yeast and mold species were in concordance to the TEM images, where both fungi species showed membrane and cell wall damage due to the DDAC treatment with overall maintained cell shape (Figure 11B,E), while hollowed empty cells that lost their shape were observed following treatment with maltol (Figure 11C,F).
Maltol and cationic surfactant combined effect was found synergistic in four out of the five tested strains according to our checkerboard assays. The synergy was found significantly higher in the combination of maltol and P-80. Although previous literature suggested maltol was ineffective against fungi [19], high synergy was found in the blend of maltol and both cationic surfactants against C. albicans and A. brasiliensis, with FICI values of 0.19–0.5 (Table 1). The only microorganism having an additive response with FICI value of 0.52 for maltol:DDAC and 0.58 for maltol:P-80 (Table 1) was the Gram-positive S. aureus. S. aureus was highly sensitive to both cationic surfactants; therefore, the combined effect along with maltol was minor. When looking at potassium leakage response, maltol had significantly lower response in comparison to the cationic surfactant treatment in all microorganisms; however, when the maltol blends were applied with the cationic surfactants, the potassium leakage concentrations, specifically in E. coli and C. albicans, was significantly higher in comparison to the individual compound treatment alone (Figure 5). TEM images taken from microorganisms treated with a maltol and DDAC blend showed the combined effects observed by the treatment with the individual compounds alone. This was indicated by membrane damage, leakage of intracellular material observed by cytoplasm islands, membrane bound segments, and fibrous blebs released from the cells, as well as higher number of cells that lost their shape (Figure 12).
In P. aeruginosa treated with the maltol and DDAC blend, TEM images showed vesicles-like structures on the cell surface (Figure 6D and Figure 7C; pink arrows). Such structures were previously observed in P. aeruginosa treated with chitosan oligosaccharide [28]. This feature might be the lipopolysaccharides (LPS) released from the Gram-negative bacterial cells. LPS are polyanionic molecules found in Gram-negative bacteria providing a hydrophilic surface area. These structures contain phosphate and carboxyl anionic groups. The repulsive forces, due to accumulation of the negative charges, are bridged by the divalent cations (Mg2+ and Ca2+), which are known to be crucial for the integrity and stability of the bacterial outer membrane (OM) [29]. Chelation of these divalent cations by compounds such as ethylenediaminetetraacetic acid (EDTA) is a well-established method to permeabilize Gram-negative bacteria such as E. coli and P. aeruginosa [29,30]. Chitosan has cationic properties, and it can bind trace metals similarly to chelating agents; therefore, our observation in P. aeruginosa TEM images of the LPS structures released from the bacterial cell wall (pink arrows) due to the combined effect of maltol, along with the cationic surfactant, can be supported by the literature.

5. Conclusions

In this study, we investigated the antimicrobial efficacy of maltol, and its combined effect with two cationic surfactants. We found that maltol has a synergistic effect when combined with DDAC or P-80, while the morphological examination allowed us to quantify and attribute this synergistic effect to the cell wall damage observed in TEM images of the microorganisms. The resultant enhanced efficacy of maltol along with the minimal concentration of cationic surfactant can be applied as a preservative solution in order to reduce or eliminate the presence of synthetic compounds within the cosmetic application. Finally, we were able to use only a catalytic amount of cationic surfactant along with maltol, enabling gentle and friendly formulation to the skin, which resulted in high efficacy performance.

Supplementary Materials

The following are available online at https://www.mdpi.com/article/10.3390/cosmetics8030086/s1, Figure S1: MIC100 of Maltol, DDAC and P-80 compounds, Figure S2. Challenge test with maltol and maltol blends with cationic surfactants.

Author Contributions

Conceptualization, P.S. and N.Z.; methodology, N.Z. and M.B; software, M.B.; validation, N.Z.; formal analysis, N.Z. and M.B.; investigation, N.Z.; resources, P.S.; data curation, N.Z. and M.B.; writing—original draft preparation, N.Z.; writing—review and editing, N.Z. and P.S.; visualization, N.Z. and M.B.; supervision, P.S. All authors have read and agreed to the published version of the manuscript.

Funding

This research was funded by Israel Innovation Authority, grant number 67311.

Institutional Review Board Statement

Not applicable.

Informed Consent Statement

Not applicable.

Acknowledgments

We thank Inbal Tzafrir for her contribution in the project administration.

Conflicts of Interest

The authors declare no conflict of interest.

References

  1. Han, Y.; Xu, Q.; Hu, J.N.; Han, X.Y.; Li, W.; Zhao, L.C. Maltol, a food flavoring agent, attenuates acute alcohol-induced oxidative damage in mice. Nutrients 2015, 7, 682–696. [Google Scholar] [CrossRef]
  2. Tiefel, P.; Berger, R.G. Seasonal variation of the concentrations of maltol and maltol glucoside in leaves of Cercidiphyllum japonicum. J. Sci. Food Agric. 1993, 63, 59–61. [Google Scholar] [CrossRef]
  3. Mar, A.; Pripdeevech, P. Chemical composition and antibacterial activity of essential oil and extracts of Citharexylum spinosum flowers from Thailand. Nat. Prod. Commun. 2014, 9, 707–710. [Google Scholar] [CrossRef] [Green Version]
  4. Hayata, Y. Studies on Passiflora incarnata dry extract. I. Isolation of maltol and pharmacological action of maltol and ethyl maltol. Chem. Pharm. Bull. 1974, 22, 1008–1013. [Google Scholar]
  5. Kornsakulkarn, J.; Saepua, S.; Supothina, S.; Chanthaket, R.; Thongpanchang, C. Sporaridin and sporazepin from actinomycete Streptosporangium sp. BCC 24625. Phytochem. Lett. 2014, 10, 149–151. [Google Scholar] [CrossRef]
  6. Zarrini, J. Introducing acidophilic and acid tolerant actinobacteria as new sources of antimicrobial agents against Helicobacter pylori. Arch. Razi Inst. 2021, 76, 1–23. [Google Scholar] [CrossRef]
  7. Rajamanikyam, M.; Gade, S.; Vadlapudi, V.; Parvathaneni, S.P.; Koude, D.; Kumar Dommati, A.; Kumar Tiwari, A.; Misra, S.; Sripadi, P.; Amanchy, R.; et al. Biophysical and biochemical characterization of active secondary metabolites from Aspergillus allahabadii. Process Biochem. 2017, 56, 45–56. [Google Scholar] [CrossRef]
  8. Kontoghiorghe, C.N.; Kolnagou, A.; Kontoghiorghes, G.J. Phytochelators intended for clinical use in iron overload, other diseases of iron imbalance and free radical pathology. Molecules 2015, 20, 20841–20872. [Google Scholar] [CrossRef] [Green Version]
  9. Kelsey, S.M.; Hider, R.C.; Bloor, J.R.; Blake, D.R.; Gutteridge, C.N.; Newland, A.C. Absorption of Low and Therapeutic Doses of Ferric Maltol, a Novel Ferric Iron Compound, in Iron Deficient Subjects Using a Single Dose Iron Absorption Test. J. Clin. Pharm. Ther. 1991, 16, 117–122. [Google Scholar] [CrossRef]
  10. Gasche, C.; Ahmad, T.; Tulassay, Z.; Baumgart, D.C.; Bokemeyer, B.; Büning, C.; Howaldt, S.; Stallmach, A. Ferric maltol is effective in correcting iron deficiency anemia in patients with inflammatory bowel disease: Results from a phase-3 clinical trial program. Inflamm. Bowel Dis. 2015, 21, 579–588. [Google Scholar] [CrossRef] [Green Version]
  11. Kaneko, N.; Yasui, H.; Takada, J.; Suzuki, K.; Sakurai, H. Orally administrated aluminum-maltolate complex enhances oxidative stress in the organs of mice. J. Inorg. Biochem. 2004, 98, 2022–2031. [Google Scholar] [CrossRef]
  12. Bernstein, L.R.; Tanner, T.; Godfrey, C.; Noll, B. Chemistry and pharmacokinetics of gallium maltolate, a compound with high oral gallium bioavailability. Met.-Based Drugs 2000, 7, 33–47. [Google Scholar] [CrossRef] [Green Version]
  13. Mi, X.J.; Hou, J.G.; Jiang, S.; Liu, Z.; Tang, S.; Liu, X.X.; Wang, Y.P.; Chen, C.; Wang, Z.; Li, W. Maltol Mitigates Thioacetamide-induced Liver Fibrosis through TGF-β1-mediated Activation of PI3K/Akt Signaling Pathway. J. Agric. Food Chem. 2019, 67, 1392–1401. [Google Scholar] [CrossRef]
  14. Li, W.; Su, X.M.; Han, Y.; Xu, Q.; Zhang, J.; Wang, Z.; Wang, Y.P. Maltol, a Maillard reaction product, exerts anti-tumor efficacy in H22 tumor-bearing mice via improving immune function and inducing apoptosis. RSC Adv. 2015, 5, 101850–101859. [Google Scholar] [CrossRef]
  15. Yasumoto, E.; Nakano, K.; Nakayachi, T.; Morshed, S.R.M.; Hashimoto, K.; Kikuchi, H.; Nishikawa, H.; Kawase, M.; Sakagami, H. Cytotoxic Activity of Deferiprone, Maltol and Related Hydroxyketones against Human Tumor Cell Lines. Anticancer Res. 2004, 24, 755–762. [Google Scholar] [PubMed]
  16. Jo, B.G.; Park, N.J.; Kim, S.N.; Jegal, J.; Choi, S.; Lee, S.W.; Yi, L.W.; Lee, S.R.; Kim, K.H.; Yang, M.H. Isolation of maltol derivatives from Stellera chamaejasme and the anti-atopic properties of maltol on skin lesions in DNCB-stimulated mice. RSC Adv. 2019, 9, 2125–2132. [Google Scholar] [CrossRef] [Green Version]
  17. Williams, M.; Eveleigh, E.; Forbes, G.; Lamb, R.; Roscoe, L.; Silk, P. Evidence of a direct chemical plant defense role for maltol against spruce budworm. Entomol. Exp. Appl. 2019, 167, 755–762. [Google Scholar] [CrossRef]
  18. Regulation (EC) No 1334/2008 of the European Parliament and of the Council of 16 December 2008 on flavourings and certain food ingredients with flavouring properties for use in and on foods and amending Council Regulation (EEC) No 1601/91, Regulations (EC) No 2232/96 and (EC) No 110/2008 and Directive 2000/13/EC (Text with EEA relevance). Off. J. Eur. Union 2018, 2016, 48–119.
  19. Schved, F.; Pierson, M.D.; Juven, B.J. Sensitization of Escherichia coli to nisin by maltol and ethyl maltol. Lett. Appl. Microbiol. 1996, 22, 189–191. [Google Scholar] [CrossRef] [PubMed]
  20. Salama, P.; Gliksberg, A. The use of catalytic amounts of selected cationic surfactants in the design of new synergistic preservative solutions. Cosmetics 2021, 8, 54. [Google Scholar] [CrossRef]
  21. Jay, J.M.; Rivers, G.M. Antimicrobial Activity of Some Food Flavoring Compounds. J. Food Saf. 1984, 6, 129–139. [Google Scholar] [CrossRef]
  22. Odds, F.C. Synergy, antagonism, and what the chequerboard puts between them. J. Antimicrob. Chemother. 2003, 52, 1. [Google Scholar] [CrossRef]
  23. Ziklo, N.; Tzafrir, I.; Shulkin, R.; Salama, P. Salicylate UV-filters in sunscreen formulations compromise the preservative system efficacy against Pseudomonas aeruginosa and Burkholderia cepacia. Cosmetics 2020, 7, 63. [Google Scholar] [CrossRef]
  24. Falk, N.A. Surfactants as Antimicrobials: A Brief Overview of Microbial Interfacial Chemistry and Surfactant Antimicrobial Activity. J. Surfactants Deterg. 2019, 22, 1119–1127. [Google Scholar] [CrossRef]
  25. Dolezal, R.; Soukup, O.; Malinak, D.; Savedra, R.M.L.; Marek, J.; Dolezalova, M.; Pasdiorova, M.; Salajkova, S.; Korabecny, J.; Honegr, J.; et al. Towards understanding the mechanism of action of antibacterial N-alkyl-3-hydroxypyridinium salts: Biological activities, molecular modeling and QSAR studies. Eur. J. Med. Chem. 2016, 121, 699–711. [Google Scholar] [CrossRef]
  26. Gilbert, P.; Moore, L.E. Cationic antiseptics: Diversity of action under a common epithet. J. Appl. Microbiol. 2005, 99, 703–715. [Google Scholar] [CrossRef] [PubMed]
  27. Yoshimatsu, T.; Hiyama, K.I. Mechanism of the action of didecyldimethylammonium chloride (DDAC) against Escherichia coli and morphological changes of the cells. Biocontrol Sci. 2007, 12, 93–99. [Google Scholar] [CrossRef] [PubMed] [Green Version]
  28. Saito, H.; Sakakibara, Y.; Sakata, A.; Kurashige, R.; Murakami, D.; Kageshima, H.; Saito, A.; Miyazaki, Y. Antibacterial activity of lysozyme-chitosan oligosaccharide conjugates (LYZOX) against Pseudomonas aeruginosa, Acinetobacter baumannii and Methicillin-resistant Staphylococcus aureus. PLoS One 2019, 14, e0217504. [Google Scholar] [CrossRef]
  29. Atay, H.Y. Antibacterial Activity of Chitosan-Based Systems. In Functional Chitosan; Jana, S., Jana., S., Eds.; Springer Nature Singapore Pte Ltd.: Singapore, 2019; ISBN 9789811502637. [Google Scholar]
  30. Clifton, L.A.; Skoda, M.W.A.; Le Brun, A.P.; Ciesielski, F.; Kuzmenko, I.; Holt, S.A.; Lakey, J.H. Effect of divalent cation removal on the structure of gram-negative bacterial outer membrane models. Langmuir 2015, 31, 404–412. [Google Scholar] [CrossRef] [Green Version]
Figure 1. Molecular structure of (A) maltol and (B) ferric maltol.
Cosmetics 08 00086 g001
Figure 2. Checkerboard assay of maltol and DDAC against E. coli, S. aureus, P. aeruginosa, C. albicans, and A. brasiliensis. Growth measured after 24 h by O.D.600. On the X-axis, DDAC was diluted in a two-fold series dilution in concentrations range of 0.1–50 ppm. On the Y-axis, maltol was diluted in a two-fold series dilution in a concentration range of 62.5–4000 ppm. Yellow lines indicate MIC100 values of individual compound alone. Red lines indicate the optimal concentrations of the combined compounds. Final values are represented as the average relative growth in each well compared to the blank, based on three independent experiments.
Cosmetics 08 00086 g002
Figure 3. Checkerboard assay of maltol and P-80 against E. coli, S. aureus, P. aeruginosa, C. albicans, and A. brasiliensis. Growth measured after 24 h by O.D.600. On the X-axis, P-80 was diluted in a two-fold series dilution in a concentration range of 2–1000 ppm. On the Y-axis, maltol was diluted in a two-fold series dilution in concentrations range of 62.5–4000 ppm. Yellow lines indicate MIC100 values of individual compound alone. Red lines indicate the optimal concentrations of the combined compounds. Final values are represented as the average relative growth in each well compared to blank, based on three independent experiments.
Cosmetics 08 00086 g003
Figure 4. Potassium leakage from the five pharmacopeia microorganisms, E. coli, S. aureus, P. aeruginosa, C. albicans, and A. brasiliensis, in response to increasing concentrations of the tested compounds; (A) maltol, (B) DDAC, (C) P-80, (D) maltol and DDAC (95:5), and (E) maltol and P-80 (90:10). Results are presented as ppm of potassium (K+) cations measured using emission flame photometry. Data are based on three independent experiments and represented as the average potassium leakage (ppm) ± SD.
Cosmetics 08 00086 g004
Figure 5. The average potassium leakage from the five pharmacopeia microorganisms, E. coli, S. aureus, P. aeruginosa, C. albicans, and A. brasiliensis, in response to maltol, DDAC, P-80, maltol:DDAC blend (95:5), and maltol:P-80 blend (90:10), by using a single chosen concentration, which elicited the highest response. Results are presented as ppm of potassium cations measured using emission flame photometry. Data are based on three independent experiments and represented as the average potassium leakage (ppm) ± SD. Significant differences are indicated as; * (p < 0.05) and ** (p < 0.01), using Holm–Sidak.
Cosmetics 08 00086 g005
Figure 6. TEM images of Pseudomonas aeruginosa treated with (A) H2O, no-treatment control, (B) maltol at 4500 ppm, (C) DDAC at 500 ppm, (D) blend of maltol and DDAC (95:5) at 5000 ppm. Green arrows: loss of intracellular material. Red line and arrows: over-folding of the membrane and loss of rod shape, replaced by irregular structure. Blue arrows: membrane bound segments extending from the cell membrane. Pink arrows: bleb-like vesicles burgeoning from the bacterial surface. Abbreviations: C: cytoplasm, CM: cell membrane, CW: cell wall.
Cosmetics 08 00086 g006
Figure 7. TEM images of Pseudomonas aeruginosa cells treated with (A) maltol at 4500 ppm, (B) DDAC at 500 ppm, and (C) blend of maltol and DDAC (95:5) at 5000 ppm. Black arrows: electron-condensed bodies aggregating near cell surface. Blue arrows: membrane bound segments extending from the cell membrane. Pink arrows: bleb-like vesicles burgeoning from the bacterial surface.
Cosmetics 08 00086 g007
Figure 8. TEM images of Staphylococcus aureus treated with (A) H20, no treatment control, (B) maltol at 4500 ppm, (C) DDAC at 500 ppm, (D) blend of maltol and DDAC (95:5) at 5000 ppm. Green arrows: loss of intracellular material. Red line and arrows: over-folding of the membrane and loss of rod shape, replaced by irregular structure. Blue arrows: intracellular material leakage observed as a membrane bound segments extending from the cell membrane. Pink arrows: bleb-like vesicles burgeoning from the bacterial surface. Yellow arrows: mesosome-like structures. Abbreviations: C: cytoplasm, CM: cell membrane, CW: cell wall.
Cosmetics 08 00086 g008
Figure 9. TEM images of Candida albicans treated with (A) H20, no treatment control, (B) maltol at 4500 ppm, (C) DDAC at 500 ppm, (D) blend of maltol and DDAC (95:5) at 5000 ppm. Red arrows: alteration of the cell wall structure, receding of cell membrane and thickening of cell wall. Green arrow: lysis of intracellular material. Black arrows: holes in the cell membrane. Abbreviations: C: cytoplasm, N: nucleus.
Cosmetics 08 00086 g009
Figure 10. TEM images of Aspergillus brasiliensis treated with (A) H20, no treatment control. (B) Maltol at 4500 ppm, (C) DDAC at 500 ppm, (D) blend of maltol and DDAC (95:5) at 5000 ppm. Red arrows: alteration of the cell wall structure, receding of cell membrane and thickening of cell wall. Green arrow: lysis of intracellular material. Black arrow: holes in the cell membrane. N: nucleus, V: vacuoles.
Cosmetics 08 00086 g010
Figure 11. Scanning electron microscopy (SEM) images of Candida albicans treated with (A) H20, no-treatment control, (B) maltol at 10,000 ppm, (C) DDAC at 1000 ppm; and Aspergillus brasiliensis treated with (D) H20, no-treatment control, (E) maltol at 10,000 ppm, and (F) DDAC at 500 ppm.
Cosmetics 08 00086 g011
Figure 12. TEM images analysis of (A) Pseudomonas aeruginosa treated with H20, no treatment control, maltol at 4500 ppm, DDAC at 500 ppm and a blend of maltol and DDAC (95:5) at 5000 ppm. (B) Analysis of Staphylococcus aureus TEM images treated with H20, no treatment control, maltol at 4500 ppm, DDAC at 500 ppm and a blend of maltol and DDAC (95:5) at 5000 ppm. Turquoise indicating normal cells, Yellow indicating cells with cytoplasm islands, Dark gray indicating membrane damage, and purple indicating loss of cell shape. (C) Cell cycle analysis of S. aureus treated with H20, no treatment control, maltol at 4500 ppm, DDAC at 500 ppm and a blend of maltol and DDAC (95:5) at 5000 ppm. Dark gray indicating normal cells, purple indicating equal division and red indicating unequal cell division. (D) Visual example of the treated cells. 150–200 cells were counted manually based on three fields of view, while results are presented as the percentage of cells with the observed morphology.
Cosmetics 08 00086 g012
Table 1. MIC100 values of the individual compounds maltol, DDAC, and P-80, and the combined blends of maltol with either cationic surfactant against E. coli, S. aureus, P. aeruginosa, C. albicans, and A. brasiliensis. MIC values were adopted from checkerboard assays (see Figure 2 and Figure 3) for FICI calculation.
Separate MIC100 (ppm)Combined MIC100 (ppm)Combined MIC100 (ppm)
MaltolDDACP80MaltolDDACMaltolP80
E. coli40003.122502500.7850031.25
FICI = 0.31FICI = 0.25
S. aureus40000.57.862.50.252504
FICI = 0.52FICI = 0.58
P. aeruginosa100012.5100062.56.2525062.5
FICI = 0.56FICI = 0.31
C. albicans20003.125005000.7812562.5
FICI = 0.5FICI = 0.19
A. brasiliensis40006.255005001.56500125
FICI = 0.38FICI = 0.38
Publisher’s Note: MDPI stays neutral with regard to jurisdictional claims in published maps and institutional affiliations.

