Communication

Inhibitory Effects of the Bioactive Thermorubin Isolated from the Fungus Thermoactinomyces Antibioticus on Melanogenesis

by
Shilpi Goenka
1,* and
Sanford R. Simon
1,2,3
1
Department of Biomedical Engineering, Stony Brook University, Stony Brook, NY 11794-5281, USA
2
Department of Biochemistry and Cellular Biology, Stony Brook University, Stony Brook, NY 11794-5281, USA
3
Department of Pathology, Stony Brook University, Stony Brook, NY 11794-5281, USA
*
Author to whom correspondence should be addressed.
Cosmetics 2020, 7(3), 61; https://doi.org/10.3390/cosmetics7030061
Submission received: 10 July 2020 / Revised: 24 July 2020 / Accepted: 27 July 2020 / Published: 30 July 2020
(This article belongs to the Special Issue Feature Papers in Cosmetics in 2020)

Abstract

:
Skin hyperpigmentation disorders arise due to aberrant regulation of melanin synthesis and export. Current treatments include natural compounds like kojic acid and hydroquinone, which suffer from limitations due to adverse reactions. Thermorubin (TR) is a secondary metabolite derived from the fungus Thermoactinomyces antibioticus and has previously demonstrated to possess anti-inflammatory properties by inhibition of matrix metalloproteinases (MMPs), as well as antimicrobial activity. In the current study, we explored whether TR might be a used as a candidate for the treatment of skin hyperpigmentation disorders by studying its effects on melanin synthesis and melanin export in B16F10 mouse melanoma cells and primary human melanocytes derived from darkly-pigmented (DP) skin. Non-toxic doses of TR were first identified in B16F10 mouse melanoma cells. These doses were subsequently tested for their effects on both extracellular and intracellular melanin levels under conditions of basal and hormone-stimulated melanogenesis. Our results demonstrated that TR at 25 µM inhibited total melanin levels with selective inhibition of extracellular melanin in B16F10 cells under both basal and hormone-stimulated conditions. The mechanisms of inhibition did not include tyrosinase inhibition, either in cellular lysates or cell-free system. However, TR potently inhibited activity of α-glucosidase enzyme in vitro and exhibited antioxidant activity. Furthermore, our results with primary human melanocytes from DP skin showed that TR at 10 µM significantly suppressed dendricity along with an increase in accumulation of intracellular melanin. These findings point to a mechanism of action of TR as an exclusive inhibitor of melanosome export. Taken together, our preliminary results demonstrate that TR might offer a novel ingredient as a skin depigmenting agent for inclusion in cosmetic formulations. Further studies delineating molecular mechanisms of hypopigmentation of TR and testing in human skin tissue-equivalents are warranted.

1. Introduction

Melanin pigment is synthesized by melanocytes in specialized organelles called melanosomes which are secreted and exported to keratinocytes via various pathways [1]. UV irradiation leads to the secretion of α-melanocyte stimulating hormone (α-MSH), a melanocortin based endogenous peptide, which increases melanin production in melanosomes [2]. UV-B radiation causes oxidative stress and upregulation of matrix metalloproteinases (MMPs) which contribute to skin photoaging [3]. Hyperpigmentation is caused by the overproduction of melanin in skin tissue and is associated with skin disorders [4] such as melasma, café au lait macules, lichen planus pigmentosus and post-inflammatory hyperpigmentation (PIH) [5], which affect the quality of life and also might be a risk factor for skin cancer melanoma. Compounds which can control hyperpigmentation disorders are attractive candidates for their use in clinical dermatology, as well as in personal-care cosmetic products for correction of uneven pigmentation. Mammalian tyrosinase is a copper-containing membrane-bound glycoprotein which catalyzes the hydroxylation of amino acid L-tyrosine to L-dihydroxyphenylalanine (L-DOPA) and the subsequent oxidation of DOPA to Dopaquinone [6]. This is considered the rate-limiting step in the melanogenesis pathway as subsequent steps proceed spontaneously at physiological pH values after these initial reactions. Hence, tyrosinase inhibition has remained a common strategy for identification of novel skin-brighteners [7,8]. For example, kojic acid (KA), a natural compound produced by several species of fungi, is a tyrosinase inhibitor and has been used commercially as a skin-brightener. The current market for skin-whitening agents is also dominated by other low molecular weight synthetic or semi-synthetic tyrosinase inhibitors, such as hydroquinone, arbutin, and phenylthiourea. However, all these agents have been shown to have undesirable side effects. KA has shown to cause contact dermatitis [9] and carcinogenicity [10], while hydroquinone exerts genotoxicity [11]. Since tyrosinase is glycosylated and translocated to the endoplasmic reticulum, inhibiting it’s glycosylation by inhibitors of α-glucosidase enzyme is also a novel strategy to inhibit melanogenesis [12,13].
The deposition of melanin in the skin involves multiple steps, including polymerization within the melanocyte and export of melanin in the form of melanosomes from melanocytes into keratinocytes via dendrites [14]. These steps have been considered as potential targets for skin depigmenting agents in addition to tyrosinase and α-glucosidase inhibitors [15]. In the epidermis, a single melanocyte is known to interact with ~30–40 keratinocytes in its proximity via these dendrites [16,17], which are cytoplasmic projections similar to a neurite in neurons. Notably, multiple reports have now appreciated the significant role of dendrites in regulating melanogenesis through the control of melanosome export via suppression of dendricity [18,19] or stimulation of dendricity [20,21].
Thermorubin (TR), is a natural compound isolated from culture broth of the fungus Thermoactinomyces antibioticus and was originally developed as an antimicrobial agent by Gruppo Lepetit, Italy and patented in the US in 1967 [22] with a broad-spectrum efficacy against Gram-positive and Gram-negative bacterial strains [23]. The method of isolation of TR from Thermoactinomyces antibioticus is based on the method reported by Craveri et al. previously [23]. Briefly, the method involves the use of a medium broth containing soya meal, crude maltose, peptone etc., which is shaken in flasks, incubated at 50 °C, adjusted to an optimum pH (7.7) and extracted from chloroform solvent to yield orange-red crystals of TR. The fermentation method outlined in the patent by Lepetit provides a range of extraction yield for different fermentation conditions, and typically, extraction yields of 59.5% or 78% can be obtained [23]. Another report has also documented antimicrobial activities of synthetically prepared derivatives of TR [24]. TR is an anthracenopyranone antimicrobial [25,26], which bears some structural similarity to tetracycline but binds to distinct sites on ribosomal units [27]. Besides its use as an antimicrobial compound, TR has been shown to have efficacy as a therapeutic for diabetes by inhibition of aldose reductase enzyme in a previous study [28]. Moreover, TR has also demonstrated inhibitory activities towards members of two classes of human proteolytic enzymes, the serine protease neutrophil elastase and zinc metalloproteases in the matrix metalloproteinase (MMP) family of zinc metalloproteases in our laboratory [29]. Even though there has been a scarcity of biological studies on TR to date, there have been no reported side-effects of this compound [30]. In the present study, we thus explored if TR could be used for treatment of hyperpigmentation skin disorders. We studied the effects of TR on melanin synthesis and melanin export in B16F10 mouse melanoma cells, which is a robust model widely used for screening anti-melanogenic compounds, and we further validated our results using normal human melanocytes (neonatal darkly-pigmented).Our results highlight the potential use of TR for inhibition of skin hyperpigmentation.

2. Materials and Methods

2.1. Materials

TR was originally isolated from Thermoactinomyces antibioticus based on the method reported previously by Craveri et al. [23]. TR was obtained through Dr. Francis Johnson (Department of Chemistry, Stony Brook). Kojic acid (KA), L-ascorbic acid (AA), alpha-glucosidase enzyme (Baker’s yeast), 4-Nitrophenyl α-d-glucopyranoside substrate (pNG), mushroom tyrosinase enzyme (T3824), L-DOPA (3,4-Dihydroxy-l-phenylalanine), Pyrocatechol violet (PV) and copper sulfate were purchased from Sigma-Aldrich (St. Louis, MO, USA). Sodium phosphate monobasic (monohydrate, ACS Reagent; JT Baker, NJ, USA), TrypLE™ Express (1X), and Phosphate buffer saline (PBS) were procured from Gibco (Thermo Fisher Scientific, MA, USA). 2′,7′-dichlorodihydrofluorescein diacetate (H2DCFDA) and 2,2-diphenyl-1-picrylhydrazyl (DPPH) reagents were procured from Molecular Probes (Eugene, OR, USA).

2.2. Cell Culture

B16F10 mouse melanoma cells were procured from the American Type Culture Collection (ATCC, Manassas, VA, USA) and cultured using Dulbecco’s modified Eagle’s Medium (DMEM) supplemented with 10% heat-inactivated fetal bovine serum (HI-FBS) and 1% penicillin-streptomycin. Primary human epidermal melanocytes isolated from darkly-pigmented neonatal donor (HEM-DP) were purchased from Cascade Biologics (Portland, Oregon, USA). These cells were cultured in Medium 254 (Cascade Biologics) supplemented with 1% human melanocyte growth supplement (HMGS) and 1% antibiotics (penicillin-streptomycin). All cells were cultured at 37 °C in a humidified atmosphere of 95% air and 5% carbon dioxide.

2.3. MTS Cytotoxicity Assay in B16F10 Cells

We first tested different concentrations of TR using MTS cytotoxicity assay (Promega CellTiter Aqueous One). Briefly, B16F10 cells were seeded at 0.5 × 10⁴ cells/well in a 96-well plate for 24 h. After 24 h, the culture medium was aspirated, and TR was added at various concentrations (such that final DMSO concentration was 0.4% across all concentrations), while controls were treated with solvent control using 0.4% DMSO (dimethyl sulfoxide) and further incubated for 72 h. At the end of 72 h, the medium was aspirated and replaced by 100 μL of fresh medium. MTS (20 μL) was added and incubated for 40 min and absorbance read at 490 nm using a Versamax® microplate reader. Cell viability was calculated from the absorbance values relative to control groups and expressed in %.

2.4. Extracellular and Intracellular Melanin Quantitation in B16F10 Cells

B16F10 cells were seeded (5 × 10⁴ cells/well in 1.5 mL medium) in 12-well plates and cultured for 24 h. After 24 h, the culture medium was aspirated and fresh medium containing different concentrations of TR in the presence or absence of 100 nM α-MSH was added to cultures; KA (0.5 mM) was used as a positive control. The cultures were maintained for a period of 72 h. The concentration of α-MSH selected was based on previous report [31]. Following treatment, the extracellular melanin was estimated by measurement of the absorbance of culture supernatants at 475 nm using a microplate reader. The cells remaining in the wells were detached and pellets were washed in PBS. A volume of 250 μL of 1N NaOH was then added and heated to 70 °C for 30 min to solubilize melanin. The absorbance of intracellular melanin was read at 475 nm. Synthetic melanin (Sigma-Aldrich) was prepared at different concentrations (5–500 μg/mL) in 1N NaOH for making standard curve. The melanin contents for intracellular and extracellular were normalized to total protein content and expressed as μg/mg protein.

2.5. Cellular Tyrosinase Activity in B16F10 Cells

We quantitated the tyrosinase activity in lysates of B16F10 cells to study the mechanisms of inhibition of melanogenesis. Briefly, B16F10 cells were cultured in 24-well plates at a density of 2 × 10⁴ cells/well. After 24 h, the medium was replaced with compound TR in the presence or absence of α-MSH (100 nM), and further incubated for 72 h. At the end of treatments, cells were detached, and cell pellets were washed in PBS and lysed in a buffer containing 1% NP-40 (2X Cell Lysis Buffer, Signosis Inc., Santa Clara, CA, USA). Next, the lysates were clarified by centrifugation and 50 µL of lysates were then aliquoted in a 96-well microplate and 100 µL of 3 mM solution of L-DOPA substrate solution was added. The absorbance was measured at 475 nm using the kinetic mode every 30 s for 40 min at 30 °C using a microplate reader. The % tyrosinase activity was calculated from the slope of the linear range of the velocities of inhibition.

2.6. Mushroom Tyrosinase Activity

The direct effects of TR on tyrosinase enzyme activity were tested using mushroom tyrosinase enzyme source with L-DOPA diphenolase substrate. Briefly, 80 µL of TR prepared at different concentrations in 50 mM sodium phosphate (pH 6.5) buffer was added to 96-wells followed by 100 µL of freshly prepared substrate solution (6 mM L-DOPA in phosphate-buffered saline) and the reaction was started by adding 20 µL of enzyme (final concentration of enzyme in wells was 3.5 µg/mL). The production of Dopachrome was monitored by measuring the kinetics of absorbance at 475 nm (for 30 min every 30 s). The slopes of the kinetic readings were calculated to determine and compare tyrosinase activity from control. For assaying the monophenolase activity, 100 µL of 0.5 mM L-Tyrosine substrate solution was added to TR samples followed by addition of 20 µL of enzyme (final concentration 12.5 µg/mL). The reaction was monitored by measuring kinetics of absorbance at 475 nm (for 20 min every 30 s) and slopes of the readings were calculated similar to method above.

2.7. Copper Chelating Activity

Copper-ion chelation activity was assayed by a pyrocatechol violet (PV) indicator assay based on method reported in our earlier work [32]. Briefly, solutions of TR were prepared at different concentrations in 0.05 M sodium acetate buffer (pH 6.0) and 100 μL was aliquoted in a 96-well plate. 10 μL of copper sulfate (2 mM) was added to the samples and incubated for 10 min followed by addition of 10 μL of 2 mM PV solution and further incubated for 20 min. Kojic Acid (KA; 500 µM) was used as a positive control and the control group consisted of buffer only. The absorbance was read at 632 nm using a microplate reader and copper chelating activity was reported as % relative to control.

2.8. DPPH Radical Scavenging Assay

The antioxidant activity of TR was measured using DPPH (2,2-Diphenyl-1-picrylhydrazyl) radical-scavenging assay. DPPH is a stable free radical and upon electron donation by antioxidant compounds, undergoes a color change from purple to yellow, which can be measured spectrophotometrically. 20 µL of TR prepared at different concentrations in methanol was combined with 180 µL of freshly prepared DPPH solution in a 96-well plate, with the final DPPH concentration in each well as 125 μM. Ascorbic Acid (AA) at 2.5 µg/mL was used as a positive control. The samples were covered and incubated for 30 min after which the absorbance was read at 517 nm; the DPPH scavenging activity was reported as % relative to control.

2.9. Cellular Reactive Oxygen Species (ROS) Estimation in B16F10 Cells

ROS generation was measured using the non-fluorescent probe 2′,7′-dichlorodihydrofluorescein diacetate (H2DCFDA) which is cleaved by cellular esterases after reaction with ROS to generate highly fluorescent 2′,7′-Dichlorofluorescein (DCF). Briefly, B16F10 cells were cultured in 24-well plates for 24 h, followed by treatment with TR in the presence or absence of α-MSH and cultures maintained for another 72 h. Following treatment, the cells were washed with Hank’s Buffered Salt Saline (HBSS; Hyclone™) and incubated with 50 µM DCFH-DA dye solution diluted in DMEM medium (serum-free, phenol-red free, and sodium pyruvate free) and further incubated for 45 min at 37 °C. The cells were washed with HBSS and fluorescence was read using a fluorescence microplate reader (Gemini EM Spectramax, Molecular Devices) at excitation/emission wavelengths of 485/535 nm using the well-scan mode (5–21 points/well). The relative fluorescence values of samples were expressed as % of the control samples.

2.10. α-Glucosidase Activity in Cellular Lysates and in Cell-Free System

The activity of α-glucosidase enzyme regulates tyrosinase enzyme maturation [6]. Hence, we next tested for effects of TR on the intracellular α-glucosidase enzyme activity. Briefly, B16F10 cells (1.2 × 10⁵ cells/well) were cultured in six-well plates for 24 h and then treated with TR in the presence or absence of α-MSH for a period of 72 h, after which the cells were harvested and lysed. The cellular lysates were centrifuged, aliquoted in a 96-well plate and combined with p-nitrophenyl-α-d-glucopyranoside (pNG) substrate; the rate of the formation of p-nitrophenol was monitored at 405 nm in the kinetic mode for 45 min at 37 °C using a microplate reader. The intracellular α-glucosidase activity was calculated from linear slopes and normalized to total protein content and reported as % of control.
The effects of compounds on α-glucosidase were assayed based on the method described in our previous study [33]. Aliquots (80 µL) of TR prepared in 50 mM phosphate buffer (pH 6.5) were transferred to a 96-well microplate and 100 µL of 1.2 mM pNG substrate solution was added. A volume of 20 µL of 0.45 units of enzyme (α-glucosidase, Baker’s yeast) solution prepared in 0.05 M buffer was added to start the reaction and the rate of the formation of p-nitrophenol was monitored at 405 nm in kinetic mode for 15 min at 37 °C in microplate reader. The enzyme activity (%) was calculated as: (rate of sample reaction/rate of control reaction) × 100%.

2.11. Testing in Primary Human Melanocytes from Darkly Pigmented Skin (HEM-DP)

2.11.1. MTS Cytotoxicity Assay

We first tested different concentrations of TR using MTS cytotoxicity assay. Briefly, HEM-DP cells were seeded at 1 × 10⁴ cells/well in a 96-well plate for 24 h. The culture medium was then renewed with different concentrations of TR and cultures continued for 72 h. At the end of the incubation period, MTS assay was conducted similar to method reported earlier.

2.11.2. Melanin Content Measurement in HEM-DP Cells

HEM-DP cells (1.1 × 10⁵ cells/well) were seeded in 12-well plates and grown for 72 h. The compound TR was added to cultures and cultures maintained for another 72 h and controls were treated with 0.4% DMSO. Melanin assays were run based on method outlined earlier.

2.11.3. Cellular Tyrosinase Activity in HEM-DP Cells

HEM-DP cells were cultured for 24 h followed by treatment with TR for 72 h. At the end of treatment duration, the cultures were harvested, lysed and the tyrosinase activity was quantitated similar to the method adopted for B16F10 cells tyrosinase activity measurement.

2.11.4. Dendricity Quantitation in HEM-DP Cells

The effects of TR on melanosome export in HEM-DP cells were assayed by quantitation of dendricity which has been validated in previous studies [34,35,36,37,38,39]. To enable ease in distinguishing dendrite networks of each cell, we cultured them at a lower seeding density to avoid confluence and entangling of individual dendritic arbors. Briefly, DP cells were plated in 12-well plates (1 × 10⁴ cells/well) and after 48 h, TR was added, and cultures were maintained for another 72 h. At the end of treatments, the wells were imaged using a Nikon Labphot microscope equipped with a digital camera and computer-interfaced Nikon NIS Elements 5.0 imaging software package (Morrell Instrument Company, NY, USA). The dendrite morphology was analyzed using NIS Elements 5.0 program. The dendrite lengths were measured in microns from the center of each cell to the tip of the dendrite by manual tracing using the Polyline tool in the program. We calculated Total dendrite length (TDL) by adding the lengths of individual dendrites in each cell similar to previous methods [34,35]. The number of dendrites were manually counted in each cell from images and reported as % of control group. Lastly, we manually counted number of cells which had more than 3 dendrites and reported as % of total number of cells; this parameter is similar to that reported in previous studies [36,37,38].

2.12. Statistical Analysis

One-way analysis of variance (ANOVA) with Dunnett’s or Tukey’s post-hoc test was run for comparison of more than two groups while students unpaired t-test was used for comparison of two groups, using GraphPad Prism software (version 8.4.2, San Diego, CA, USA). The differences were considered statistically significant at p < 0.05. All data are reported as Mean ± SD.

3. Results

3.1. TR is Nontoxic to B16F10 Cells

Our results showed that TR (structure shown in Figure 1A) was nontoxic to B16F10 cells at the tested concentration range 5–25 µM over a 72 h period (Figure 1B); these concentrations were subsequently used to study the effects of TR on melanogenesis.

3.2. TR Reduces Total Melanin in B16F10 Cells under Hormone-Stimulated and Basal Conditions

Our results on quantitation of total melanin content (extracellular and intracellular) showed that while treatment with α-MSH significantly increased total melanin by 68.27% as compared to basal control (considered 100%); cotreatment with α-MSH and TR at the highest concentration of 25 µM showed a significant attenuation by 40.94% (Figure 2A). The positive control KA at 200 µM showed a 2.5-fold higher suppression of total melanin content as compared to TR.
In the case of basal melanogenesis, low concentrations of TR up to 10 µM did not cause any changes in total melanin levels but TR at 25 µM significantly suppressed total melanin levels by 20.35% which was significantly different from control group, as well as the lower concentration of 10 µM (Figure 2B). KA showed an inhibition of 63.73% (Figure 2B).
Altogether, our results demonstrate that TR at concentration of 25 µM exhibits a higher potency of inhibition of hormone-stimulated melanogenesis as compared to basal melanogenesis, whereas lower doses of TR (5 and 10 µM) are inactive at inhibition under both conditions. Moreover, the diminution of extracellular melanin was the major contributor in TR’s anti-melanogenic activity. α-d-glucopyranoside

3.3. TR Does Not Inhibit Intracellular Tyrosinase Activity

We next studied if the inhibitory effects of TR on melanogenesis could be related, at least in part, to inhibition of the intracellular tyrosinase activity. Our results showed that TR did not inhibit intracellular tyrosinase activity either under α-MSH stimulation (Figure 3A) or under basal conditions (Figure 3B).

3.4. TR Does Not Inhibit Mushroom Tyrosinase Activity

As TR did not inhibit intracellular tyrosinase activity, we next tested if TR may have a direct inhibitory effect on melanin formation catalyzed by mushroom tyrosinase at either the first step (monophenolase) or the second step (diphenolase) in a cell-free system. Our results showed that TR at the tested concentration range did not inhibit the monophenolase activity (Figure 4A) or the diphenolase activity (Figure 4B) of mushroom tyrosinase, indicating that TR is not a classical tyrosinase inhibitor.

3.5. TR Shows Copper Chelation

Tyrosinase enzyme contains a copper atom in its structure and compounds that chelate copper can inhibit tyrosinase activity and thus melanin formation [39]. Our results showed that while KA, a known tyrosinase inhibitor, effectively chelated 64.60%, TR showed a moderate but significant copper chelation of 17.79%, 19.17% and 24.35%, at concentrations of 5, 10, and 25 µM, respectively (Figure 4C).

3.6. TR Shows Antioxidant Activity by Scavenging DPPH Radical

TR showed DPPH radical scavenging activity with a significant reduction of 25.93% at 25 µM, (Figure 4D). In addition to its capacity to reduce melanin levels, TR scavenges the DPPH radical, demonstrating antioxidant activity.

3.7. TR Reduced Intracellular ROS Levels

Stimulation with α-MSH significantly augmented ROS levels by 42.10%, as compared to the untreated control, and co-treatment with TR, showed a significant suppression of ROS levels by 76.74% at the highest concentration of 25 µM (Figure 4E). In addition, the reduction by TR at 25 µM was significantly lower as compared to concentration of 10 µM (Figure 4E). Under basal conditions, TR significantly reduced ROS levels by 14.55%, 16.14% and 27.43% at concentrations 5, 10, and 25 µM, respectively (Figure 4F).
Altogether, these results indicate that TR exerts antioxidant activity by suppressing intracellular ROS levels in B16F10 cells under both basal and α-MSH stimulated conditions; this antioxidant activity of TR may be responsible, at least in part, for its inhibitory effect on melanogenesis.

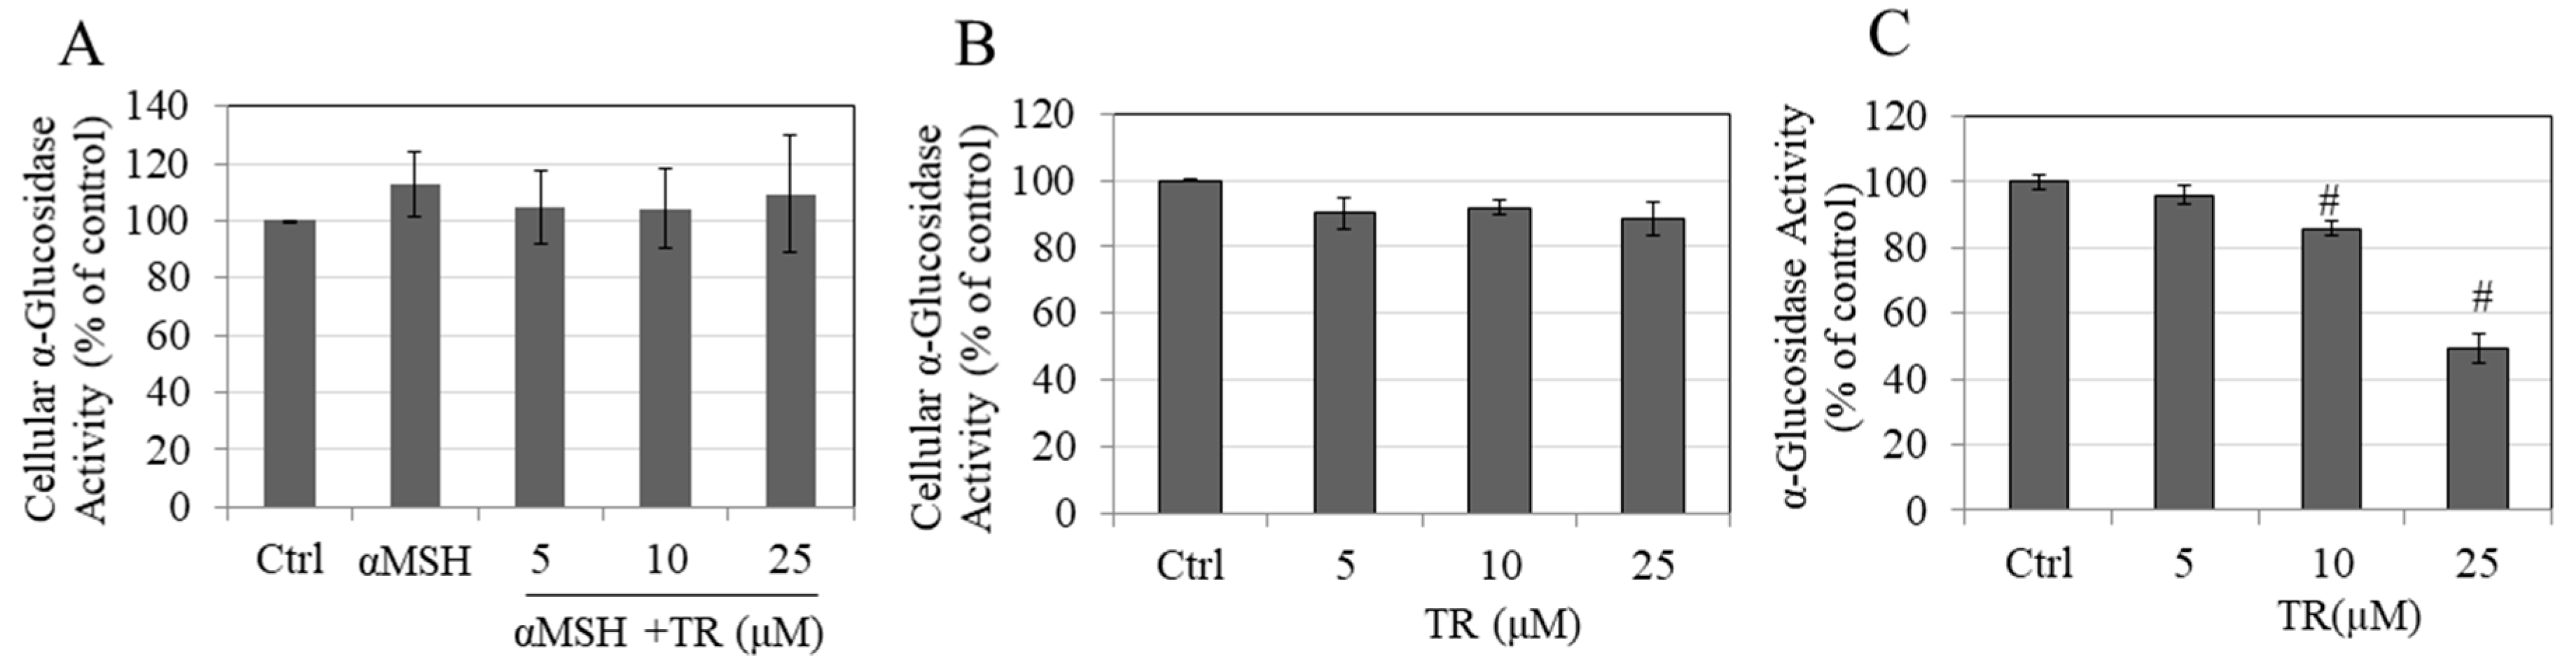
3.8. TR Does Not Inhibit Cellular α-Glucosidase Activity but Potently Inhibits Direct α-Glucosidase Activity

We next evaluated if the anti-melanogenic activity of TR could be explained, at least in part, by an effect on the α-glucosidase enzyme that regulates maturation of tyrosinase. Our results showed that TR did not affect the intracellular α-glucosidase activity under α-MSH stimulated conditions (Figure 5A) or basal conditions (Figure 5B). However, TR showed a potent inhibitory effect on the enzyme in a cell-free system where a significant reduction of 14.14% and 50.89% were obtained at TR concentrations of 10 µM and 25 µM, respectively (Figure 5C). The IC50 was calculated using non-linear regression analysis (GraphPad Prism) and found to be 24.56 µM. Altogether, these results demonstrate that TR directly inhibits the activity of α-glucosidase enzyme, which may contribute, at least in part, to its anti-melanogenic action.

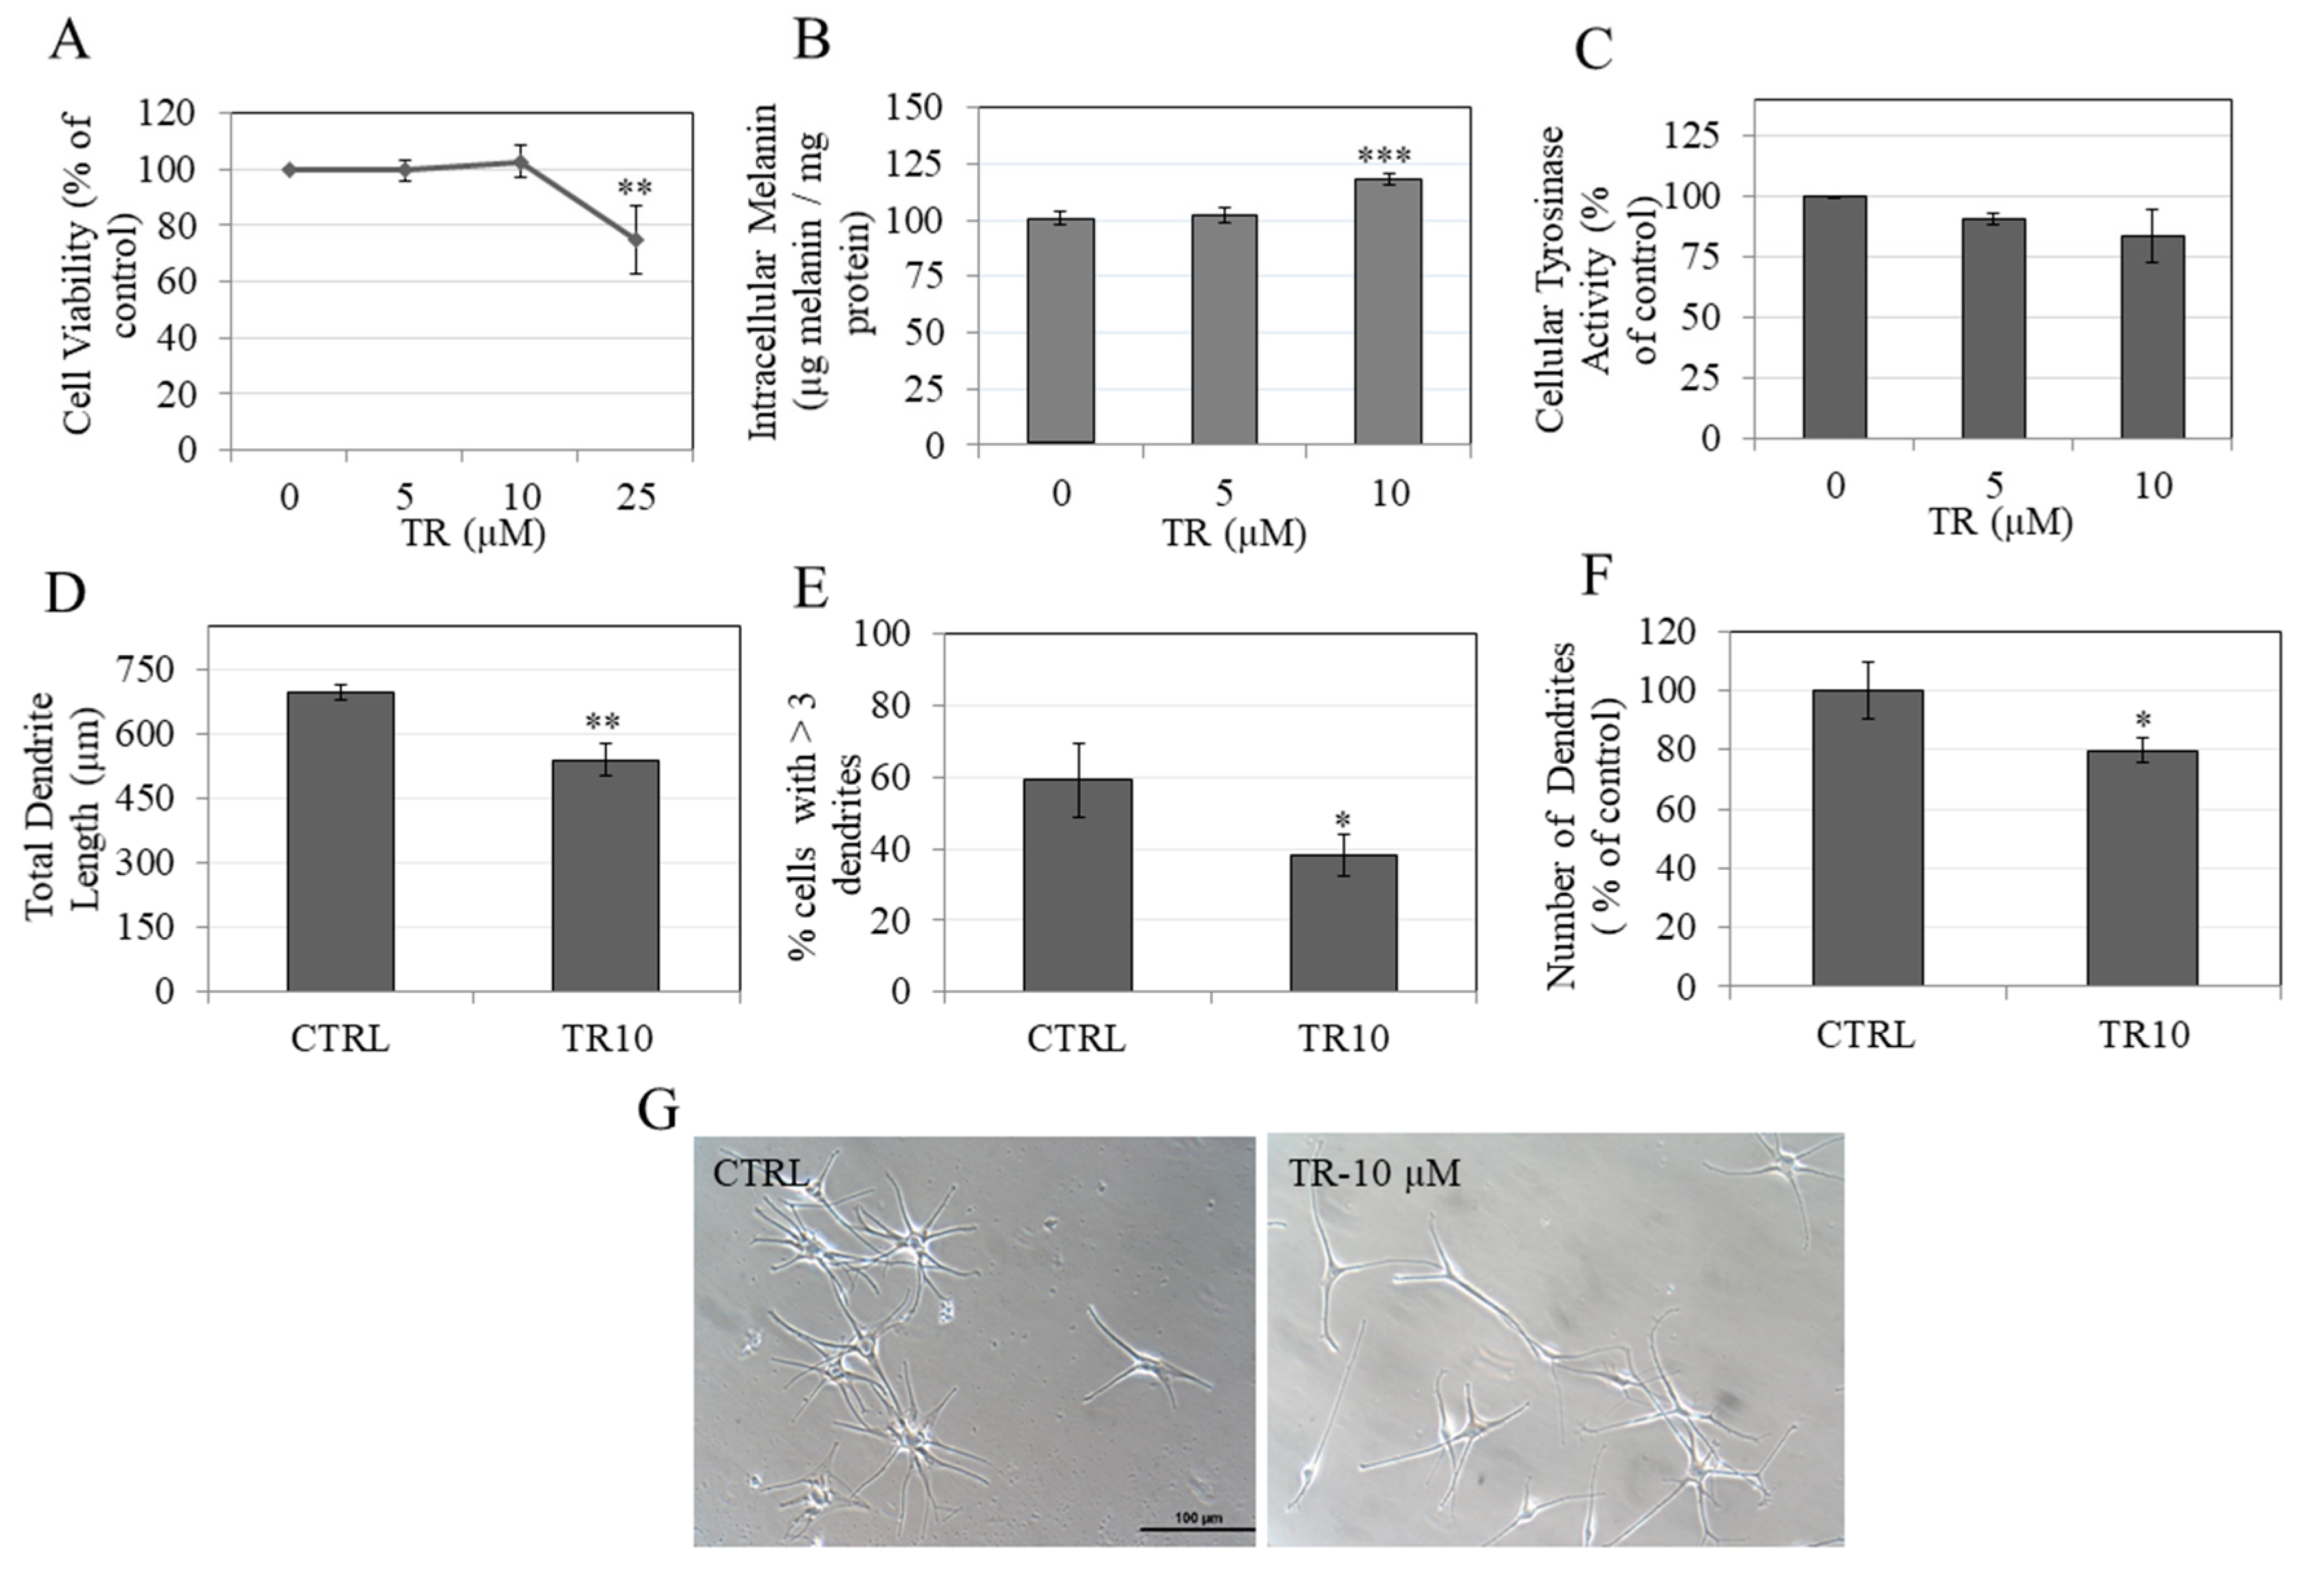
3.9. TR Enhanced Melanin Accumulation in Primary Human Melanocytes without Affecting Intracellular Tyrosinase Activity

Next, we tested whether the anti-melanogenic activity of TR could be validated in normal human melanocytes. To this end, we first screened TR for cytotoxicity to HEM-DP cells over the duration of 72 h. TR was nontoxic to human melanocytes at concentrations of 5 µM and 10 µM but showed significant toxicity at 25 µM with reduction of 25.16% in cell viability (Figure 6A). Hence, a concentration range of 5–10 µM was used to test effects on melanogenesis in subsequent experiments.
Our results showed that TR at 10 μM significantly increased intracellular melanin levels in HEM-DP cells by 18.21% with no effect at 5 µM (Figure 6B). Next, we quantitated the tyrosinase activity in HEM-DP cell lysates and found no change in the activity as compared to control (Figure 6C). These results demonstrate that TR increased melanin accumulation without affecting tyrosinase activity.

3.10. TR Inhibited Melanosome Export by Inhibiting Dendricity in Primary Human Melanocytes

We next studied if TR may inhibit melanosome export, which constitutes the subsequent steps after melanin synthesis. The mean value of total dendrite length in control group was 694.60 µm which was significantly diminished by treatment with TR (10 µM) to 537.87 µm (reduction of 22.57%) (Figure 6D). In addition, TR (10 μM) significantly reduced the % of cells with > 3 dendrites by 20.9% (Figure 6E) as well as the number of dendrites by 20.38% (Figure 6F).
Taken together, the results showed that in HEM-DP cells, TR inhibited dendricity, accompanied by increased intracellular melanin accumulation, which indicate that, overall, TR inhibits melanosome export.

4. Discussion

TR is characterized by the presence of a highly conjugated structure with multiple fused aromatic rings. The top of the ring system possesses keto groups, which can undergo keto-enol tautomerism, while the bottom part of the ring is largely hydrophobic. The enhanced enolization of TR imparts a partial electronegative character to it. Earlier work on TR’s anti-inflammatory activity highlighted its capacity to inhibit human neutrophil elastase activity in vitro with 50% inhibitory potency around 30 µM range [29], while it also inhibits the zinc-dependent MMPs. This latter activity suggests that TR may have the capacity to chelate metal. Since copper is chelated by some tyrosinase inhibitors, we were prompted to test the effects of TR on tyrosinase activity and melanogenesis. Our results showed that TR showed moderate copper chelation activity but did not inhibit tyrosinase activity, either in a cell-free or a cellular system. Notably, several studies have now documented the discrepancy of tyrosinase inhibition using tyrosinase obtained from mushrooms, which differs from human tyrosinase [40]. Due to the difficulty in obtaining purified human tyrosinase for cell-free assays, we employed tyrosinase purified from mushrooms (which is readily available and is routinely used for screening anti-tyrosinase compounds in vitro) and compared our results to those using human cell lysates. Our results of inactivity of TR at tyrosinase inhibition were consistent using tyrosinase from both sources. The structure of TR contains a xanthone moiety and interestingly, our results of inhibition of melanogenesis in the absence of inhibition of tyrosinase activity, but with potent α-glucosidase activity inhibition (IC50-25 µM), are align with the results of a study where the xanthone, mangostenone F, demonstrated anti-melanogenic efficacy without affecting tyrosinase enzyme activity, but potently inhibiting α-glucosidase enzyme with an IC50 of 21 µM [41]. In this study, the authors did not report effects on extracellular melanin or on melanin export. We compared the total melanin in B16F10 cells in our analysis in present study, which clearly showed that the major contributions of anti-melanogenic activity of TR came from the diminution of extracellular melanin, even though the intracellular melanin in cells treated with TR (25 µM) were somewhat higher (30% higher as compared to control group intracellular melanin amount) under basal conditions, with no change under hormone-stimulated conditions. It should be emphasized that B16F10 cells secrete several-folds higher levels of melanin, compared with levels of melanin remaining within the cell, and thus, testing for effects on extracellular melanin is critical to accurately screen melanogenesis inhibitors. Our results demonstrate a novel finding of inhibition of melanogenesis by TR via a selective inhibition of melanosome export in the absence of effects on melanin biosynthesis in B16F10 cells. Microphthalmia Transcription Factor (MITF) is a key melanogenesis protein which regulates melanosome export [42]. Hence, we assayed for MITF expression in B16F10 mouse cells to test whether downregulation of MITF might explain, at least in part, the diminution of extracellular melanin levels by TR. Our results showed no significant change in MITF levels in cells treated with TR (25 µM) under both basal and α-MSH conditions (Figure S1).
Primary human melanocytes are relatively unaffected by α-MSH stimulation [43]; hence we tested TR in HEM-DP cells under basal melanogenesis conditions only. Moreover, we did not measure the extracellular melanin in supernatants of cultures of HEM-DP cells as they do not secrete significant levels of melanin in the medium unlike B16F10 cells, and often the measurement of extracellular melanin is confounded by cytotoxicity. Hence, we assayed for inhibition of melanin transport by quantitating dendricity, which is a well-established method to study melanosome export in human melanocytes. Our results showed that in HEM-DP cells, TR significantly suppressed dendricity with an accumulation of intracellular melanin. A similar observation has been noted in several earlier studies [44,45,46]. For instance, an organogermanium compound, 3-(trihydroxygermyl)propanoic acid, reduced extracellular melanin in B164F cells and increased intracellular melanin without affecting tyrosinase activity [46]. Other studies reported that the compound ugonin suppressed extracellular melanin levels in the presence of increased intracellular melanin in B16F10 cells [45] and another compound ginsenoside F1 (GF1) inhibited melanosome export in the presence of an increased intracellular melanin in MNT-1 human melanoma cells [44]. The possibility that the inhibition of melanosome export leads to an activation of a feedback loop in cells, which in turn, causes cells to retain a higher amount of melanin pigment inside their compartment cannot be ruled out and might explain the increase in intracellular melanin obtained by TR. Since melanocytes make contact with up to 30–40 keratinocytes [16], we tested TR for cytotoxicity to human keratinocytes (HaCaT) to validate the safety of topical use and found that TR was nontoxic to keratinocytes over a period of 72 h (Figure S2). Understanding the efficacy of TR, in its capacity to retain its inhibitory effects on melanosome export in melanocyte-keratinocyte cocultures, was beyond the scope of the present pilot study and was not assessed. Moreover, further studies are warranted to elucidate the molecular mechanisms of downregulation of melanosome export.
TR is a thermophylic Actinomyces product which can be isolated by fermentation in a convenient and inexpensive manner for large-scale commercial production. The freeze-dried fungal strain which produces TR is commercially available through American Type Culture Collection (ATCC® 14570™) with strain designation TA/124 deposited as Thermoactinomyces antibioticus Craveri et al. However, a limitation of TR as a formulation for topical use is primarily due to its aqueous insolubility, which is similar to the challenges encountered by the tetracyclines class of compounds. An approach to overcome these limitations might incorporate chemical modification of TR to improve the solubility or use of delivery systems, such as liposomes for encapsulation of these hydrophobic molecules.

5. Conclusions

In summary, our results demonstrate a proof-of-principle for the fungal metabolite compound TR for use in treatment of skin hyperpigmentation disorders. Our results confirmed that TR inhibited melanogenesis by selectively targeting the step of melanosome export in the melanogenesis pathway, which was validated in B16F10 cells (by reduction of extracellular melanin) as well as in primary human melanocytes (by reduction of dendricity). The mechanisms of melanogenesis inhibition by TR did not include tyrosinase inhibition, either in cellular lysates or cell-free system. However, TR potently inhibited activity of α-glucosidase enzyme in vitro and exhibited antioxidant activity. Future studies to elucidate molecular mechanisms of TR’s anti-melanogenic activity and testing in skin tissue equivalents are warranted. In addition, since TR has not been widely used in humans, further studies to confirm its efficacy and safety for topical use in humans are warranted.

Supplementary Materials

The following are available online at https://www.mdpi.com/2079-9284/7/3/61/s1, Figure S1. MITF protein levels in B16F10 cells treated with TR (25 µM) under (A) Basal and (B) α-MSH-stimulated conditions. Figure S2. Viability of HaCaT cells treated with TR (5–25 µM) for 72 h.

Author Contributions

S.G. conceptualized, designed, and performed the experiments and wrote the manuscript. S.R.S. arranged funding. All authors have read and agreed to the published version of the manuscript.

Funding

This research received no external funding.

Acknowledgments

We would like to acknowledge Francis Johnson (Department of Chemistry, Stony Brook University) for pioneering work on TR and graciously providing TR samples for the current research.

Conflicts of Interest

The authors declare no conflict of interest. The funding sources had no role in the design of the study; in the collection, analyses, or interpretation of data; in the writing of the manuscript, or in the decision to publish the results. S.G. and S.R.S. had filed a new technology disclosure with the Research Foundation of Stony Brook University on this work.

References

  1. Ando, H.; Niki, Y.; Ito, M.; Akiyama, K.; Matsui, M.S.; Yarosh, D.B.; Ichihashi, M. Melanosomes are transferred from melanocytes to keratinocytes through the processes of packaging, release, uptake, and dispersion. J. Investig. Dermatol. 2012, 132, 1222–1229. [Google Scholar] [CrossRef] [PubMed] [Green Version]
  2. Song, X.; Mosby, N.; Yang, J.; Xu, A.; Abdel-Malek, Z.; Kadekaro, A.L. Alpha-MSH activates immediate defense responses to UV-induced oxidative stress in human melanocytes. Pigment Cell Melanoma Res. 2009, 22, 809–818. [Google Scholar] [CrossRef] [PubMed]
  3. Pittayapruek, P.; Meephansan, J.; Prapapan, O.; Komine, M.; Ohtsuki, M. Role of matrix metalloproteinases in photoaging and photocarcinogenesis. Int. J. Mol. Sci. 2016, 17, 868. [Google Scholar] [CrossRef] [PubMed] [Green Version]
  4. Malviya, N.; Pandya, A. Disorders of Hyperpigmentation. In Dermatoanthropology of Ethnic Skin and Hair; Springer: Berlin/Heidelberg, Germany, 2017; pp. 197–214. [Google Scholar]
  5. Silpa-Archa, N.; Kohli, I.; Chaowattanapanit, S.; Lim, H.W.; Hamzavi, I. Postinflammatory hyperpigmentation: A comprehensive overview: Epidemiology, pathogenesis, clinical presentation, and noninvasive assessment technique. J. Am. Acad. Dermatol. 2017, 77, 591–605. [Google Scholar] [CrossRef] [PubMed]
  6. Wang, N.; Hebert, D.N. Tyrosinase maturation through the mammalian secretory pathway: Bringing color to life. Pigment Cell Res. 2006, 19, 3–18. [Google Scholar] [CrossRef]
  7. Smit, N.; Vicanova, J.; Pavel, S. The hunt for natural skin whitening agents. Int. J. Mol. Sci. 2009, 10, 5326–5349. [Google Scholar] [CrossRef]
  8. Chang, T.-S. Natural melanogenesis inhibitors acting through the down-regulation of tyrosinase activity. Materials 2012, 5, 1661–1685. [Google Scholar] [CrossRef] [Green Version]
  9. Mata, T.L.; Sanchez, J.P.; de la Cuadra Oyanguren, J. Allergic contact dermatitis due to kojic acid. Dermatitis 2005, 16, 89. [Google Scholar]
  10. Hirose, M.; Imai, T.; Mitsumori, K. Carcinogenicity of kojic acid in rodents. JSM Mycotoxins 2004, 2003, 59–67. [Google Scholar] [CrossRef] [Green Version]
  11. Luo, L.; Jiang, L.; Geng, C.; Cao, J.; Zhong, L. Hydroquinone-induced genotoxicity and oxidative DNA damage in HepG2 cells. Chem. Biol. Interact. 2008, 173, 1–8. [Google Scholar] [CrossRef]
  12. Ando, H.; Kondoh, H.; Ichihashi, M.; Hearing, V.J. Approaches to identify inhibitors of melanin biosynthesis via the quality control of tyrosinase. J. Investig. Dermatol. 2007, 127, 751–761. [Google Scholar] [CrossRef] [PubMed] [Green Version]
  13. Choi, H.; Ahn, S.; Chang, H.; Cho, N.S.; Joo, K.; Lee, B.G.; Chang, I.; Hwang, J.S. Influence of N-glycan processing disruption on tyrosinase and melanin synthesis in HM3KO melanoma cells. Exp. Dermatol. 2007, 16, 110–117. [Google Scholar] [CrossRef] [PubMed]
  14. Wu, X.; Hammer, J.A. Melanosome transfer: It is best to give and receive. Curr. Opin. Cell Biol. 2014, 29, 1–7. [Google Scholar] [CrossRef] [PubMed] [Green Version]
  15. John, S.; Lorenz, P.; Petersen, R.; Heldermann, M.; Borchert, S. Skin-lightening agent with different pathways of action on melanogenesis. Sofw. J. 2005, 131, 40. [Google Scholar]
  16. Fitzpatrick, T.B.; Breathnach, A.S. The epidermal melanin unit system. Dermatol. Wochenschr. 1963, 147, 481–489. [Google Scholar] [PubMed]
  17. Jimbow, K.; Quevedo, W.C., Jr.; Fitzpatrick, T.B.; Szabo, G. Some aspects of melanin biology: 1950–1975. J. Investig. Dermatol. 1976, 67, 72–89. [Google Scholar] [CrossRef] [Green Version]
  18. Lv, J.; Fu, Y.; Cao, Y.; Jiang, S.; Yang, Y.; Song, G.; Yun, C.; Gao, R. Isoliquiritigenin inhibits melanogenesis, melanocyte dendricity and melanosome transport by regulating ERK-mediated MITF degradation. Exp. Dermatol. 2020, 29, 149–157. [Google Scholar] [CrossRef] [Green Version]
  19. Regnier, M.; Tremblaye, C.; Schmidt, R. Vitamin C affects melanocyte dendricity via keratinocytes. Pigment Cell Res. 2005, 18, 389–390. [Google Scholar] [CrossRef]
  20. Jeon, S.; Kim, N.H.; Koo, B.S.; Lee, H.J.; Lee, A.Y. Bee venom stimulates human melanocyte proliferation, melanogenesis, dendricity and migration. Exp. Mol. Med. 2007, 39, 603–613. [Google Scholar] [CrossRef] [Green Version]
  21. Lv, J.; Fu, Y.; Gao, R.; Li, J.; Kang, M.; Song, G.; Yun, C. Diazepam enhances melanogenesis, melanocyte dendricity and melanosome transport via the PBR/cAMP/PKA pathway. Int. J. Biochem. Cell Biol. 2019, 116, 105620. [Google Scholar] [CrossRef]
  22. Renato, C.; Carolina, C.; Piero, S. Antibiotic Thermorubin and Methods of Preparing the Same. US.. Patent 3,300,379A, 24 January 1967. [Google Scholar]
  23. Craveri, R.; Coronelli, C.; Pagani, H.; Sensi, P. Thermorubin, a New Antibiotic from a Thermoactinomycete. Clin. Med. 1964, 71, 511–521. [Google Scholar] [PubMed]
  24. Cavalleri, B.; Turconi, M.; Pallanza, R. Synthesis and antibacterial activity of some derivatives of the antibiotic thermorubin. J. Antibiot. 1985, 38, 1752–1760. [Google Scholar] [CrossRef] [PubMed]
  25. Johnson, F.; Chandra, B.; Iden, C.R.; Naiksatam, P.; Kahen, R.; Okaya, Y.; Lin, S.-Y. Thermorubin 1. Structure studies. J. Am. Chem. Soc. 1980, 102, 5580–5585. [Google Scholar] [CrossRef]
  26. Moppett, C.E.; Dix, D.T.; Johnson, F.; Coronelli, C. Structure of thermorubin A, the major orange-red antibiotic of Thermoactinomyces antibioticus. J. Am. Chem. Soc. 1972, 94, 3269–3272. [Google Scholar] [CrossRef] [PubMed]
  27. Bulkley, D.; Johnson, F.; Steitz, T.A. The antibiotic thermorubin inhibits protein synthesis by binding to inter-subunit bridge B2a of the ribosome. J. Mol. Biol. 2012, 416, 571–578. [Google Scholar] [CrossRef] [PubMed] [Green Version]
  28. Hayashi, K.; Dombou, M.; Sekiya, M.; Nakajima, H.; Fujita, T.; Nakayama, M. Thermorubin and 2-hydroxyphenyl acetic acid, aldose reductase inhibitors. J. Antibiot. 1995, 48, 1345–1346. [Google Scholar] [CrossRef]
  29. Said, R. Inhibitors of Serine Proteinases, Matrix Metalloproteinases and Histone Deacetylases: Thermorubin, COL-308, Myricetin, and Tellimagrandin; Stony Brook: New York, NY, USA, 2011; pp. 41–46. [Google Scholar]
  30. Arenz, S.; Wilson, D.N. Blast from the past: Reassessing forgotten translation inhibitors, antibiotic selectivity, and resistance mechanisms to aid drug development. Mol. Cell 2016, 61, 3–14. [Google Scholar] [CrossRef]
  31. Sim, M.-O.; Choi, I.-Y.; Cho, J.-H.; Shin, H.-M.; Cho, H.-W. Anti-melanogenesis and anti-oxidant of Salix pseudo-lasiogyne water extract in α-MSH-induced B16F10 melanoma cells. Food Agric. Immunol. 2017, 28, 1003–1016. [Google Scholar] [CrossRef]
  32. Goenka, S.; Ceccoli, J.; Simon, S.R. Anti-melanogenic activity of ellagitannin casuarictin in B16F10 mouse melanoma cells. Nat. Prod. Res. 2019, 27, 1–6. [Google Scholar] [CrossRef]
  33. Goenka, S.; Nagabhushanam, K.; Majeed, M.; Simon, S.R. Calebin-A, a curcuminoid analog inhibits α-MSH-induced melanogenesis in B16F10 mouse melanoma cells. Cosmetics 2019, 6, 51. [Google Scholar] [CrossRef] [Green Version]
  34. Chang, C.H.; Tsai, R.K.; Tsai, M.H.; Lin, Y.H.; Hirobe, T. The roles of Frizzled-3 and Wnt3a on melanocyte development: In vitro studies on neural crest cells and melanocyte precursor cell lines. J. Dermatol. Sci. 2014, 75, 100–108. [Google Scholar] [CrossRef]
  35. Ohbayashi, N.; Yatsu, A.; Tamura, K.; Fukuda, M. The Rab21-GEF activity of Varp, but not its Rab32/38 effector function, is required for dendrite formation in melanocytes. Mol. Biol. Cell 2012, 23, 669–678. [Google Scholar] [CrossRef]
  36. Jian, Q.; An, Q.; Zhu, D.; Hui, K.; Liu, Y.; Chi, S.; Li, C. MicroRNA 340 is involved in UVB-induced dendrite formation through the regulation of RhoA expression in melanocytes. Mol. Cell. Biol. 2014, 34, 3407–3420. [Google Scholar] [CrossRef] [Green Version]
  37. Kim, J.H.; Sohn, K.C.; Choi, T.Y.; Kim, M.Y.; Ando, H.; Choi, S.J.; Kim, S.; Lee, Y.H.; Lee, J.H.; Kim, C.D. β-Catenin regulates melanocyte dendricity through the modulation of PKCζ and PKCδ. Pigment Cell Melanoma Res. 2010, 23, 385–393. [Google Scholar] [CrossRef]
  38. Kim, M.Y.; Choi, T.-Y.; Kim, J.-H.; Lee, J.H.; Kim, J.G.; Sohn, K.-C.; Yoon, K.-S.; Kim, C.D.; Lee, J.-H.; Yoon, T.-J. MKK6 increases the melanocyte dendricity through the regulation of Rho family GTPases. J. Dermatol. Sci. 2010, 60, 114–119. [Google Scholar] [CrossRef] [PubMed]
  39. Chang, T.S. An updated review of tyrosinase inhibitors. Int. J. Mol. Sci. 2009, 10, 2440–2475. [Google Scholar] [CrossRef] [Green Version]
  40. Mann, T.; Gerwat, W.; Batzer, J.; Eggers, K.; Scherner, C.; Wenck, H.; Stab, F.; Hearing, V.J.; Rohm, K.H.; Kolbe, L. Inhibition of human tyrosinase requires molecular motifs distinctively different from mushroom tyrosinase. J. Investig. Dermatol. 2018, 138, 1601–1608. [Google Scholar] [CrossRef] [PubMed] [Green Version]
  41. Ryu, H.W.; Jeong, S.H.; Curtis-Long, M.J.; Jung, S.; Lee, J.W.; Woo, H.S.; Cho, J.K.; Park, K.H. Inhibition effects of mangosenone F from Garcinia mangostana on melanin formation in B16F10 cells. J. Agric. Food Chem. 2012, 60, 8372–8378. [Google Scholar] [CrossRef] [PubMed]
  42. Chiaverini, C.; Beuret, L.; Flori, E.; Busca, R.; Abbe, P.; Bille, K.; Bahadoran, P.; Ortonne, J.P.; Bertolotto, C.; Ballotti, R. Microphthalmia-associated transcription factor regulates RAB27A gene expression and controls melanosome transport. J. Biol. Chem. 2008, 283, 12635–12642. [Google Scholar] [CrossRef] [PubMed] [Green Version]
  43. Hunt, G.; Todd, C.; Thody, A.J. Unresponsiveness of human epidermal melanocytes to melanocyte-stimulating hormone and its association with red hair. Mol. Cell. Endocrinol. 1996, 116, 131–136. [Google Scholar] [CrossRef]
  44. Lee, C.-S.; Nam, G.; Bae, I.-H.; Park, J. Whitening efficacy of ginsenoside F1 through inhibition of melanin transfer in cocultured human melanocytes–keratinocytes and three-dimensional human skin equivalent. J. Ginseng Res. 2019, 43, 300. [Google Scholar] [CrossRef] [PubMed]
  45. Yamauchi, K.; Mitsunaga, T.; Itakura, Y.; Batubara, I. Extracellular melanogenesis inhibitory activity and the structure-activity relationships of ugonins from Helminthostachys zeylanica roots. Fitoterapia 2015, 104, 69–74. [Google Scholar] [CrossRef] [PubMed]
  46. Azumi, J.; Takeda, T.; Shimada, Y.; Aso, H.; Nakamura, T. The Organogermanium Compound THGP Suppresses Melanin Synthesis via Complex Formation with L-DOPA on Mushroom Tyrosinase and in B16 4A5 Melanoma Cells. Int. J. Mol. Sci. 2019, 20, 4785. [Google Scholar] [CrossRef] [PubMed] [Green Version]
Figure 1. (A) Chemical structure of TR; (B) B16F10 cell viability in the presence of different concentrations of TR for 72 h duration assessed by MTS assay; Data is Mean ± SD of three independent experiments.
Cosmetics 07 00061 g001
Figure 2. Total melanin levels (Intracellular and Extracellular) in cultures of B16F10 mouse melanoma cells maintained for 72 h in the presence of different concentrations of TR in (A) α-MSH-stimulated melanogenesis; ## p < 0.001 vs. Ctrl; letter a—p < 0.001 vs. α-MSH; # p < 0.01 vs. α-MSH; letter b—p < 0.001 vs. TR (10 µM) and; (B) Basal melanogenesis; KA was used as a positive control at 500 µM; ## p < 0.001 vs. Ctrl, * p < 0.05 vs. Ctrl; letter c—p < 0.001 vs. TR (10 µM); One-way ANOVA with Tukey’s test; The results reported are from at least two independent experiments; the Mean ± SD shown are from triplicate wells from a representative experiment; # p < 0.01 vs. α-MSH.
Cosmetics 07 00061 g002
Figure 3. Tyrosinase activity in cellular lysates of B16F10 cells in the presence of different concentrations of TR for 72 h under (A) α-MSH stimulated and (B) Basal conditions; Data is Mean ± SD of at least three independent experiments.
Cosmetics 07 00061 g003
Figure 4. Mushroom tyrosinase activity assay was conducted with different concentrations of TR (0–25 µM) using (A) L-TYR substrate; monophenolase activity and; (B) L-DOPA substrate; diphenolase activity; (C) Copper chelation activity measured by reduction in absorbance at 632 nm; (D) % DPPH radical scavenging assay with ascorbic acid (AA) at 2.5 µg/mL as a positive control; Intracellular ROS estimated in (E) α-MSH stimulated; and (F) basal conditions in B16F10 cells treated with different concentrations of TR; One-way ANOVA with Dunnett’s test; * p < 0.05; ** p < 0.01; *** p < 0.001; # p < 0.0001; letter a—p < 0.0001 vs. α-MSH +TR-10 µM; All Data are Mean ± SD of triplicate determinations.
Cosmetics 07 00061 g004
Figure 5. Intracellular α-glucosidase activity measured in B16F10 cells in (A) α-MSH stimulated and (B) Basal melanogenesis; Data are mean ± SD of at least two independent experiments; (C) α-glucosidase activity measured in a cell-free system; # p < 0.01 versus Ctrl, One-way ANOVA followed by Dunnett’s test; Data are mean ± SD of triplicate determinations.
Cosmetics 07 00061 g005
Figure 6. (A) Human Epidermal Melanocyte (HEM) cell viability in the presence of different concentrations of TR; ** p < 0.01; One-way ANOVA with Dunnett’s test; Data is mean ± SD of three independent experiments; (B) Intracellular melanin quantitation in HEM-DP cells treated with TR for 3 d; *** p < 0.001; One-way ANOVA with Dunnett’s test; Data is mean ± SD of a representative independent experiment in triplicates; (C) Cellular tyrosinase activity in HEM-DP cells; Data is mean ± SD of at least two independent experiments; Quantification of dendricity measured by (D) Total dendrite length; (E) % cells > 3 dendrites and; (F) number of dendrites as % of control in HEM-DP cells treated with TR for 3 d; Data are mean ± SD of triplicate determinations for (D)–(F); a total of up to 50 cells were counted from each group; * p < 0.05; ** p < 0.001; students unpaired t-test; (G) Representative phase-contrast micrograph showing HEM-DP cells in vehicle treated (DMSO) and TR-10 μM treated group.
Cosmetics 07 00061 g006

