Abstract
Background: Skin aging is influenced by intrinsic factors such as genetics and cellular decline, and extrinsic factors including UV exposure, pollution, and lifestyle. Cosmetic or over-the-counter retinoids, particularly retinal (retinaldehyde), have shown strong efficacy in reducing photoaging signs—such as fine lines, wrinkles, and pigmentation—while offering improved tolerability compared to prescription-based retinoids like all-trans retinoic acid. However, their instability in formulations and limited bioavailability when applied topically remain major challenges. Objective: This exploratory study aimed to assess the efficacy and safety of a novel mix-activated anhydrous 0.1% retinal concentrate formulated also with hydrophilic active ingredients—N-acetyl glucosamine, niacinamide, ascorbic acid, and alpha-glucan oligosaccharide—in improving signs of skin aging over six weeks. Methods: A prospective, single-center study was conducted with 27 healthy adults (24 female and 3 male, aged 40–69 years, 21 with skin phototype III and 6 with phototype II) exhibiting visible signs of photoaging. Participants applied the retinal concentrate once daily, mixed in a 1:2 ratio with a moisturizer before application. Objective skin parameters, including pigmentation, fine lines, wrinkles, texture, volume, and pore visibility, were assessed using the Antera 3D imaging system at baseline and after six weeks. A self-evaluation questionnaire was completed at week six. Statistical significance was determined using the Wilcoxon signed-rank test (p < 0.05) and was corrected for multiple analyses. Results: Significant improvements were observed across all parameters: pigmentation (−12%, p < 0.0001), fine lines (−14%, p < 0.0001), wrinkle depth (−5%, p = 0.0045), skin texture (+12%, p < 0.0001), volume irregularities (−15%, p < 0.0001), and pore visibility (−24%, p < 0.0001). No significant change in redness was detected (p = 0.6664), indicating a good tolerability to the test product. Self-assessments reflected high user satisfaction: 81% reported improved skin appearance, 43% noted reduced need for makeup use, and 40% observed visible improvements already within two weeks. Conclusions: The anhydrous 0.1% retinal concentrate with hydrophilic actives significantly improved clinical signs of photoaging without causing irritation. The innovative mix-activated formulation stabilizes sensitive ingredients and enhances their efficacy, offering a novel, active, and well-tolerated approach to anti-aging skincare.
1. Introduction
Skin aging is a complex biological process influenced by intrinsic factors, such as genetic predisposition and the natural decline of cellular functions, and extrinsic factors, including ultraviolet (UV) radiation, pollution, and lifestyle choices. Among these, UV-induced photoaging is considered the most significant contributor to skin deterioration due to the production of reactive oxygen species (ROS), which accelerate the degradation of functional skin components [1,2]. Senescent fibroblasts affect collagen degradation by the release of proinflammatory factors leading to increase in matrix metalloproteinases (MMPs), which then cause fine lines, wrinkles, and loss of firmness but also uneven pigmentation [3,4,5]. Also, uneven pigmentation is a prominent part of skin aging and arises when chronic photo-exposure disrupts the normal dialog between melanocytes and neighboring cells, causing hyperactivated pigment production and irregular pigment distribution that manifests as mottled age spots alongside lighter patches [6,7].
The Science and Efficacy of Retinoids in Skincare
Since ancient times, the desire to rejuvenate the skin has been a common pursuit, with various natural ingredients used to maintain a youthful appearance. Among modern advancements in skincare, retinoids stand out as one of the most scientifically proven groups of ingredients. Their use dates back to the 1950s when they were first introduced and later recognized for their powerful effects on skin renewal, sebum regulation, collagen production, and skin brightening [8,9].
Retinoids encompass a family of natural and synthetic compounds derived from vitamin A (retinol). The most biologically active form, all-trans retinoic acid (tretinoin), is naturally converted from retinol and its derivatives through enzymatic processes. The beneficial effects of retinoids on photodamaged skin were first observed by Kligman et al., who noted improvements in skin wrinkling and texture when treating acne patients with topical tretinoin [10,11,12]. Since then, retinoids have been shown to interact with specific cellular receptors, regulate cell turnover, stimulate keratinocyte proliferation, enhance collagen synthesis, and strengthen the epidermal barrier [13,14].
In addition to their role in anti-aging, retinoids impact sebocytes, reducing sebum production, and melanocytes, inhibiting tyrosinase activity to promote a more even skin tone. Tretinoin remains the most well-studied and effective retinoid, but it is available only in prescription formulations [15].
Among non-prescription retinoids, retinal (retinaldehyde) is considered the most effective [8,9].
Retinal requires only one conversion step to become retinoic acid and is reported to be at least 10 times more bioavailable and efficient than other forms of vitamin A and therefore considered the strongest and most effective over-the-counter retinoid [16]. Retinoids, especially retinol and retinal, are, however, very sensitive to oxidation and degradation caused by contact with heat, light, oxygen, and moisture (water), and careful product design to avoid degradation is therefore required to maintain the activity in the finished product. Over-the-counter and cosmetic products usually contain retinyl esters (e.g., retinyl palmitate, retinyl acetate, retinyl propionate) for their enhanced stability; however, these esters also show degradation in the final product [17,18]. This highlights the importance of using pre-activated or more readily bioavailable forms such as retinal, and in product formats that maintain the stability of the retinoids over time.
The current study evaluates an anhydrous formula containing 0.1% retinal filled in an airless polypropylene dispenser to minimize exposure to air and moisture during storage and use. The formula also contains four hydrophilic active ingredients that enhance the formulation’s efficacy by targeting hydration, barrier function, oxidative stress, and a balanced microbiome.
- N-Acetyl Glucosamine (NAG) (1,5%): A precursor of hyaluronic acid that supports hydration and barrier function while inhibiting melanin production by downregulating tyrosinase, helping to reduce hyperpigmentation and improve skin elasticity [19].
- Niacinamide (Vitamin B3) (1%): Known for its barrier-strengthening properties, niacinamide enhances ceramide production, reduces transepidermal water loss, and helps even skin tone by inhibiting melanosome transfer [19,20,21,22,23].
- Ascorbic Acid (Vitamin C) (0.5%): A potent antioxidant that neutralizes free radicals, stimulates collagen synthesis, and inhibits tyrosinase activity to improve skin brightness and resilience [24].
- Alpha-Glucan Oligosaccharide (0.5%): A prebiotic ingredient that promotes a balanced skin microbiome, enhancing the skin’s natural defense mechanisms and potentially reducing skin sensitivity [25].
Except for retinal, Vitamin C is also sensitive to moisture, oxygen, and heat, and the anhydrous formula maintains the activity of the substance over time. The stability of both retinol and vitamin C in anhydrous formulations similar to the present system has been investigated and confirmed during development (proprietary data). The investigated anhydrous formula is designed to be mixed with a moisturizer (emulsion) before application, where the hydrophilic substances are dispersed in the anhydrous formula and become solubilized and activated in the mixing process. This unique approach maintains the stability of the actives by preventing degradation caused by air, water, and high-temperature exposure. To our knowledge, this is the first time that hydrophilic actives have been formulated in an anhydrous vehicle and mixed with a water-containing moisturizer immediately before application to solubilize and activate the formulation’s ingredients. This innovative approach ensures maximum activity and freshness of the product, delivering optimal efficacy to the skin.
This study aimed to assess the efficacy and safety of the formulation in improving key skin parameters—pigmentation, fine lines, wrinkles, texture, volume, brightness (individual typology angle (ITA°)), pores, and redness—over a six-week period using the Antera 3D imaging system from Miravex Limited, Ireland, and a self-evaluation questionnaire.
2. Materials and Methods
2.1. Study Design
This single-center, prospective, before-and-after study was conducted over six weeks. Participants applied the test product themselves according to a defined protocol. The product was mixed in the palm of the hand in a 1:2 ratio with a moisturizer immediately before application, and the mixture was then applied to the entire face. Subjects were instructed to self-dose by taking 1 pump of the test product and 2 pumps of the moisturizer from packages that both dispensed 0.2 mL/pump. The moisturizer was chosen based on the participant’s skin type at the start of the study. The test product/moisturizer mix was applied in the evening to cleansed skin. All subjects were instructed to phase in the test product by using it every third night the first week, every other night the second week, and then every night for the last four remaining weeks. Cleansing was only allowed in the evening. In the morning the moisturizer alone was applied. No other products were allowed to be used during the study period. All moisturizers and the cleanser used in the study were from Skinome. The study included no washout period prior to using the study products.
Objective measurements were taken at baseline and after six weeks using the Antera 3D imaging system, which employs multi-spectral imaging and computational analysis to reconstruct skin surface topography and spectrophotometric variables. This technology enables quantitative assessments of key aging parameters such as wrinkle and fine line depth and width, overall skin roughness, pore size, skin tone, as well as variation in pigmentation. Images were taken of five different areas as follows: forehead, crow’s feet, eye, cheek, and nasolabial region, and it was randomized whether measurements were made on the right or left side for each subject. Visual pictures were also taken at baseline and after six weeks using a Nikon Z5 camera, Nikon Corporation, Tokyo, Japan.
2.2. Participants
A total of twenty-seven Caucasian healthy adults (4 men and 23 women) aged 40–69 years (required to be >40 yo), presenting visible signs of photoaging such as fine lines, wrinkles, and uneven pigmentation, were enrolled in the study. Exclusion criteria included the following:
- Diagnosed skin disorder (rosacea, eczema, acne, and psoriasis);
- Pregnancy and breastfeeding;
- Exposure to any cosmetic treatment (microneedling and strong chemical peels) in the last 6 months prior to the study period;
- Any use of botox or fillers prior to the study.
All participants signed an informed consent before enrollment. No participant had used similar topical products with retinoids or undergone professional wrinkle or peeling treatment or any other skin treatment in the preceding six months. Skin type and phototype were recorded at baseline. Skin phototype was determined using the Antera camera and skin type through a combined self-assessment by the subject and evaluation by the study leader. The majority of participants were Fitzpatrick phototype III (21 subjects) and the rest phototype II (6 subjects), with a mix of oily/combination (n = 4), normal/dry (n = 16) and dry/very dry (n = 7) skin types. No participants with darker phototypes (IV, V or VI) were included.
2.3. Biophysical Measurements
The Antera 3D imaging system (Miravex Limited, Dublin, Ireland) was employed to assess key skin parameters objectively, including the following:
- Pigmentation;
- Fine lines and wrinkles;
- Skin texture and volume;
- Skin brightness (ITA°);
- Pore visibility;
- Redness (erythema).
Antera 3D is a hand-held device designed for skin imaging and objective skin analysis. The camera emits light covering wavelengths across the entire visible spectrum. The camera measures the reflected light from the skin surface in multiple directions and within different wavelength ranges, which enables computer-aided reconstruction of the skin in 3D and a spectral analysis. For data processing, representative circular sub-areas with a diameter of 44 mm were selected within the measurement area of 56 × 56 mm for each analyzed sub-area and participant. The camera and associated software enable the identification and measurement of the same area at different time points. For each subject, five different subareas were imaged, and the mean of three repetitive measurements was calculated for each area and parameter, at each time point. The summed difference before and after, for each parameter and for all areas combined, was then used for the statistical analysis. The Antera device allows for accurate and reproducible quantification of chromophores and skin surface topography, providing an objective assessment of the product’s efficacy. Antera 3D has been determined to have an accuracy of ±5% error (Miravex). A number of studies have previously validated Antera 3D for the assessment of biophysical parameters [26,27,28]. The associated Antera Pro software, version 3.1.12 was used for data processing.
2.3.1. Self-Evaluation Questionnaire
Participants completed a self-assessment questionnaire at the end of the study period (week 6), evaluating their perception of improvements in the following:
- Product gentleness;
- Wrinkle reduction;
- Firmness and elasticity;
- Glow and hydration;
- Evenness of skin tone;
- Reduction in pigment spots and pore visibility;
- Overall satisfaction with skin appearance;
- Reduced need for makeup.
2.3.2. Test Products
Test products were all provided by Skinome, Stockholm, Sweden. The test product and moisturizers have a recommended fridge storage (4–8 °C); the cleanser can be stored at room temperature. The moisturizers used in the study were all o/w emulsions and selected based on the different skin types included in the study. The test product ingredient list is found in Table 1, cleanser ingredient list in Table 2, and the different moisturizers ingredient lists in Table 3, Table 4 and Table 5.

Table 1.
Ingredients (according to INCI) in the test product.

Table 2.
Ingredients (according to INCI) for the cleanser (Mineral Cleanser, Skinome).

Table 3.
Ingredients (according to INCI) in the moisturizer used by subjects having oily/combination skin (Light Emulsion, Skinome).

Table 4.
Ingredients (according to INCI) in the moisturizer used by subjects having normal/dry skin (Rich Emulsion, Skinome).

Table 5.
Ingredients (according to INCI) in the moisturizer used by subjects having dry/very dry skin (Intense Emulsion, Skinome).
2.4. Statistical Analysis
Statistical analysis was performed using two-tailed paired non-parametric Wilcoxon signed-rank tests to compare baseline and post-treatment measurements at six weeks. Statistical significance was set at p < 0.05. A Bonferroni correction was applied, setting the adjusted significance threshold at 0.006 for 8 comparisons. All statistical analysis was made using Graphpad Prism version 10.6.1. The number of subjects needed was determined pragmatically based on previous experience from similar studies and the number of subjects needed to show a difference.
Ethics
The cosmetic study adhered to the Declaration of Helsinki and good clinical practice. All methods were carried out in accordance with relevant guidelines and regulations (final opinion 18 October 2023 by the Swedish Ethical Review Authority (: Dnr 2022-07196-01).
Written informed consent was obtained from all participants prior to enrollment. This was a cosmetic study conducted on healthy volunteers, with no therapeutic or diagnostic endpoints and no claims related to the treatment or prevention of disease.
3. Results
All 27 participants completed the study with no dropouts due to adverse events or lack of effectiveness. The participants ranged in age from 40 to 69 (mean 49.1 ± 6.3 years, median 47 years). All Antera results are presented with their relative median deviation because it is a calculated difference in the sum of many measurements.
3.1. Objective Measurements with Antera 3D
After six weeks of treatment, significant improvements were observed across all measured skin parameters except the skin redness, even with the conservative corrected p-values. A result was considered significant if the p-value was below 0.006 (Bonferroni corrected p values, eight comparisons, and an original significance level of 0.05). Exact p-values are presented with five digits, however in the case the p-value was below 0.0001 it is presented as p < 0.0001.
- Pigmentation: 12% reduction in hyperpigmentation (p < 0.0001);
- Fine Lines: 14% reduction in fine lines (p < 0.0001);
- Wrinkles: 5% improvement in wrinkle depth and severity (p = 0.0045);
- Texture: 12% improvement in skin smoothness (p < 0.0001);
- Volume: 15% reduction in skin irregularities (p < 0.0001);
- Skin Brightness: 4%-increase in ITA° (p = 0.0004);
- Pores: 24% reduction in pore visibility (p < 0.0001);
- Redness: No significant change in erythema (p = 0.6664).
The difference plots are presented in Figure 1, Figure 2, Figure 3, Figure 4, Figure 5, Figure 6, Figure 7 and Figure 8 and visualize the absolute calculated difference before versus after for each analyzed parameter and for each individual subject (seen as a separate point in the figures). The difference is calculated by subtracting the sum of the average of three repeated measurements in up to five different areas taken at the end of the study from the same sum and areas from the initial measurement. From these values the relative differences are calculated and presented as percentage values (see above). Figure 9, Figure 10, Figure 11, Figure 12 and Figure 13 show representative photos of the subjects and Antera scans of the skin before and after six weeks of product application, visualizing the improvements in fine lines, skin texture/roughness, pigmentation, pores and volume irregularities.
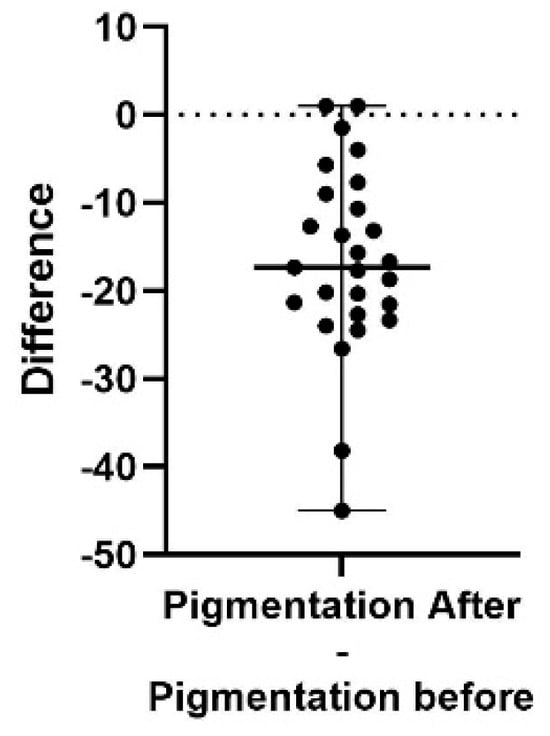
Figure 1.
A difference plot showing the calculated difference in pigmentation score at the end of the study period (after) compared to the start (before). Each point is representing one subject. The difference is calculated by subtracting the sum of the average of three repeated measurements in up to five different areas, taken at the end of the study, from the same sum and areas from the initial measurement. The result shows a significant decrease in pigmentation score (p < 0.0001). The 98% confidence interval of the pigmentation score difference is −21.55 to −10.66.
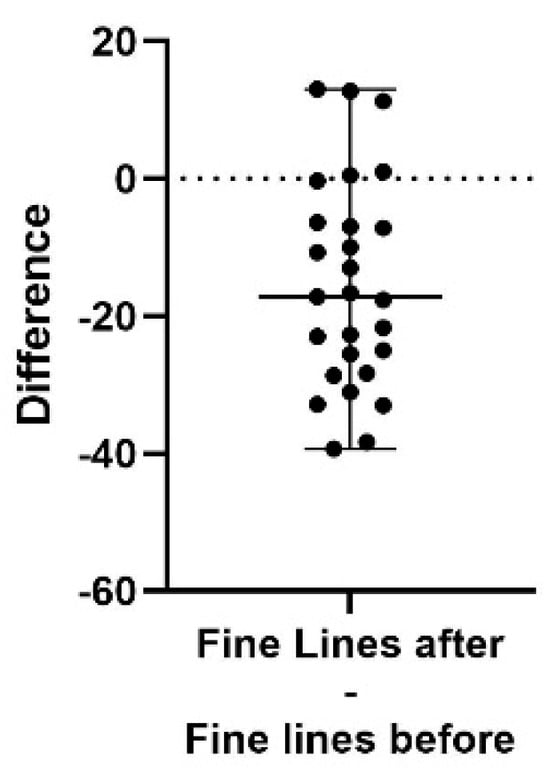
Figure 2.
A difference plot showing the calculated difference in fine lines score at the end of the study period (after) compared to the start (before). The difference is calculated by subtracting the sum of the average of three repeated measurements in up to five different areas, taken at the end of the study, from the same sum and areas from the initial measurement. The result shows a significant decrease in the appearance of fine lines (p < 0.0001). The 98% confidence interval of the fine lines score difference is −25.50 to −7.00.
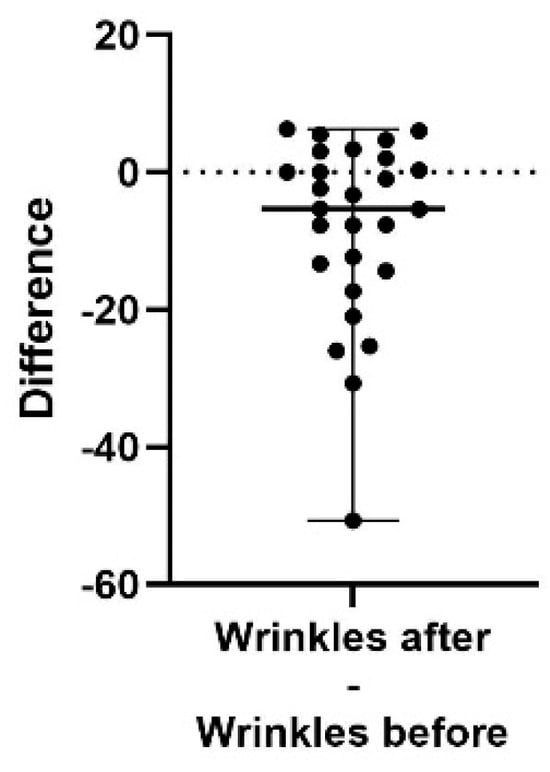
Figure 3.
A difference plot showing the calculated difference in wrinkle score at the end of the study period (after) compared to the start (before). The difference is calculated by subtracting the sum of the average of three repeated measurements in up to five different areas, taken at the end of the study, from the same sum and areas from the initial measurement. The result shows a significant decrease in the appearance of wrinkles (p = 0.0045). The 98% confidence interval of the fine lines difference is −13.33 to 0.33.
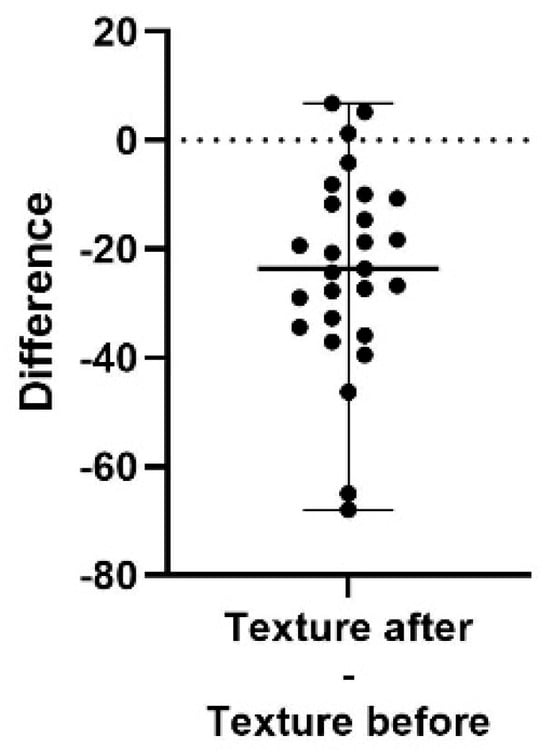
Figure 4.
A difference plot showing the calculated difference in texture score at the end of the study period (after) compared to the start (before). The difference is calculated by subtracting the sum of the average of three repeated measurements in up to five different areas, taken at the end of the study, from the same sum and areas from the initial measurement. The result shows a significant decrease in the roughness of skin texture (p < 0.0001). The 98% confidence interval of the texture score difference is −32.67 to −11.67.
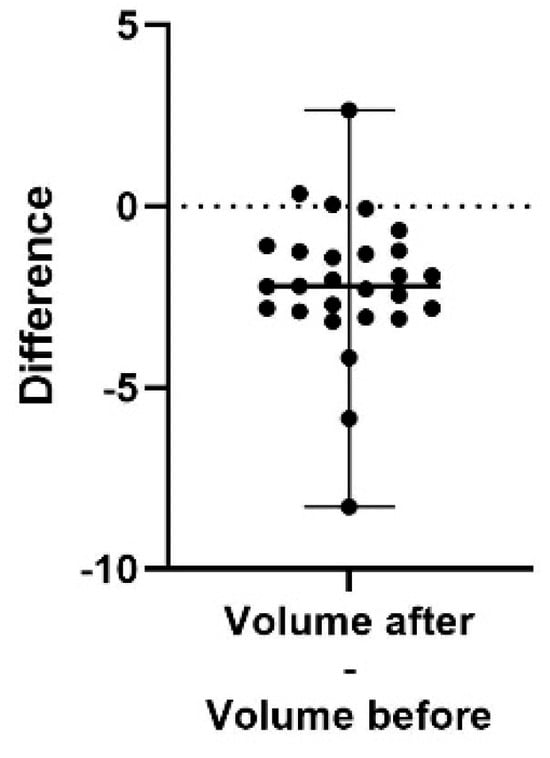
Figure 5.
A difference plot showing the calculated difference in volume at the end of the study period (after) compared to the start (before). The difference is calculated by subtracting the sum of the average of three repeated measurements in up to five different areas, taken at the end of the study, from the same sum and areas from the initial measurement. The result shows a significant decrease in the volume score (p < 0.0001). The 98% confidence interval of the volume score difference is −2.81 to −1.25.
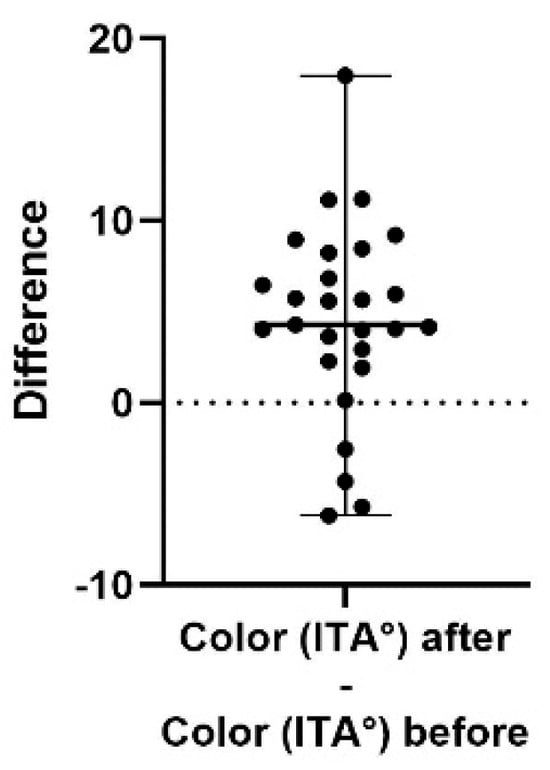
Figure 6.
A difference plot showing the calculated difference in color (ITA°) at the end of the study period (after) compared to the start (before). The difference is calculated by subtracting the sum of the average of three repeated measurements in up to five different areas, taken at the end of the study, from the same sum and areas from the initial measurement. The result shows a significantly brighter skin (increased ITA° (p = 0.0004). The 98% confidence interval of the texture difference is 2.94 to 6.84.
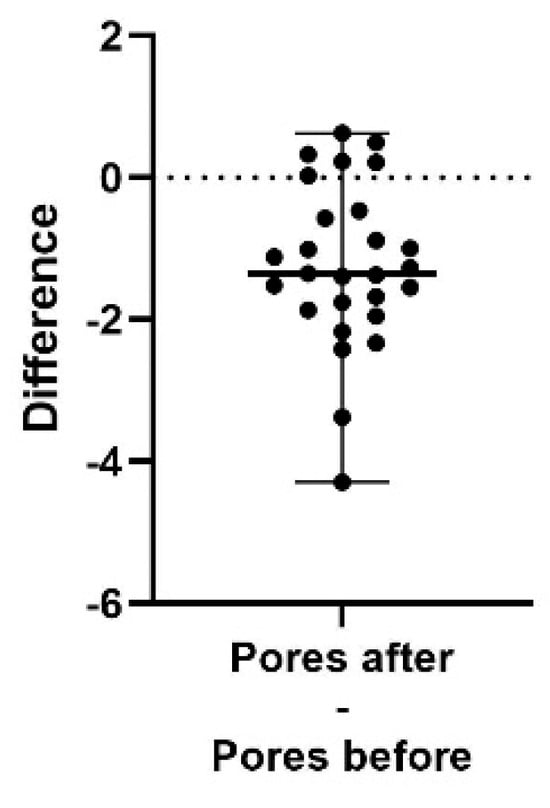
Figure 7.
A difference plot showing the calculated difference in pores index at the end of the study period (after) compared to the start (before). The difference is calculated by subtracting the sum of the average of three repeated measurements in up to five different areas, taken at the end of the study, from the same sum and areas from the initial measurement. The result shows a significant reduction in pores index (p < 0.0001). The 98% confidence interval of the pores index difference is −1.76 to −0.57.
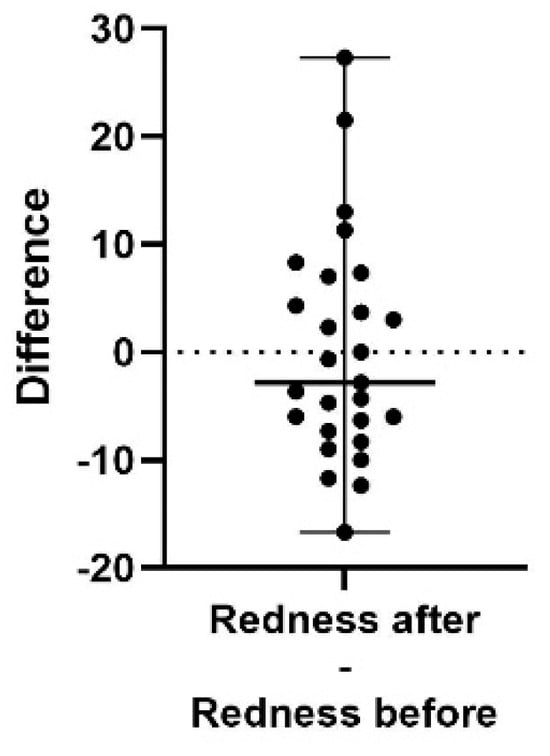
Figure 8.
A difference plot showing the calculated difference in redness score at the end of the study period (after) compared to the start (before). The difference is calculated by subtracting the sum of the average of three repeated measurements in up to five different areas, taken at the end of the study, from the same sum and areas from the initial measurement. The result shows no significant difference in redness score (p = 0.6664). The 98% confidence interval of the redness score difference is −6.33 to −4.33.
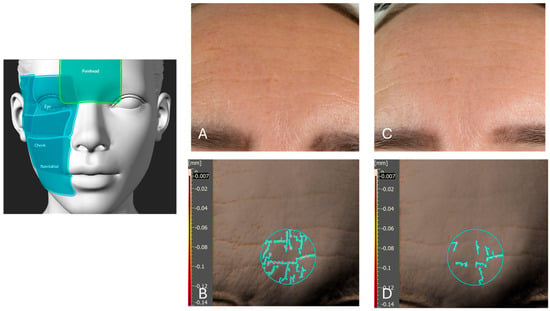
Figure 9.
A representative analysis of forehead skin before and after six weeks of product application. Picture (A) presents a visual light image (using a Nikon Z5 camera, Nikon Corporation, Tokyo, Japan) of the forehead at baseline (T0), prior to product application. Picture (B) displays an Antera 3D image of the same forehead region at T0, highlighting the fine lines and skin texture. The value indicated in a black box on the Y-axis is the threshold value used by the software. Picture (C) shows the visual light image of the forehead after six weeks of product application, demonstrating visible improvements. Picture (D) presents the corresponding Antera 3D image after six weeks, illustrating a reduction in fine lines by 37% in the forehead area. The left schematic highlights the analyzed facial regions, including the forehead (highlighted), eye area, cheek, and nasolabial zone.
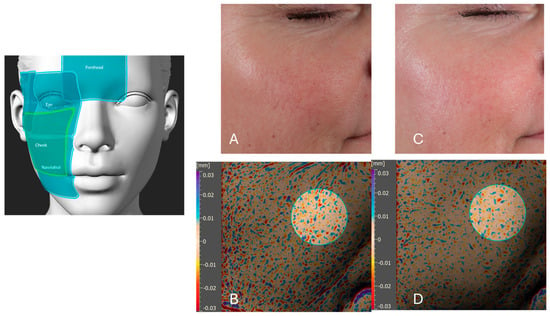
Figure 10.
A representative analysis of skin texture (texture roughness) on the cheek before and after six weeks of product application. Picture (A) presents a visual light image (using a Nikon Z5 camera, Nikon Corporation, Tokyo, Japan) of the cheek at baseline (T0), prior to product application. Picture (B) displays an Antera 3D image of the same cheek region at T0, illustrating the skin texture roughness. Picture (C) shows the visual light image of the cheek after six weeks of product application, demonstrating visible improvements in skin smoothness. Picture (D) presents the corresponding Antera 3D image after six weeks, highlighting a reduction in skin texture roughness by 32% in the cheek area. The left schematic indicates the analyzed facial regions, including the forehead, eye area, cheek (highlighted), and nasolabial zone.
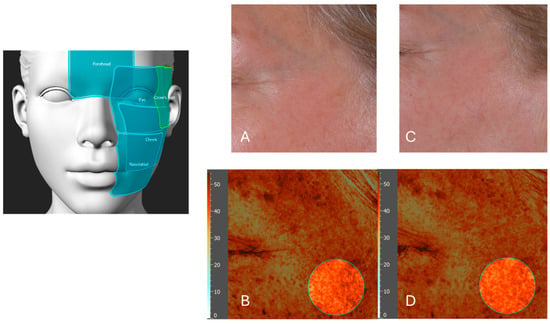
Figure 11.
A representative analysis of skin pigmentation in the crow’s feet area before and after six weeks of product application. Picture (A) presents a visual light image (using a Nikon Z5 camera, Nikon Corporation, Tokyo, Japan) of the crow’s feet region at baseline (T0), prior to product application. Picture (B) displays an Antera 3D image of the same region at T0, illustrating the pigmentation distribution. Picture (C) shows the visual light image of the crow’s feet area after six weeks of product application, demonstrating visible improvements in skin tone uniformity. Picture (D) presents the corresponding Antera 3D image after six weeks, highlighting a reduction in pigmentation intensity and variability by 27% in the crow feet area. The left schematic indicates the analyzed facial regions, including the forehead, crow feet area (highlighted) eye area, cheek, and nasolabial zone.
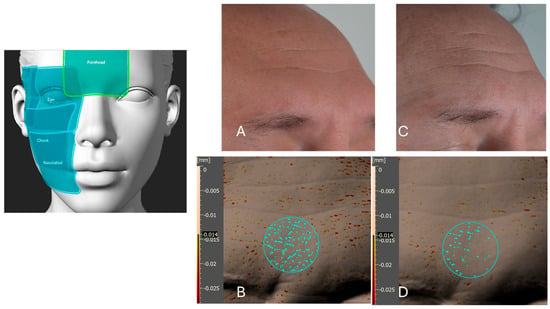
Figure 12.
A representative analysis of pore size in the T-zone (forehead) before and after six weeks of product application. Picture (A) presents a visual light image (using a Nikon Z5 camera, Nikon Corporation, Tokyo, Japan) of the forehead at baseline (T0), prior to product application. Picture (B) displays an Antera 3D image of the same forehead region at T0, highlighting the distribution and size of pores. The value indicated in a black box on the Y-axis is the threshold value used by the software. Picture (C) shows the visual light image of the forehead after six weeks of product application, demonstrating visible improvements in skin smoothness and pore appearance. Picture (D) presents the corresponding Antera 3D image after six weeks, illustrating a reduction in pore size and density by 62% in the forehead area. The left schematic indicates the analyzed facial regions, including the forehead (highlighted), eye area, cheek, and nasolabial zone.
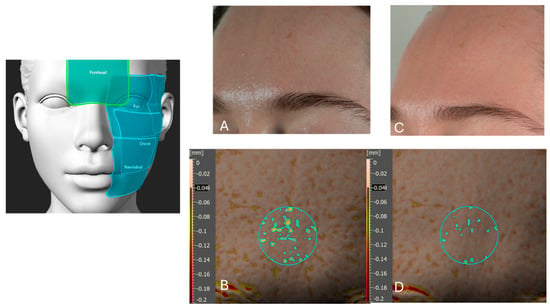
Figure 13.
A representative analysis of skin irregularities measured by skin volume in the forehead before and after six weeks of product application. Picture (A) presents a visual light image (using a Nikon Z5 camera, Nikon Corporation, Tokyo, Japan) of the forehead at baseline (T0), prior to product application. Picture (B) displays an Antera 3D image of the same forehead region at T0, illustrating skin volume irregularities. The value indicated in a black box on the Y-axis is the threshold value used by the software. Picture (C) shows the visual light image of the forehead after six weeks of once-daily product application, demonstrating visible improvements in skin smoothness and evenness. Picture (D) presents the corresponding Antera 3D image after six weeks, highlighting a reduction in skin volume irregularities by 67% in the forehead area. The left schematic indicates the analyzed facial regions, including the forehead (highlighted), eye area, cheek, and nasolabial zone.
3.2. Self-Evaluating Questionnaire
Participants reported high satisfaction with the product’s effectiveness and tolerability.
Key self-reported findings include the following:
- 92% agreed that the products were gentle on their skin;
- 68% observed their wrinkles and/or fine lines were less prominent;
- 86% agreed their skin was smoother and more even;
- 71% agreed their skin felt firmer;
- 77% noted improved skin elasticity and suppleness;
- 78% reported an enhanced skin glow;
- 70% found their skin tone more even;
- 64% observed reduced pigment spot visibility;
- 60% agreed their pores were less visible;
- 83% noted softer and more hydrated skin;
- 81% expressed overall satisfaction with their skin condition;
- 43% felt they needed less makeup.
Additionally, participants reported that they gradually noticed improvements in their skin during the study:
- 40% noticed visible improvements within 2 weeks;
- 74% within 4 weeks;
- 81% within 6 weeks.
These findings underscore the rapid and sustained effects of the formulation.
Only a few minor side effects were reported by the subjects during the study as follows: one reported that the skin became more dry, two experienced a slightly more red skin, one reported an occasional stinging effect, mostly in combination with exercise and shower, and one achieved a few blemishes or breakouts. No other or severe adverse effects were reported during the study, supporting the formulation’s excellent safety profile.
4. Discussion
This study highlights the significant efficacy and safety of a 0.1% retinal test product combined with a simple routine of a moisturizer and a cleanser in addressing multiple signs of skin aging within six weeks. Retinal, the immediate precursor to all-trans retinoic acid, provides a balance of high efficacy with reduced irritation potential, making it a well-tolerated option also for individuals with sensitive skin. These findings are consistent with previous research showing that 0.1% retinal enhances epidermal thickness, collagen synthesis, and pigmentation without causing irritation [29,30]. It is important to note that the retinal formulations used in clinical studies are typically freshly prepared specifically for trials, ensuring the full potency of the active ingredient. In contrast, conventional retinal or retinoid products on the market may undergo significant degradation through hydrolysis or oxidation over time, especially when exposed to air, light, or moisture. This raises concerns about the actual concentration and efficacy of the active compound at the time of consumer use, which also has been confirmed to be lower than at the start [17].
The test product in this study is based on an innovative anhydrous system, which requires hydrophilic actives to be solubilized by the consumer immediately before application, ensuring optimal stability, and potency of the ingredients. The product is also refrigerated straight after production, and the panelists are recommended to store the product in the fridge during the study. To our knowledge, this is the first time such a system has been developed, offering a novel approach that guarantees maximum efficacy and freshness of the product. The inclusion of hydrophilic actives—N-acetyl glucosamine, niacinamide, ascorbic acid, and alpha-glucan oligosaccharide—amplifies the formulation’s efficacy by addressing multiple aspects of skin, such as hydration, microbiome balance, skin pigmentation, and sebum control [20,21,22,24].
In the present study, significant improvements (p < 0.006) were observed across all assessed skin parameters, including a 12% reduction in pigmentation, 14% reduction in fine lines, 5% reduction in wrinkle depth, and 12% improvement in skin texture, reflecting the formulation’s strong anti-aging potential. Additionally, a 15% reduction in skin irregularities and a 24% reduction in pore visibility indicate notable enhancements in overall skin appearance in the study panelists.
Importantly, no significant difference was observed in redness after six weeks of use, suggesting that the formulation effectively improves skin quality without inducing irritation or sensitivity. This highlights the product’s gentle nature, making it suitable for individuals with sensitive skin or those prone to irritation.
Self-evaluation responses further validate the objective measurements, demonstrating high levels of participant satisfaction. After six weeks of use, 81% of participants reported being more satisfied with their skin, and 43% felt they needed less makeup, indicating a substantial boost in self-confidence and overall perception of their skin quality. Moreover, the study showed that the product delivered visible improvements within a short time frame, with 40% noticing positive changes within two weeks, 74% within four weeks, and 81% within six weeks. These findings suggest that the retinal test product provides rapid and sustained benefits, which are essential for consumer adherence and satisfaction in anti-aging skincare routines. Although the majority of women fell within the peri- to post-menopausal window—when falling estrogen typically hampers collagen synthesis, weakens elasticity, and worsens pigment irregularities, thereby amplifying photoaging—the comparable improvements observed in the smaller male subgroup demonstrate that the formulation delivers consistent benefits across sexes, confirming its suitability as a unisex product. A key limitation of this study is the absence of a vehicle, placebo, or active comparator group. While the significant improvements observed across multiple objective parameters strongly suggest product-related effects, natural variation, placebo responses, the effect of moisturizer use, or the combined use of the products cannot be excluded. This limits the ability to establish definitive causal inference. Future studies should therefore adopt randomized, placebo- or vehicle-controlled designs, and ideally include direct comparisons with reference compounds such as all-trans retinoic acid, to more precisely determine the relative efficacy and tolerability of the formulation.
Another limitation relates to the relatively small sample size (n = 27), which was determined based on previous experience and feasibility rather than a priori power calculations. Although significant improvements were consistently observed, the limited sample restricts generalizability and increases the risk of type II error for outcomes with smaller effect sizes. Furthermore, the study cohort was composed predominantly of women (23 of 27 participants), and individuals were all Fitzpatrick skin phototypes II–III, with normal, dry, or combination skin types represented. The underrepresentation of men and the absence of darker skin phototypes further limit the applicability of these findings to broader populations. Future studies should therefore include larger, more diverse populations and include subgroup analyses to ensure sufficient statistical power and more information about how the effect varies between and within different gender and age groups.
5. Conclusions
In summary, the anhydrous 0.1% retinal product, formulated with complementary hydrophilic actives, demonstrated significant improvements in hyperpigmentation, fine lines, wrinkles, skin texture, volume, and brightness within a period of 6 weeks. Importantly, no significant difference in redness was observed, nor any self-reported side effects, confirming that the product effectively enhances skin appearance without causing irritation or sensitivity.
The high level of participant satisfaction, with 81% feeling more confident in their skin and 43% reducing their reliance on makeup, underscores the formulation’s ability to enhance self-esteem and skin appearance. The product’s rapid action, with 40% noticing improvements already within two weeks, highlights its potential for quick and visible results, reinforcing its appeal to consumers seeking effective anti-aging solutions.
This novel approach, where hydrophilic actives are formulated in an anhydrous vehicle and mixed by the consumer with a water-based moisturizer immediately before application, represents a promising innovation in anti-aging skincare. It ensures high activity and freshness, delivering sought-after anti-aging benefits while maintaining stability and potency over time.
Author Contributions
Conceptualization: J.M.G. and U.Å. methodology, C.G., Software, C.G., validation, U.Å.; formal analysis, U.Å., investigation, B.L.; resources, J.M.G.; data curation, B.L.; writing—J.M.G. and U.Å.; review and editing, U.Å.; visualization, J.M.G. and U.Å.; supervision, U.Å.; project administration, C.G. All authors have read and agreed to the published version of the manuscript.
Funding
The authors received no funding for this work.
Institutional Review Board Statement
The cosmetic study adhered to the Declaration of Helsinki and good clinical practice. All methods were carried out in accordance with relevant guidelines and regulations (final opinion 18 October 2023 by the Swedish Ethical Review Authority (Approval Code:: Dnr 2022-07196-01, 18 October 2023).
Informed Consent Statement
Written informed consent was obtained from all participants prior to enrollment. This was a cosmetic study conducted on healthy volunteers, with no therapeutic or diagnostic endpoints and no claims related to the treatment or prevention of disease.
Data Availability Statement
The raw data supporting the conclusions of this article will be made available by the authors on request.
Conflicts of Interest
Chloe Gaudicheau, Ulf Åkerström and Johanna Gillbro are employed by Skinome Research AB. Ulf Åkerström and Johanna Gillbro own stocks in Skinome Research AB. All authors declare that the research was conducted in the absence of any commercial or financial relationships that could be construed as a potential conflict of interest.
References
- Guinot, C.; Malvy, D.J.; Ambroisine, L.; Latreille, J.; Mauger, E.; Tenenhaus, M.; Morizot, F.; Lopez, S.; Le Fur, I.; Tschachler, E. Relative contribution of intrinsic vs extrinsic factors to skin aging as determined by a validated skin age score. Arch. Dermatol. 2002, 138, 1454–1460. [Google Scholar] [CrossRef]
- Brenneisen, P.; Sies, H.; Scharffetter-Kochanek, K. Ultraviolet-B irradiation and matrix metalloproteinases: From induction via signaling to initial events. Ann. N. Y. Acad. Sci. 2002, 973, 31–43. [Google Scholar] [CrossRef] [PubMed]
- Wlaschek, M.; Maity, P.; Makrantonaki, E.; Scharffetter-Kochanek, K. Connective Tissue and Fibroblast Senescence in Skin Aging. J. Investig. Dermatol. 2021, 141, 985–992. [Google Scholar] [CrossRef] [PubMed]
- Kim, Y.; Kang, B.; Kim, J.C.; Park, T.J.; Kang, H.Y. Senescent Fibroblast-Derived GDF15 Induces Skin Pigmentation. J. Investig. Dermatol. 2020, 140, 2478–2486.e2474. [Google Scholar] [CrossRef] [PubMed]
- Salminen, A.; Kaarniranta, K.; Kauppinen, A. Photoaging: UV radiation-induced inflammation and immunosuppression accelerate the aging process in the skin. Inflamm. Res. 2022, 71, 817–831. [Google Scholar] [CrossRef]
- Kang, H.Y.; Lee, J.W.; Papaccio, F.; Bellei, B.; Picardo, M. Alterations of the pigmentation system in the aging process. Pigment Cell Melanoma Res. 2021, 34, 800–813. [Google Scholar] [CrossRef]
- Gilchrest, B.A.; Blog, F.B.; Szabo, G. Effects of aging and chronic sun exposure on melanocytes in human skin. J. Investig. Dermatol. 1979, 73, 141–143. [Google Scholar] [CrossRef]
- Gillum, H.L.; Morgan, A.F.; Sailer, F. Nutritional status of the aging. V. Vitamin A and carotene. J. Nutr. 1955, 55, 655–670. [Google Scholar] [CrossRef]
- Oikarinen, A.; Peltonen, J.; Kallioinen, M. Ultraviolet radiation in skin ageing and carcinogenesis: The role of retinoids for treatment and prevention. Ann. Med. 1991, 23, 497–505. [Google Scholar] [CrossRef]
- Kligman, A.M. Topical treatments for photoaged skin. Separating the reality from the hype. Postgrad. Med. 1997, 102, 115–118, 123–126. [Google Scholar] [CrossRef]
- Kligman, A.M. The treatment of acne with topical retinoids: One man’s opinions. J. Am. Acad. Dermatol. 1997, 36 Pt 2, S92–S95. [Google Scholar] [CrossRef]
- Kligman, A.M. An extremely effective treatment for serious inflammatory acne: An uncontrolled, unblinded, unstatistical office study. Cutis 1997, 59, 109–110. [Google Scholar]
- Mukherjee, S.; Date, A.; Patravale, V.; Korting, H.C.; Roeder, A.; Weindl, G. Retinoids in the treatment of skin aging: An overview of clinical efficacy and safety. Clin. Interv. Aging 2006, 1, 327–348. [Google Scholar] [CrossRef]
- Sitohang, I.B.S.; Makes, W.I.; Sandora, N.; Suryanegara, J. Topical tretinoin for treating photoaging: A systematic review of randomized controlled trials. Int. J. Womens Dermatol. 2022, 8, e003. [Google Scholar] [CrossRef]
- Weiss, J.S.; Ellis, C.N.; Headington, J.T.; Tincoff, T.; Hamilton, T.A.; Voorhees, J.J. Topical tretinoin improves photoaged skin. A double-blind vehicle-controlled study. JAMA 1988, 259, 527–532. [Google Scholar] [CrossRef] [PubMed]
- D’Ambrosio, D.N.; Clugston, R.D.; Blaner, W.S. Vitamin A metabolism: An update. Nutrients 2011, 3, 63–103. [Google Scholar] [CrossRef] [PubMed]
- Temova Rakusa, Z.; Skufca, P.; Kristl, A.; Roskar, R. Retinoid stability and degradation kinetics in commercial cosmetic products. J. Cosmet. Dermatol. 2021, 20, 2350–2358. [Google Scholar] [CrossRef] [PubMed]
- Temova Rakusa, Z.; Skufca, P.; Kristl, A.; Roskar, R. Quality control of retinoids in commercial cosmetic products. J. Cosmet. Dermatol. 2021, 20, 1166–1175. [Google Scholar] [CrossRef]
- Kimball, A.B.; Kaczvinsky, J.R.; Li, J.; Robinson, L.R.; Matts, P.J.; Berge, C.A.; Miyamoto, K.; Bissett, D.L. Reduction in the appearance of facial hyperpigmentation after use of moisturizers with a combination of topical niacinamide and N-acetyl glucosamine: Results of a randomized, double-blind, vehicle-controlled trial. Br. J. Dermatol. 2010, 162, 435–441. [Google Scholar] [CrossRef]
- Bissett, D.L.; Miyamoto, K.; Sun, P.; Li, J.; Berge, C.A. Topical niacinamide reduces yellowing, wrinkling, red blotchiness, and hyperpigmented spots in aging facial skin. Int. J. Cosmet. Sci. 2004, 26, 231–238. [Google Scholar] [CrossRef]
- Bissett, D.L.; Oblong, J.E.; Berge, C.A. Niacinamide: A B vitamin that improves aging facial skin appearance. Dermatol. Surg. 2005, 31 Pt 2, 860–865; discussion 865. [Google Scholar] [CrossRef] [PubMed]
- Draelos, Z.D.; Matsubara, A.; Smiles, K. The effect of 2% niacinamide on facial sebum production. J. Cosmet. Laser Ther. 2006, 8, 96–101. [Google Scholar] [CrossRef] [PubMed]
- Lee, D.H.; Oh, I.Y.; Koo, K.T.; Suk, J.M.; Jung, S.W.; Park, J.O.; Kim, B.J.; Choi, Y.M. Reduction in facial hyperpigmentation after treatment with a combination of topical niacinamide and tranexamic acid: A randomized, double-blind, vehicle-controlled trial. Skin Res. Technol. 2014, 20, 208–212. [Google Scholar] [CrossRef] [PubMed]
- Gillbro, J.M.; Olsson, M.J. The melanogenesis and mechanisms of skin-lightening agents—Existing and new approaches. Int. J. Cosmet. Sci. 2011, 33, 210–221. [Google Scholar] [CrossRef]
- Han, J.H.; Kim, H.S. Skin Deep: The Potential of Microbiome Cosmetics. J. Microbiol. 2024, 62, 181–199. [Google Scholar] [CrossRef]
- Hurley, S.; Messaraa, C.; O’Connor, C.; Metois, A.; Walsh, M.; Mc Namee, D.; Mansfield, A.; Robertson, N.; Doyle, L.; Mavon, A. DermaTOP Blue and Antera 3D as methods to assess cosmetic solutions targeting eyelid sagging. Skin Res. Technol. 2020, 26, 209–214. [Google Scholar] [CrossRef]
- Messaraa, C.; Metois, A.; Walsh, M.; Hurley, S.; Doyle, L.; Mansfield, A.; O’Connor, C.; Mavon, A. Wrinkle and roughness measurement by the Antera 3D and its application for evaluation of cosmetic products. Skin Res. Technol. 2018, 24, 359–366. [Google Scholar] [CrossRef]
- Matias, A.R.; Ferreira, M.; Costa, P.; Neto, P. Skin colour, skin redness and melanin biometric measurements: Comparison study between Antera® 3D, Mexameter® and Colorimeter®. Skin Res. Technol. 2015, 21, 346–362. [Google Scholar] [CrossRef]
- Kwon, H.S.; Lee, J.H.; Kim, G.M.; Bae, J.M. Efficacy and safety of retinaldehyde 0.1% and 0.05% creams used to treat photoaged skin: A randomized double-blind controlled trial. J. Cosmet. Dermatol. 2018, 17, 471–476. [Google Scholar] [CrossRef]
- Mambwe, B.; Mellody, K.T.; Kiss, O.; O’Connor, C.; Bell, M.; Watson, R.E.B.; Langton, A.K. Cosmetic retinoid use in photoaged skin: A review of the compounds, their use and mechanisms of action. Int. J. Cosmet. Sci. 2025, 47, 45–57. [Google Scholar] [CrossRef]
Disclaimer/Publisher’s Note: The statements, opinions and data contained in all publications are solely those of the individual author(s) and contributor(s) and not of MDPI and/or the editor(s). MDPI and/or the editor(s) disclaim responsibility for any injury to people or property resulting from any ideas, methods, instructions or products referred to in the content. |
© 2025 by the authors. Licensee MDPI, Basel, Switzerland. This article is an open access article distributed under the terms and conditions of the Creative Commons Attribution (CC BY) license (https://creativecommons.org/licenses/by/4.0/).