
Ethnic Differences in Women’s Perception of Simulated Facial Aging over a 15-Year Horizon: A GAN-Based Model Approach

Abstract
1. Introduction
2. Materials and Methods
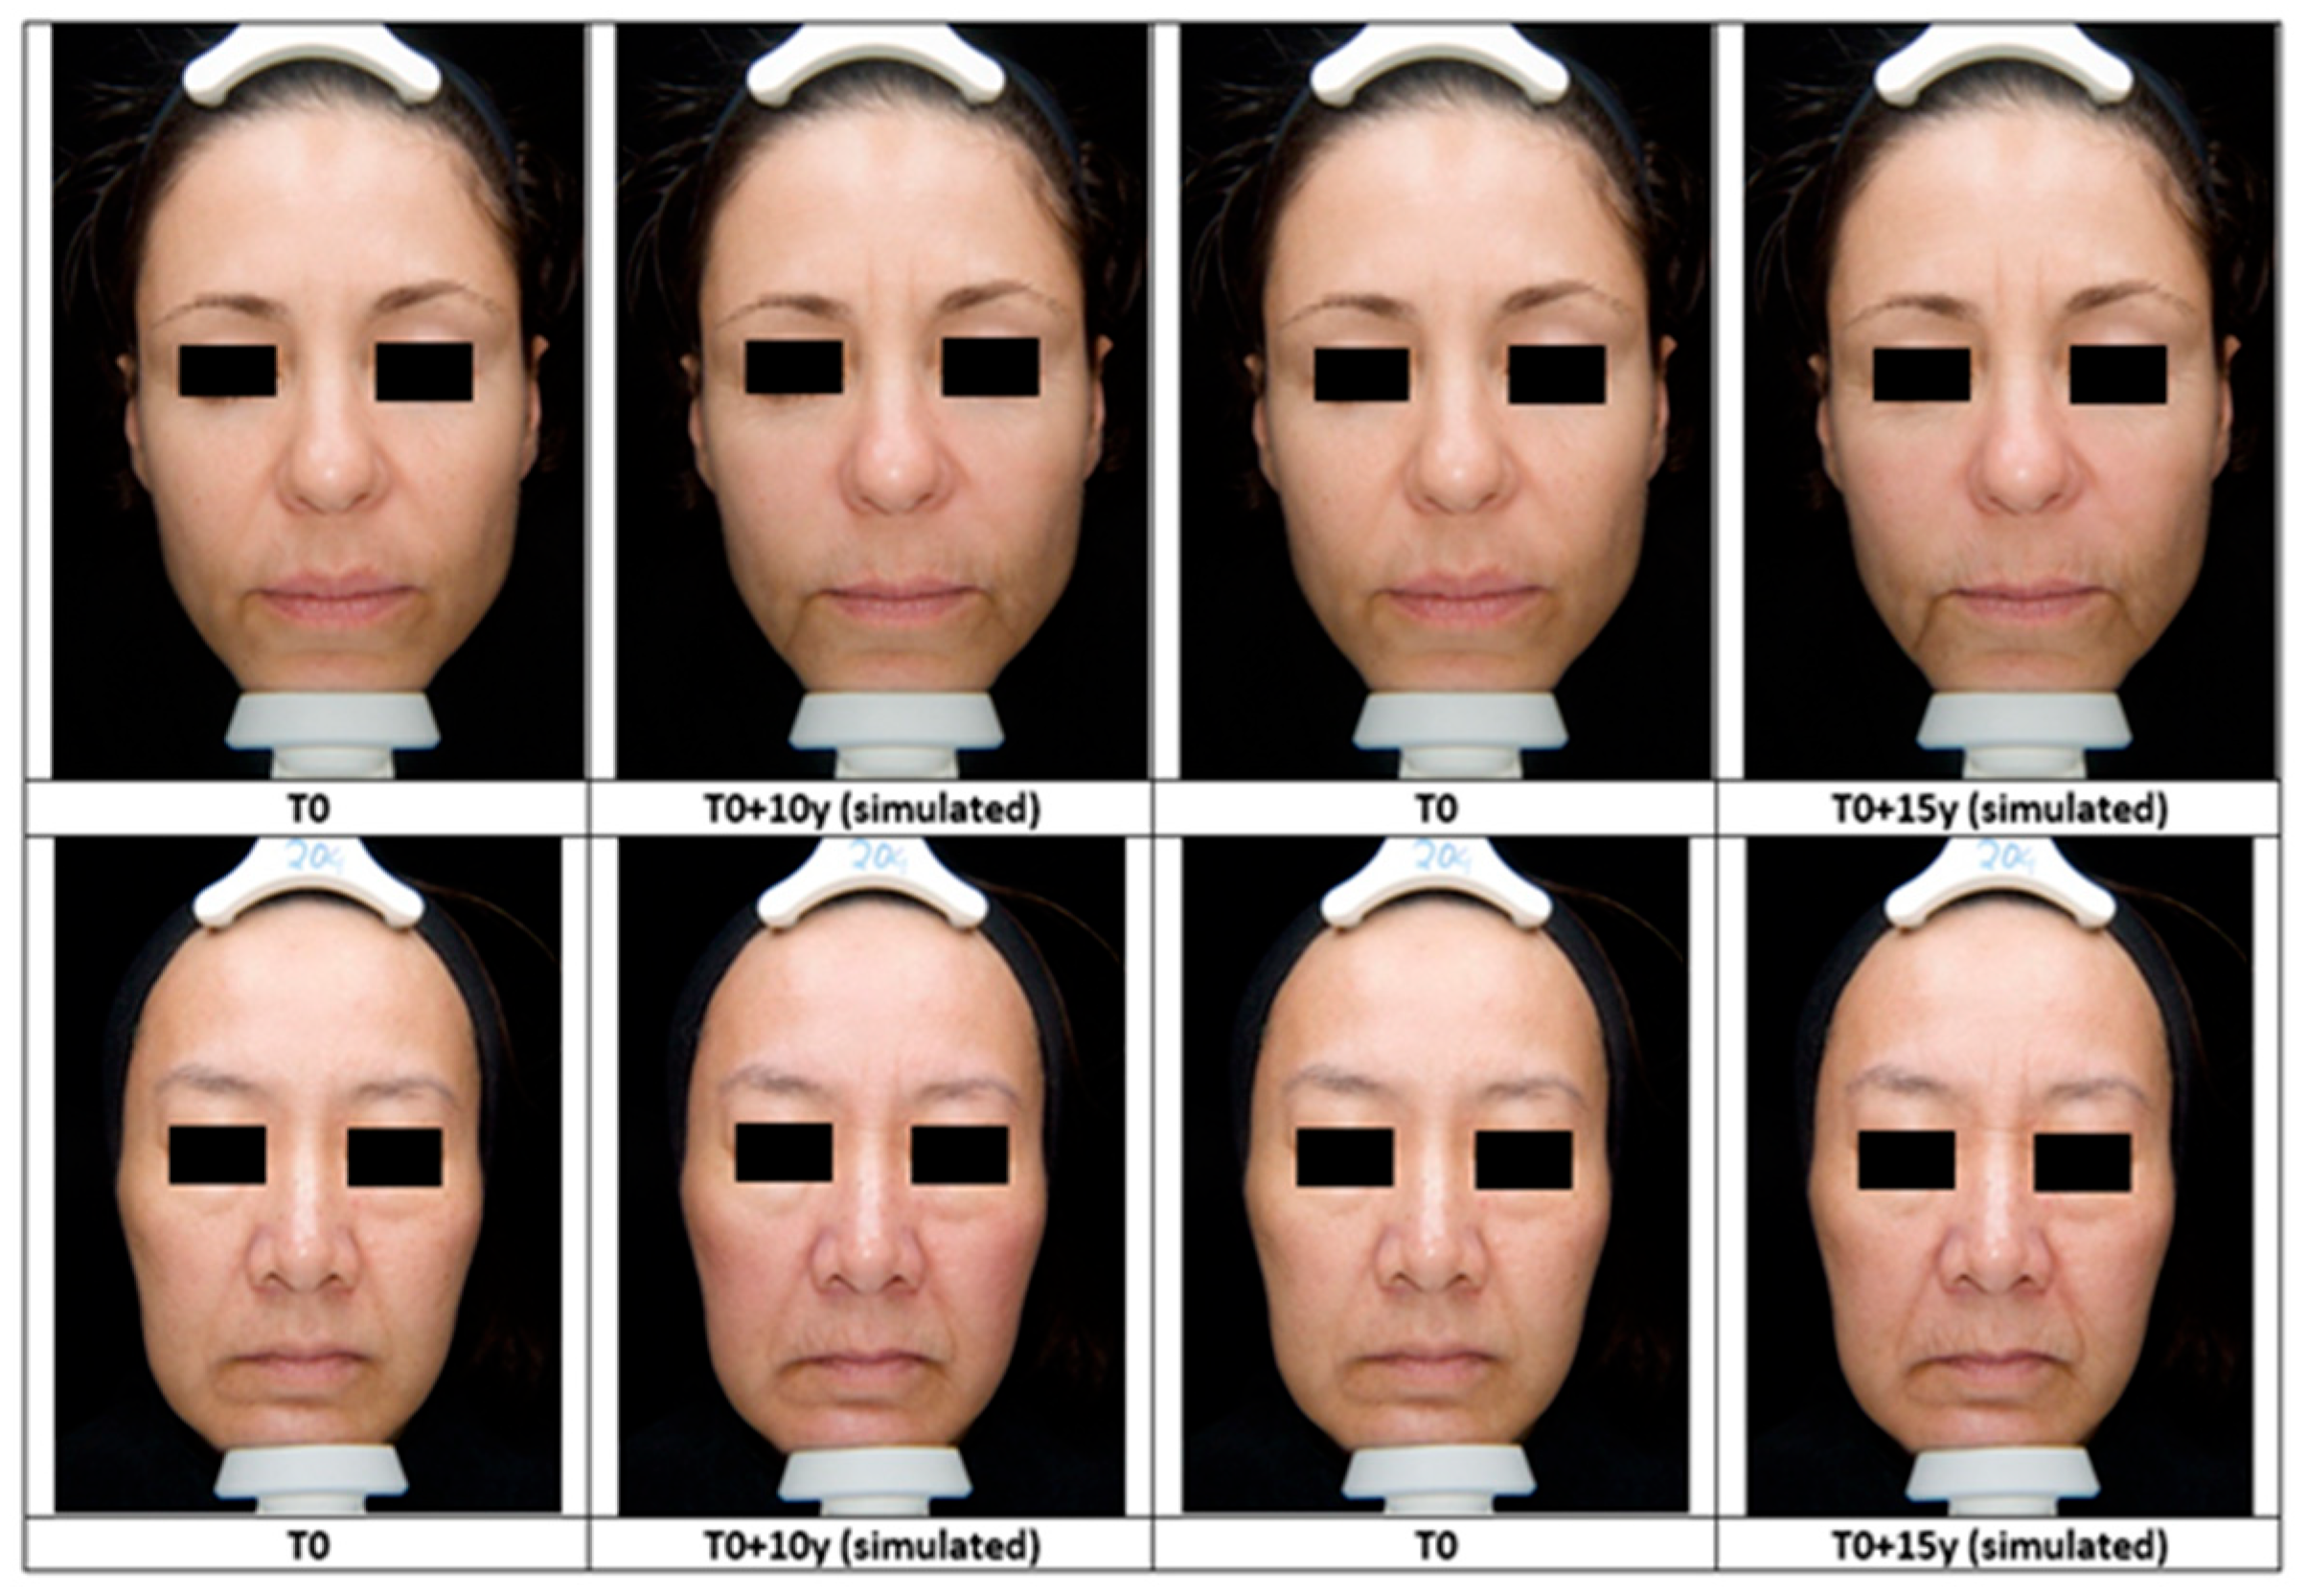
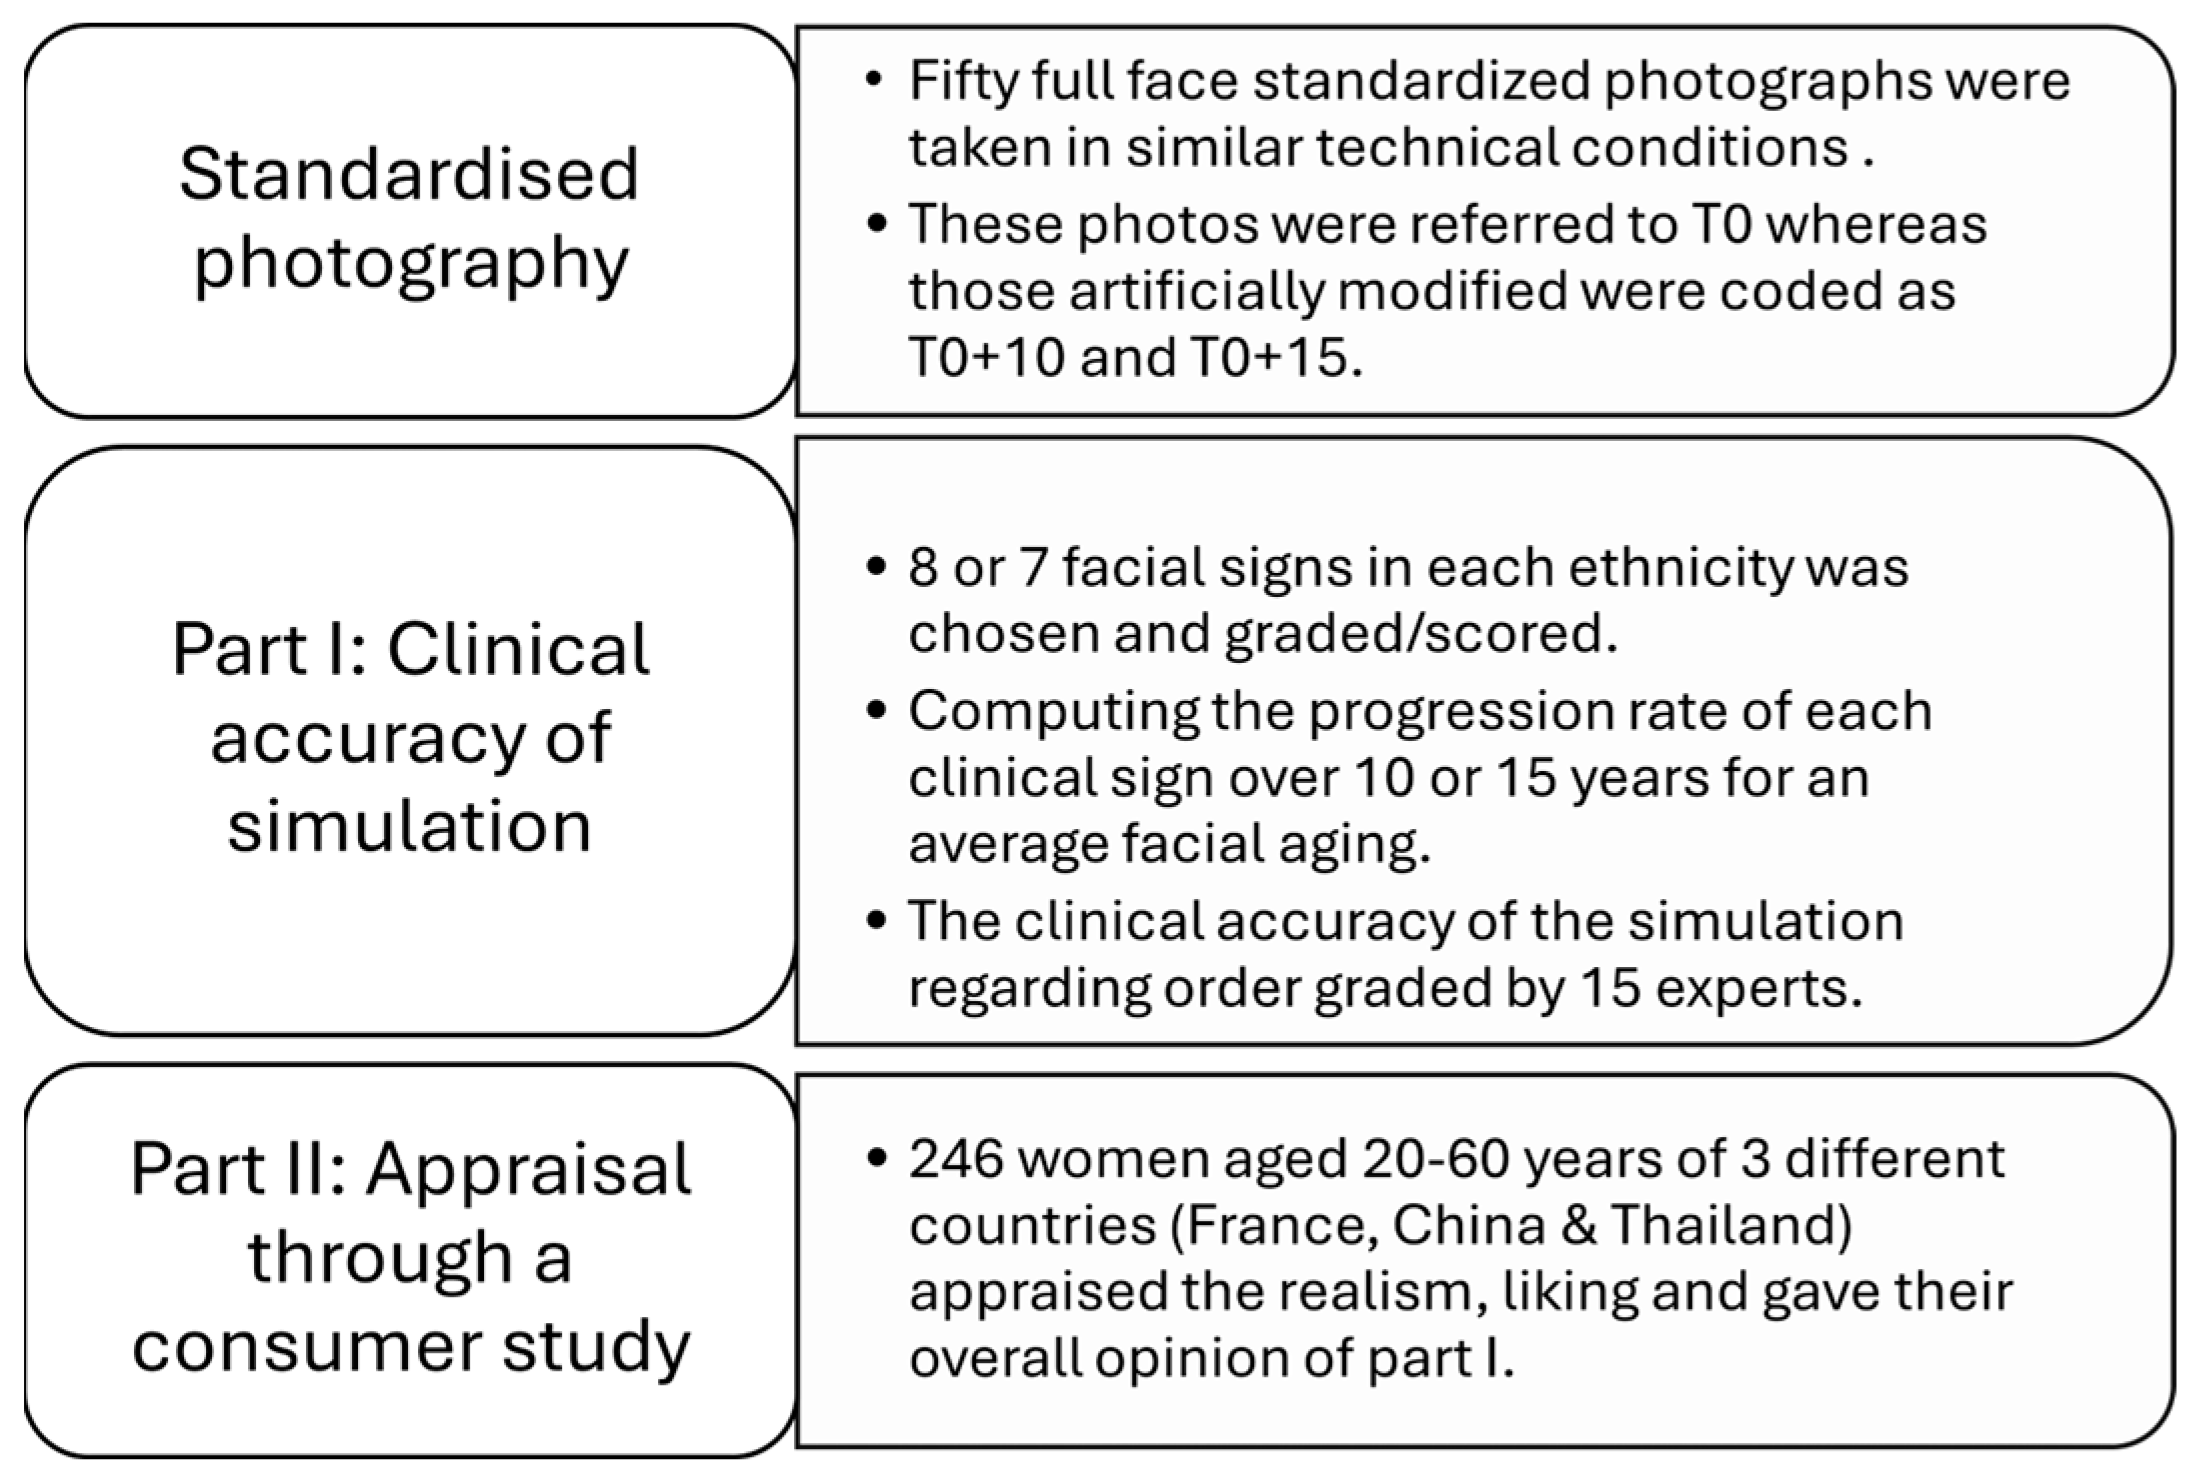
2.1. Full-Face Photographs
2.2. Part I: Facial Signs and Grading Scales Integrated in the AI-Based System
2.3. Simulation and Grading Algorithm
2.4. Grading of Facial Skin Aging by the Expert Panel
2.5. Part II: Appraising Naïve Panel
2.6. Questionnaire
2.7. Statistics
3. Results
3.1. Robustness of Simulation
3.2. Perception of Simulation Experience
4. Discussion
Author Contributions
Funding
Institutional Review Board Statement
Informed Consent Statement
Data Availability Statement
Acknowledgments
Conflicts of Interest
Abbreviations
| AI | Artificial Intelligence |
| GAN | Generative Adversarial Network |
| ResNet | Residual Neuronal Network |
References
- Flament, F.; Jacquet, L.; Ye, C.; Amar, D.; Kerob, D.; Jiang, R.; Zhang, Y.; Kroely, C.; Delaunay, C.; Passeron, T. Artificial Intelligence analysis of over half a million European and Chinese women reveals striking differences in the facial skin ageing process. J. Eur. Acad. Dermatol. Venereol. 2022, 36, 1136–1142. [Google Scholar] [CrossRef] [PubMed]
- Krutmann, J.; Bouloc, A.; Sore, G.; Bernard, B.A.; Passeron, T. The skin aging exposome. J. Dermatol. Sci. 2017, 85, 152–161. [Google Scholar] [CrossRef] [PubMed]
- Gilchrest, B.A. Skin aging and photoaging: An overview. J. Am. Acad. Dermatol. 1989, 21, 610–613. [Google Scholar] [CrossRef] [PubMed]
- Levakov, A.; Vuckovic, N.; Doali, M.; Mocko-Kacanski, M.; Bozanic, S. Age-related skin changes. Med. Pregl. 2012, 65, 191–195. [Google Scholar] [CrossRef] [PubMed]
- Battie, C.; Jitsukawa, S.; Bernerd, F.; Del Bino, S.; Marionnet, C.; Verschoore, M. New insights in photoaging: UVA-induced damage and skin types. Exp. Dermatol. 2014, 23, 7–12. [Google Scholar] [CrossRef] [PubMed]
- Akiba, S.; Shinkura, R.; Miyamoto, K.; Hillebrand, G.; Yamaguchi, N.; Ichihashi, M. Influence of chronic UV exposure and lifestyle on facial skin photoaging—Results from a pilot study. J. Epidemiol. 1999, 9, S136–S142. [Google Scholar] [CrossRef] [PubMed]
- Zhao, P.; Zhu, X.; Liu, Y.; Wang, B.; Wang, C.; Burns, F.J. Solar ultraviolet radiation and skin damage: An epidemiological study among a Chinese population. Arch. Environ. Health 1998, 53, 405–409. [Google Scholar] [CrossRef] [PubMed]
- Eun, H.C. Cutaneous photodamage in Asians. J. Dermatol. 2001, 28, 614–620. [Google Scholar] [CrossRef] [PubMed]
- Chung, J.H. Photoaging in Asians. Photodermatol. Photoimmunol. Photomed. 2003, 19, 109–121. [Google Scholar] [CrossRef] [PubMed]
- Takahashi, Y.; Fukushima, Y.; Kondo, K.; Ichihashi, M. Facial skin photoaging and development of hyperpigmented spots from children to middle-aged Japanese women. Skin Res. Technol. 2017, 23, 613–618. [Google Scholar] [CrossRef] [PubMed]
- Randhawa, M.; Wang, S.; Leyden, J.J.; Cula, G.O.; Pagnoni, A.; Southall, M.D. Daily use of a facial broad-spectrum sunscreen over one year significantly improves clinical evaluation of photoaging. Dermatol. Surg. 2016, 42, 1354–1361. [Google Scholar] [CrossRef] [PubMed]
- Bernerd, F.; Passeron, T.; Castiel, I.; Marionnet, C. The damaging effects of long UVA (UVA1) rays: A major challenge to preserve skin health and integrity. Int. J. Mol. Sci. 2022, 23, 8243. [Google Scholar] [CrossRef] [PubMed]
- Bazin, R.; Doublet, E. Skin Aging Atlas. Volume 1, Caucasian Type; Editions Med’Com: Paris, France, 2007. [Google Scholar]
- Bazin, R.; Flament, F. Skin Aging Atlas. Volume 2, Asian Type; Editions Med’Com: Paris, France, 2010. [Google Scholar]
- Bazin, R.; Flament, F.; Giron, F. Skin Aging Atlas. Volume 3, Afro-American Type; Editions Med’Com: Paris, France, 2012. [Google Scholar]
- Flament, F.; Saint-Leger, D. Photoaging’s portrait: The road map towards its photoprotection. Int. J. Cosmet. Sci. 2023, 45, 33–44. [Google Scholar] [CrossRef] [PubMed]
- Flament, F.; Qiu, H.; Abric, A.; Charbonneau, A. Assessing changes in some facial signs of fatigue in Chinese women, induced by a single working day. Int. J. Cosmet. Sci. 2019, 41, 21–27. [Google Scholar] [CrossRef] [PubMed]
- He, K.; Zhang, X.; Ren, S.; Sun, J. Deep residual learning for image recognition. In Proceedings of the IEEE Conference on Computer Vision and Pattern Recognition, Las Vegas, NV, USA, 27–30 June 2016; pp. 770–778. [Google Scholar]
- Despois, J.; Flament, F.; Perrot, M. AgingMapGAN (AMGAN): High-resolution controllable face aging with spatially-aware conditional GANs. In Proceedings of the European Conference on Computer Vision (ECCV), Glasgow, UK, 23–28 August 2020. [Google Scholar]
- Choi, Y.; Uh, Y.; Yoo, J.; Ha, J.-W. StarGAN v2: Diverse image synthesis for multiple domains. In Proceedings of the 2020 IEEE/CVF Conference on Computer Vision and Pattern Recognition (CVPR), Seattle, WA, USA, 14–19 June 2020; pp. 8185–8194. [Google Scholar]
- Nouveau-Richard, S.; Yang, Z.; Mac-Mary, S.; Li, L.; Bastien, P.; Tardy, I.; Bouillon, C.; Humbert, P.; De Lacharrière, O. Skin ageing: A comparison between Chinese and European populations—A pilot study. J. Dermatol. Sci. 2005, 40, 187–193. [Google Scholar] [CrossRef] [PubMed]
- Stacy, H.R. The Representation of Feminine Beauty in Generative Artificial Intelligence Models. Ph.D. Thesis, Murray State University, Murray, KY, USA, 2025. [Google Scholar]
- Islam, U.; Mehmood, G.; Al-Atawi, A.A.; Khan, F.; Alwageed, H.S.; Cascone, L. NeuroHealth Guardian: A Novel Hybrid Approach for Precision Brain Stroke Prediction and Healthcare Analytics. J. Neurosci. Methods 2024, 409, 110210. [Google Scholar] [CrossRef] [PubMed]
- Osama, M.; Khan, S.S.; Khan, S.; Ahmad, S.; Mehmood, G.; Ali, I. High-Quality Multi-Focus Image Fusion: A Comparative Analysis of DCT-Based Approaches with Their Variants. IECE J. Image Anal. Process. 2025, 1, 27–35. [Google Scholar]
- Passeron, T.; Krutmann, J.; Andersen, M.L.; Katta, R.; Zouboulis, C.C. Clinical and biological impact of the exposome on the skin. J. Eur. Acad. Dermatol. Venereol. 2020, 34 (Suppl. S4), 4–25. [Google Scholar] [CrossRef] [PubMed]
- Krutmann, J.; Schalka, S.; Watson, R.E.B.; Wei, L.; Morita, A. Daily photoprotection to prevent photoaging. Photodermatol. Photoimmunol. Photomed. 2021, 37, 482–489. [Google Scholar] [CrossRef] [PubMed]
- Hughes, M.C.; Williams, G.M.; Baker, P.; Green, A.C. Sunscreen and prevention of skin aging: A randomized trial. Ann. Intern. Med. 2013, 158, 781–790. [Google Scholar] [CrossRef] [PubMed]

| Clinical Clusters | Facial Signs | Definition of Scored Observation | Scale | Visual |
|---|---|---|---|---|
| Wrinkles/Texture | Forehead wrinkles | Depth of the transverse wrinkles on the forehead. | 0–8 |  |
| Wrinkles/Texture | Glabellar wrinkles | Depth of vertical wrinkles between eyebrows. | 0–6 | 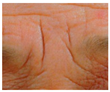 |
| Wrinkles/Texture | Inter-ocular wrinkles | Depth of horizontal folds between inner eye corners. | 0–7 | 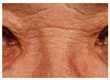 |
| Wrinkles/Texture | Periorbital wrinkles | Depth of folds at malar area below crow’s feet, eye orbit excepted. | 0–9 |  |
| Wrinkles/Texture | Nasolabial fold | Depth of the fold present between the base of the nose and lips. | 0–7 |  |
| Pigmentation signs | Density of pigmentary spots | Number of spots per area unit on the cheek. | 0–7 | 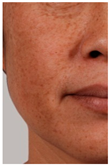 |
| Vascular signs | Diffused redness | Diffused redness and micro-vessels visible, especially on cheeks. | 0–4 |  |
| Firmness/Sagging | Ptosis of lower part of the face | Sagging severity of the lower parts of the chin. | 0–6 |  |
| Clinical Clusters | Facial Signs | Definition of Scored Observation | Scale | Visual |
|---|---|---|---|---|
| Wrinkles/Texture | Glabellar wrinkles | Depth of vertical wrinkles between both eyebrows. | 0–5 |  |
| Wrinkles/Texture | Periorbital wrinkles (upper cheek area) | Depth of folds found at the malar zone below crow’s feet, eye orbit except. | 0–5 |  |
| Wrinkles/Texture | Nasolabial fold | Depth of the deepest fold present on the face between base of the nose and lips. | 0–5 | 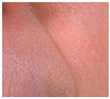 |
| Wrinkles/Texture | Marionette lines | Depth of the deepest fold at the corner of lips. | 0–6 | 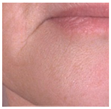 |
| Pigmentation Signs | Whole-face pigmentation | Density of pigmentation disorders on all the face. | 0–5 | 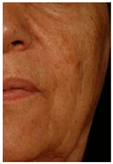 |
| Vascular Signs | Vascular disorders | All diffused redness and dilation of blood micro-vessels visible on the face. | 0–7 | 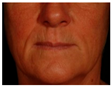 |
| Firmness/Sagging | Ptosis of the lower part of the face | Sagging severity of the lower part of the face on each side of the chin. | 0–5 |  |
| Average Aging | Δ T10-T0 (35–39 y) | Δ T15-T0 (35–39 y) | Δ T10-T0 (40–44 y) | Δ T15-T0 (40–44 y) | Δ T10-T0 (45–49 y) | Δ T15-T0 (45–49 y) |
|---|---|---|---|---|---|---|
| Nb Vol | 10 | 10 | 9 | 9 | 6 | 6 |
| Forehead wrinkles scored | 0.65 | 1.32 | 0.86 | 1.41 | 0.8 | 1.08 |
| Forehead wrinkles known | 0.85 | 1.45 | 0.90 | 1.35 | 1.05 | 1.50 |
| p-values | 0.09 | 0.33 | 0.81 | 0.78 | 0.16 | 0.09 |
| Glabellar wrinkles scored | 0.43 | 0.81 | 0.39 | 0.69 | 0.52 | 0.89 |
| Glabellar wrinkles known | 0.38 | 0.68 | 0.40 | 0.65 | 0.55 | 0.80 |
| p-value | 0.63 | 0.14 | 0.89 | 0.54 | 0.67 | 0.45 |
| Inter-ocular wrinkles scored | 0.57 | 1.05 | 0.74 | 1.39 | 1.28 | 1.64 |
| Inter-ocular wrinkles known | 0.61 | 1.11 | 0.70 | 1.30 | 1.10 | 1.70 |
| p-value | 0.79 | 0.76 | 0.67 | 0.43 | 0.15 | 0.43 |
| Nasolabial fold scored | 0.18 | 0.59 | 0.72 | 1.08 | 0.56 | 0.81 |
| Nasolabial fold known | 0.32 | 0.62 | 0.55 | 0.95 | 0.70 | 1.10 |
| p-value | 0.15 | 0.89 | 0.19 | 0.42 | 0.13 | 0.02 |
| Periorbital wrinkles scored | 0.32 | 0.96 | 0.87 | 0.85 | 0.92 | 1.10 |
| Periorbital wrinkles known | 0.30 | 0.60 | 0.59 | 0.93 | 0.64 | 0.98 |
| p-value | 0.81 | 0.06 | 0.02 | 0.71 | 0.33 | 0.56 |
| Density of spots scored | 0.20 | 0.32 | 0.39 | 0.80 | 0.62 | 0.58 |
| Density of spots known | 0.11 | 0.29 | 0.28 | 0.58 | 0.48 | 0.78 |
| p-value | 0.26 | 0.79 | 0.14 | 0.07 | 0.03 | 0.05 |
| Diffused redness scored | 0.29 | 0.45 | 0.27 | 0.43 | 0.35 | 0.36 |
| Diffused redness known | 0.41 | 0.67 | 0.28 | 0.46 | 0.44 | 0.62 |
| p-value | 0.19 | 0.02 | 0.90 | 0.81 | 0.24 | <0.00 |
| Ptosis scored | 0.06 | 0.23 | 0.08 | 0.18 | 0.04 | 0.31 |
| Ptosis known | 0.35 | 0.6 | 0.34 | 0.42 | 0.33 | 0.41 |
| p-value | <0.00 | <0.00 | <0.00 | <0.01 | <0.00 | 0.38 |
| Average Aging | Δ T10-T0 (35–39 y) | Δ T15-T0 (35–39 y) | Δ T10-T0 (40–44 y) | Δ T15-T0 (40–44 y) | Δ T10-T0 (45–49 y) | Δ T15-T0 (45–49 y) |
|---|---|---|---|---|---|---|
| Nb Vol | 9 | 9 | 9 | 9 | 7 | 7 |
| Glabellar wrinkles scored | 0.55 | 0.6 | 0.38 | 0.42 | 0.12 | 0.31 |
| Glabellar wrinkles known | 0.60 | 0.70 | 0.40 | 0.50 | 0.20 | 0.30 |
| p-value | 0.64 | 0.34 | 0.76 | 0.25 | 0.15 | 0.92 |
| Nasolabial fold scored | 0.56 | 0.56 | 0.31 | 0.36 | 0.27 | 0.40 |
| Nasolabial fold known | 0.40 | 0.70 | 0.50 | 0.60 | 0.40 | 0.50 |
| p-value | 0.13 | 0.30 | <0.01 | <0.01 | 0.19 | 0.55 |
| Periorbital wrinkles scored | 0.55 | 0.75 | 0.41 | 0.71 | 0.93 | 1.12 |
| Periorbital wrinkles known | 0.50 | 0.80 | 0.50 | 0.90 | 0.70 | 1.10 |
| p-value | 0.55 | 0.66 | 0.51 | 0.21 | 0.10 | 0.86 |
| Marionette lines scored | 0.60 | 1.15 | 0.37 | 0.85 | 0.60 | 0.65 |
| Marionette lines known | 0.50 | 0.70 | 0.40 | 0.70 | 0.50 | 0.80 |
| p-value | 0.51 | 0.01 | 0.73 | 0.04 | 0.54 | 0.38 |
| Whole-face pigmentation scored | 0.57 | 0.64 | 0.53 | 0.48 | 0.20 | 0.26 |
| Whole-face pigmentation known | 0.40 | 0.50 | 0.30 | 0.40 | 0.20 | 0.30 |
| p-value | 0.24 | 0.35 | 0.16 | 0.44 | 0.99 | 0.75 |
| Vascular disorders scored | 0.21 | 0.25 | 0.20 | 0.24 | 0.10 | 0.21 |
| Vascular disorders known | 0.30 | 0.40 | 0.20 | 0.30 | 0.20 | 0.30 |
| p-value | 0.11 | 0.04 | 0.99 | 0.43 | 0.21 | 0.40 |
| Ptosis scored | 0.08 | 0.29 | 0.26 | 0.36 | 0.31 | 0.43 |
| Ptosis known | 0.40 | 0.80 | 0.60 | 0.90 | 0.70 | 1.00 |
| p-value | <0.00 | <0.00 | <0.00 | <0.00 | <0.01 | <0.01 |
| Country | France | China | Thailand | |||
|---|---|---|---|---|---|---|
| Number of records | n = 81 | n = 80 | n = 85 | |||
| Simulation | +10 y | +15 y | +10 y | +15 y | +10 y | +15 y |
| Realism (% answers 4 + 5) | 66% | 64% | 72% | 78% | 64% | 68% |
| Liking (% answers 4 + 5) | 64% | 62% | 75% | 78% | 67% | 65% |
| Test on myself (% yes for both timings) | 85% | 96% | 53% | |||
| Questions/Panels | Chinese | French | Thai |
|---|---|---|---|
| Nothing disturbs me | 20% | 20% | 16% |
| Wrinkles are not increased enough | 30% | 27% | 46% |
| Wrinkles are not homogeneous on the whole face | 29% | 25% | 41% |
| Pigmentary spots are not increased enough | 31% | 9% | 38% |
| The result is not natural | 6% | 12% | 38% |
| The result is scary | 14% | 4% | 9% |
| The sagging of the skin is not increased enough | 53% | 37% | 47% |
| Changes in skin texture are not noticeable enough | 31% | 36% | 39% |
| Changes in eye contour are not noticeable enough | 33% | 22% | 19% |
| Hair color is unchanged | 19% | 22% | 26% |
Disclaimer/Publisher’s Note: The statements, opinions and data contained in all publications are solely those of the individual author(s) and contributor(s) and not of MDPI and/or the editor(s). MDPI and/or the editor(s) disclaim responsibility for any injury to people or property resulting from any ideas, methods, instructions or products referred to in the content. |
© 2025 by the authors. Licensee MDPI, Basel, Switzerland. This article is an open access article distributed under the terms and conditions of the Creative Commons Attribution (CC BY) license (https://creativecommons.org/licenses/by/4.0/).
Share and Cite
Flament, F.; Bokaris, P.-A.; Despois, J.; Woodland, F.; Chretien, A.; Tartrat, P.; Balooch, G. Ethnic Differences in Women’s Perception of Simulated Facial Aging over a 15-Year Horizon: A GAN-Based Model Approach. Cosmetics 2025, 12, 154. https://doi.org/10.3390/cosmetics12040154
Flament F, Bokaris P-A, Despois J, Woodland F, Chretien A, Tartrat P, Balooch G. Ethnic Differences in Women’s Perception of Simulated Facial Aging over a 15-Year Horizon: A GAN-Based Model Approach. Cosmetics. 2025; 12(4):154. https://doi.org/10.3390/cosmetics12040154
Chicago/Turabian StyleFlament, Frederic, Panagiotis-Alexandros Bokaris, Julien Despois, Frederic Woodland, Adrien Chretien, Paul Tartrat, and Guive Balooch. 2025. "Ethnic Differences in Women’s Perception of Simulated Facial Aging over a 15-Year Horizon: A GAN-Based Model Approach" Cosmetics 12, no. 4: 154. https://doi.org/10.3390/cosmetics12040154
APA StyleFlament, F., Bokaris, P.-A., Despois, J., Woodland, F., Chretien, A., Tartrat, P., & Balooch, G. (2025). Ethnic Differences in Women’s Perception of Simulated Facial Aging over a 15-Year Horizon: A GAN-Based Model Approach. Cosmetics, 12(4), 154. https://doi.org/10.3390/cosmetics12040154